Embed Size (px)
Citation preview
1
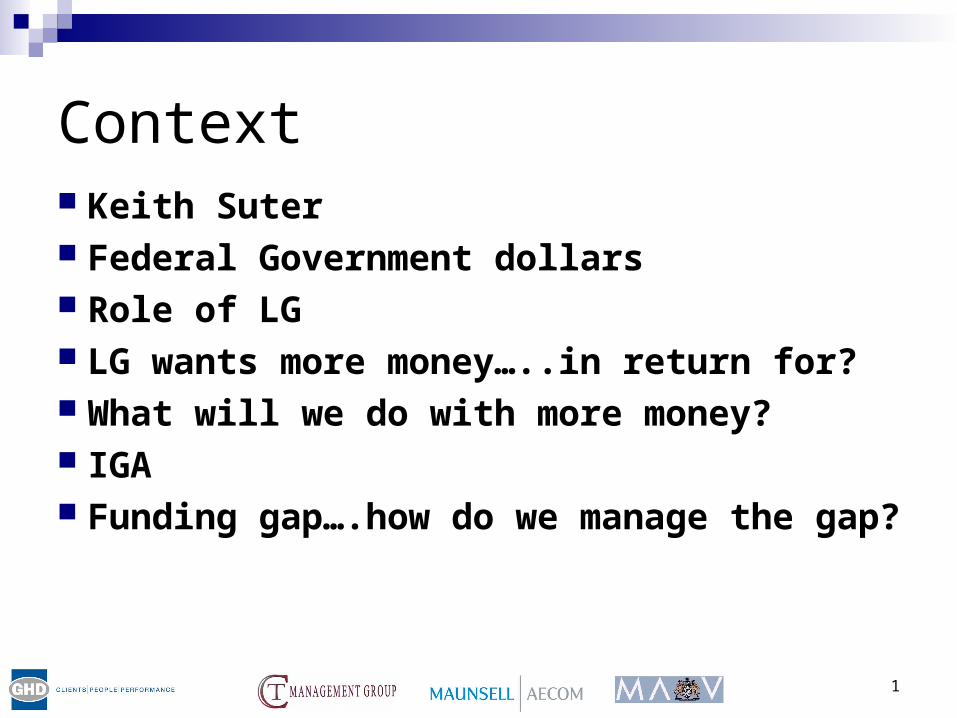
Context Keith Suter Federal Government dollars Role of LG LG wants more money…..in return for? What will we do with more money? IGA Funding gap….how do we manage the gap?
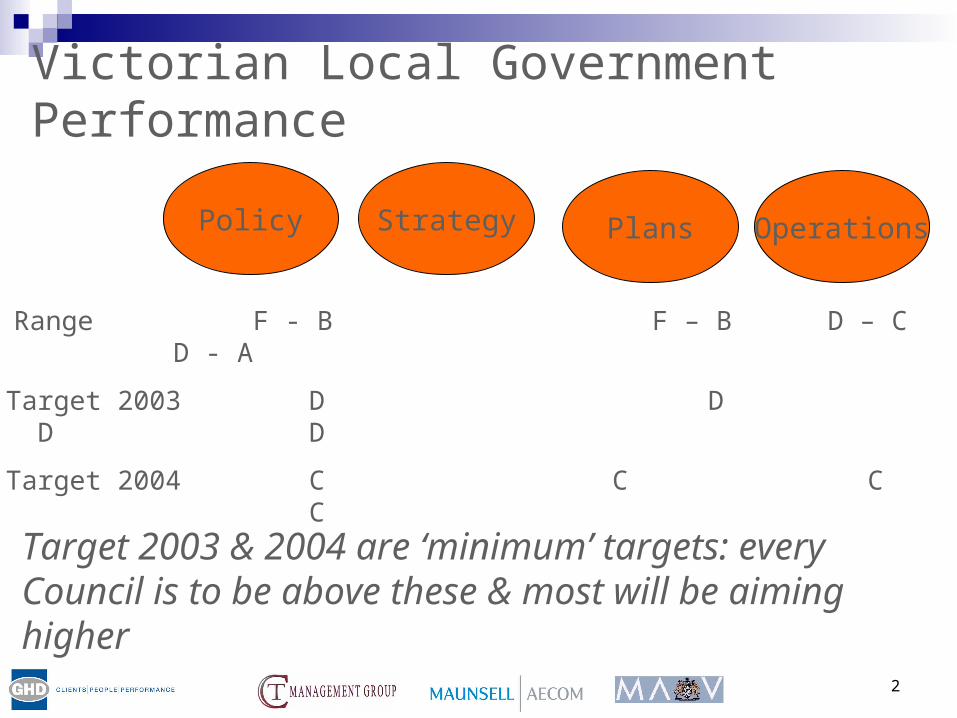
2
Policy Strategy Plans Operations
Range F - B F – B D – C D - A
Target 2003 D D D D
Target 2004 C C C C
Victorian Local Government Performance
Target 2003 & 2004 are ‘minimum’ targets: every Council is to be above these & most will be aiming higher

3
MAV Renewal Gap Program – Key Objectives
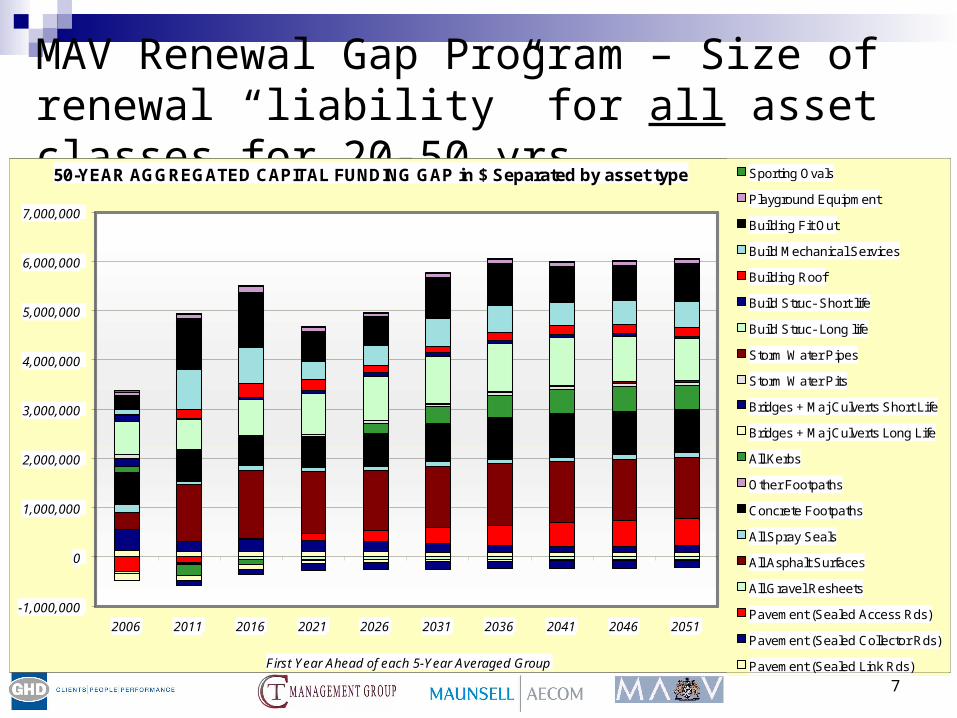
Size of renewal “liability” for all asset classes for 20-50
yrs
Under & over funding by asset class
Growth & decline of gap by class
% asset class outside desired intervention – service
sustainability
What to do about it? Management options

4
MAV Renewal Gap Program – Key Objectives
Assist aligning financials and asset management; is
your current depreciation funding adequate?
Develop Asset Management plans for all asset
classes
Demonstrate to stakeholders LG capability re AM
LG becomes source of knowledge for LG AM
5
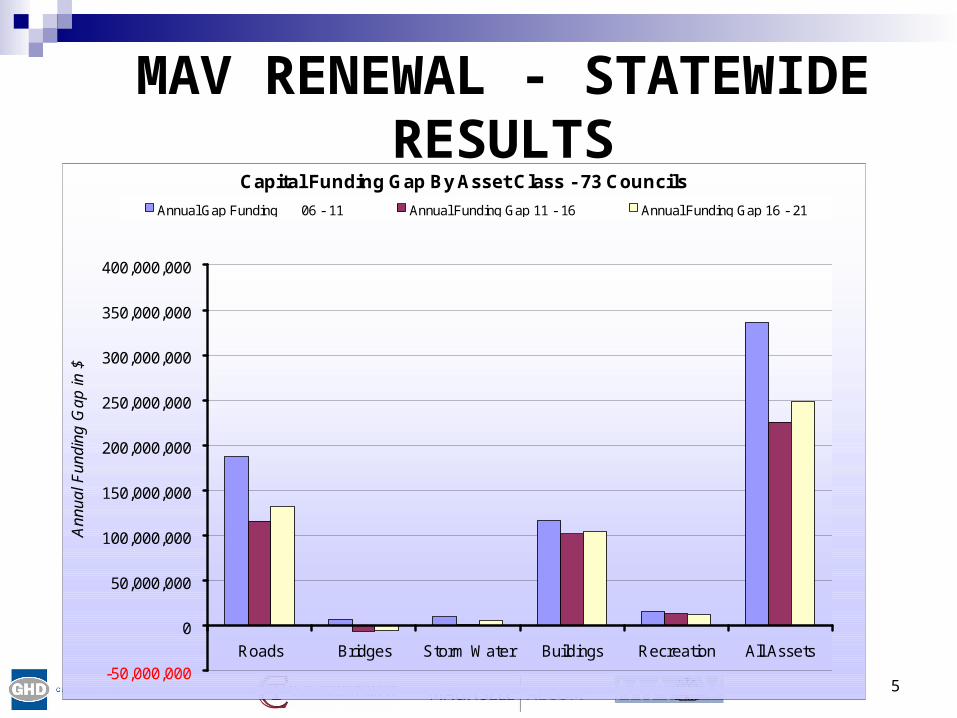
MAV RENEWAL - STATEWIDE RESULTS
Capital Funding Gap By Asset Class - 73 Councils
-50,000,000
0
50,000,000
100,000,000
150,000,000
200,000,000
250,000,000
300,000,000
350,000,000
400,000,000
Roads Bridges Storm Water Buildings Recreation All Assets
Ann
ual F
undi
ng G
ap in
$
Annual Gap Funding 06 - 11 Annual Funding Gap 11 - 16 Annual Funding Gap 16 - 21
6
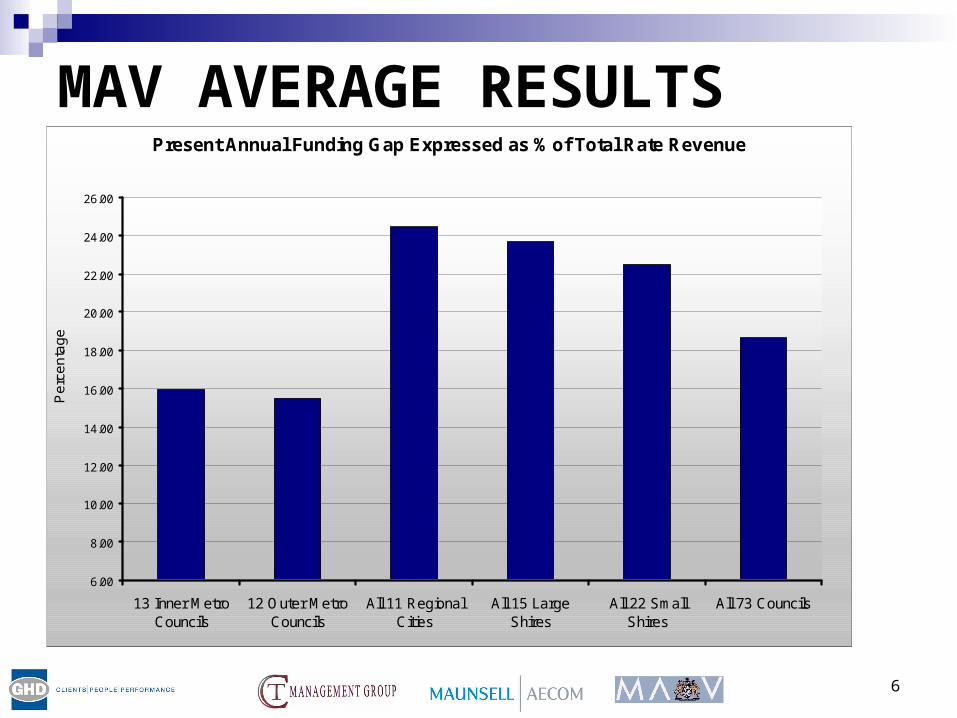
MAV AVERAGE RESULTSPresent Annual Funding Gap Expressed as % of Total Rate Revenue
6.00
8.00
10.00
12.00
14.00
16.00
18.00
20.00
22.00
24.00
26.00
13 Inner MetroCouncils
12 Outer MetroCouncils
All 11 RegionalCities
All 15 LargeShires
All 22 SmallShires
All 73 Councils
Pe
rce
nta
ge
7
MAV Renewal Gap Program – Size of renewal “liability” for all asset classes for 20-50 yrs
50-YEAR AGGREGATED CAPITAL FUNDING GAP in $ Separated by asset type
-1,000,000
0
1,000,000
2,000,000
3,000,000
4,000,000
5,000,000
6,000,000
7,000,000
2006 2011 2016 2021 2026 2031 2036 2041 2046 2051
First Year Ahead of each 5-Year Averaged Group
Sporting Ovals
Playground Equipment
Building Fit Out
Build Mechanical Services
Building Roof
Build Struc- Short life
Build Struc- Long life
Storm Water Pipes
Storm Water Pits
Bridges + Maj Culverts Short Life
Bridges + Maj Culverts Long Life
All Kerbs
Other Footpaths
Concrete Footpaths
All Spray Seals
All Asphalt Surfaces
All Gravel Resheets
Pavement (Sealed Access Rds)
Pavement (Sealed Collector Rds)
Pavement (Sealed Link Rds)
8
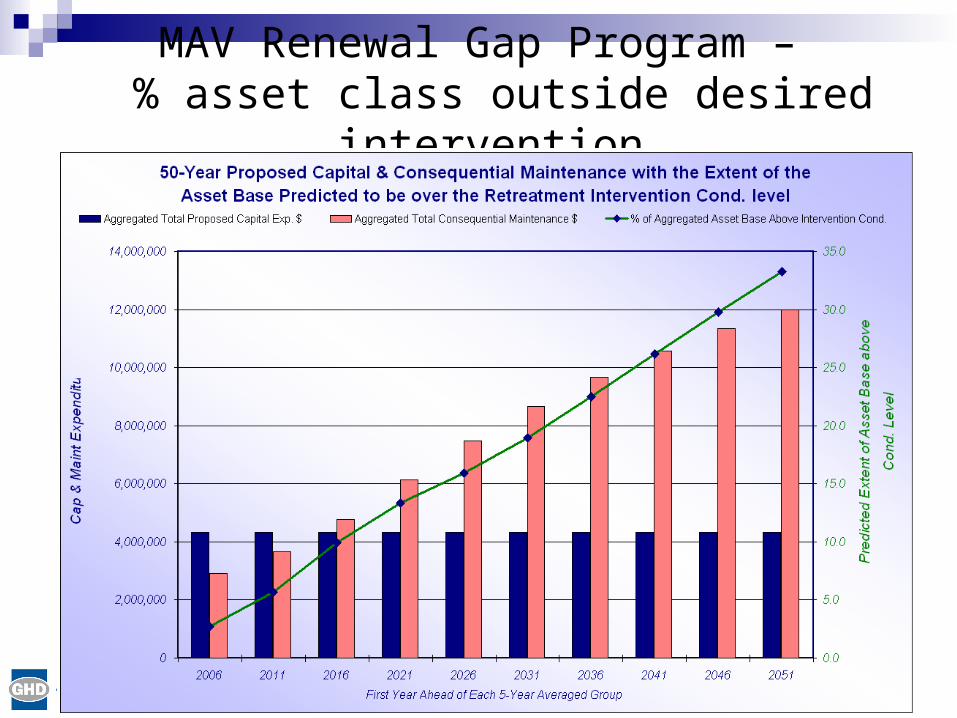
MAV Renewal Gap Program – % asset class outside desired intervention
9
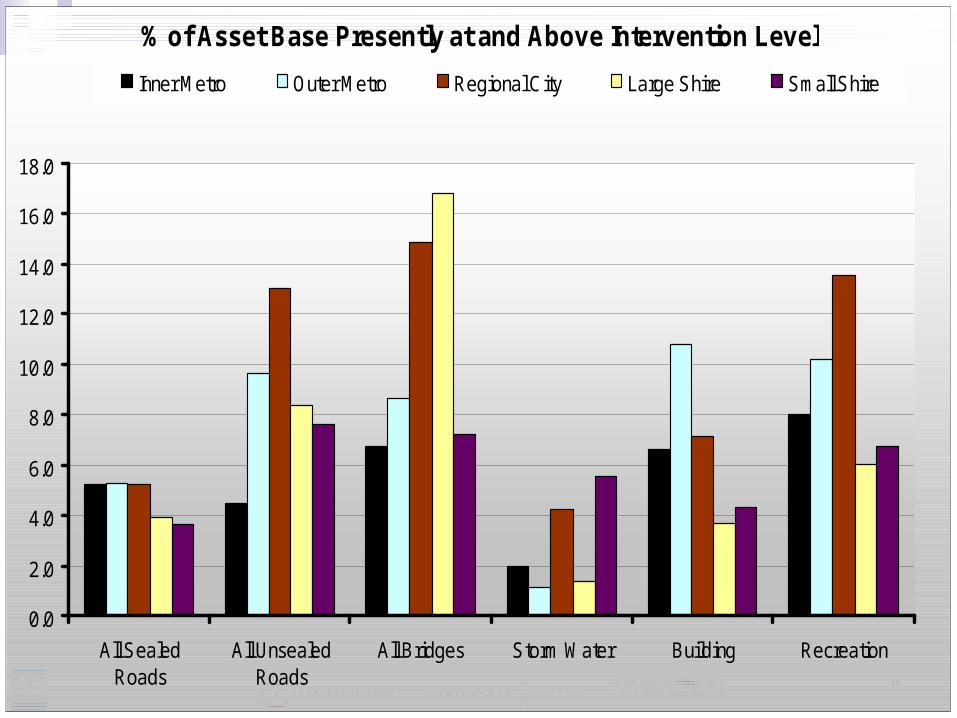
% of Asset Base Presently at and Above Intervention Level
0.0
2.0
4.0
6.0
8.0
10.0
12.0
14.0
16.0
18.0
All SealedRoads
All UnsealedRoads
All Bridges Storm Water Building Recreation
Inner Metro Outer Metro Regional City Large Shire Small Shire

10
% of Asset Base at and above Intervention Level All 73 Councils
0.00
10.00
20.00
30.00
40.00
50.00
60.00
70.00
Build Struc-Long life
Build Struc-Short life
Building Roof BuildM echanical
Services
Building FitOut
PlaygroundEquipment
Sporting Ovals
% of
Ass
et Ba
se P
rese
ntly A
bove
Inter
venti
on
Highest Value Mean + 1 St Dev (Suggested Upper Limit)
Mean Mean - 1 St Dev (Suggested Lower Limit)
Lowest Value
11
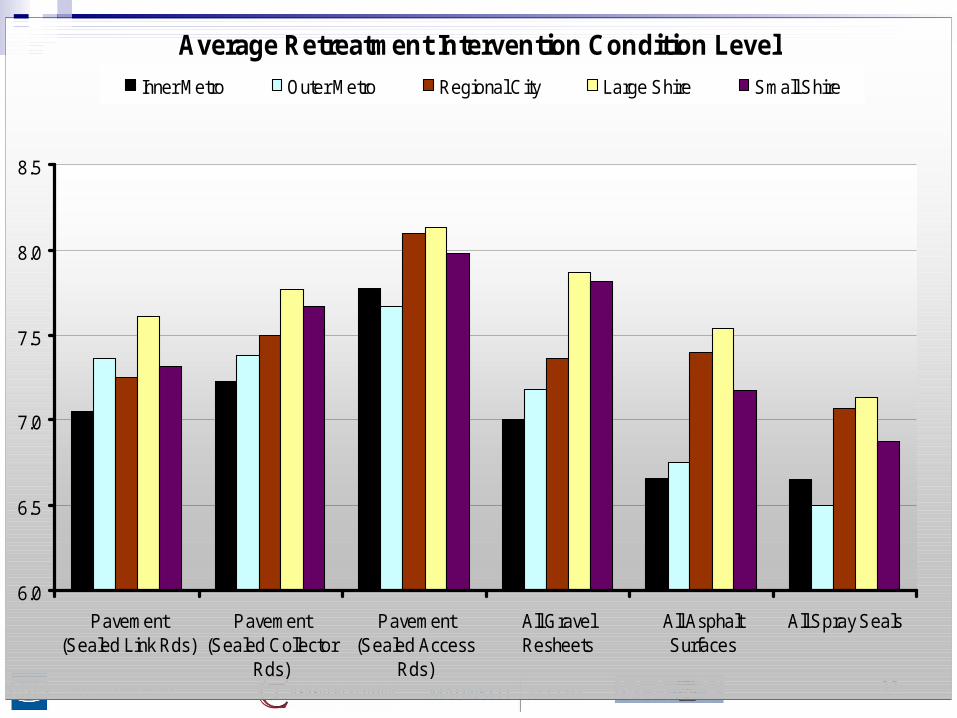
Average Retreatment Intervention Condition Level
6.0
6.5
7.0
7.5
8.0
8.5
Pavement(Sealed Link Rds)
Pavement(Sealed Collector
Rds)
Pavement(Sealed Access
Rds)
All GravelResheets
All AsphaltSurfaces
All Spray Seals
Inner Metro Outer Metro Regional City Large Shire Small Shire
12
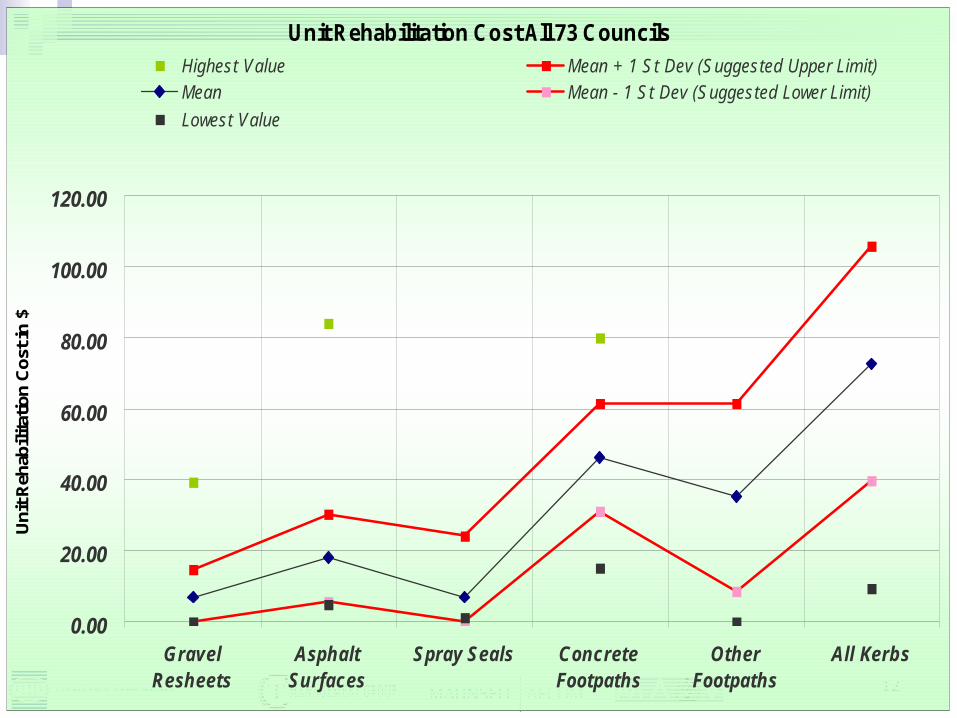
Unit Rehabilitation Cost All 73 Councils
0.00
20.00
40.00
60.00
80.00
100.00
120.00
GravelResheets
AsphaltSurfaces
Spray Seals ConcreteFootpaths
OtherFootpaths
All Kerbs
Uni
t Reh
abili
tatio
n C
ost i
n $
Highest Value Mean + 1 St Dev (Suggested Upper Limit)Mean Mean - 1 St Dev (Suggested Lower Limit)
Lowest Value

13
Present Annual Funding Gap Expresses as % of Asset Group Replacement Value
-1.00
0.00
1.00
2.00
3.00
4.00
5.00
6.00
Roads Bridges Storm Water Buildings Recreation All Assets
Per
cent
age
All 73 Councils 13 Inner Metro Councils 12 Outer Metro Councils All 11 Regional Cities All 15 Large Shires All 22 Small Shires
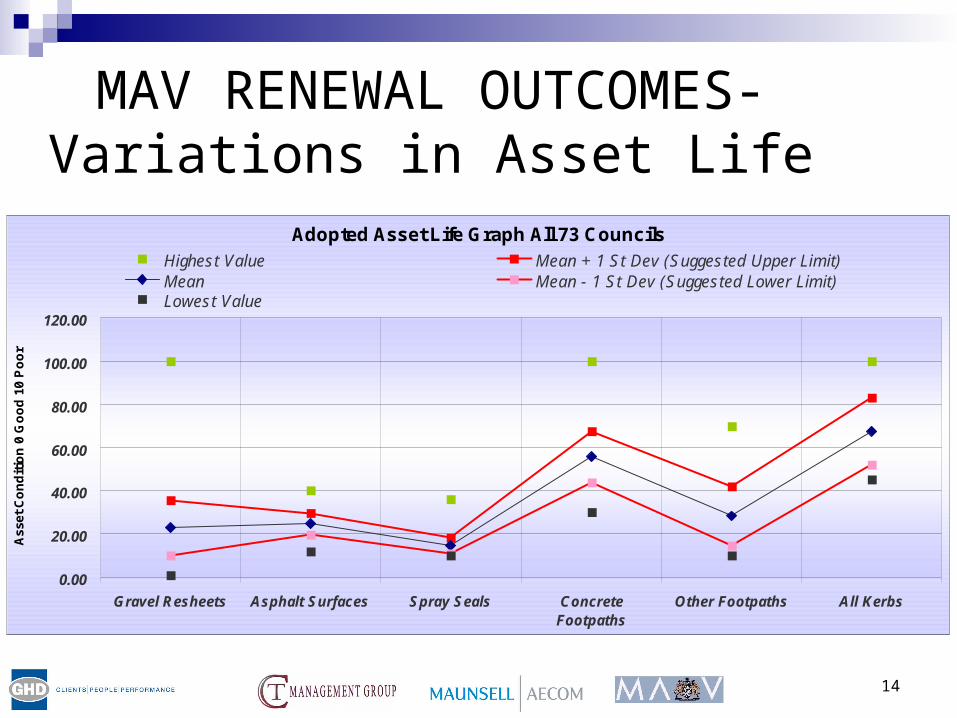
14
MAV RENEWAL OUTCOMES-Variations in Asset Life
Adopted Asset Life Graph All 73 Councils
0.00
20.00
40.00
60.00
80.00
100.00
120.00
Gravel Resheets Asphalt Surfaces Spray Seals ConcreteFootpaths
Other Footpaths All Kerbs
Ass
et C
on
dit
ion
0 G
oo
d 1
0 P
oo
r
Highest Value Mean + 1 St Dev (Suggested Upper Limit)Mean Mean - 1 St Dev (Suggested Lower Limit)Lowest Value

15
The Advanced Step Asset Management improvement ProgramManaging Our Assets towards Sustainability in Service Delivery & meeting community expectations

16
Progressing the Step program
Stage 1(3 years)
Awareness
Stage 2(4 - 6 years)
Application
Stage 3(6+ years)
Refinement
2003 - 2006

17
Key Themes We make good quality decisions
We know who is involved in the management of the assets
We plan well for our current and future community needs
Our community drives the levels of service
We know what we own and what is needed to deliver the
required service to our community
We know and provide the level of funding for our assets to
meet the community needs
18
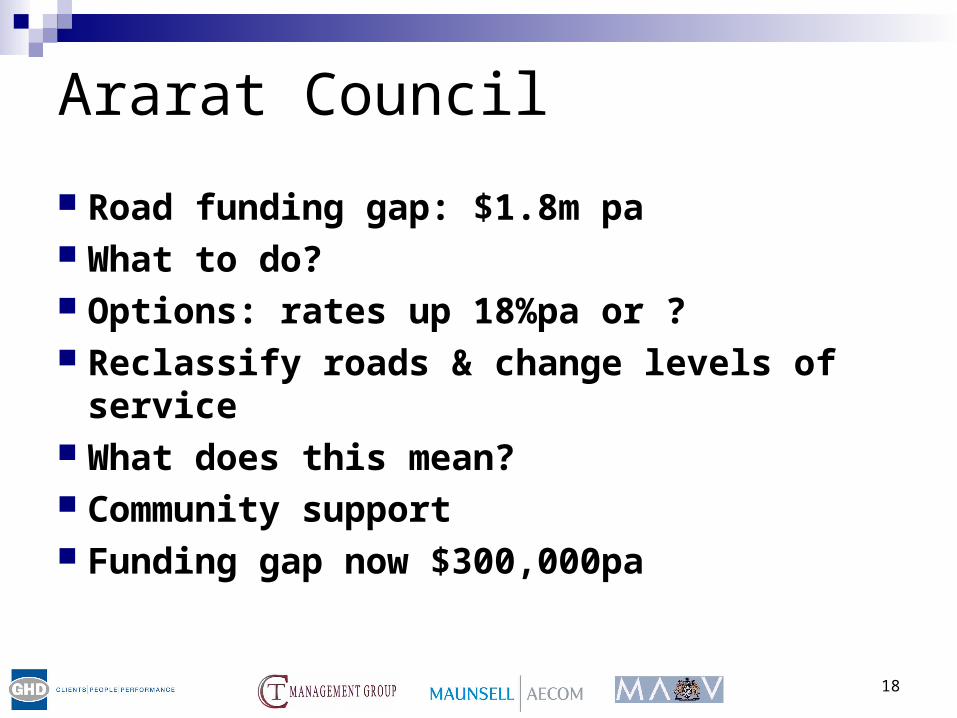
Ararat Council
Road funding gap: $1.8m pa What to do? Options: rates up 18%pa or ? Reclassify roads & change levels of service What does this mean? Community support Funding gap now $300,000pa
19
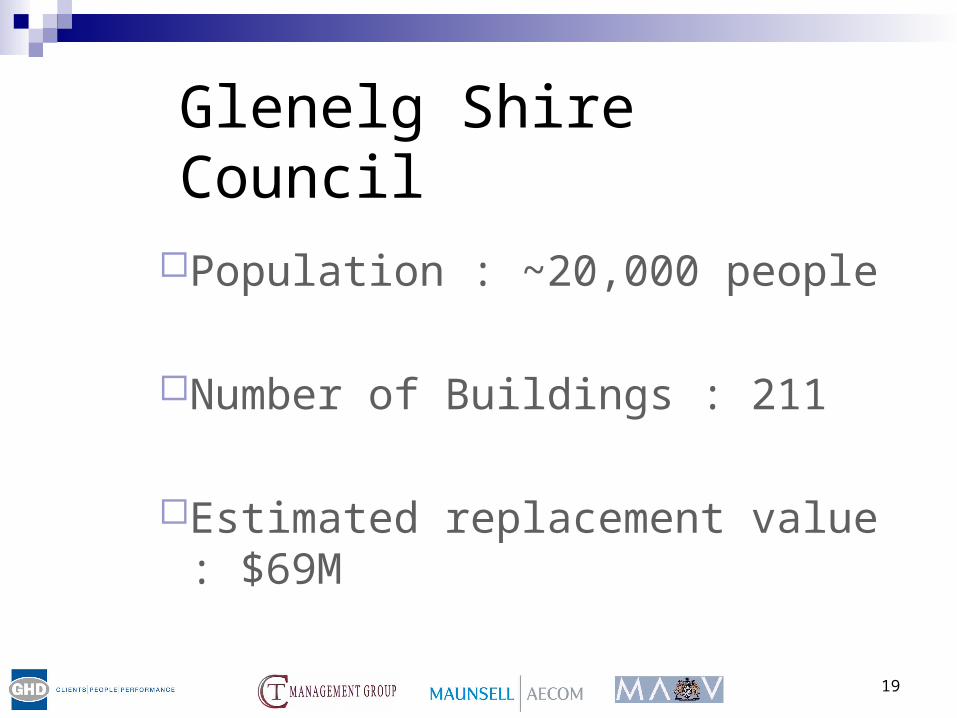
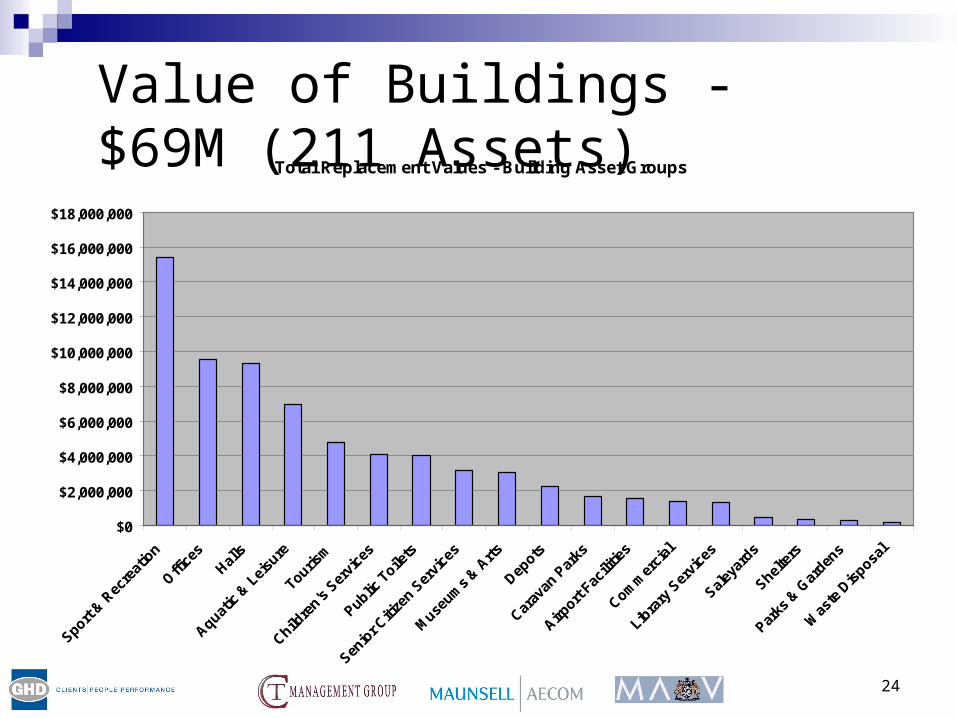
Glenelg Shire Council
Population : ~20,000 people
Number of Buildings : 211
Estimated replacement value : $69M
20
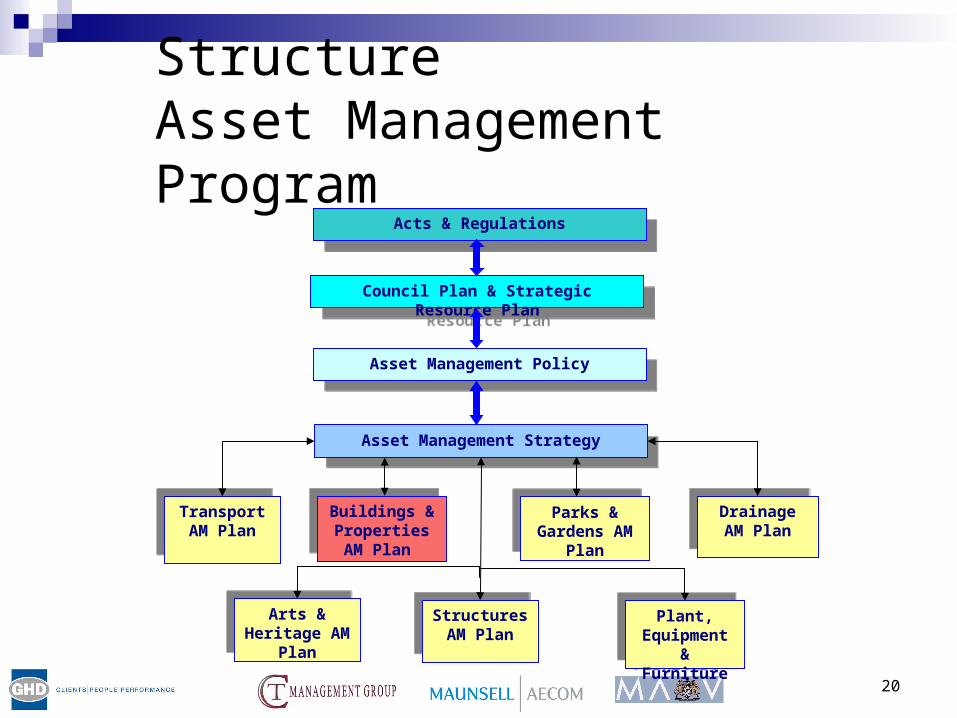
Acts & RegulationsActs & Regulations
Council Plan & Strategic Resource PlanCouncil Plan & Strategic Resource Plan
Asset Management PolicyAsset Management Policy
Asset Management StrategyAsset Management Strategy
Transport AM PlanTransport AM Plan
Buildings & Properties AM
Plan
Buildings & Properties AM
Plan
Drainage AM Plan
Drainage AM Plan
Parks & Gardens AM
Plan
Parks & Gardens AM
Plan
Plant, Equipment& Furniture
Plant, Equipment& Furniture
Arts & Heritage AM
Plan
Arts & Heritage AM
Plan
Structures AM PlanStructures AM Plan
StructureAsset Management Program
21
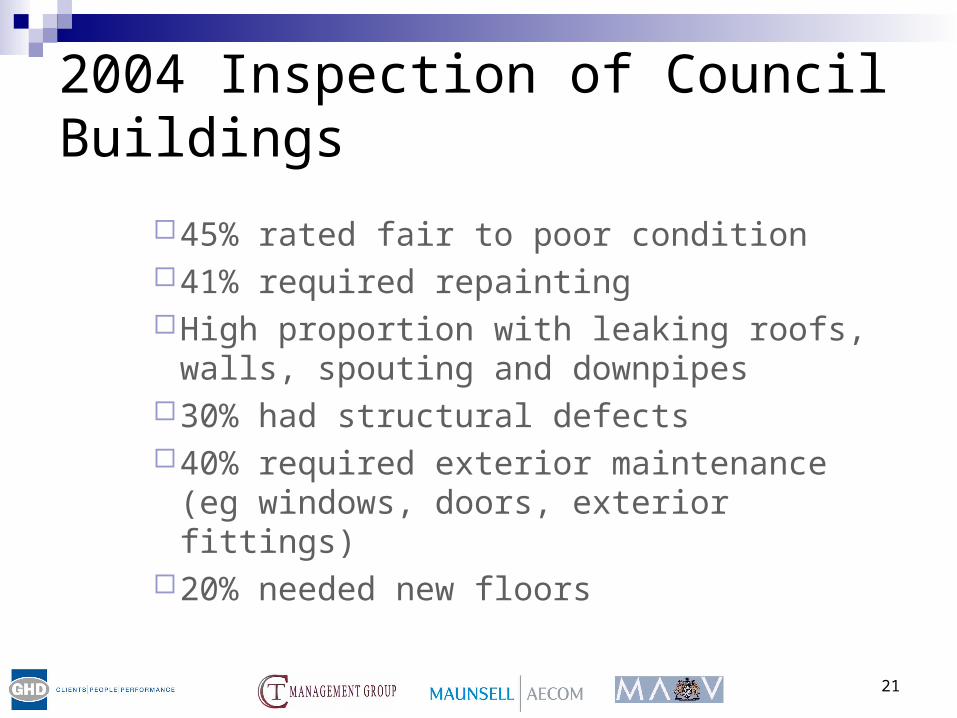
2004 Inspection of Council Buildings
45% rated fair to poor condition41% required repaintingHigh proportion with leaking roofs, walls,
spouting and downpipes30% had structural defects40% required exterior maintenance
(eg windows, doors, exterior fittings)20% needed new floors

22
Strategies (continued)
Assets that are in a poor condition and/or are unsafe will be demolished and not replaced if there is no demonstrated ongoing need.
23
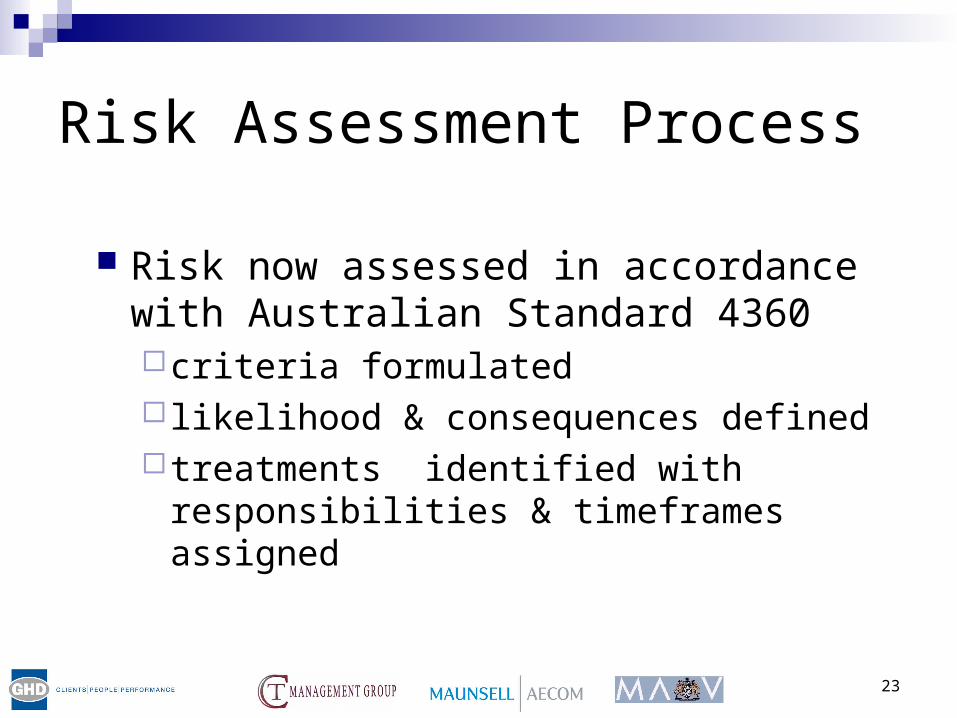
Risk Assessment Process
Risk now assessed in accordance with Australian Standard 4360 criteria formulated likelihood & consequences defined treatments identified with responsibilities
& timeframes assigned
24
Value of Buildings - $69M (211 Assets)Total Replacement Values - Building Asset Groups
$0
$2,000,000
$4,000,000
$6,000,000
$8,000,000
$10,000,000
$12,000,000
$14,000,000
$16,000,000
$18,000,000
Sport & R
ecre
atio
n
Office
sHal
ls
Aquatic
& L
eisu
re
Tourism
Childre
n's S
ervi
ces
Public T
oilets
Senio
r Citi
zen S
ervi
ces
Muse
ums
& Arts
Depots
Carav
an P
arks
Airport
Facili
ties
Comm
erci
al
Libra
ry S
ervi
ces
Saley
ards
Shelte
rs
Parks
& G
arden
s
Was
te D
isposa
l
25
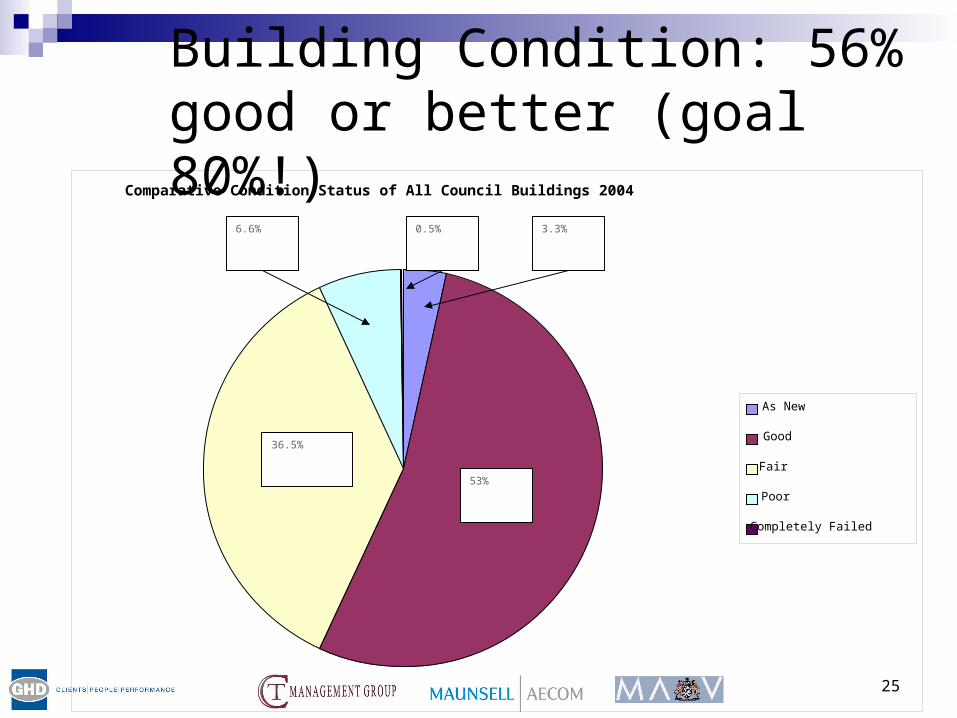
Building Condition: 56% good or better (goal 80%!)Comparative Condition Status of All Council Buildings 2004
As New
Good
Fair
Poor
Completely Failed
53%
36.5%
3.3%6.6% 0.5%

26
Total CostsTOTAL EXPENDITURE
0
250000
500000
750000
1000000
1250000
1500000
1750000
2000000
2250000
2500000
2005
-06
2006
-07
2007
-08
2008
-09
2009
-10
2010
-11
2011
-12
2012
-13
2013
-14
2014
-15
2015
-16
2016
-17
2017
-18
2018
-19
2019
-20
2020
-21
2021
-22
2022
-23
2023
-24
2024
-25
TOTAL EXPENDITURE

27
Summary of Recommended Outcomes
20 transferred to sport and recreation clubs 3 transferred to State Government 5 demolished 14 put on a long term commercial lease to transfer
responsibility to the lessee 7 to be sold 16 core assets with low usage be reviewed to
establish if usage can be improved Net result 50 assets removed from the register
and avoidance of at least $2M in additional costs over 20 years

28
Benefits of Building AM Plan
Informed decision making Develop customer service culture Focus on core business Better financial planning Better risk management Process and structural improvements Appearance & community pride