Embed Size (px)
Citation preview
1
CNRS GDR laquo Feux raquo ndash Corte6th to 8th June 2007
Polyurethane Foam Pyrolysis and Combustion in Cone Calorimeter ndash Analysis of released
heat and gases
Lucas BUSTAMANTE VALENCIA
Directors
Eric GUILLAUME LNE division Comportement au Feu
Thomas ROGAUME Laboratoire de Combustion et de Deacutetonique UPR 9028 CNRS
2
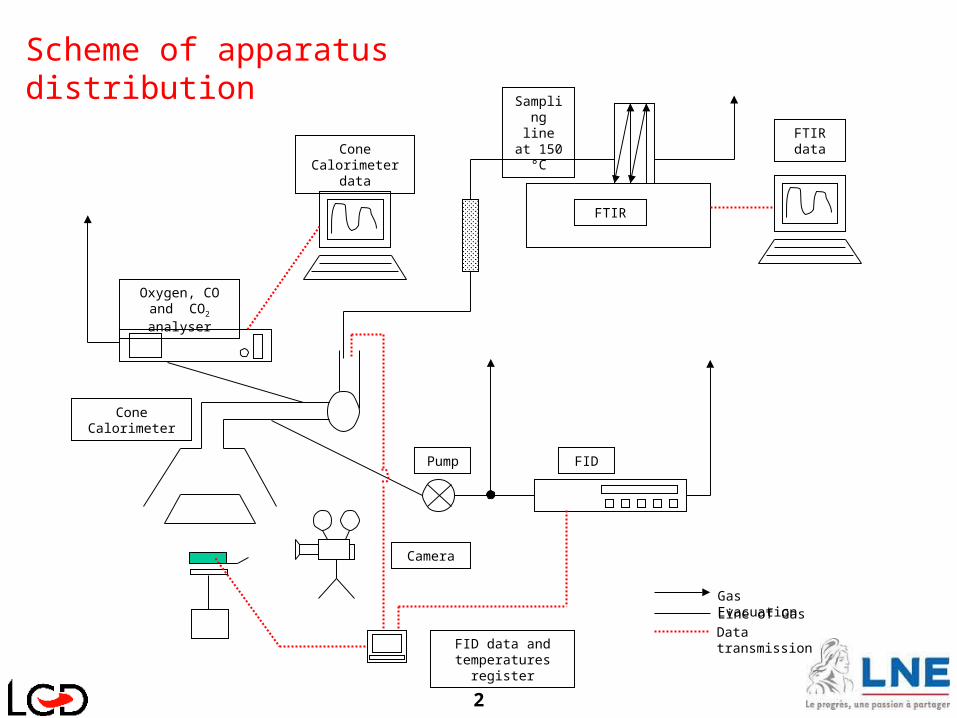
Cone Calorimeter
Line of Gas Data transmission
Gas Evacuation
Sampling line at 150 degC
FTIR
FTIR data
Oxygen CO and CO2 analyser
Cone Calorimeter data
Scheme of apparatus distribution
Camera
FIDPump
FID data and temperatures register
3
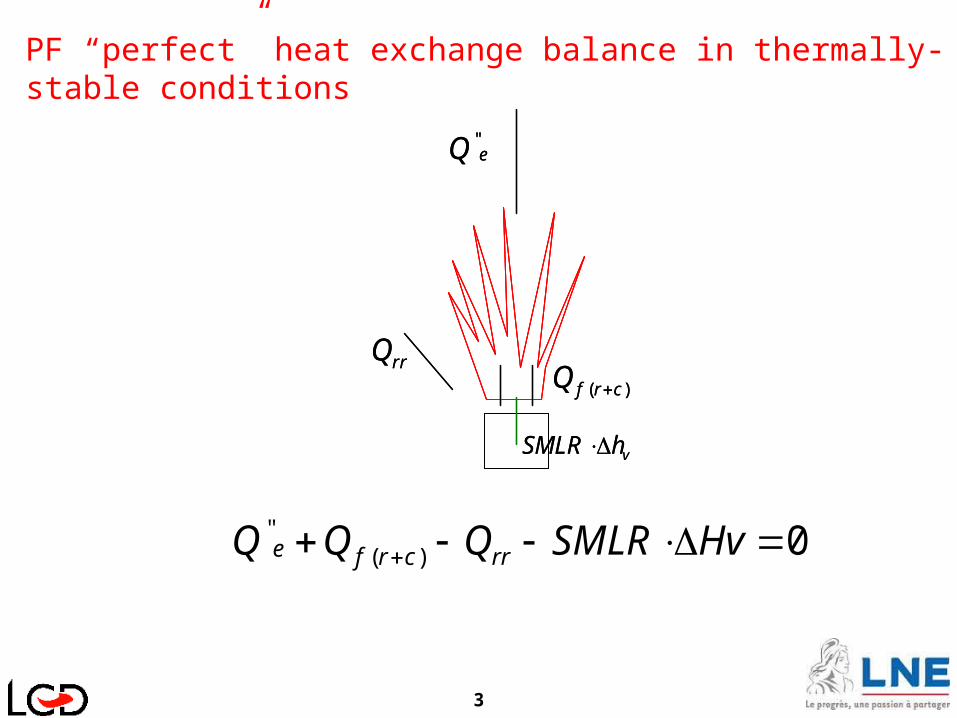
0)( HvSMLRQQQ rrcrfe
eQ
rrQ)( crfQ
vhSMLR
eQ
rrQ)( crfQ
vhSMLR
PF ldquoperfectrdquo heat exchange balance in thermally-stable conditions
4
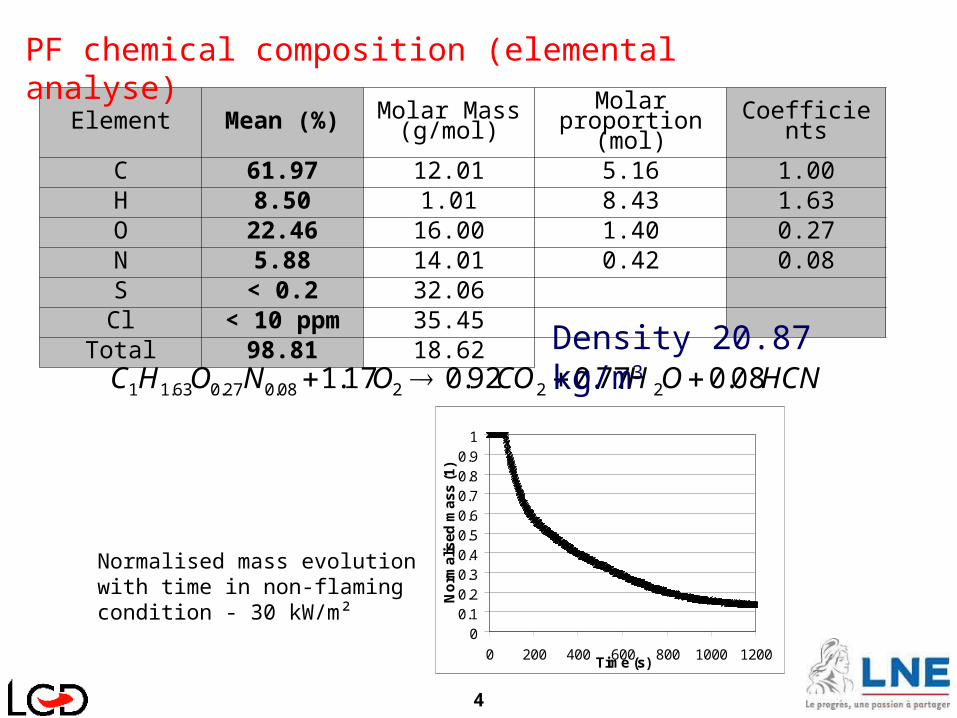
Element Mean () Molar Mass (gmol)
Molar proportion (mol) Coefficients
C 6197 1201 516 100H 850 101 843 163O 2246 1600 140 027N 588 1401 042 008S lt 02 3206 Cl lt 10 ppm 3545
Total 9881 1862
HCNOHCOONOHC 080770920171 2220802706311 Density 2087 kgm3
PF chemical composition (elemental analyse)
Normalised mass evolution with time in non-flaming condition - 30 kWmsup2
0010203040506070809
1
0 200 400 600 800 1000 1200Time (s)
No
rma
lise
d m
as
s (
1)
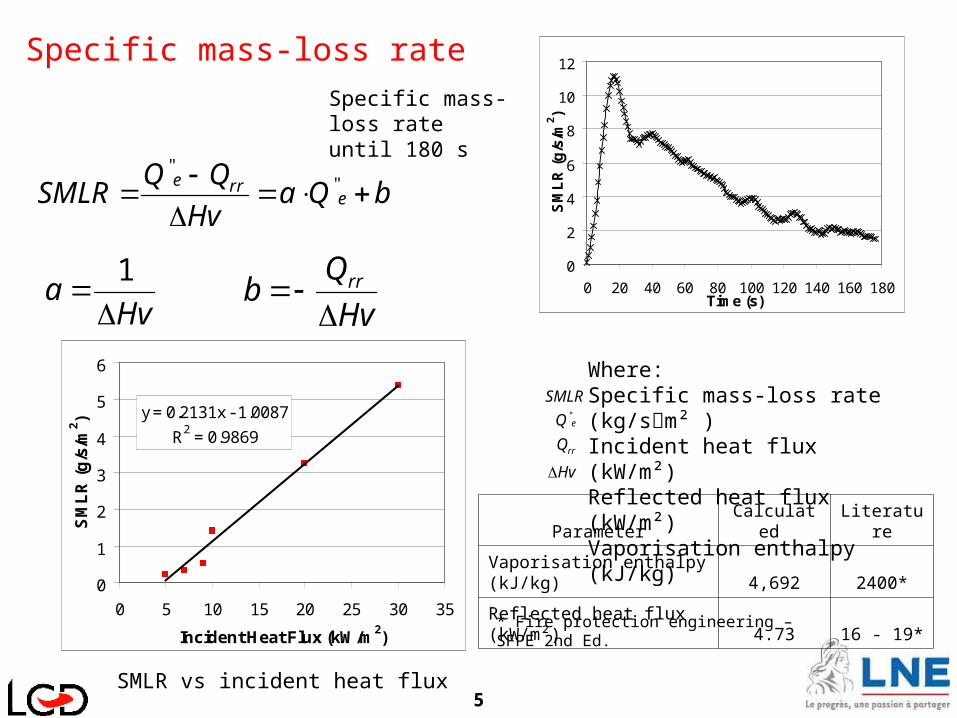
5SMLR vs incident heat flux
Specific mass-loss rate
y = 02131x - 10087
R2 = 09869
0
1
2
3
4
5
6
0 5 10 15 20 25 30 35
Incident Heat Flux (kWm2)
SM
LR
(g
sm
2 )
bQaHv
QQSMLR e
rre
Where Specific mass-loss rate (kgsmsup2 )Incident heat flux (kWmsup2)Reflected heat flux (kWmsup2)Vaporisation enthalpy (kJkg)
SMLR
eQ
rrQ
Hv
Hva
1
Hv
Qb rr
Specific mass-loss rate until 180 s
0
2
4
6
8
10
12
0 20 40 60 80 100 120 140 160 180Time (s)
SM
LR
(g
sm
2 )
Fire protection engineering ndash SFPE 2nd Ed
Parameter Calculated Literature
Vaporisation enthalpy (kJkg) 4692 2400
Reflected heat flux (kWmsup2) 473 16 - 19
6
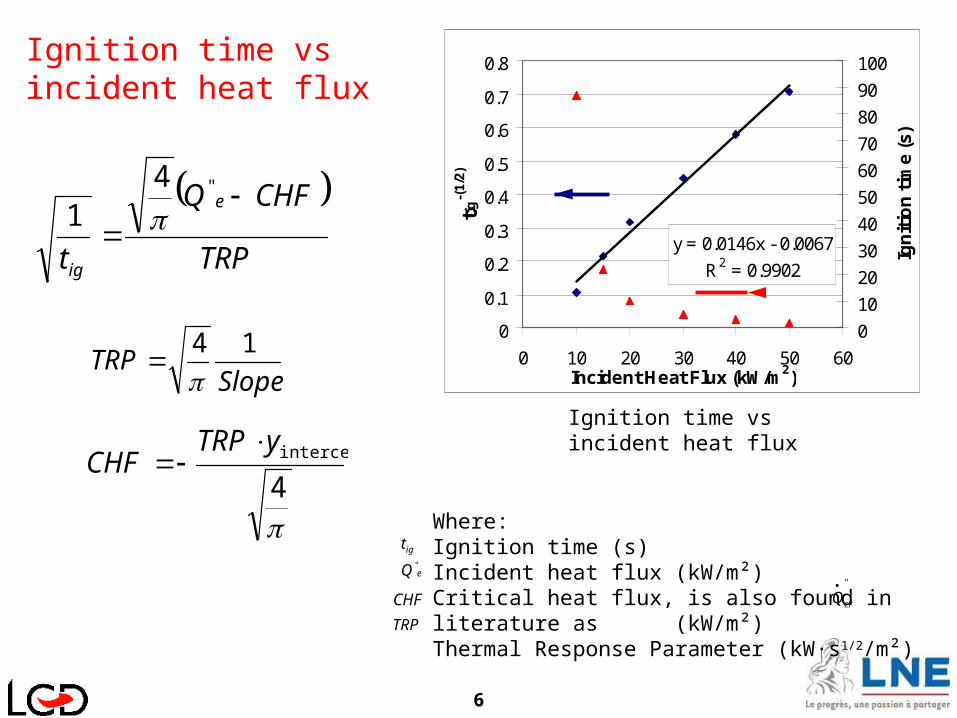
TRP
CHFQ
t
e
ig
41
Where Ignition time (s)Incident heat flux (kWmsup2)Critical heat flux is also found in literature as (kWmsup2)Thermal Response Parameter (kWmiddots12msup2)
igt
eQ
CHF
crQ
TRP
Ignition time vs incident heat flux
Ignition time vs incident heat flux
SlopeTRP
14
4
interceptyTRPCHF
y = 00146x - 00067
R2 = 09902
0
01
02
03
04
05
06
07
08
0 10 20 30 40 50 60Incident Heat Flux (kWm2)
tig-(
12)
0
10
20
30
40
50
60
70
80
90
100
Ign
itio
n t
ime
(s)
7
44oigoigc TTTThCHF
Poig CTTTRP WhereThermal conductivity (kWm K)PF density (kgm3) Specific heat at constant pressure (kJkg K)
PC
Thermal Parameters
Wherehc Coefficient of convective transfer = 152 Wmsup2KTig Temperature of the surface at ignition
To Laboratory temperature = 2931 K Material emissivity = (09007) Stephan Boltzmann constant = 567x10-8Wm2 K4
Fire protection engineering ndash SFPE 2nd Ed (Data obtained in flammability Apparatus) Fire protection engineering ndash SFPE 2nd Ed
Parameter Calculated Literature
Thermal Response Parameter (kWs12m-2) 7523 55 - 221
Critical Heat Flux (kWm-2) ndash Experimental 900 13 - 40
Ignition Temperature (degC) 275 280
Thermal Inertia ρλCp (kJ2s-1m-4K-2) 009
y = 00146x - 00067
R2 = 09902
0
01
02
03
04
05
06
07
08
0 10 20 30 40 50 60Incident Heat Flux (kWm2)
tig-(
12)
0
10
20
30
40
50
60
70
80
90
100
Ign
itio
n t
ime
(s)
8
e
oO
o
c mXr
hHRR
1051)1(101
2
222
222
1
110
02
0
OCOO
COOCOO
XXX
XXXX
Where
Thornton factor = 131MJkgO2
Initial environment concentration of the species A (1)Environment oxygen mole fraction (1)Concentration of the species A at the time t (1)Exhaust duct volume flow (ls)
o
c
r
h
0AXaOX
2
AX
em
Heat Release Rate
y = 25911x + 24108
R2 = 0955
240
260
280
300
320
340
360
380
400
0 10 20 30 40 50 60Irradiance (kWm2)
HR
R (
kW
m2 )
0
50
100
150
200
250
300
350
400
0 20 40 60 80 100 120 140 160
Time (s)
HR
R (
kW
m2 )
0
5
10
15
20
25
SM
LR
(g
sm
2 )
9
Source LNE data base
Temperature measurement
10 mm
30 mm
T2
T1 Aluminium
foil
Polyurethane foam
Thermocouples location - K type
MaterialDensity
(kg m-3)
Conductivity
(W m-1 K-1)
Polyurethane Foam 2087 004Polystyrene Foam 20 0042Rigid Phenolic Foam 50 005Rubber 1200 015Epoxy Resine 1200 0201Oak wood 825 0209PMMA 1190 021Polycarbonate 1200 023Polyesters 1500 04LD Polyethylene 960 046
10
Heating rate of the Polyurethane Foam
Evolution of the internal temperature of sample
Time-lag between the thermocouples for given temperatures
Temperature at a Heat Flux of 30 kWm2
0
50
100
150
200
250
300
350
400
0 200 400 600 800 1000 1200 1400Time (s)
Te
mp
era
ture
(degC
)
T1 30kWm2
T2 30kWm2
0
50
100
150
200
250
300
350
400
270 290 310 330 350Time (s)
Te
mp
era
ture
(degC
)
0
5
10
15
20
25
30
35
40
He
ati
ng
ra
te (
degCs
)
y = 37846Ln(x) + 1062
R2 = 09869
12
14
16
18
20
22
24
0 50 100 150 200 250 300 350
Temperature (degC)
Tim
e-l
ag
(s
)
Nonflaming condition
11
Heating rate of the Polyurethane Foam
Evolution of the internal temperature of the PF
Time-lag between the thermocouples for given temperatures
Temperature at a Heat Flux of 40 kWm2
0
100
200
300
400
500
600
700
800
900
0 100 200 300 400 500 600Time (s)
Te
mp
era
ture
(degC
) T1 40kWm2
T2 40kWm2Flaming condition
0
100
200
300
400
500
600
700
800
900
35 45 55 65 75Time (s)
Te
mp
era
ture
(degC
)
-20
0
20
40
60
80
100
He
ati
ng
ra
te (
degCs
)
95
10
105
11
115
12
125
13
135
14
0 100 200 300 400 500 600 700
Temperature (degC)
Tim
e-l
ag
(s
)
12
Evolution of the internal temperature of the PF
Temperature at a Heat Flux of 35 kWm2
Nonflaming to flaming condition
0100200300400500600700800900
1000
300 350 400 450 500 550 600Time (s)
Te
mp
era
ture
(degC
)
T1 35kWm2
T2 35kWm2
Pyrolysis Combustion
The ignition temperature measured = 320 degC and 350 degC The LNE Fire Data Base (Data No 3329) = 280 degC
(We do not know which was the method for determinate it)
13
Analysed Chemical Compounds
FTIR = Fourier Transform Infrared Spectroscopy (FTIR)FID = Flame Ionisation Detector ND = Non Dispersive Analyser
3LoD10LoQ
Concentr (ppm)
lt LoDlt LoQlt LoDlt LoQlt LoQlt LoDlt LoQlt LoDlt LoDlt LoD
Gas name Formula LoD (ppm)
LoQ (ppm) Method
Carbon monoxide CO 118 393 FTIR - NDCarbon dioxide CO2
2264 7547 FTIR - NDNitric oxide NO 222 740 FTIRWater H2O ND ND FTIRTotal hydrocarbons 01 033 FIDSulphur dioxide SO2
112 373 FTIRAmmonia NH3
175 583 FTIRHydrogen chloride HCl 154 513 FTIRMethane CH4
475 1583 FTIRNitrous oxide N2O 053 177 FTIRNitrogen dioxide NO2
197 657 FTIREthylene C2H4
2113 7043 FTIRAcetylene C2H2
528 1760 FTIRHydrogen cyanide HCN 142 473 FTIRFormaldehyde HCHO ND ND FTIR
14
10 kWm2
CO2 release during PF combustion
0
1000
2000
3000
4000
5000
6000
7000
8000
0 50 100 150 200 250 300Time (s)
CO
2 C
on
ce
ntr
ati
on
(p
pm
)
0
1000
2000
3000
4000
5000
6000
7000
8000
0 50 100 150 200 250 300Time (s)
CO
2 C
on
ce
ntr
ati
on
(p
pm
)
0
1000
2000
3000
4000
5000
6000
7000
8000
0 50 100 150 200 250 300Time (s)
CO
2 C
on
ce
ntr
ati
on
(p
pm
)
30 kWm2 50 kWm2
15
10 kWm2
CO release during PF combustion
30 kWm2 50 kWm2
020406080
100120140160180
0 50 100 150 200 250 300Time (s)
CO
Co
nc
en
tra
tio
n (
pp
m)
020406080
100120140160180
0 50 100 150 200 250 300Time (s)
CO
Co
nc
en
tra
tio
n (
pp
m)
020406080
100120140160180
0 50 100 150 200 250 300Time (s)
CO
Co
nc
en
tra
tio
n (
pp
m)
16
10 kWm2
NO release during PF combustion
30 kWm2 50 kWm2
02468
1012141618202224
0 50 100 150 200 250 300Time (s)
NO
Co
nc
en
tra
tio
n (
pp
m)
02468
1012141618202224
0 50 100 150 200 250 300Time (s)
NO
Co
nc
en
tra
tio
n (
pp
m)
02468
1012141618202224
0 50 100 150 200 250 300Time (s)
NO
Co
nc
en
tra
tio
n (
pp
m)
17
10 kWm2
H2O release during PF combustion
30 kWm2 50 kWm2
0500
100015002000250030003500400045005000
0 50 100 150 200 250 300
Time (s)
H2O
Co
nc
en
tra
tio
n (
pp
m)
c
0500
100015002000250030003500400045005000
0 50 100 150 200 250 300Time (s)
H2O
Co
nc
en
tra
tio
n (
pp
m)
0500
100015002000250030003500400045005000
0 50 100 150 200 250 300Time (s)
H2O
Co
nc
en
tra
tio
n (
pp
m)
18
CO2 CO H2O and NO yield
100
120
140
160
180
200
220
240
260
0 10 20 30 40 50 60
Irradiance (kWm2)
CO
Yie
ld (
mg
g)
15171921232527293133
NO
yie
ld (
mg
g)
CO2 and H2O yield CO and NO yield
70009000
1100013000150001700019000210002300025000
0 10 20 30 40 50 60
Irradiance (kWm2)
CO
2 a
nd
H2O
yie
ld (
mg
g)
CO2
H2O
nb
ni
iibb
bmolbb xxx
m
VMWVtY
1
21 2
1
2
1 WhereYb Yield of the chemical gas b (mgg)Δt Time between data (s)V Volume flow in the cone calorimeter exhaust (lmin)MWb Molar mass of the gas b (gmol)Vmolb Molar volume of the gas b (lmol)m Mass of the PF sample (g)xbi Concentration of the gas b at the time i
NOOHCOCOONOHC 080820020980301 2220802706311
A laquo real raquo combustion equation for ventilated fires
19
THC release in nonflame condition at 30 kWm2
THC release during PF combustion
0
10
20
30
40
50
60
0 200 400 600 800 1000 1200 1400Time (s)
TH
C c
on
ce
ntr
ati
on
(p
pm
)
02468
1012141618
0 100 200 300 400 500Time (s)
TH
C c
on
ce
ntr
ati
on
(p
pm
)
THC release in flame condition at 30 kWm2
y = 77235Ln(x) - 12523
R2 = 08892
2468
10
12141618
0 10 20 30 40 50 60
Heat flux (kWm2)
TH
C Y
ield
(m
gg
)
THC release in flame in function of heat flux
20
0
1000
2000
3000
4000
5000
6000
0 50 100 150 200 250 300
Time (s)
CO
2 a
nd
H2O
(p
pm
)
0
50
100
150
200
250
300
350
CO
NO
an
d T
HC
(p
pm
) H
RR
(k
Wm
2)
H2O (ppm)CO2 (ppm)CO (ppm)NO (ppm)THC (ppm)HRR (kWmsup2)
Extinction
4
HRR and gases off during combustion at 30kWm2
1 2 3
21
Thank you
lucasbustamantelnefr
22
Background Slides
23
The instruments and the measurements
INSTRUMENT MEASUREMENT
Cone Calorimeter Thermal properties and fire behaviour of PF
Fourier Transform Infrared Spectroscopy (FTIR)
Chemical species leaked during pyrolysis and combustion
Exhaust gas temperature measurement
Exhaust gas temperature used for molar correction of gas-off
Inner Polyurethane Foam temperature
Measurement of the inner temperature of the foam during degradation
Flame Ionisation Detection (FID)
Total hydrocarbons production
Camera Evaluation of foam degradation
24
Scheme of the PhD research work
Figure 1 scheacutema des eacutetudes agrave reacutealiser pendant la thegravese
Cocircne calorimegravetre (Etude de la physique de la deacutegradation) + FTIR
Four tubulaire (Etude de la cineacutetique de la deacutegradation) Deacutegradation thermique
Combustibles solides
LIFT
Paramegravetres cineacutetiques et modeacutelisation
Fournir agrave FDS les paramegravetres trouveacutes
Effectuer la simulation de la combustion
Comparaison avec lrsquoexpeacuterience Essais agrave grande eacutechelle
Echelle matiegravere
Echelle produit
2
Cone Calorimeter
Line of Gas Data transmission
Gas Evacuation
Sampling line at 150 degC
FTIR
FTIR data
Oxygen CO and CO2 analyser
Cone Calorimeter data
Scheme of apparatus distribution
Camera
FIDPump
FID data and temperatures register
3
0)( HvSMLRQQQ rrcrfe
eQ
rrQ)( crfQ
vhSMLR
eQ
rrQ)( crfQ
vhSMLR
PF ldquoperfectrdquo heat exchange balance in thermally-stable conditions
4
Element Mean () Molar Mass (gmol)
Molar proportion (mol) Coefficients
C 6197 1201 516 100H 850 101 843 163O 2246 1600 140 027N 588 1401 042 008S lt 02 3206 Cl lt 10 ppm 3545
Total 9881 1862
HCNOHCOONOHC 080770920171 2220802706311 Density 2087 kgm3
PF chemical composition (elemental analyse)
Normalised mass evolution with time in non-flaming condition - 30 kWmsup2
0010203040506070809
1
0 200 400 600 800 1000 1200Time (s)
No
rma
lise
d m
as
s (
1)
5SMLR vs incident heat flux
Specific mass-loss rate
y = 02131x - 10087
R2 = 09869
0
1
2
3
4
5
6
0 5 10 15 20 25 30 35
Incident Heat Flux (kWm2)
SM
LR
(g
sm
2 )
bQaHv
QQSMLR e
rre
Where Specific mass-loss rate (kgsmsup2 )Incident heat flux (kWmsup2)Reflected heat flux (kWmsup2)Vaporisation enthalpy (kJkg)
SMLR
eQ
rrQ
Hv
Hva
1
Hv
Qb rr
Specific mass-loss rate until 180 s
0
2
4
6
8
10
12
0 20 40 60 80 100 120 140 160 180Time (s)
SM
LR
(g
sm
2 )
Fire protection engineering ndash SFPE 2nd Ed
Parameter Calculated Literature
Vaporisation enthalpy (kJkg) 4692 2400
Reflected heat flux (kWmsup2) 473 16 - 19
6
TRP
CHFQ
t
e
ig
41
Where Ignition time (s)Incident heat flux (kWmsup2)Critical heat flux is also found in literature as (kWmsup2)Thermal Response Parameter (kWmiddots12msup2)
igt
eQ
CHF
crQ
TRP
Ignition time vs incident heat flux
Ignition time vs incident heat flux
SlopeTRP
14
4
interceptyTRPCHF
y = 00146x - 00067
R2 = 09902
0
01
02
03
04
05
06
07
08
0 10 20 30 40 50 60Incident Heat Flux (kWm2)
tig-(
12)
0
10
20
30
40
50
60
70
80
90
100
Ign
itio
n t
ime
(s)
7
44oigoigc TTTThCHF
Poig CTTTRP WhereThermal conductivity (kWm K)PF density (kgm3) Specific heat at constant pressure (kJkg K)
PC
Thermal Parameters
Wherehc Coefficient of convective transfer = 152 Wmsup2KTig Temperature of the surface at ignition
To Laboratory temperature = 2931 K Material emissivity = (09007) Stephan Boltzmann constant = 567x10-8Wm2 K4
Fire protection engineering ndash SFPE 2nd Ed (Data obtained in flammability Apparatus) Fire protection engineering ndash SFPE 2nd Ed
Parameter Calculated Literature
Thermal Response Parameter (kWs12m-2) 7523 55 - 221
Critical Heat Flux (kWm-2) ndash Experimental 900 13 - 40
Ignition Temperature (degC) 275 280
Thermal Inertia ρλCp (kJ2s-1m-4K-2) 009
y = 00146x - 00067
R2 = 09902
0
01
02
03
04
05
06
07
08
0 10 20 30 40 50 60Incident Heat Flux (kWm2)
tig-(
12)
0
10
20
30
40
50
60
70
80
90
100
Ign
itio
n t
ime
(s)
8
e
oO
o
c mXr
hHRR
1051)1(101
2
222
222
1
110
02
0
OCOO
COOCOO
XXX
XXXX
Where
Thornton factor = 131MJkgO2
Initial environment concentration of the species A (1)Environment oxygen mole fraction (1)Concentration of the species A at the time t (1)Exhaust duct volume flow (ls)
o
c
r
h
0AXaOX
2
AX
em
Heat Release Rate
y = 25911x + 24108
R2 = 0955
240
260
280
300
320
340
360
380
400
0 10 20 30 40 50 60Irradiance (kWm2)
HR
R (
kW
m2 )
0
50
100
150
200
250
300
350
400
0 20 40 60 80 100 120 140 160
Time (s)
HR
R (
kW
m2 )
0
5
10
15
20
25
SM
LR
(g
sm
2 )
9
Source LNE data base
Temperature measurement
10 mm
30 mm
T2
T1 Aluminium
foil
Polyurethane foam
Thermocouples location - K type
MaterialDensity
(kg m-3)
Conductivity
(W m-1 K-1)
Polyurethane Foam 2087 004Polystyrene Foam 20 0042Rigid Phenolic Foam 50 005Rubber 1200 015Epoxy Resine 1200 0201Oak wood 825 0209PMMA 1190 021Polycarbonate 1200 023Polyesters 1500 04LD Polyethylene 960 046
10
Heating rate of the Polyurethane Foam
Evolution of the internal temperature of sample
Time-lag between the thermocouples for given temperatures
Temperature at a Heat Flux of 30 kWm2
0
50
100
150
200
250
300
350
400
0 200 400 600 800 1000 1200 1400Time (s)
Te
mp
era
ture
(degC
)
T1 30kWm2
T2 30kWm2
0
50
100
150
200
250
300
350
400
270 290 310 330 350Time (s)
Te
mp
era
ture
(degC
)
0
5
10
15
20
25
30
35
40
He
ati
ng
ra
te (
degCs
)
y = 37846Ln(x) + 1062
R2 = 09869
12
14
16
18
20
22
24
0 50 100 150 200 250 300 350
Temperature (degC)
Tim
e-l
ag
(s
)
Nonflaming condition
11
Heating rate of the Polyurethane Foam
Evolution of the internal temperature of the PF
Time-lag between the thermocouples for given temperatures
Temperature at a Heat Flux of 40 kWm2
0
100
200
300
400
500
600
700
800
900
0 100 200 300 400 500 600Time (s)
Te
mp
era
ture
(degC
) T1 40kWm2
T2 40kWm2Flaming condition
0
100
200
300
400
500
600
700
800
900
35 45 55 65 75Time (s)
Te
mp
era
ture
(degC
)
-20
0
20
40
60
80
100
He
ati
ng
ra
te (
degCs
)
95
10
105
11
115
12
125
13
135
14
0 100 200 300 400 500 600 700
Temperature (degC)
Tim
e-l
ag
(s
)
12
Evolution of the internal temperature of the PF
Temperature at a Heat Flux of 35 kWm2
Nonflaming to flaming condition
0100200300400500600700800900
1000
300 350 400 450 500 550 600Time (s)
Te
mp
era
ture
(degC
)
T1 35kWm2
T2 35kWm2
Pyrolysis Combustion
The ignition temperature measured = 320 degC and 350 degC The LNE Fire Data Base (Data No 3329) = 280 degC
(We do not know which was the method for determinate it)
13
Analysed Chemical Compounds
FTIR = Fourier Transform Infrared Spectroscopy (FTIR)FID = Flame Ionisation Detector ND = Non Dispersive Analyser
3LoD10LoQ
Concentr (ppm)
lt LoDlt LoQlt LoDlt LoQlt LoQlt LoDlt LoQlt LoDlt LoDlt LoD
Gas name Formula LoD (ppm)
LoQ (ppm) Method
Carbon monoxide CO 118 393 FTIR - NDCarbon dioxide CO2
2264 7547 FTIR - NDNitric oxide NO 222 740 FTIRWater H2O ND ND FTIRTotal hydrocarbons 01 033 FIDSulphur dioxide SO2
112 373 FTIRAmmonia NH3
175 583 FTIRHydrogen chloride HCl 154 513 FTIRMethane CH4
475 1583 FTIRNitrous oxide N2O 053 177 FTIRNitrogen dioxide NO2
197 657 FTIREthylene C2H4
2113 7043 FTIRAcetylene C2H2
528 1760 FTIRHydrogen cyanide HCN 142 473 FTIRFormaldehyde HCHO ND ND FTIR
14
10 kWm2
CO2 release during PF combustion
0
1000
2000
3000
4000
5000
6000
7000
8000
0 50 100 150 200 250 300Time (s)
CO
2 C
on
ce
ntr
ati
on
(p
pm
)
0
1000
2000
3000
4000
5000
6000
7000
8000
0 50 100 150 200 250 300Time (s)
CO
2 C
on
ce
ntr
ati
on
(p
pm
)
0
1000
2000
3000
4000
5000
6000
7000
8000
0 50 100 150 200 250 300Time (s)
CO
2 C
on
ce
ntr
ati
on
(p
pm
)
30 kWm2 50 kWm2
15
10 kWm2
CO release during PF combustion
30 kWm2 50 kWm2
020406080
100120140160180
0 50 100 150 200 250 300Time (s)
CO
Co
nc
en
tra
tio
n (
pp
m)
020406080
100120140160180
0 50 100 150 200 250 300Time (s)
CO
Co
nc
en
tra
tio
n (
pp
m)
020406080
100120140160180
0 50 100 150 200 250 300Time (s)
CO
Co
nc
en
tra
tio
n (
pp
m)
16
10 kWm2
NO release during PF combustion
30 kWm2 50 kWm2
02468
1012141618202224
0 50 100 150 200 250 300Time (s)
NO
Co
nc
en
tra
tio
n (
pp
m)
02468
1012141618202224
0 50 100 150 200 250 300Time (s)
NO
Co
nc
en
tra
tio
n (
pp
m)
02468
1012141618202224
0 50 100 150 200 250 300Time (s)
NO
Co
nc
en
tra
tio
n (
pp
m)
17
10 kWm2
H2O release during PF combustion
30 kWm2 50 kWm2
0500
100015002000250030003500400045005000
0 50 100 150 200 250 300
Time (s)
H2O
Co
nc
en
tra
tio
n (
pp
m)
c
0500
100015002000250030003500400045005000
0 50 100 150 200 250 300Time (s)
H2O
Co
nc
en
tra
tio
n (
pp
m)
0500
100015002000250030003500400045005000
0 50 100 150 200 250 300Time (s)
H2O
Co
nc
en
tra
tio
n (
pp
m)
18
CO2 CO H2O and NO yield
100
120
140
160
180
200
220
240
260
0 10 20 30 40 50 60
Irradiance (kWm2)
CO
Yie
ld (
mg
g)
15171921232527293133
NO
yie
ld (
mg
g)
CO2 and H2O yield CO and NO yield
70009000
1100013000150001700019000210002300025000
0 10 20 30 40 50 60
Irradiance (kWm2)
CO
2 a
nd
H2O
yie
ld (
mg
g)
CO2
H2O
nb
ni
iibb
bmolbb xxx
m
VMWVtY
1
21 2
1
2
1 WhereYb Yield of the chemical gas b (mgg)Δt Time between data (s)V Volume flow in the cone calorimeter exhaust (lmin)MWb Molar mass of the gas b (gmol)Vmolb Molar volume of the gas b (lmol)m Mass of the PF sample (g)xbi Concentration of the gas b at the time i
NOOHCOCOONOHC 080820020980301 2220802706311
A laquo real raquo combustion equation for ventilated fires
19
THC release in nonflame condition at 30 kWm2
THC release during PF combustion
0
10
20
30
40
50
60
0 200 400 600 800 1000 1200 1400Time (s)
TH
C c
on
ce
ntr
ati
on
(p
pm
)
02468
1012141618
0 100 200 300 400 500Time (s)
TH
C c
on
ce
ntr
ati
on
(p
pm
)
THC release in flame condition at 30 kWm2
y = 77235Ln(x) - 12523
R2 = 08892
2468
10
12141618
0 10 20 30 40 50 60
Heat flux (kWm2)
TH
C Y
ield
(m
gg
)
THC release in flame in function of heat flux
20
0
1000
2000
3000
4000
5000
6000
0 50 100 150 200 250 300
Time (s)
CO
2 a
nd
H2O
(p
pm
)
0
50
100
150
200
250
300
350
CO
NO
an
d T
HC
(p
pm
) H
RR
(k
Wm
2)
H2O (ppm)CO2 (ppm)CO (ppm)NO (ppm)THC (ppm)HRR (kWmsup2)
Extinction
4
HRR and gases off during combustion at 30kWm2
1 2 3
21
Thank you
lucasbustamantelnefr
22
Background Slides
23
The instruments and the measurements
INSTRUMENT MEASUREMENT
Cone Calorimeter Thermal properties and fire behaviour of PF
Fourier Transform Infrared Spectroscopy (FTIR)
Chemical species leaked during pyrolysis and combustion
Exhaust gas temperature measurement
Exhaust gas temperature used for molar correction of gas-off
Inner Polyurethane Foam temperature
Measurement of the inner temperature of the foam during degradation
Flame Ionisation Detection (FID)
Total hydrocarbons production
Camera Evaluation of foam degradation
24
Scheme of the PhD research work
Figure 1 scheacutema des eacutetudes agrave reacutealiser pendant la thegravese
Cocircne calorimegravetre (Etude de la physique de la deacutegradation) + FTIR
Four tubulaire (Etude de la cineacutetique de la deacutegradation) Deacutegradation thermique
Combustibles solides
LIFT
Paramegravetres cineacutetiques et modeacutelisation
Fournir agrave FDS les paramegravetres trouveacutes
Effectuer la simulation de la combustion
Comparaison avec lrsquoexpeacuterience Essais agrave grande eacutechelle
Echelle matiegravere
Echelle produit
3
0)( HvSMLRQQQ rrcrfe
eQ
rrQ)( crfQ
vhSMLR
eQ
rrQ)( crfQ
vhSMLR
PF ldquoperfectrdquo heat exchange balance in thermally-stable conditions
4
Element Mean () Molar Mass (gmol)
Molar proportion (mol) Coefficients
C 6197 1201 516 100H 850 101 843 163O 2246 1600 140 027N 588 1401 042 008S lt 02 3206 Cl lt 10 ppm 3545
Total 9881 1862
HCNOHCOONOHC 080770920171 2220802706311 Density 2087 kgm3
PF chemical composition (elemental analyse)
Normalised mass evolution with time in non-flaming condition - 30 kWmsup2
0010203040506070809
1
0 200 400 600 800 1000 1200Time (s)
No
rma
lise
d m
as
s (
1)
5SMLR vs incident heat flux
Specific mass-loss rate
y = 02131x - 10087
R2 = 09869
0
1
2
3
4
5
6
0 5 10 15 20 25 30 35
Incident Heat Flux (kWm2)
SM
LR
(g
sm
2 )
bQaHv
QQSMLR e
rre
Where Specific mass-loss rate (kgsmsup2 )Incident heat flux (kWmsup2)Reflected heat flux (kWmsup2)Vaporisation enthalpy (kJkg)
SMLR
eQ
rrQ
Hv
Hva
1
Hv
Qb rr
Specific mass-loss rate until 180 s
0
2
4
6
8
10
12
0 20 40 60 80 100 120 140 160 180Time (s)
SM
LR
(g
sm
2 )
Fire protection engineering ndash SFPE 2nd Ed
Parameter Calculated Literature
Vaporisation enthalpy (kJkg) 4692 2400
Reflected heat flux (kWmsup2) 473 16 - 19
6
TRP
CHFQ
t
e
ig
41
Where Ignition time (s)Incident heat flux (kWmsup2)Critical heat flux is also found in literature as (kWmsup2)Thermal Response Parameter (kWmiddots12msup2)
igt
eQ
CHF
crQ
TRP
Ignition time vs incident heat flux
Ignition time vs incident heat flux
SlopeTRP
14
4
interceptyTRPCHF
y = 00146x - 00067
R2 = 09902
0
01
02
03
04
05
06
07
08
0 10 20 30 40 50 60Incident Heat Flux (kWm2)
tig-(
12)
0
10
20
30
40
50
60
70
80
90
100
Ign
itio
n t
ime
(s)
7
44oigoigc TTTThCHF
Poig CTTTRP WhereThermal conductivity (kWm K)PF density (kgm3) Specific heat at constant pressure (kJkg K)
PC
Thermal Parameters
Wherehc Coefficient of convective transfer = 152 Wmsup2KTig Temperature of the surface at ignition
To Laboratory temperature = 2931 K Material emissivity = (09007) Stephan Boltzmann constant = 567x10-8Wm2 K4
Fire protection engineering ndash SFPE 2nd Ed (Data obtained in flammability Apparatus) Fire protection engineering ndash SFPE 2nd Ed
Parameter Calculated Literature
Thermal Response Parameter (kWs12m-2) 7523 55 - 221
Critical Heat Flux (kWm-2) ndash Experimental 900 13 - 40
Ignition Temperature (degC) 275 280
Thermal Inertia ρλCp (kJ2s-1m-4K-2) 009
y = 00146x - 00067
R2 = 09902
0
01
02
03
04
05
06
07
08
0 10 20 30 40 50 60Incident Heat Flux (kWm2)
tig-(
12)
0
10
20
30
40
50
60
70
80
90
100
Ign
itio
n t
ime
(s)
8
e
oO
o
c mXr
hHRR
1051)1(101
2
222
222
1
110
02
0
OCOO
COOCOO
XXX
XXXX
Where
Thornton factor = 131MJkgO2
Initial environment concentration of the species A (1)Environment oxygen mole fraction (1)Concentration of the species A at the time t (1)Exhaust duct volume flow (ls)
o
c
r
h
0AXaOX
2
AX
em
Heat Release Rate
y = 25911x + 24108
R2 = 0955
240
260
280
300
320
340
360
380
400
0 10 20 30 40 50 60Irradiance (kWm2)
HR
R (
kW
m2 )
0
50
100
150
200
250
300
350
400
0 20 40 60 80 100 120 140 160
Time (s)
HR
R (
kW
m2 )
0
5
10
15
20
25
SM
LR
(g
sm
2 )
9
Source LNE data base
Temperature measurement
10 mm
30 mm
T2
T1 Aluminium
foil
Polyurethane foam
Thermocouples location - K type
MaterialDensity
(kg m-3)
Conductivity
(W m-1 K-1)
Polyurethane Foam 2087 004Polystyrene Foam 20 0042Rigid Phenolic Foam 50 005Rubber 1200 015Epoxy Resine 1200 0201Oak wood 825 0209PMMA 1190 021Polycarbonate 1200 023Polyesters 1500 04LD Polyethylene 960 046
10
Heating rate of the Polyurethane Foam
Evolution of the internal temperature of sample
Time-lag between the thermocouples for given temperatures
Temperature at a Heat Flux of 30 kWm2
0
50
100
150
200
250
300
350
400
0 200 400 600 800 1000 1200 1400Time (s)
Te
mp
era
ture
(degC
)
T1 30kWm2
T2 30kWm2
0
50
100
150
200
250
300
350
400
270 290 310 330 350Time (s)
Te
mp
era
ture
(degC
)
0
5
10
15
20
25
30
35
40
He
ati
ng
ra
te (
degCs
)
y = 37846Ln(x) + 1062
R2 = 09869
12
14
16
18
20
22
24
0 50 100 150 200 250 300 350
Temperature (degC)
Tim
e-l
ag
(s
)
Nonflaming condition
11
Heating rate of the Polyurethane Foam
Evolution of the internal temperature of the PF
Time-lag between the thermocouples for given temperatures
Temperature at a Heat Flux of 40 kWm2
0
100
200
300
400
500
600
700
800
900
0 100 200 300 400 500 600Time (s)
Te
mp
era
ture
(degC
) T1 40kWm2
T2 40kWm2Flaming condition
0
100
200
300
400
500
600
700
800
900
35 45 55 65 75Time (s)
Te
mp
era
ture
(degC
)
-20
0
20
40
60
80
100
He
ati
ng
ra
te (
degCs
)
95
10
105
11
115
12
125
13
135
14
0 100 200 300 400 500 600 700
Temperature (degC)
Tim
e-l
ag
(s
)
12
Evolution of the internal temperature of the PF
Temperature at a Heat Flux of 35 kWm2
Nonflaming to flaming condition
0100200300400500600700800900
1000
300 350 400 450 500 550 600Time (s)
Te
mp
era
ture
(degC
)
T1 35kWm2
T2 35kWm2
Pyrolysis Combustion
The ignition temperature measured = 320 degC and 350 degC The LNE Fire Data Base (Data No 3329) = 280 degC
(We do not know which was the method for determinate it)
13
Analysed Chemical Compounds
FTIR = Fourier Transform Infrared Spectroscopy (FTIR)FID = Flame Ionisation Detector ND = Non Dispersive Analyser
3LoD10LoQ
Concentr (ppm)
lt LoDlt LoQlt LoDlt LoQlt LoQlt LoDlt LoQlt LoDlt LoDlt LoD
Gas name Formula LoD (ppm)
LoQ (ppm) Method
Carbon monoxide CO 118 393 FTIR - NDCarbon dioxide CO2
2264 7547 FTIR - NDNitric oxide NO 222 740 FTIRWater H2O ND ND FTIRTotal hydrocarbons 01 033 FIDSulphur dioxide SO2
112 373 FTIRAmmonia NH3
175 583 FTIRHydrogen chloride HCl 154 513 FTIRMethane CH4
475 1583 FTIRNitrous oxide N2O 053 177 FTIRNitrogen dioxide NO2
197 657 FTIREthylene C2H4
2113 7043 FTIRAcetylene C2H2
528 1760 FTIRHydrogen cyanide HCN 142 473 FTIRFormaldehyde HCHO ND ND FTIR
14
10 kWm2
CO2 release during PF combustion
0
1000
2000
3000
4000
5000
6000
7000
8000
0 50 100 150 200 250 300Time (s)
CO
2 C
on
ce
ntr
ati
on
(p
pm
)
0
1000
2000
3000
4000
5000
6000
7000
8000
0 50 100 150 200 250 300Time (s)
CO
2 C
on
ce
ntr
ati
on
(p
pm
)
0
1000
2000
3000
4000
5000
6000
7000
8000
0 50 100 150 200 250 300Time (s)
CO
2 C
on
ce
ntr
ati
on
(p
pm
)
30 kWm2 50 kWm2
15
10 kWm2
CO release during PF combustion
30 kWm2 50 kWm2
020406080
100120140160180
0 50 100 150 200 250 300Time (s)
CO
Co
nc
en
tra
tio
n (
pp
m)
020406080
100120140160180
0 50 100 150 200 250 300Time (s)
CO
Co
nc
en
tra
tio
n (
pp
m)
020406080
100120140160180
0 50 100 150 200 250 300Time (s)
CO
Co
nc
en
tra
tio
n (
pp
m)
16
10 kWm2
NO release during PF combustion
30 kWm2 50 kWm2
02468
1012141618202224
0 50 100 150 200 250 300Time (s)
NO
Co
nc
en
tra
tio
n (
pp
m)
02468
1012141618202224
0 50 100 150 200 250 300Time (s)
NO
Co
nc
en
tra
tio
n (
pp
m)
02468
1012141618202224
0 50 100 150 200 250 300Time (s)
NO
Co
nc
en
tra
tio
n (
pp
m)
17
10 kWm2
H2O release during PF combustion
30 kWm2 50 kWm2
0500
100015002000250030003500400045005000
0 50 100 150 200 250 300
Time (s)
H2O
Co
nc
en
tra
tio
n (
pp
m)
c
0500
100015002000250030003500400045005000
0 50 100 150 200 250 300Time (s)
H2O
Co
nc
en
tra
tio
n (
pp
m)
0500
100015002000250030003500400045005000
0 50 100 150 200 250 300Time (s)
H2O
Co
nc
en
tra
tio
n (
pp
m)
18
CO2 CO H2O and NO yield
100
120
140
160
180
200
220
240
260
0 10 20 30 40 50 60
Irradiance (kWm2)
CO
Yie
ld (
mg
g)
15171921232527293133
NO
yie
ld (
mg
g)
CO2 and H2O yield CO and NO yield
70009000
1100013000150001700019000210002300025000
0 10 20 30 40 50 60
Irradiance (kWm2)
CO
2 a
nd
H2O
yie
ld (
mg
g)
CO2
H2O
nb
ni
iibb
bmolbb xxx
m
VMWVtY
1
21 2
1
2
1 WhereYb Yield of the chemical gas b (mgg)Δt Time between data (s)V Volume flow in the cone calorimeter exhaust (lmin)MWb Molar mass of the gas b (gmol)Vmolb Molar volume of the gas b (lmol)m Mass of the PF sample (g)xbi Concentration of the gas b at the time i
NOOHCOCOONOHC 080820020980301 2220802706311
A laquo real raquo combustion equation for ventilated fires
19
THC release in nonflame condition at 30 kWm2
THC release during PF combustion
0
10
20
30
40
50
60
0 200 400 600 800 1000 1200 1400Time (s)
TH
C c
on
ce
ntr
ati
on
(p
pm
)
02468
1012141618
0 100 200 300 400 500Time (s)
TH
C c
on
ce
ntr
ati
on
(p
pm
)
THC release in flame condition at 30 kWm2
y = 77235Ln(x) - 12523
R2 = 08892
2468
10
12141618
0 10 20 30 40 50 60
Heat flux (kWm2)
TH
C Y
ield
(m
gg
)
THC release in flame in function of heat flux
20
0
1000
2000
3000
4000
5000
6000
0 50 100 150 200 250 300
Time (s)
CO
2 a
nd
H2O
(p
pm
)
0
50
100
150
200
250
300
350
CO
NO
an
d T
HC
(p
pm
) H
RR
(k
Wm
2)
H2O (ppm)CO2 (ppm)CO (ppm)NO (ppm)THC (ppm)HRR (kWmsup2)
Extinction
4
HRR and gases off during combustion at 30kWm2
1 2 3
21
Thank you
lucasbustamantelnefr
22
Background Slides
23
The instruments and the measurements
INSTRUMENT MEASUREMENT
Cone Calorimeter Thermal properties and fire behaviour of PF
Fourier Transform Infrared Spectroscopy (FTIR)
Chemical species leaked during pyrolysis and combustion
Exhaust gas temperature measurement
Exhaust gas temperature used for molar correction of gas-off
Inner Polyurethane Foam temperature
Measurement of the inner temperature of the foam during degradation
Flame Ionisation Detection (FID)
Total hydrocarbons production
Camera Evaluation of foam degradation
24
Scheme of the PhD research work
Figure 1 scheacutema des eacutetudes agrave reacutealiser pendant la thegravese
Cocircne calorimegravetre (Etude de la physique de la deacutegradation) + FTIR
Four tubulaire (Etude de la cineacutetique de la deacutegradation) Deacutegradation thermique
Combustibles solides
LIFT
Paramegravetres cineacutetiques et modeacutelisation
Fournir agrave FDS les paramegravetres trouveacutes
Effectuer la simulation de la combustion
Comparaison avec lrsquoexpeacuterience Essais agrave grande eacutechelle
Echelle matiegravere
Echelle produit
4
Element Mean () Molar Mass (gmol)
Molar proportion (mol) Coefficients
C 6197 1201 516 100H 850 101 843 163O 2246 1600 140 027N 588 1401 042 008S lt 02 3206 Cl lt 10 ppm 3545
Total 9881 1862
HCNOHCOONOHC 080770920171 2220802706311 Density 2087 kgm3
PF chemical composition (elemental analyse)
Normalised mass evolution with time in non-flaming condition - 30 kWmsup2
0010203040506070809
1
0 200 400 600 800 1000 1200Time (s)
No
rma
lise
d m
as
s (
1)
5SMLR vs incident heat flux
Specific mass-loss rate
y = 02131x - 10087
R2 = 09869
0
1
2
3
4
5
6
0 5 10 15 20 25 30 35
Incident Heat Flux (kWm2)
SM
LR
(g
sm
2 )
bQaHv
QQSMLR e
rre
Where Specific mass-loss rate (kgsmsup2 )Incident heat flux (kWmsup2)Reflected heat flux (kWmsup2)Vaporisation enthalpy (kJkg)
SMLR
eQ
rrQ
Hv
Hva
1
Hv
Qb rr
Specific mass-loss rate until 180 s
0
2
4
6
8
10
12
0 20 40 60 80 100 120 140 160 180Time (s)
SM
LR
(g
sm
2 )
Fire protection engineering ndash SFPE 2nd Ed
Parameter Calculated Literature
Vaporisation enthalpy (kJkg) 4692 2400
Reflected heat flux (kWmsup2) 473 16 - 19
6
TRP
CHFQ
t
e
ig
41
Where Ignition time (s)Incident heat flux (kWmsup2)Critical heat flux is also found in literature as (kWmsup2)Thermal Response Parameter (kWmiddots12msup2)
igt
eQ
CHF
crQ
TRP
Ignition time vs incident heat flux
Ignition time vs incident heat flux
SlopeTRP
14
4
interceptyTRPCHF
y = 00146x - 00067
R2 = 09902
0
01
02
03
04
05
06
07
08
0 10 20 30 40 50 60Incident Heat Flux (kWm2)
tig-(
12)
0
10
20
30
40
50
60
70
80
90
100
Ign
itio
n t
ime
(s)
7
44oigoigc TTTThCHF
Poig CTTTRP WhereThermal conductivity (kWm K)PF density (kgm3) Specific heat at constant pressure (kJkg K)
PC
Thermal Parameters
Wherehc Coefficient of convective transfer = 152 Wmsup2KTig Temperature of the surface at ignition
To Laboratory temperature = 2931 K Material emissivity = (09007) Stephan Boltzmann constant = 567x10-8Wm2 K4
Fire protection engineering ndash SFPE 2nd Ed (Data obtained in flammability Apparatus) Fire protection engineering ndash SFPE 2nd Ed
Parameter Calculated Literature
Thermal Response Parameter (kWs12m-2) 7523 55 - 221
Critical Heat Flux (kWm-2) ndash Experimental 900 13 - 40
Ignition Temperature (degC) 275 280
Thermal Inertia ρλCp (kJ2s-1m-4K-2) 009
y = 00146x - 00067
R2 = 09902
0
01
02
03
04
05
06
07
08
0 10 20 30 40 50 60Incident Heat Flux (kWm2)
tig-(
12)
0
10
20
30
40
50
60
70
80
90
100
Ign
itio
n t
ime
(s)
8
e
oO
o
c mXr
hHRR
1051)1(101
2
222
222
1
110
02
0
OCOO
COOCOO
XXX
XXXX
Where
Thornton factor = 131MJkgO2
Initial environment concentration of the species A (1)Environment oxygen mole fraction (1)Concentration of the species A at the time t (1)Exhaust duct volume flow (ls)
o
c
r
h
0AXaOX
2
AX
em
Heat Release Rate
y = 25911x + 24108
R2 = 0955
240
260
280
300
320
340
360
380
400
0 10 20 30 40 50 60Irradiance (kWm2)
HR
R (
kW
m2 )
0
50
100
150
200
250
300
350
400
0 20 40 60 80 100 120 140 160
Time (s)
HR
R (
kW
m2 )
0
5
10
15
20
25
SM
LR
(g
sm
2 )
9
Source LNE data base
Temperature measurement
10 mm
30 mm
T2
T1 Aluminium
foil
Polyurethane foam
Thermocouples location - K type
MaterialDensity
(kg m-3)
Conductivity
(W m-1 K-1)
Polyurethane Foam 2087 004Polystyrene Foam 20 0042Rigid Phenolic Foam 50 005Rubber 1200 015Epoxy Resine 1200 0201Oak wood 825 0209PMMA 1190 021Polycarbonate 1200 023Polyesters 1500 04LD Polyethylene 960 046
10
Heating rate of the Polyurethane Foam
Evolution of the internal temperature of sample
Time-lag between the thermocouples for given temperatures
Temperature at a Heat Flux of 30 kWm2
0
50
100
150
200
250
300
350
400
0 200 400 600 800 1000 1200 1400Time (s)
Te
mp
era
ture
(degC
)
T1 30kWm2
T2 30kWm2
0
50
100
150
200
250
300
350
400
270 290 310 330 350Time (s)
Te
mp
era
ture
(degC
)
0
5
10
15
20
25
30
35
40
He
ati
ng
ra
te (
degCs
)
y = 37846Ln(x) + 1062
R2 = 09869
12
14
16
18
20
22
24
0 50 100 150 200 250 300 350
Temperature (degC)
Tim
e-l
ag
(s
)
Nonflaming condition
11
Heating rate of the Polyurethane Foam
Evolution of the internal temperature of the PF
Time-lag between the thermocouples for given temperatures
Temperature at a Heat Flux of 40 kWm2
0
100
200
300
400
500
600
700
800
900
0 100 200 300 400 500 600Time (s)
Te
mp
era
ture
(degC
) T1 40kWm2
T2 40kWm2Flaming condition
0
100
200
300
400
500
600
700
800
900
35 45 55 65 75Time (s)
Te
mp
era
ture
(degC
)
-20
0
20
40
60
80
100
He
ati
ng
ra
te (
degCs
)
95
10
105
11
115
12
125
13
135
14
0 100 200 300 400 500 600 700
Temperature (degC)
Tim
e-l
ag
(s
)
12
Evolution of the internal temperature of the PF
Temperature at a Heat Flux of 35 kWm2
Nonflaming to flaming condition
0100200300400500600700800900
1000
300 350 400 450 500 550 600Time (s)
Te
mp
era
ture
(degC
)
T1 35kWm2
T2 35kWm2
Pyrolysis Combustion
The ignition temperature measured = 320 degC and 350 degC The LNE Fire Data Base (Data No 3329) = 280 degC
(We do not know which was the method for determinate it)
13
Analysed Chemical Compounds
FTIR = Fourier Transform Infrared Spectroscopy (FTIR)FID = Flame Ionisation Detector ND = Non Dispersive Analyser
3LoD10LoQ
Concentr (ppm)
lt LoDlt LoQlt LoDlt LoQlt LoQlt LoDlt LoQlt LoDlt LoDlt LoD
Gas name Formula LoD (ppm)
LoQ (ppm) Method
Carbon monoxide CO 118 393 FTIR - NDCarbon dioxide CO2
2264 7547 FTIR - NDNitric oxide NO 222 740 FTIRWater H2O ND ND FTIRTotal hydrocarbons 01 033 FIDSulphur dioxide SO2
112 373 FTIRAmmonia NH3
175 583 FTIRHydrogen chloride HCl 154 513 FTIRMethane CH4
475 1583 FTIRNitrous oxide N2O 053 177 FTIRNitrogen dioxide NO2
197 657 FTIREthylene C2H4
2113 7043 FTIRAcetylene C2H2
528 1760 FTIRHydrogen cyanide HCN 142 473 FTIRFormaldehyde HCHO ND ND FTIR
14
10 kWm2
CO2 release during PF combustion
0
1000
2000
3000
4000
5000
6000
7000
8000
0 50 100 150 200 250 300Time (s)
CO
2 C
on
ce
ntr
ati
on
(p
pm
)
0
1000
2000
3000
4000
5000
6000
7000
8000
0 50 100 150 200 250 300Time (s)
CO
2 C
on
ce
ntr
ati
on
(p
pm
)
0
1000
2000
3000
4000
5000
6000
7000
8000
0 50 100 150 200 250 300Time (s)
CO
2 C
on
ce
ntr
ati
on
(p
pm
)
30 kWm2 50 kWm2
15
10 kWm2
CO release during PF combustion
30 kWm2 50 kWm2
020406080
100120140160180
0 50 100 150 200 250 300Time (s)
CO
Co
nc
en
tra
tio
n (
pp
m)
020406080
100120140160180
0 50 100 150 200 250 300Time (s)
CO
Co
nc
en
tra
tio
n (
pp
m)
020406080
100120140160180
0 50 100 150 200 250 300Time (s)
CO
Co
nc
en
tra
tio
n (
pp
m)
16
10 kWm2
NO release during PF combustion
30 kWm2 50 kWm2
02468
1012141618202224
0 50 100 150 200 250 300Time (s)
NO
Co
nc
en
tra
tio
n (
pp
m)
02468
1012141618202224
0 50 100 150 200 250 300Time (s)
NO
Co
nc
en
tra
tio
n (
pp
m)
02468
1012141618202224
0 50 100 150 200 250 300Time (s)
NO
Co
nc
en
tra
tio
n (
pp
m)
17
10 kWm2
H2O release during PF combustion
30 kWm2 50 kWm2
0500
100015002000250030003500400045005000
0 50 100 150 200 250 300
Time (s)
H2O
Co
nc
en
tra
tio
n (
pp
m)
c
0500
100015002000250030003500400045005000
0 50 100 150 200 250 300Time (s)
H2O
Co
nc
en
tra
tio
n (
pp
m)
0500
100015002000250030003500400045005000
0 50 100 150 200 250 300Time (s)
H2O
Co
nc
en
tra
tio
n (
pp
m)
18
CO2 CO H2O and NO yield
100
120
140
160
180
200
220
240
260
0 10 20 30 40 50 60
Irradiance (kWm2)
CO
Yie
ld (
mg
g)
15171921232527293133
NO
yie
ld (
mg
g)
CO2 and H2O yield CO and NO yield
70009000
1100013000150001700019000210002300025000
0 10 20 30 40 50 60
Irradiance (kWm2)
CO
2 a
nd
H2O
yie
ld (
mg
g)
CO2
H2O
nb
ni
iibb
bmolbb xxx
m
VMWVtY
1
21 2
1
2
1 WhereYb Yield of the chemical gas b (mgg)Δt Time between data (s)V Volume flow in the cone calorimeter exhaust (lmin)MWb Molar mass of the gas b (gmol)Vmolb Molar volume of the gas b (lmol)m Mass of the PF sample (g)xbi Concentration of the gas b at the time i
NOOHCOCOONOHC 080820020980301 2220802706311
A laquo real raquo combustion equation for ventilated fires
19
THC release in nonflame condition at 30 kWm2
THC release during PF combustion
0
10
20
30
40
50
60
0 200 400 600 800 1000 1200 1400Time (s)
TH
C c
on
ce
ntr
ati
on
(p
pm
)
02468
1012141618
0 100 200 300 400 500Time (s)
TH
C c
on
ce
ntr
ati
on
(p
pm
)
THC release in flame condition at 30 kWm2
y = 77235Ln(x) - 12523
R2 = 08892
2468
10
12141618
0 10 20 30 40 50 60
Heat flux (kWm2)
TH
C Y
ield
(m
gg
)
THC release in flame in function of heat flux
20
0
1000
2000
3000
4000
5000
6000
0 50 100 150 200 250 300
Time (s)
CO
2 a
nd
H2O
(p
pm
)
0
50
100
150
200
250
300
350
CO
NO
an
d T
HC
(p
pm
) H
RR
(k
Wm
2)
H2O (ppm)CO2 (ppm)CO (ppm)NO (ppm)THC (ppm)HRR (kWmsup2)
Extinction
4
HRR and gases off during combustion at 30kWm2
1 2 3
21
Thank you
lucasbustamantelnefr
22
Background Slides
23
The instruments and the measurements
INSTRUMENT MEASUREMENT
Cone Calorimeter Thermal properties and fire behaviour of PF
Fourier Transform Infrared Spectroscopy (FTIR)
Chemical species leaked during pyrolysis and combustion
Exhaust gas temperature measurement
Exhaust gas temperature used for molar correction of gas-off
Inner Polyurethane Foam temperature
Measurement of the inner temperature of the foam during degradation
Flame Ionisation Detection (FID)
Total hydrocarbons production
Camera Evaluation of foam degradation
24
Scheme of the PhD research work
Figure 1 scheacutema des eacutetudes agrave reacutealiser pendant la thegravese
Cocircne calorimegravetre (Etude de la physique de la deacutegradation) + FTIR
Four tubulaire (Etude de la cineacutetique de la deacutegradation) Deacutegradation thermique
Combustibles solides
LIFT
Paramegravetres cineacutetiques et modeacutelisation
Fournir agrave FDS les paramegravetres trouveacutes
Effectuer la simulation de la combustion
Comparaison avec lrsquoexpeacuterience Essais agrave grande eacutechelle
Echelle matiegravere
Echelle produit
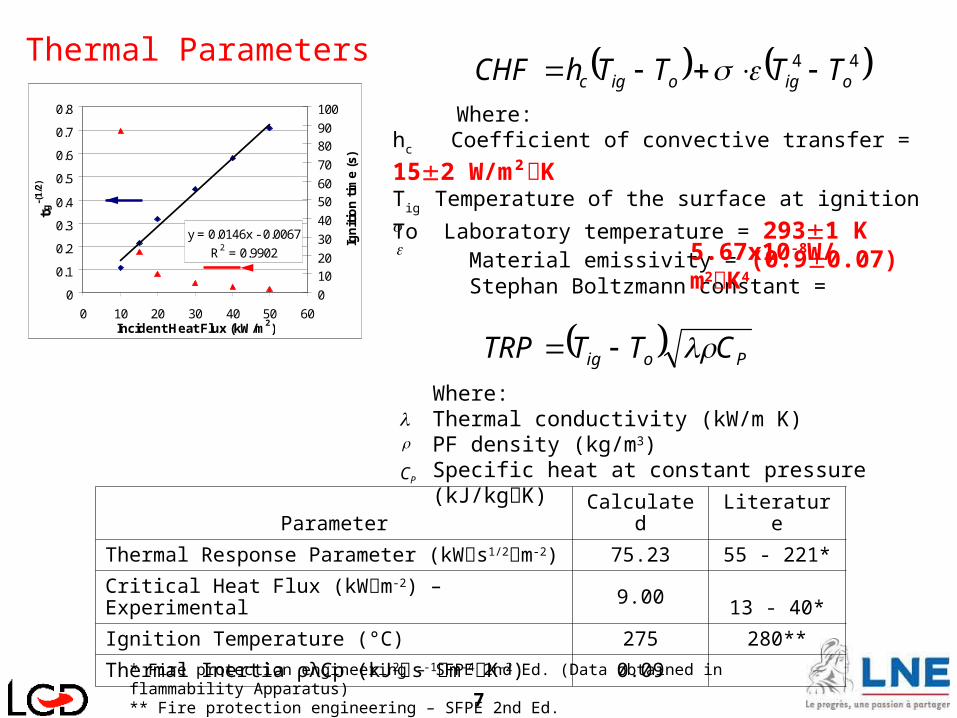
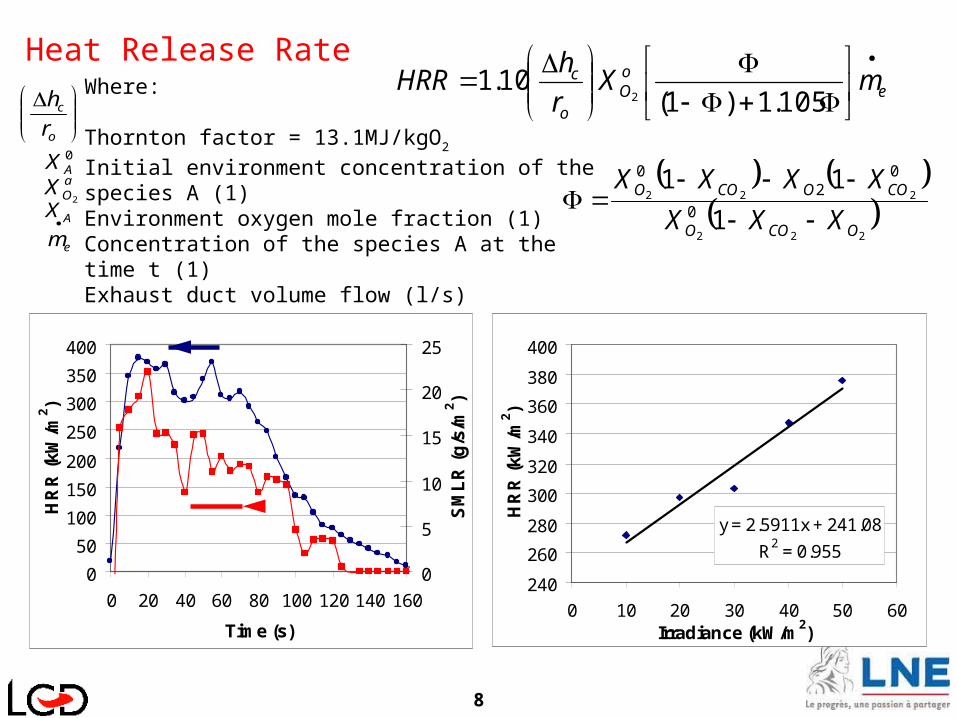
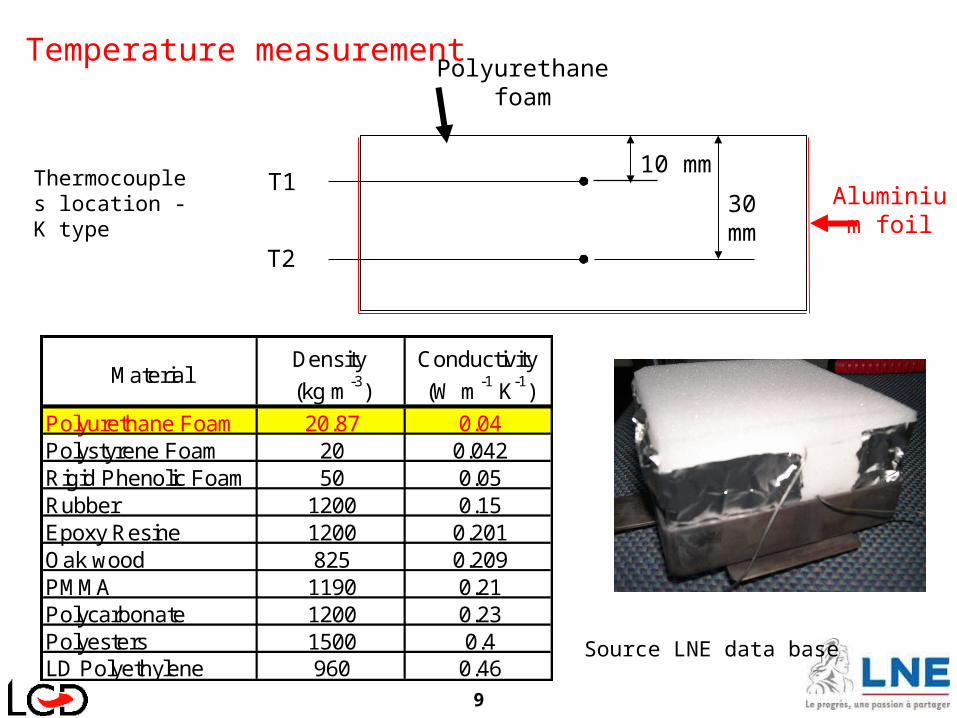
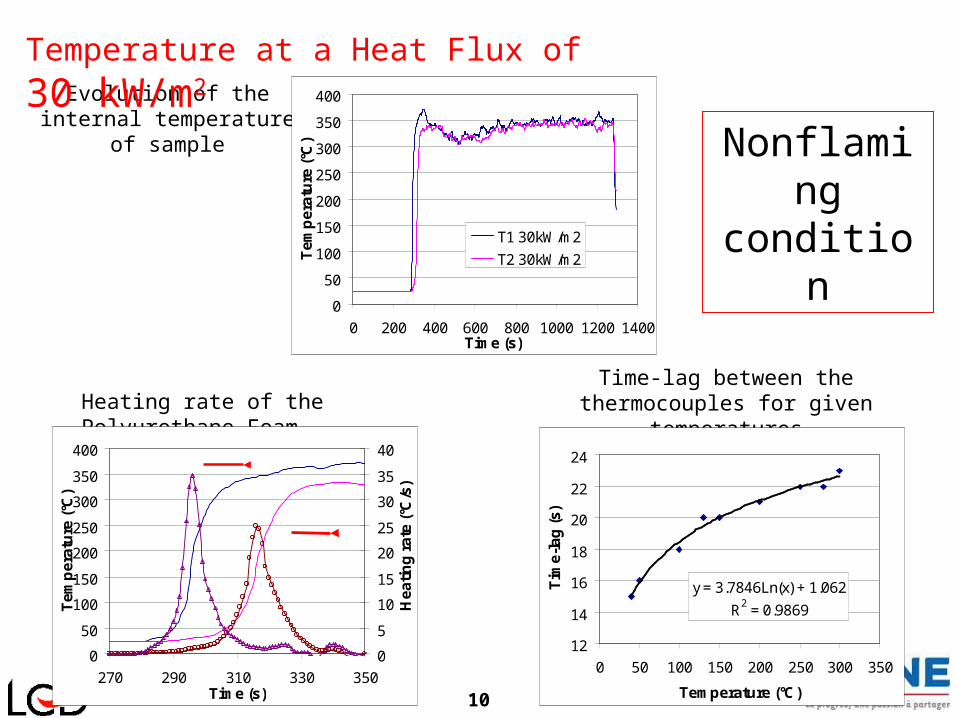
10
Heating rate of the Polyurethane Foam
Evolution of the internal temperature of sample
Time-lag between the thermocouples for given temperatures
Temperature at a Heat Flux of 30 kWm2
0
50
100
150
200
250
300
350
400
0 200 400 600 800 1000 1200 1400Time (s)
Te
mp
era
ture
(degC
)
T1 30kWm2
T2 30kWm2
0
50
100
150
200
250
300
350
400
270 290 310 330 350Time (s)
Te
mp
era
ture
(degC
)
0
5
10
15
20
25
30
35
40
He
ati
ng
ra
te (
degCs
)
y = 37846Ln(x) + 1062
R2 = 09869
12
14
16
18
20
22
24
0 50 100 150 200 250 300 350
Temperature (degC)
Tim
e-l
ag
(s
)
Nonflaming condition
11
Heating rate of the Polyurethane Foam
Evolution of the internal temperature of the PF
Time-lag between the thermocouples for given temperatures
Temperature at a Heat Flux of 40 kWm2
0
100
200
300
400
500
600
700
800
900
0 100 200 300 400 500 600Time (s)
Te
mp
era
ture
(degC
) T1 40kWm2
T2 40kWm2Flaming condition
0
100
200
300
400
500
600
700
800
900
35 45 55 65 75Time (s)
Te
mp
era
ture
(degC
)
-20
0
20
40
60
80
100
He
ati
ng
ra
te (
degCs
)
95
10
105
11
115
12
125
13
135
14
0 100 200 300 400 500 600 700
Temperature (degC)
Tim
e-l
ag
(s
)
12
Evolution of the internal temperature of the PF
Temperature at a Heat Flux of 35 kWm2
Nonflaming to flaming condition
0100200300400500600700800900
1000
300 350 400 450 500 550 600Time (s)
Te
mp
era
ture
(degC
)
T1 35kWm2
T2 35kWm2
Pyrolysis Combustion
The ignition temperature measured = 320 degC and 350 degC The LNE Fire Data Base (Data No 3329) = 280 degC
(We do not know which was the method for determinate it)
13
Analysed Chemical Compounds
FTIR = Fourier Transform Infrared Spectroscopy (FTIR)FID = Flame Ionisation Detector ND = Non Dispersive Analyser
3LoD10LoQ
Concentr (ppm)
lt LoDlt LoQlt LoDlt LoQlt LoQlt LoDlt LoQlt LoDlt LoDlt LoD
Gas name Formula LoD (ppm)
LoQ (ppm) Method
Carbon monoxide CO 118 393 FTIR - NDCarbon dioxide CO2
2264 7547 FTIR - NDNitric oxide NO 222 740 FTIRWater H2O ND ND FTIRTotal hydrocarbons 01 033 FIDSulphur dioxide SO2
112 373 FTIRAmmonia NH3
175 583 FTIRHydrogen chloride HCl 154 513 FTIRMethane CH4
475 1583 FTIRNitrous oxide N2O 053 177 FTIRNitrogen dioxide NO2
197 657 FTIREthylene C2H4
2113 7043 FTIRAcetylene C2H2
528 1760 FTIRHydrogen cyanide HCN 142 473 FTIRFormaldehyde HCHO ND ND FTIR
14
10 kWm2
CO2 release during PF combustion
0
1000
2000
3000
4000
5000
6000
7000
8000
0 50 100 150 200 250 300Time (s)
CO
2 C
on
ce
ntr
ati
on
(p
pm
)
0
1000
2000
3000
4000
5000
6000
7000
8000
0 50 100 150 200 250 300Time (s)
CO
2 C
on
ce
ntr
ati
on
(p
pm
)
0
1000
2000
3000
4000
5000
6000
7000
8000
0 50 100 150 200 250 300Time (s)
CO
2 C
on
ce
ntr
ati
on
(p
pm
)
30 kWm2 50 kWm2
15
10 kWm2
CO release during PF combustion
30 kWm2 50 kWm2
020406080
100120140160180
0 50 100 150 200 250 300Time (s)
CO
Co
nc
en
tra
tio
n (
pp
m)
020406080
100120140160180
0 50 100 150 200 250 300Time (s)
CO
Co
nc
en
tra
tio
n (
pp
m)
020406080
100120140160180
0 50 100 150 200 250 300Time (s)
CO
Co
nc
en
tra
tio
n (
pp
m)
16
10 kWm2
NO release during PF combustion
30 kWm2 50 kWm2
02468
1012141618202224
0 50 100 150 200 250 300Time (s)
NO
Co
nc
en
tra
tio
n (
pp
m)
02468
1012141618202224
0 50 100 150 200 250 300Time (s)
NO
Co
nc
en
tra
tio
n (
pp
m)
02468
1012141618202224
0 50 100 150 200 250 300Time (s)
NO
Co
nc
en
tra
tio
n (
pp
m)
17
10 kWm2
H2O release during PF combustion
30 kWm2 50 kWm2
0500
100015002000250030003500400045005000
0 50 100 150 200 250 300
Time (s)
H2O
Co
nc
en
tra
tio
n (
pp
m)
c
0500
100015002000250030003500400045005000
0 50 100 150 200 250 300Time (s)
H2O
Co
nc
en
tra
tio
n (
pp
m)
0500
100015002000250030003500400045005000
0 50 100 150 200 250 300Time (s)
H2O
Co
nc
en
tra
tio
n (
pp
m)
18
CO2 CO H2O and NO yield
100
120
140
160
180
200
220
240
260
0 10 20 30 40 50 60
Irradiance (kWm2)
CO
Yie
ld (
mg
g)
15171921232527293133
NO
yie
ld (
mg
g)
CO2 and H2O yield CO and NO yield
70009000
1100013000150001700019000210002300025000
0 10 20 30 40 50 60
Irradiance (kWm2)
CO
2 a
nd
H2O
yie
ld (
mg
g)
CO2
H2O
nb
ni
iibb
bmolbb xxx
m
VMWVtY
1
21 2
1
2
1 WhereYb Yield of the chemical gas b (mgg)Δt Time between data (s)V Volume flow in the cone calorimeter exhaust (lmin)MWb Molar mass of the gas b (gmol)Vmolb Molar volume of the gas b (lmol)m Mass of the PF sample (g)xbi Concentration of the gas b at the time i
NOOHCOCOONOHC 080820020980301 2220802706311
A laquo real raquo combustion equation for ventilated fires
19
THC release in nonflame condition at 30 kWm2
THC release during PF combustion
0
10
20
30
40
50
60
0 200 400 600 800 1000 1200 1400Time (s)
TH
C c
on
ce
ntr
ati
on
(p
pm
)
02468
1012141618
0 100 200 300 400 500Time (s)
TH
C c
on
ce
ntr
ati
on
(p
pm
)
THC release in flame condition at 30 kWm2
y = 77235Ln(x) - 12523
R2 = 08892
2468
10
12141618
0 10 20 30 40 50 60
Heat flux (kWm2)
TH
C Y
ield
(m
gg
)
THC release in flame in function of heat flux
20
0
1000
2000
3000
4000
5000
6000
0 50 100 150 200 250 300
Time (s)
CO
2 a
nd
H2O
(p
pm
)
0
50
100
150
200
250
300
350
CO
NO
an
d T
HC
(p
pm
) H
RR
(k
Wm
2)
H2O (ppm)CO2 (ppm)CO (ppm)NO (ppm)THC (ppm)HRR (kWmsup2)
Extinction
4
HRR and gases off during combustion at 30kWm2
1 2 3
21
Thank you
lucasbustamantelnefr
22
Background Slides
23
The instruments and the measurements
INSTRUMENT MEASUREMENT
Cone Calorimeter Thermal properties and fire behaviour of PF
Fourier Transform Infrared Spectroscopy (FTIR)
Chemical species leaked during pyrolysis and combustion
Exhaust gas temperature measurement
Exhaust gas temperature used for molar correction of gas-off
Inner Polyurethane Foam temperature
Measurement of the inner temperature of the foam during degradation
Flame Ionisation Detection (FID)
Total hydrocarbons production
Camera Evaluation of foam degradation
24
Scheme of the PhD research work
Figure 1 scheacutema des eacutetudes agrave reacutealiser pendant la thegravese
Cocircne calorimegravetre (Etude de la physique de la deacutegradation) + FTIR
Four tubulaire (Etude de la cineacutetique de la deacutegradation) Deacutegradation thermique
Combustibles solides
LIFT
Paramegravetres cineacutetiques et modeacutelisation
Fournir agrave FDS les paramegravetres trouveacutes
Effectuer la simulation de la combustion
Comparaison avec lrsquoexpeacuterience Essais agrave grande eacutechelle
Echelle matiegravere
Echelle produit
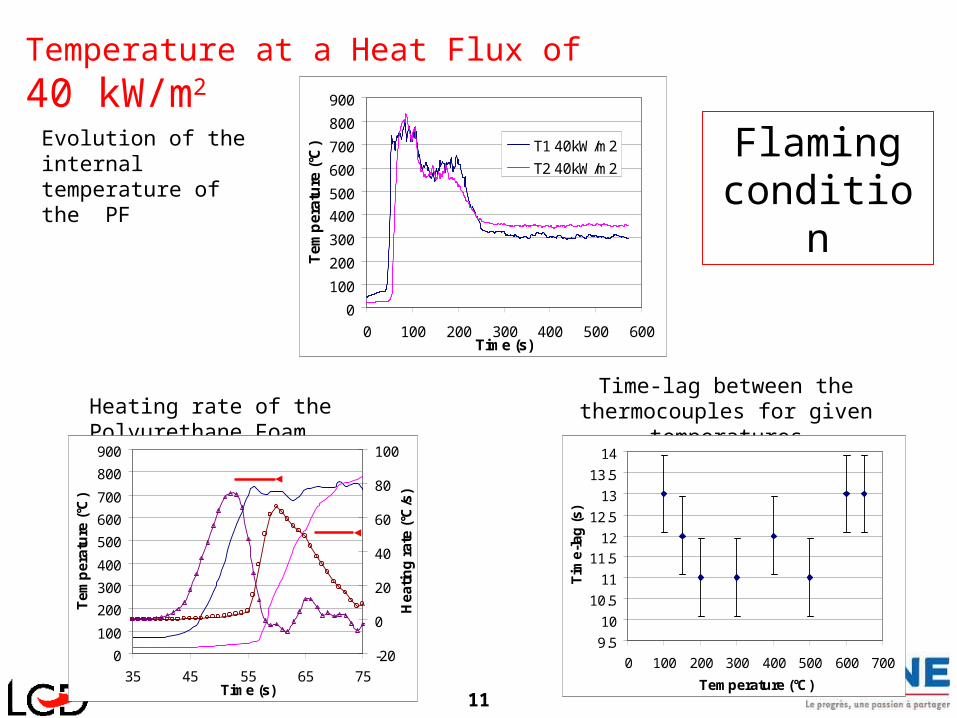
11
Heating rate of the Polyurethane Foam
Evolution of the internal temperature of the PF
Time-lag between the thermocouples for given temperatures
Temperature at a Heat Flux of 40 kWm2
0
100
200
300
400
500
600
700
800
900
0 100 200 300 400 500 600Time (s)
Te
mp
era
ture
(degC
) T1 40kWm2
T2 40kWm2Flaming condition
0
100
200
300
400
500
600
700
800
900
35 45 55 65 75Time (s)
Te
mp
era
ture
(degC
)
-20
0
20
40
60
80
100
He
ati
ng
ra
te (
degCs
)
95
10
105
11
115
12
125
13
135
14
0 100 200 300 400 500 600 700
Temperature (degC)
Tim
e-l
ag
(s
)
12
Evolution of the internal temperature of the PF
Temperature at a Heat Flux of 35 kWm2
Nonflaming to flaming condition
0100200300400500600700800900
1000
300 350 400 450 500 550 600Time (s)
Te
mp
era
ture
(degC
)
T1 35kWm2
T2 35kWm2
Pyrolysis Combustion
The ignition temperature measured = 320 degC and 350 degC The LNE Fire Data Base (Data No 3329) = 280 degC
(We do not know which was the method for determinate it)
13
Analysed Chemical Compounds
FTIR = Fourier Transform Infrared Spectroscopy (FTIR)FID = Flame Ionisation Detector ND = Non Dispersive Analyser
3LoD10LoQ
Concentr (ppm)
lt LoDlt LoQlt LoDlt LoQlt LoQlt LoDlt LoQlt LoDlt LoDlt LoD
Gas name Formula LoD (ppm)
LoQ (ppm) Method
Carbon monoxide CO 118 393 FTIR - NDCarbon dioxide CO2
2264 7547 FTIR - NDNitric oxide NO 222 740 FTIRWater H2O ND ND FTIRTotal hydrocarbons 01 033 FIDSulphur dioxide SO2
112 373 FTIRAmmonia NH3
175 583 FTIRHydrogen chloride HCl 154 513 FTIRMethane CH4
475 1583 FTIRNitrous oxide N2O 053 177 FTIRNitrogen dioxide NO2
197 657 FTIREthylene C2H4
2113 7043 FTIRAcetylene C2H2
528 1760 FTIRHydrogen cyanide HCN 142 473 FTIRFormaldehyde HCHO ND ND FTIR
14
10 kWm2
CO2 release during PF combustion
0
1000
2000
3000
4000
5000
6000
7000
8000
0 50 100 150 200 250 300Time (s)
CO
2 C
on
ce
ntr
ati
on
(p
pm
)
0
1000
2000
3000
4000
5000
6000
7000
8000
0 50 100 150 200 250 300Time (s)
CO
2 C
on
ce
ntr
ati
on
(p
pm
)
0
1000
2000
3000
4000
5000
6000
7000
8000
0 50 100 150 200 250 300Time (s)
CO
2 C
on
ce
ntr
ati
on
(p
pm
)
30 kWm2 50 kWm2
15
10 kWm2
CO release during PF combustion
30 kWm2 50 kWm2
020406080
100120140160180
0 50 100 150 200 250 300Time (s)
CO
Co
nc
en
tra
tio
n (
pp
m)
020406080
100120140160180
0 50 100 150 200 250 300Time (s)
CO
Co
nc
en
tra
tio
n (
pp
m)
020406080
100120140160180
0 50 100 150 200 250 300Time (s)
CO
Co
nc
en
tra
tio
n (
pp
m)
16
10 kWm2
NO release during PF combustion
30 kWm2 50 kWm2
02468
1012141618202224
0 50 100 150 200 250 300Time (s)
NO
Co
nc
en
tra
tio
n (
pp
m)
02468
1012141618202224
0 50 100 150 200 250 300Time (s)
NO
Co
nc
en
tra
tio
n (
pp
m)
02468
1012141618202224
0 50 100 150 200 250 300Time (s)
NO
Co
nc
en
tra
tio
n (
pp
m)
17
10 kWm2
H2O release during PF combustion
30 kWm2 50 kWm2
0500
100015002000250030003500400045005000
0 50 100 150 200 250 300
Time (s)
H2O
Co
nc
en
tra
tio
n (
pp
m)
c
0500
100015002000250030003500400045005000
0 50 100 150 200 250 300Time (s)
H2O
Co
nc
en
tra
tio
n (
pp
m)
0500
100015002000250030003500400045005000
0 50 100 150 200 250 300Time (s)
H2O
Co
nc
en
tra
tio
n (
pp
m)
18
CO2 CO H2O and NO yield
100
120
140
160
180
200
220
240
260
0 10 20 30 40 50 60
Irradiance (kWm2)
CO
Yie
ld (
mg
g)
15171921232527293133
NO
yie
ld (
mg
g)
CO2 and H2O yield CO and NO yield
70009000
1100013000150001700019000210002300025000
0 10 20 30 40 50 60
Irradiance (kWm2)
CO
2 a
nd
H2O
yie
ld (
mg
g)
CO2
H2O
nb
ni
iibb
bmolbb xxx
m
VMWVtY
1
21 2
1
2
1 WhereYb Yield of the chemical gas b (mgg)Δt Time between data (s)V Volume flow in the cone calorimeter exhaust (lmin)MWb Molar mass of the gas b (gmol)Vmolb Molar volume of the gas b (lmol)m Mass of the PF sample (g)xbi Concentration of the gas b at the time i
NOOHCOCOONOHC 080820020980301 2220802706311
A laquo real raquo combustion equation for ventilated fires
19
THC release in nonflame condition at 30 kWm2
THC release during PF combustion
0
10
20
30
40
50
60
0 200 400 600 800 1000 1200 1400Time (s)
TH
C c
on
ce
ntr
ati
on
(p
pm
)
02468
1012141618
0 100 200 300 400 500Time (s)
TH
C c
on
ce
ntr
ati
on
(p
pm
)
THC release in flame condition at 30 kWm2
y = 77235Ln(x) - 12523
R2 = 08892
2468
10
12141618
0 10 20 30 40 50 60
Heat flux (kWm2)
TH
C Y
ield
(m
gg
)
THC release in flame in function of heat flux
20
0
1000
2000
3000
4000
5000
6000
0 50 100 150 200 250 300
Time (s)
CO
2 a
nd
H2O
(p
pm
)
0
50
100
150
200
250
300
350
CO
NO
an
d T
HC
(p
pm
) H
RR
(k
Wm
2)
H2O (ppm)CO2 (ppm)CO (ppm)NO (ppm)THC (ppm)HRR (kWmsup2)
Extinction
4
HRR and gases off during combustion at 30kWm2
1 2 3
21
Thank you
lucasbustamantelnefr
22
Background Slides
23
The instruments and the measurements
INSTRUMENT MEASUREMENT
Cone Calorimeter Thermal properties and fire behaviour of PF
Fourier Transform Infrared Spectroscopy (FTIR)
Chemical species leaked during pyrolysis and combustion
Exhaust gas temperature measurement
Exhaust gas temperature used for molar correction of gas-off
Inner Polyurethane Foam temperature
Measurement of the inner temperature of the foam during degradation
Flame Ionisation Detection (FID)
Total hydrocarbons production
Camera Evaluation of foam degradation
24
Scheme of the PhD research work
Figure 1 scheacutema des eacutetudes agrave reacutealiser pendant la thegravese
Cocircne calorimegravetre (Etude de la physique de la deacutegradation) + FTIR
Four tubulaire (Etude de la cineacutetique de la deacutegradation) Deacutegradation thermique
Combustibles solides
LIFT
Paramegravetres cineacutetiques et modeacutelisation
Fournir agrave FDS les paramegravetres trouveacutes
Effectuer la simulation de la combustion
Comparaison avec lrsquoexpeacuterience Essais agrave grande eacutechelle
Echelle matiegravere
Echelle produit
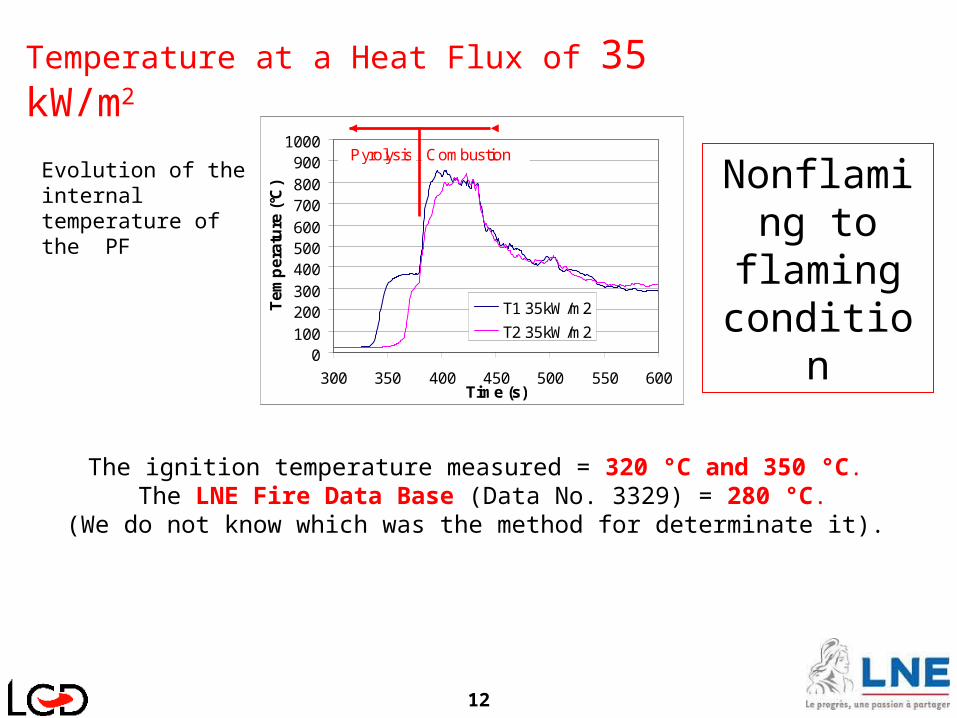
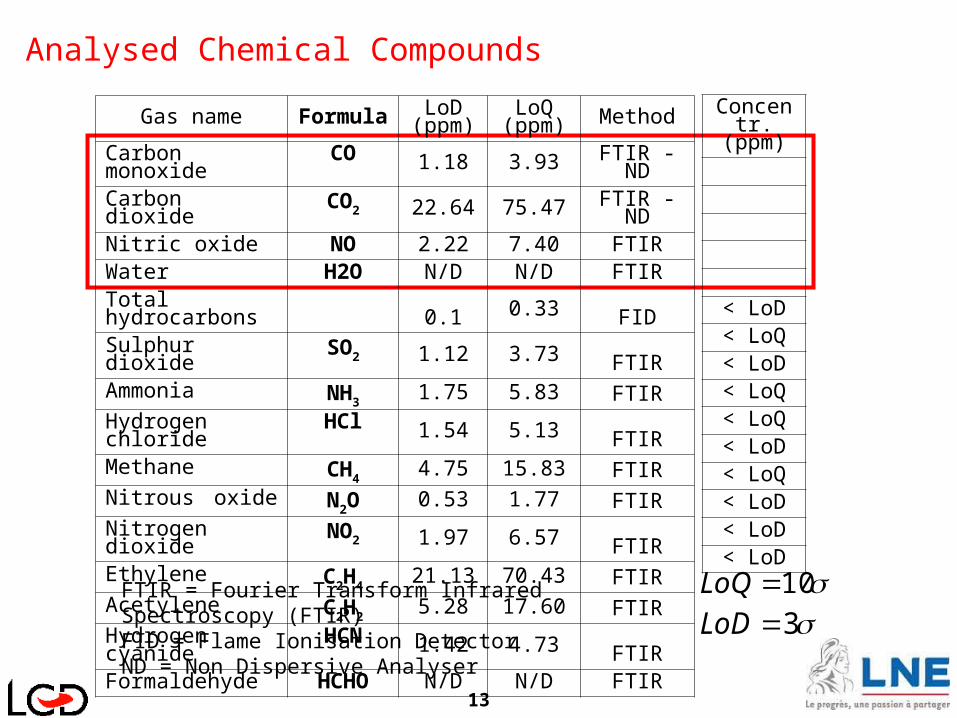
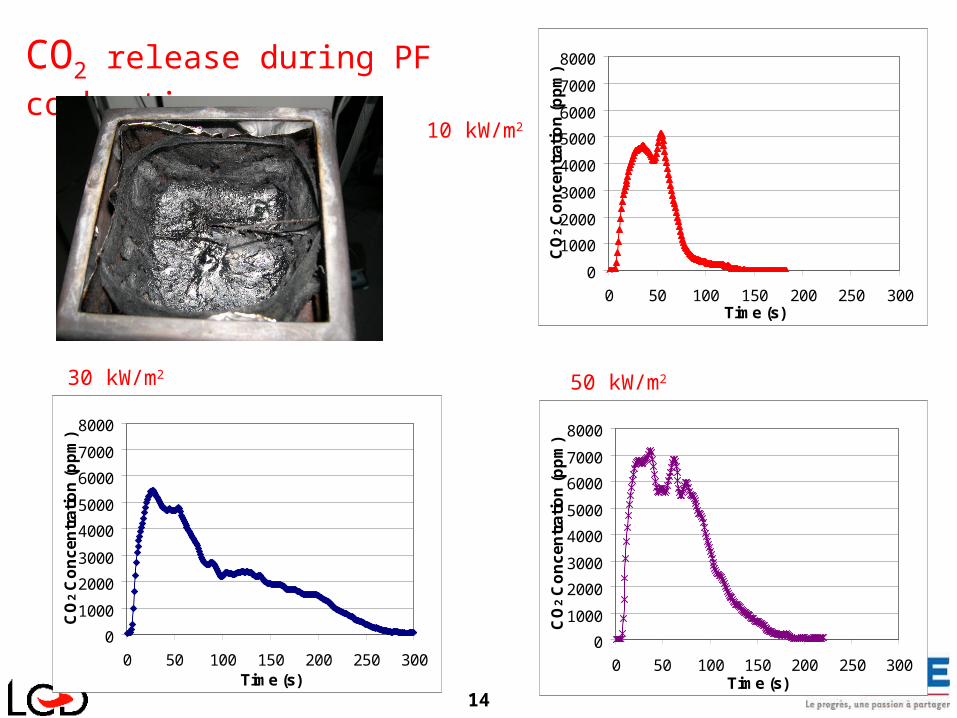
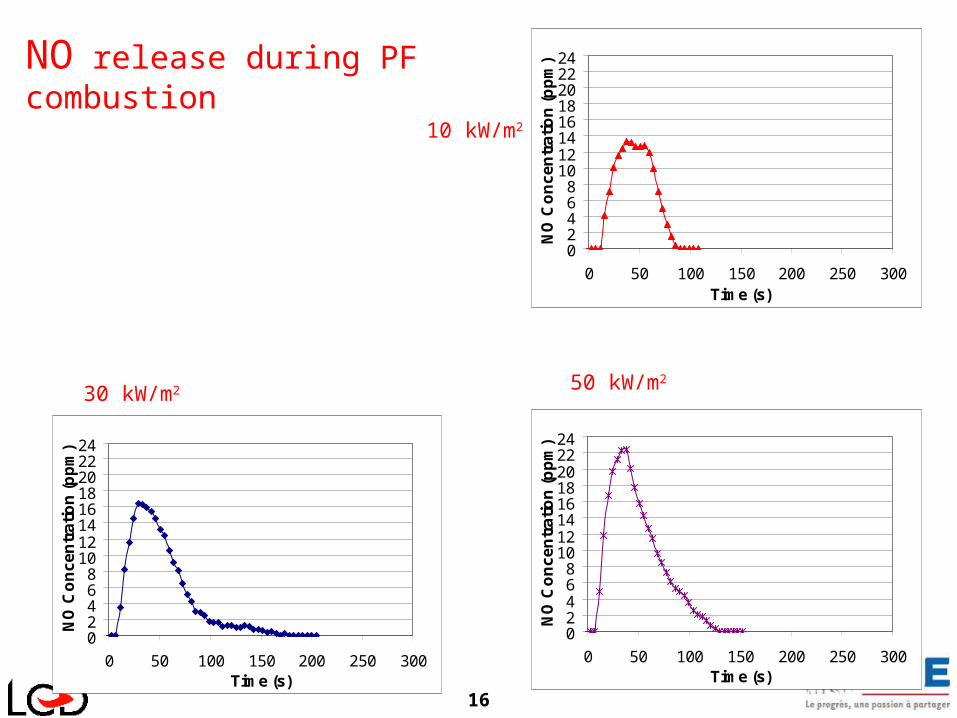
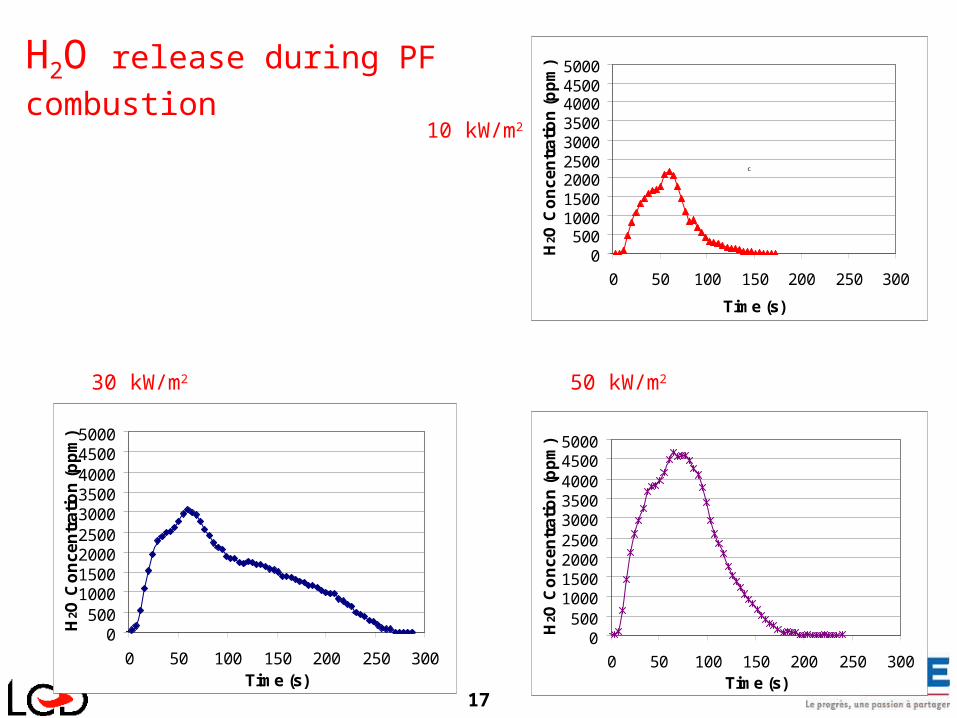
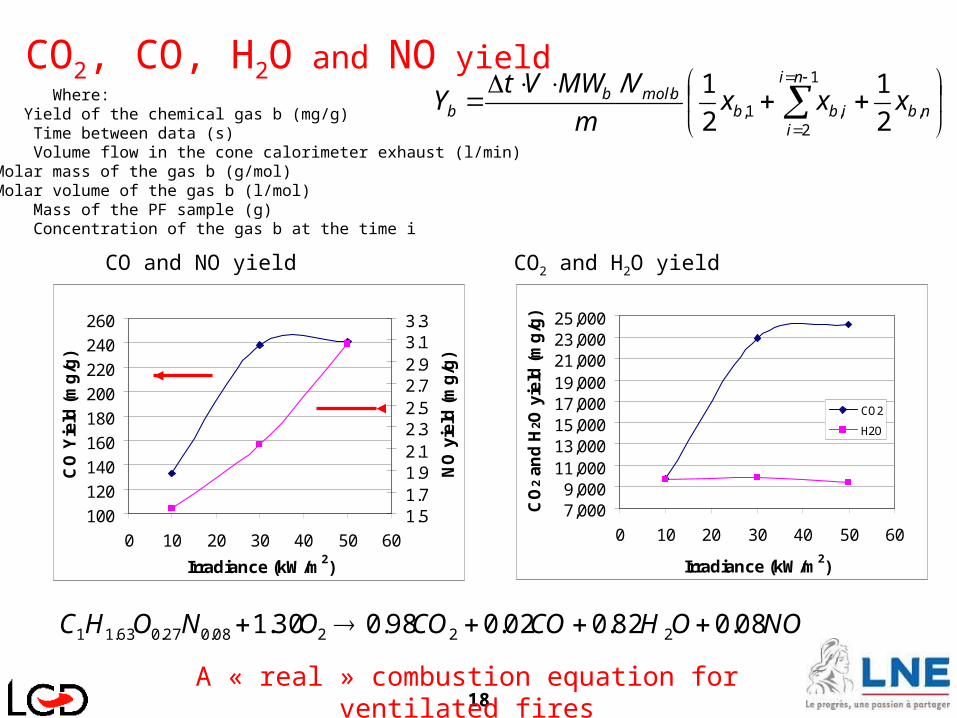
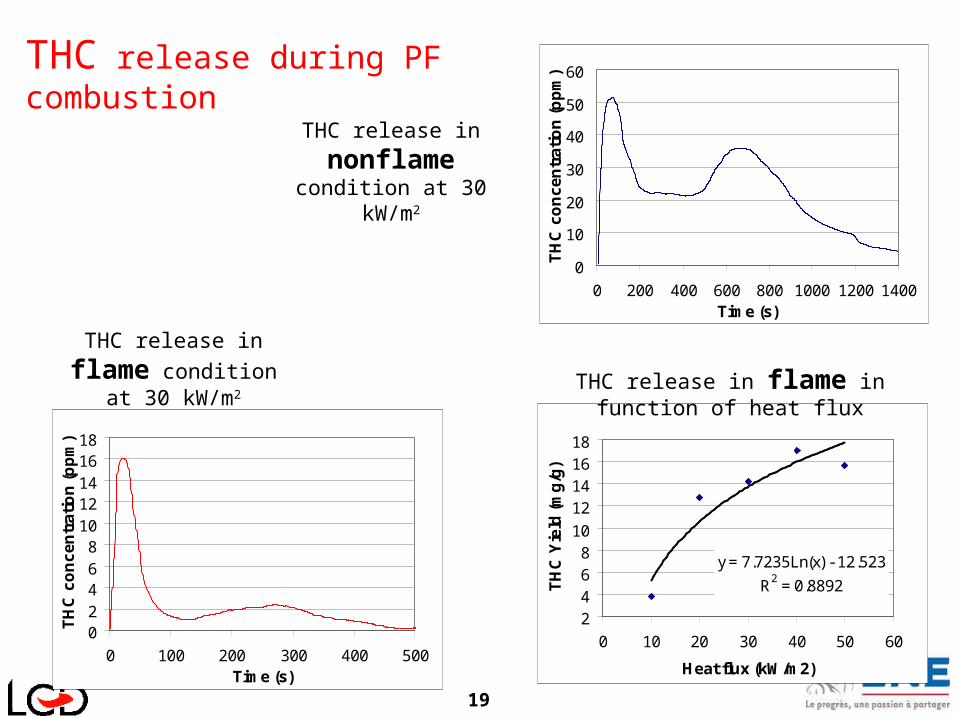
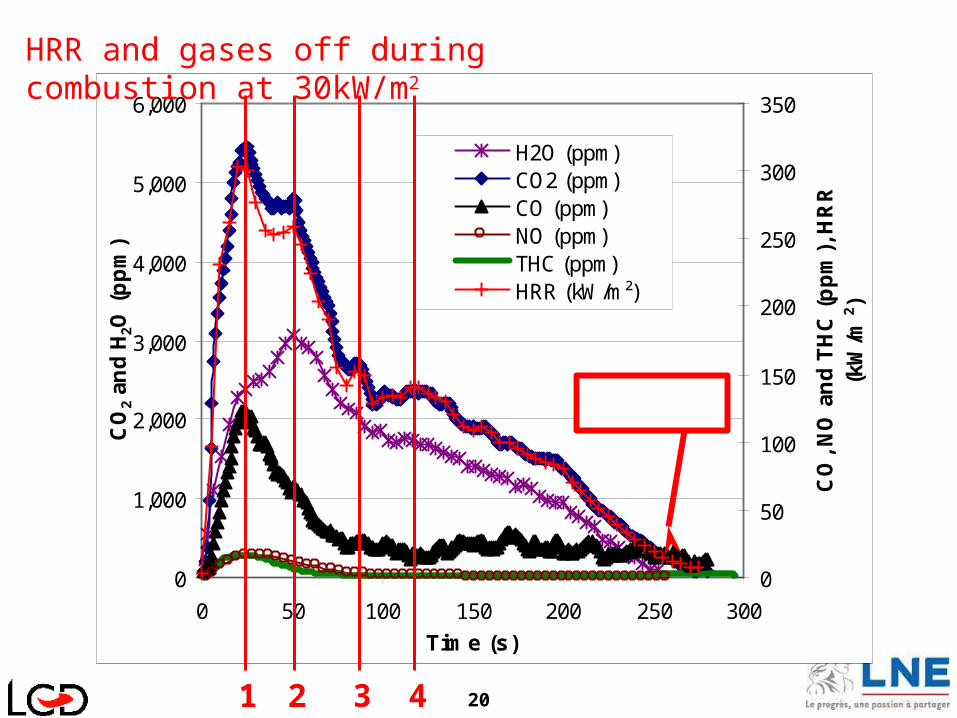
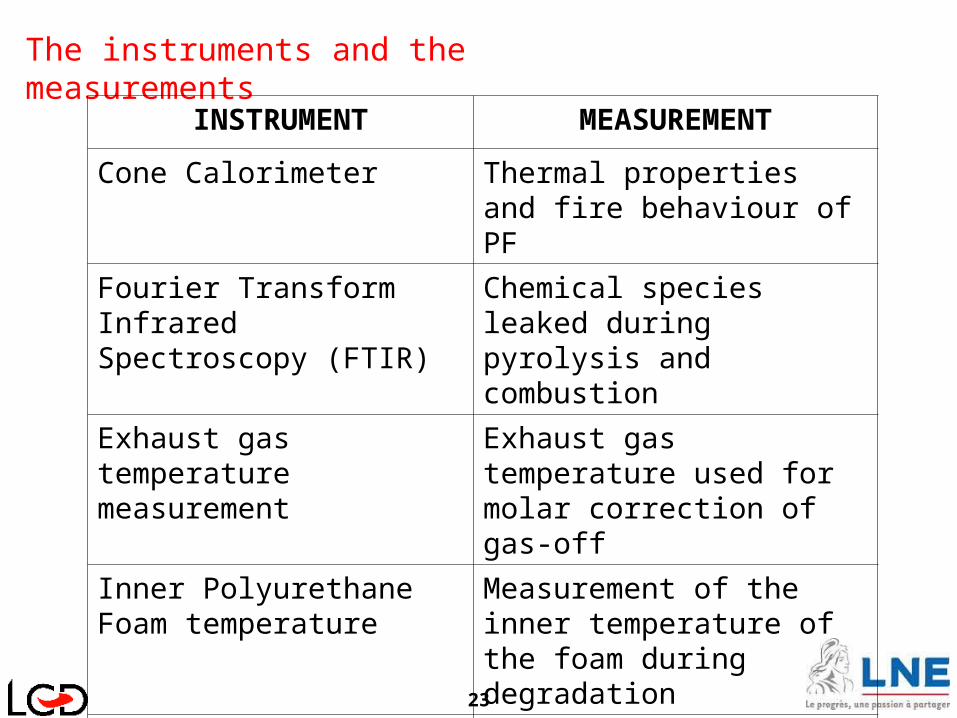
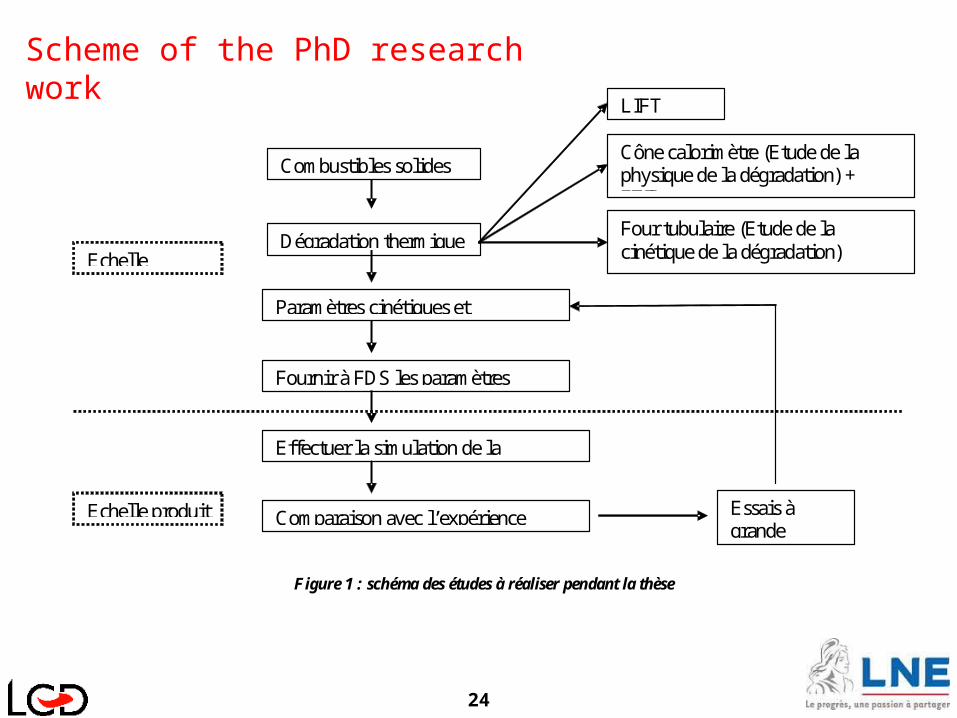


![Gdr pres[1]](https://img.pdfslide.us/doc/110x75/55a5461a1a28abb47e8b4583/gdr-pres1.jpg)