Embed Size (px)
Citation preview
1
CHAPTER 6 1
2
GC EI and CI Fragmentation and Interpretation of Spectra 3
4
6.1 Introduction 5
6
Before discussing fragmentation and interpretation, it is important to 7
understand the many ways mass spectra are utilized. For the analytical chemist, 8
a mass spectrum is useful for two applications. The first is the relatively simple 9
case when the analyst is looking for a particular compound in a sample and has 10
a reference material to compare spectra. The second occurs when an analyst 11
observes the presence of an unknown and wishes to identify it. The mass 12
spectrum allows an experienced analyst to identify the compound or at a 13
minimum narrow the possibilities down to a few compounds from the millions of 14
potential chemicals. Then, a reference standard can be more easily selected 15
from this knowledge to confirm the identity of this unknown. A similar situation 16
exists for the synthetic chemist except their analytical tool box is much larger. 17
Sometimes synthetic chemists are attempting to synthesize a final product that is 18
known (for example in an industrial process line). Here, the mass spectrum of 19
the synthesized product is compared to a reference standard. Other times, a 20
synthetic chemist is attempting is attempting to make a new compound where a 21
reference standard is impossible to find. 22
23
All four problems center on the same difficult task, identifying the structure 24
of a compound under various conditions. There are three main instruments that 25
perform this task for organic compounds, infrared spectroscopy, mass 26
spectroscopy and nuclear magnetic resonance (NMR). It is very important that 27
both synthetic and analytical chemists are able to choose the best tool for their 28
particular problem. The mass spectrometer has a few advantages over the other 29
analytical methods. Mass spectroscopy, when coupled with either gas or liquid 30
chromatography, can analyze a complex mixture that an NMR or IR could not. A 31

2
MS is also the only way to determine the molecular mass of a compound. The 1
largest advantage for analytical chemists is that mass spectroscopy can 2
elucidate structural information from a very small amount of a compound (part 3
per million quantities). 4
5
The MS has a distinctive advantage over IR spectroscopy in that there is 6
more structural information can be determined, though the information contained 7
in a mass spectrum is more difficult to interpret. The MS has an advantage over 8
NMR in that it can be performed more quickly. However, both IR spectroscopy 9
and mass spectroscopy have a distinct disadvantage when analyzing 10
compounds with multiple functional groups. For these types of compounds and 11
when the analyst has mg quantities of a relatively pure compound, NMR is 12
usually the best analytical tool. 13
14
As a result of these advantages and disadvantages, mass spectroscopy is 15
normally utilized to perform three tasks. The first is in analytical chemistry when 16
there is a small concentration of analyte. The second is identifying compounds 17
that contain few functional groups; a common procedure in industrial synthesis. 18
The third is confirming steps in a complex synthesis of a new product to 19
determine the molecular mass and possible some structural information. The 20
products in the third example, however, are usually always checked by NMR. 21
22
After choosing to use mass spectroscopy, the selection of gas 23
chromatography or liquid chromatography is equally important. Gas 24
chromatography is utilized for volatile and thermally stable compounds (up to 300 25
°C). Liquid chromatography is usually utilized for all other compounds since it 26
has poorer resolution than GC. As a result, this chapter will focus upon 27
interpreting structural information from the types of compounds commonly 28
analyzed with GC-MS. Once a chemist is able to determine the identity of a 29
compound from a mass spectrum, their problem has been solved. 30
31

3
6.2 Creation of the Spectra 1
2
As sample molecules exit the GC column and enter into the mass 3
spectrophotometer, they encounter an energy source. For the purposes of this 4
chapter, the source is an electron impact tungsten filament at 70 eV (Section 5
5.2.1.2a). Energy emitted from the source removes a single electron from a 6
sample molecule. This is the most basic reaction and is illustrated by methanol 7
below (Figure 6.1). 8
9
€
e- + CH3OH → [CH3OH] •+ + 2e- Rxn 6.1 10
11
After these products move through the mass spectrometer, the detector is 12
only sensitive to the positively charged molecules and is not sensitive to any 13
neutral or radical molecules. The detector transforms the number of molecules 14
into an electrical signal, and a computer or integrator translates this individual 15
signal peaks into a bar graph. The abundance is plotted as a function of a 16
molecule’s mass divided by its charge (m/z) on a bar graph (Figure 6.1). Since 17
almost all of the fragments detected by the GC-MS have only a single positive 18
charge, m/z is also a measurement of the molecules’ mass. 19
20

4
1 Figure 6.1 Mass Spectrum of Methanol 2
Spectra from the NIST/EPA/NIH Mass Spectral Library. Reprinted with 3
permission from NIST. 4
5
There are more bars on the graph than just the mass of the sample 6
molecule. These other peaks are attributed to the cleavage of bonds in the 7
original sample molecule. These fragments allow for the original structure of the 8
sample molecule to be determined by looking at its various components (Section 9
6.8). Since the energy of the source exceeds the ionization energy of the sample 10
molecule, the excess energy that is not utilized in the removal of a single electron 11
is distributed over various electronic, vibrational, and rotational degrees of 12
freedom (Section 6.6). Fractionation occurs when this energy exceeds the 13
activation energy of any bond cleavage (Section 6.6). This feature allows the 14
instrument to distinguish between compounds with the same molecular mass and 15
constitutional isomers. The major fragments for methanol (Figure 6.1) can be 16
attributed to the following reactions. 17
18

5
€
[CH3OH] •+ → CH3O+ + H •
[CH3OH] •+ → CH2O+ + H2 Rxns 6.2[CH3OH] •+ → CH3
+ + •OH 1
2
The two most important peaks in any mass spectrum are the base peak 3
and the molecular ion peak. The base beak (also referred to as the parent peak) 4
is the largest peak in the spectrum. In the case of methane, the base peak is the 5
peak at m/z 31 corresponding to the CH3O+ fragment. Since the absolute height 6
of any peak is dependent on the concentration of the sample, the other peaks in 7
the spectrum are referenced as a percentage of the base peak and referred to as 8
relative abundance. This normalization of peak heights greatly aids in 9
identification of fragmentation pattern and therefore analyte identification. 10
11
The molecular ion peak corresponds to an analyte molecule that has not 12
undergone fragmentation. In Figure 6.1, the molecular ion peak is caused by the 13
[CH3OH] ·+ ion and corresponds to m/z 32. The molecular ion peak is often 14
referred to as the M+ ion. The molecular ion is used as a reference point in 15
identifying the other fragments. For example, the peak corresponding to m/z 15 16
is referred to as both M – OH and M – 17. 17
18
6.3 Identifying the Molecular Ion Peak 19
20
The molecular ion peak is both an important reference point and is integral 21
in identifying an unknown compound. While it may seem that the molecular ion 22
peak should be the most abundant peak in the spectrum, this is not the case for 23
the majority of compounds. Compounds like alcohols, nitrogen containing 24
organics, carboxylic acids, esters, and highly branched compounds may 25
completely lack a visible molecular ion. In these cases, it is critical that fragment 26
peaks are not mistakenly identified as the molecular ion peak in order to avoid 27
misidentification of an analyte. Obtaining a chemical ionization spectrum can 28
assist in correctly identifying the molecular ion (Section 5.2.1.2b). 29

6
1
Even without a CI spectrum of the compound, other rules can assist in 2
ruling out potential masses as the molecular ion. The “nitrogen rule” is one 3
valuable tool for identifying the molecular ion. This rule indicates that if a 4
molecular ion has an odd mass it must have an odd number of nitrogen and that 5
a molecular ion with an even mass must lack nitrogen atoms or contain an even 6
number of them. Since the majority of organic compounds analyzed with the 7
GC-MS contain either zero or one nitrogen atom, the rule practically states an 8
odd molecular ion is attributed to a single nitrogen and an even molecular ion 9
indicates the sample lacks nitrogen (Figure 6.2). This rule only applies to 10
compounds that contain carbon, hydrogen, nitrogen, oxygen, sulfur, halogens, 11
and a few other less common elements. Since the majority of organic 12
compounds that are analyzed using the GC-MS are made up of these elements, 13
this stipulation is practically ignored. 14
15
16 Figure 6.2 The Nitrogen Rule - The mass spectrum of N,N-dimethyl-ethanamine 17
illustrates the presence of an odd molecular ion and even fragments. 18

7
Spectra from the NIST/EPA/NIH Mass Spectral Library. Reprinted with 1
permission from NIST. 2
3
This rule is a result of nitrogen’s unique property. Nitrogen has an even 4
atomic mass but bonds with three other atoms in its most stable form. Other 5
atoms that have even molecular weights like carbon, oxygen, and sulfur bond 6
with an even number of other atoms. Atoms that bond with an odd number of 7
other atoms like hydrogen, chlorine, bromine, and iodine have odd molecular 8
weights. This rule is invaluable when a chemist knows that a compound lacks 9
nitrogen. This can occur if a sample is prepared from a synthesis whose 10
products and solvents lack nitrogen atoms. In this case, any odd peak cannot be 11
attributed to the molecular ion of the analyzed compound. 12
13
Most fractionation excluding rearrangements (Section 6.6) occurs when a 14
single bond is broken. The nitrogen rule indicates that when a molecule with an 15
even mass produces a fragment by breaking a single bond, the fragment will 16
have an odd mass. When the samples mass is odd, fragmentation via a similar 17
pathway will give an even fragment as long as the nitrogen is still contained in 18
the observed fragment. Since this is generally the observed trend (See 19
Stevenson’s Rule Section 2.6), analyzing the major fragments can help 20
determine if the molecular ion should be even or odd. Practically, if the major 21
fragments are mostly odd, the molecular ion is likely even and contains no 22
nitrogen. If the major fragments are even, the molecular ion is likely odd and 23
contains one nitrogen atom as shown in Figure 6.3. 24
25

8
1 Figure 6.3. The Use of the Nitrogen Rule in Determining the Molecular Ion - 2
Should the faint peak at m/z 60 be attributed to the presence of C13 or is it the 3
molecular ion? The presence of the base peak at 45 in combination with our 4
knowledge about the nitrogen rule suggests that the peak at m/z 60 is likely the 5
molecular ion because even molecular ion usually produce odd molecular 6
fragments by breaking single bonds. Given this spectrum is of Isopropyl alcohol, 7
our deduction is correct although chemical ionization techniques could verify the 8
molecular mass of the sample. 9
Spectra from the NIST/EPA/NIH Mass Spectral Library. Reprinted with 10
permission from NIST. 11
12
Since molecular ions fragment in predictable ways, the presence of certain 13
fragmentation peaks can suggest that a particular peak is the molecular ion. The 14
observed fragments must be able to be attributed to logical losses. The 15
existence of a M - 15 peak from the loss of CH3, a M - 18 peak from the loss of 16
H20, or a M - 31 from the loss of OCH3 are a few examples of these logical 17
fragments. 18
19

9
The opposite is true for fragments that are not logical. These peaks 1
suggest that a particular peak is not the molecular ion. Some illogical 2
fragmentation peaks include peaks that is 3 to 14 mass units away from the peak 3
suggest that the identified peak is likely not the molecular ion peak. The loss of 4
fragments of mass units 1-3 can result from the loss of up to three hydrogen 5
atoms. From 14 to 18, multiple peaks can be explained from the loss of CH3, 6
oxygen, a hydroxide ion, or water. The loss of fragments from the 19-25 range is 7
also unlikely except in the case of fluorinated compounds which produce M - 19 8
(loss of F) and M - 20 (loss of HF). 9
10
The molecular ion is difficult to identify with chemical ionization because 11
there is no definitive test. While these patterns can greatly assist in identifying 12
the molecular ion, they should not be trusted as confirmatory. Complex 13
rearrangements can potentially result in the misidentification of the molecular ion. 14
As a result, it is good practice to double check with a soft ionization technique 15
such as chemical ionization when in doubt of the identity of the molecular ion. 16
17
2.4 Use of the Molecular Ion 18
19
Once the identity of the molecular ion has been determined much can be 20
learned about the compound. One extremely valuable piece of information that 21
can be determined from a high resolution mass spectrometer is the molecular 22
formula of an unknown analyte. If a molecular ion was identified to be at m/z 80 23
on an instrument with unit resolution little could be determined about the 24
molecular formula. For example, some of the many possible molecular formulas 25
include C4H4N2 (80.0375), C5H4O(80.0262), and C6H8 (80.0626). A high 26
resolution instrument measurement of this peak at 80.0372 ± .0005 would 27
indicate that the empirical formula is C4H4N2. Extensive tables and computer 28
programs are used to perform this technique of a routine basis. 29
30

10
Once the molecular formula is known, it becomes possible to determine 1
the degree of unsaturation. This allows the analyst to know the number of pi 2
bonds and rings that are in their structure. The elements of unsaturation can be 3
computed by using the following equation. 4
5
6
7
where H is the number of H atoms, X is the number of halogen atoms (F, Cl, Br, 8
and I), and N is the number of nitrogen atoms in the chemical formula. As the 9
equation indicates, the number of oxygen atoms does not affect the degree of 10
unsaturation. By using this equation the molecular formula C4H4N2 has four 11
degrees of unsaturation. The combination of the molecular formula with the 12
degrees of unsaturation is important tools in identifying a particular compound. 13
14
The molecular ion along with other information from IR and NMR spectra 15
can allow the identity of an unknown to be determined. If all three techniques 16
can be utilized on a sample, the strengths of each allow for the easiest 17
identification. Since IR identifies the unknown’s functional groups, the mass of 18
these groups are first subtracted from the mass of the molecular ion. This mass 19
frequently represents the mass of the carbon and hydrogen contained in a 20
sample. Taking this number and dividing by twelve will the number of carbon 21
atoms and a fraction representing the number of hydrogen atoms. It is important 22
to not blindly trust this method. If the molecular ion minus the mass of the 23
functional groups gives 85, dividing by 12 would give a molecular formula of C7H. 24
Attempting to create this molecule will quickly indicate that a more logical 25
molecular formula would be C6H13. 26
27
For the example unknown analyte illustrated in Figure 2.4, the IR 28
spectrum indicates the compounds functional groups. The sharp peak observed 29
at around 1710 cm-1 indicates the presence of a carbonyl group. The large round 30

11
peak centered around 3000 cm-1 suggests that the compound is a carboxylic 1
acid. The large peak slightly above 1600 cm-1 could indicate that the unknown 2
contains an alkene or even possibly an imine. 3
4
5
6

12
1 Figure 2.4 IR, Mass Spectrum, and NMR of an Unknown Analyte 2
Spectra from the NIST/EPA/NIH Mass Spectral Library. Reprinted with 3
permission from NIST. 4
5
After talking a mass spectrum of the compound, it is necessary to identify 6
the molecular ion. We can identify the peak at 86 to be the molecular ion using 7
the nitrogen rule (discussed above). Because its major fragments are both odd, 8
69 and 41, it is reasonable that its molecular ion should be even. The peaks at 9
85 (loss of H) and 71 (loss of CH3) can be explained in a logical fashion further 10
confirming the m/z 86 peak as the molecular ion. 11
12
From above, the compound’s known mass is 86, thus, we can confirm that 13
the compound is not an imine because it has an even molecular weight indicating 14
that it does not contain an odd number of nitrogen atoms. Now it becomes 15
possible to identify something about the carbon backbone of the atom. By 16
subtracting the mass of the carboxylic acid functional group (COOH) a mass of 17
41 is obtained. The IR spectrum indicates that the remainder of the molecule is 18
likely only made up of carbon and hydrogen. This allows the analyst to deduce 19
that the rest of the molecule is made up of 3 more carbon atoms and 5 hydrogen 20
atoms. From taking these two easy measurements, one is able to determine that 21
this compound’s molecular formula is C3H5COOH. From this molecular formula 22

13
we can determine that the degree of unsaturation is two. One degree of 1
unsaturation is attributed to the acid functional group while the other is a double 2
bond since a three carbon ring is extremely unlikely. 3
4
While both the IR and MS are able to determine a great deal about a 5
compound’s identity, NMR is necessary to identify this compound. The peak 6
below 12 ppm is a result of the hydrogen on the carboxylic acid group. The 7
doublet peaks 6.3 and 5.7 ppm are split by approximately 1.4 Hz which indicates 8
that they are geminal protons. The fact that the peaks are doublets indicates that 9
there are only two hydrogen atoms connected to the vinyl group. The presence 10
of a methyl group is indicated by the peak at 2 ppm. As a result the unknown 11
compound is methacrylic acid whose structure is shown below. 12
13
14 15
While utilizing IR and NMR, in combination with the mass spectra, made 16
the identification of this compound relatively simple, these tools are not always 17
available. If the analyte of interest is in a complex mixture or there is only a small 18
concentration or quanity (parts per million), both IR and NMR are not effective 19
tools. As a result, it is necessary to be able to identify as much information is 20
possible from the mass spectrum alone. The rest of this chapter will be devoted 21
to such a task by observing common fractionation trends in various types of 22
compounds. 23
24
2.5 Identification of Analytes using Isotopic Ratios 25
26
Since the majority of elements have two or more isotopes, the ratio of 27
these isotopes can be a powerful tool in deriving the composition of unknown 28
samples. Prominent peaks will have a smaller peak one mass unit higher than 29
14
the prominent peak due to the presence of one 13C in some of the sample 1
molecules. Background noise and a lack of resolution in the majority of mass 2
spectrometers prevent the ratio of various isotopes from being an identification 3
technique for all compounds. 4
5
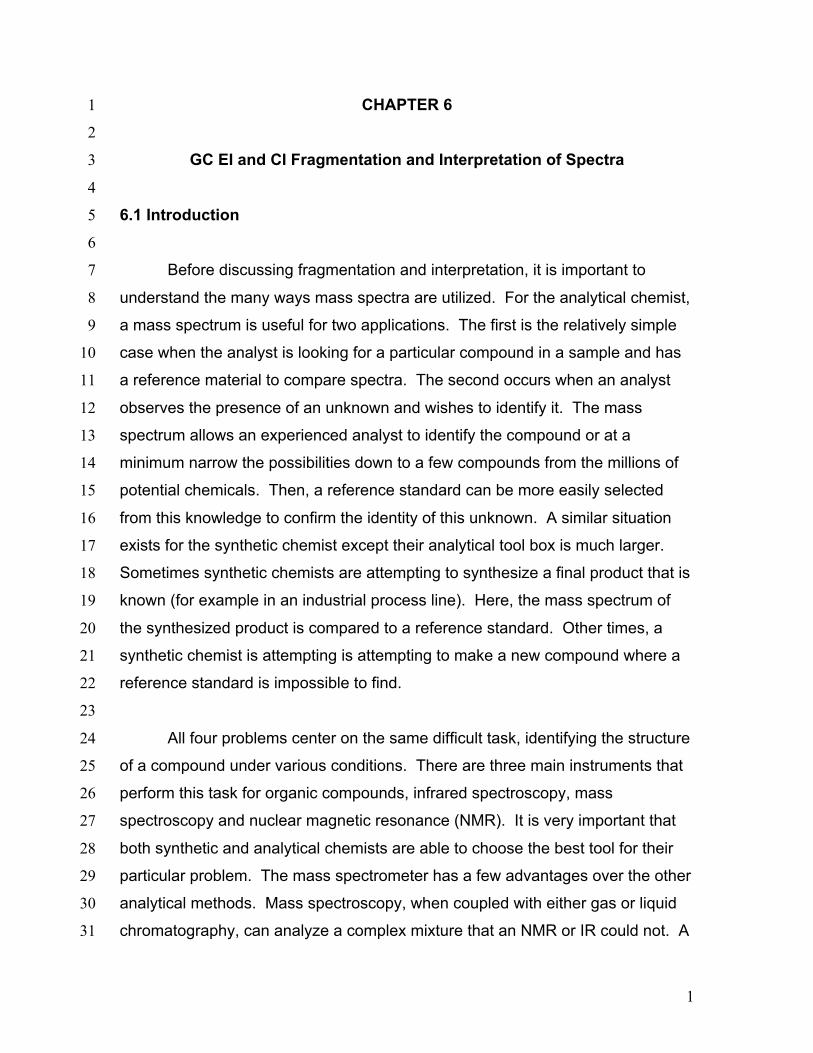
However, some isotopes are so prominent that they can easily be 6
observed with a quadrupole mass spectrophotometer with unit resolution. 7
Chlorine, bromine, and sulfur can all be identified by their isotopic rations. Their 8
exact isotopic ratios are summarized in Table 2.1. Compounds containing 9
chlorine have a M+2 peak that is 25% of the molecular ion (Figure 2.5a). 10
Compounds containing bromine have a M+2 peak that is approximately the same 11
height as a M+ peak (Figure 2.5b). Compounds containing sulfur have an 12
unusually large M+2 (Figure 2.5c). 13
14
Table 2.1 Isotopic Abundances of Common Elements 15
Element M+ M + 1 M + 2
hydrogen 1H 100.0%
carbon 12C 98.9% 13C 1.1%
nitrogen 14N 99.6% 15N 0.4%
oxygen 16O 99.8% 18O 0.2%
sulfur 32S 95.0% 33S 0.8% 34S 4.2%
chlorine 35Cl 75.5% 37Cl 24.5 %
bromine 79Br 50.5% 81Br 49.5%
iodine 127I 100.0%
16

15
1 Figure 2.5A of Ethyl Chloride illustrates the presence of a M++2 peak that is 2
about 25% of the M+ peak. 3
4
5 Figure 2.5B of bromoethane has a characteristic M+2 peak that has a similar 6
intensity as the M+ peak. 7

16
1 Figure 2.5C of 2-Propanethiol contains a larger than usual M+2 peak, a pattern 2
observable in sulfur containing compounds. 3
4
Figure 2.5 Isotopic Identification 5
Spectra from the NIST/EPA/NIH Mass Spectral Library. Reprinted with 6
permission from NIST. 7
8
Compounds can also contain any combination of multiple chlorine and 9
bromine atoms. These samples will produce distinct peaks due to the various 10
combinations of the isotopes. A compound containing two bromines will have a 11
M+2 peak twice the size of the M+ peak and a M+4 peak the same size as the 12
M+ peak (Figure 2.6a). A compound containing two chlorines will have a M+2 13
peak that is two thirds the size of the M+ peak and a M+4 peak that is ten percent 14
of the molecular ion (Figure 2.6b). 15
16

17
1 Figure 2.6A shows the mass spectrum the dibrominated compound 1,3-2
dibromopropane. 3
4 Figure 2.6B shows the mass spectrum of the dichlorinated compound 1,2-5
dichloroethane. 6
7

18
Figure 2.6 Polybrominated and Polychlorinated Compounds 1
Spectra from the NIST/EPA/NIH Mass Spectral Library. Reprinted with 2
permission from NIST. 3
4
Iodine is more difficult to detect because it is one of the few compounds 5
that is monoisotopic. Despite this fact, the large atomic mass of iodine allows for 6
its identification. The combination of a peak at m/z 127 (I+) and a large gap of 7
127 mass units between fragments containing iodine and fragments lacking in 8
iodine allows for the compounds identification (Figure 2.7). 9
10
11
12 Figure 2.7 Mass Spectrum Containing Iodine 13
Spectra from the NIST/EPA/NIH Mass Spectral Library. Reprinted with 14
permission from NIST. 15
16
2.6 Fragmentation 17
18

19
While the molecular ion is one of the most important peaks in the spectra, 1
it is also important to gain information from the peaks that are a result of 2
fragmentation. The goal of interpreting mass spectra is identifying the structure 3
of the molecular ion by examining pieces (fragments) of the original molecule. 4
The frequency and size of the fragments is dependent on the structure and bond 5
energy of the sample molecule. This property has resulted in the creation of 6
unique and reproducible spectrum for a wide variety of compounds. 7
8
Before fragmentation can be discussed, it is necessary to develop a new 9
notation because the cation fragments that will be encountered are not present in 10
other branches of chemistry due to their high reactivity. The presence of the 11
vacuum in the instrument prevents collisions with other molecules allowing these 12
reactive cations to exist. The academic convention for notation is to either 13
represent the charge as a delocalized one (Example A below) or localized it on 14
either a π bond (Example B) or on a heteroatom (Example C). 15
16
a) b) c) 17
18
The process that creates these observed fragments is the result with their 19
interaction with the energy released from the source. This energy both removes 20
a single electron, while the excess energy is distributed over various degrees of 21
freedom. This distribution converts electronic energy into electronic, rotational, 22
and vibration energy. The molecular ion is created when the sample molecule 23
returns to its ground state via a relaxation. Other times this energy exceeds the 24
activation energy of fragmentation and this energy is released via the breaking of 25
bonds. 26
27
e- + R – R’ [R – R’] ·+ + 2e- 28
[R – R’] ·+ R · + R’+ 29
[R – R’] ·+ R + + R’· 30

20
1
The fragmentation of a single bond can produce two peaks, one from R + 2
and the other from R’ +, since the instrument can only detect the positive ion. 3
According to Stevenson’s rule, if two fragments are in competition to produce a 4
cation, the fragment with the lowest ionization energy will be formed more 5
frequently (Figure 2.8). 6
7
8 Figure 2.8 An Illustration of Stevenson’s Rule 9
Spectra from the NIST/EPA/NIH Mass Spectral Library. Reprinted with 10
permission from NIST. 11
12
The fragmentation of a bond can proceed through two pathways, either 13
homolytic or heterolytic cleavage. In the heterolytic cleavage, a pair of electrons 14
move towards the charged site as illustrated by the double headed arrow 15
producing a cation and a radical. 16

21
1
2 3
The fragmentation produced by a hemolytic cleavage results from the 4
movement of single electrons. 5
6
7 8
For simplicity, usually only one set of arrows is drawn to illustrate the 9
movement of electrons. 10
11
12 13
These fragmentation patterns are usually the result of a functional group 14
contained in the compound. As a result, the bonds that typically break are either 15
located one, or two carbon atoms away from the functional group. These carbon 16
atoms are referred to as the α and β atoms. 17
18
19 20
The bond between the functional group Y and the α carbon is called the α 21
bond and the bond between the α and β carbons is the β bond. 22
23
2.7 Rearrangements 24
25

22
Some fragments are the result of the cleavage of multiple bonds. The 1
removal of water from an alcohol is only one example. The nitrogen rule (Figure 2
2.3) is helpful in identifying peaks that are produced via a rearrangement. If a 3
molecular ion has an even molecular weight then generally peaks of even 4
molecular weight were created from a rearrangement. If a molecule has an odd 5
molecular weight, then its rearrangements peaks will also be odd. 6
7
One rearrangement is the loss of water from a primary alcohol. The 8
mechanism is illustrated with butanol. 9
10
11 12
These rearrangements are favored because the low energy transitions 13
help stabilize the products. Other rearrangements such as the McLafferty 14
rearrangement will be explored in greater detail in the following sections. 15
16
2.8 Identification of Compounds 17
18
The ability to identify unknown samples is one of the most powerful uses 19
of a mass spectrometer. This, however, requires an understanding of 20
fractionation patterns for commonly encountered compounds. The following 21
trends are only applicable to electron impact with a source at 70 eV. These 22
trends are not comprehensive but are rather a selection of common fragments 23
that are most useful in properly identifying common types of organic chemicals. 24
The actual likelihood of fragmentation is related to the activation energy of 25
the reaction, the ability for rearrangements to occur, and the stability of the 26
products. Trends that were observed in organic chemistry are helpful in 27
predicting fragmentation patterns. Thinking about the stability of the products as 28

23
more or less stable cations and radicals is not entirely theoretically accurate but 1
is usually a good, practical way to predict the spectrum of a molecule. 2
3
2.9 Fragmentation of Hydrocarbons 4
5
There are two types of hydrocarbons that are analyzed with the GC-MS. 6
One is long chain hydrocarbons and the other is the hydrocarbon portion of 7
molecules containing other functional groups. Identifying the structure of these 8
hydrocarbons can be difficult since rearrangements that are not easily explained 9
are frequently observed. It is especially important to utilize reference compounds 10
and GC retention times whenever possible to confirm the identity of the 11
compound. 12
13
2.9.1 Fragmentation of Straight Chain Alkanes 14
15
Straight chain alkanes always produce a molecular ion even in long chain 16
compounds where the molecular ion is usually faint. The base peak in the 17
spectra is usually the peak at m/z 57 corresponding to the C4H9 carbocation 18
surrounded by other smaller peaks due to the rearrangement of hydrogen atoms. 19
These groups are separated by 14 mass units resulting from the loss of another 20
CH2 group. The largest peak in each cluster is caused by the loss of (CH2)nCH3 21
resulting in a fragment of molecular formula CmH2m+1. The subsequent fragments 22
after the C4 peak decrease in an exponential fashion to a minimum at M-C2H5. 23
The M – CH3 peak is weak in smaller compounds and absent in long chain 24
compounds due to the relative instability of the methyl radical. The molecular ion 25
is the unique identifiable peak in straight chain alkanes longer than eight carbon 26
atoms. 27
28

24
1
2 Figure 2.9 Fragmentation of a straight Chain Alkane 3
Spectra from the NIST/EPA/NIH Mass Spectral Library. Reprinted with 4
permission from NIST. 5
6
The example illustrated in Figure 2.9 illustrates these common trends 7
discussed above. The prominent peaks at CmH2m+1 combined with the decaying 8
intensity of these peaks indicates this compound is an alkane. The base peak at 9
m/z 57 caused by C4H9 is further confirmation that there is a lack of other 10
functional groups causing other prominent fragments. The molecular ion at m/z 11
170 indicates that this compound is dodecane. 12
13
2.9.2 Fragmentation of Branched Alkanes 14
15
Branched alkanes have a smaller molecular ion that at times may be 16
absent in highly branched compounds. In larger compounds branched alkanes 17
contain peaks at CmH2m+1, similar to straight chain alkanes. They are 18
distinguished by the lack of the smooth exponential decay beginning at the C3 or 19

25
C4 carbon (Figure 2.9). This is caused by the increased frequency of 1
fractionation at the branch since it results in a secondary rather than a primary 2
carbocation and is hence favored. The loss of the largest alkyl fragment at the 3
brancing cite is favored because it helps to stabilize the radical. 4
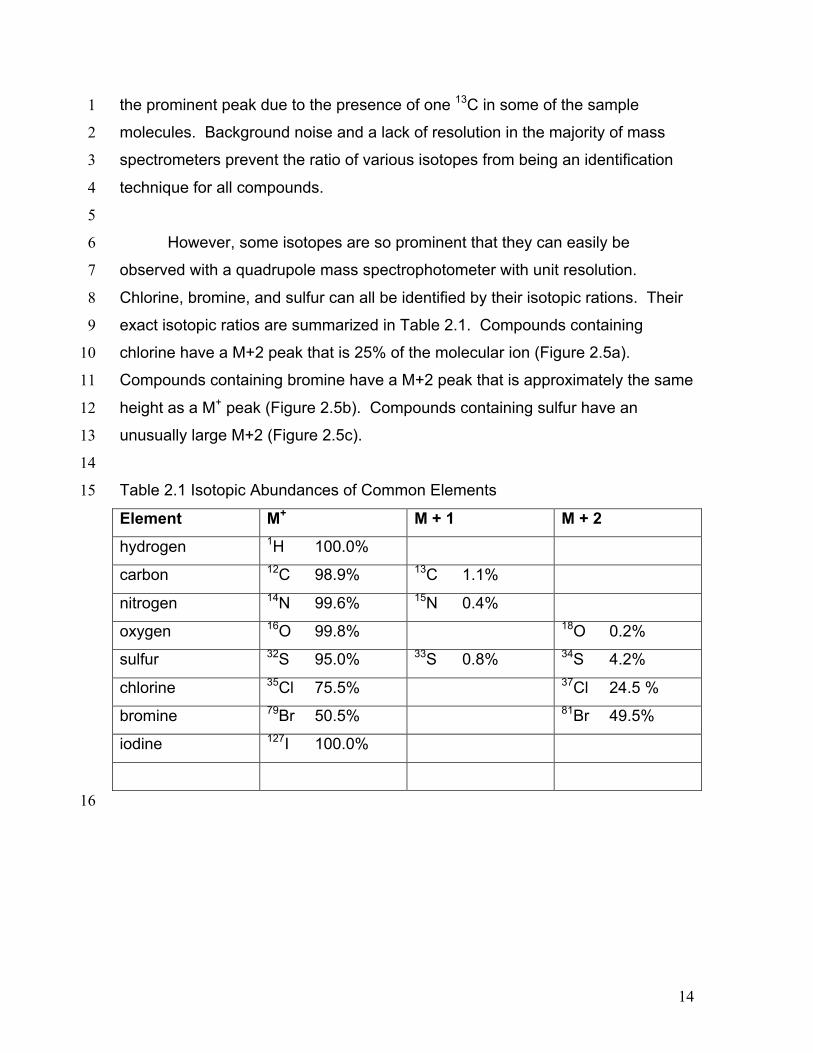
5 This mass spectrum of a C12 alkane (determined from the molecular ion by CI at 6
m/z 170) lacks the exponential decay seen in Figure 2.9 indicating the chain is 7
branched. The intensity of the peak at m/z 71 indicates a favored C5 fragment 8
and the fragment at m/z 127 indicates a favored C9 fragment suggesting that a 9
methyl group on fourth carbon. 10
26
1 Figure 2.10 Fragmentation of a Branched Alkane 2
Spectra from the NIST/EPA/NIH Mass Spectral Library. Reprinted with 3
permission from NIST. 4
5
The fragmentation at the branching point is often accompanied by 6
hydrogen rearrangement causing the CnH2n peak to be more prominent and 7
sometimes larger than CnH2n+1 peak. 8
Identifying branched alkanes in organic compounds that contain another 9
functional group is also an important task. The alkane portion of these molecules 10
is usually smaller and is more goverened by the stability of the produced radical 11
and cation. Since an ethyl radical is more unstable than a methyl radical, the 12
methyl radical will occur less frequently. Similarly, tertiary carbocations are more 13
stable than secondary, which are more stable than primary. As the alkane 14
portion of any molecule becomes larger, the presence of the CnH2n+1 peaks 15
become more prominent. 16
17
2.9.3 Fragmentation of Cyclic Alkanes 18

27
1
The ring structure of cyclic alkanes increases the intensity of the molecular 2
ion. Its stability also increases the likelihood that side chains will fragment at the 3
ά bond to the ring. The fragmentation of the cyclic structure is usually most often 4
caused by the loss of more than two carbon atoms. The loss of a methyl radical 5
occurs less frequently because of the instability of the methyl radical in 6
comparison to the neutral ethylene molecule at M-28 or an ethyl radical at M-29. 7
8
9
10 Figure 2.11 Fragmentation of a Cyclic Alkane 11
Spectra from the NIST/EPA/NIH Mass Spectral Library. Reprinted with 12
permission from NIST. 13
14

28
2.9.4 Fragmentation of Alkenes 1
2
The molecular ion of alkenes, is usually distinct especially in compounds 3
containing multiple double bonds. Alkene fragments, like alkane fragments are 4
situated in clusters 14 units apart. In alkenes, the CnH2n-1 and CnH2n peaks are 5
more intense than the CnH2n+1 peak of alkanes. 6
7
The presence of double bonds also allows for the production of 8
resonance-stabilized cations. Allylic cleavage results in an allylic cation. 9
10
11 12
Determining the position of the double bonds in the sample molecule is 13
especially difficult and usually requires reference spectra because of double 14
bonds migration. Cyclic alkenes also undergo a retro-Diels-Alder fragmentation 15
by the following mechanism. 16
17
18 19
2.9.5 Fragmentation of Aromatics 20
21
The presence of an aromatic ring in a compound results in a prominent 22
molecular ion. A common peak at M – 1 results from the cleavage of a hydrogen 23
molecule from the benzene ring. Alkyl substituted benzene rings result in a 24
prominent peak at m/z 91 (Figure 2.12). In most cases, the peak at m/z 91 is the 25
result of a tropylium ion caused by the following rearrangement. 26
27

29
1 2
The peak observed in most aromatic compounds at m/z 65 results from 3
the elimination of an acetylene molecule from the tropylium ion. 4
5
6 7
Benzene rings with highly branched substituted groups produce fragments 8
larger than m/z 91 by intervals of 14 units. The largest of these peaks will result 9
in a highly substituted cations and a large radical, like a simpler branched 10
alkanes. The fragment at m/z 105 in Figure 2.12 is relatively small since it 11
produces a primary carbocation and an unstable methyl radical. Substituted 12
benzene rings also first undergo ά cleavage followed by hydrogen rearrangement 13
producing a grouping of peaks at m/z 77 from C6H5+, m/z 78 from C6H6
+, and m/z 14
79 from C6H7+. 15
16

30
1 Figure 2.12 Fragmentation of an Aromatic 2
Spectra from the NIST/EPA/NIH Mass Spectral Library. Reprinted with 3
permission from NIST. 4
5
Side chains with a more than two carbon atoms create a peak at m/z 92 6
(Figure 2.12). Unbranched groups result in a more prevalent peak than do 7
branched groups. 8
9
10 11
2.10 Fragmentation of Alcohols 12
13
The molecular ion of alcohols is usually small and sometimes 14
undetectable especially in tertiary alcohols. The identification of the molecular 15

31
ion is complicated by the prevalence of a M-1 peak caused by the loss of a single 1
hydrogen from the α carbon in primary and secondary alcohols. 2
3
Alcohols also frequently cleave to give resonance stabilized cations due to 4
the breaking of the β bond. As a result of this clevage, primary alcohols show a 5
prominent peak at m/z 31 (Figure 2.13). 6
7
8 9
The presence of a m/z 31 peak is not confirmation of a primary alcohol. It 10
is necessary for the peak to be relatively large in comparison to other peaks in 11
the spectrum. This is because secondary alcohols and sometimes even tertiary 12
alcohols can undergo a rearrangement resulting in a peak at m/z 31. 13
14
15 16
32
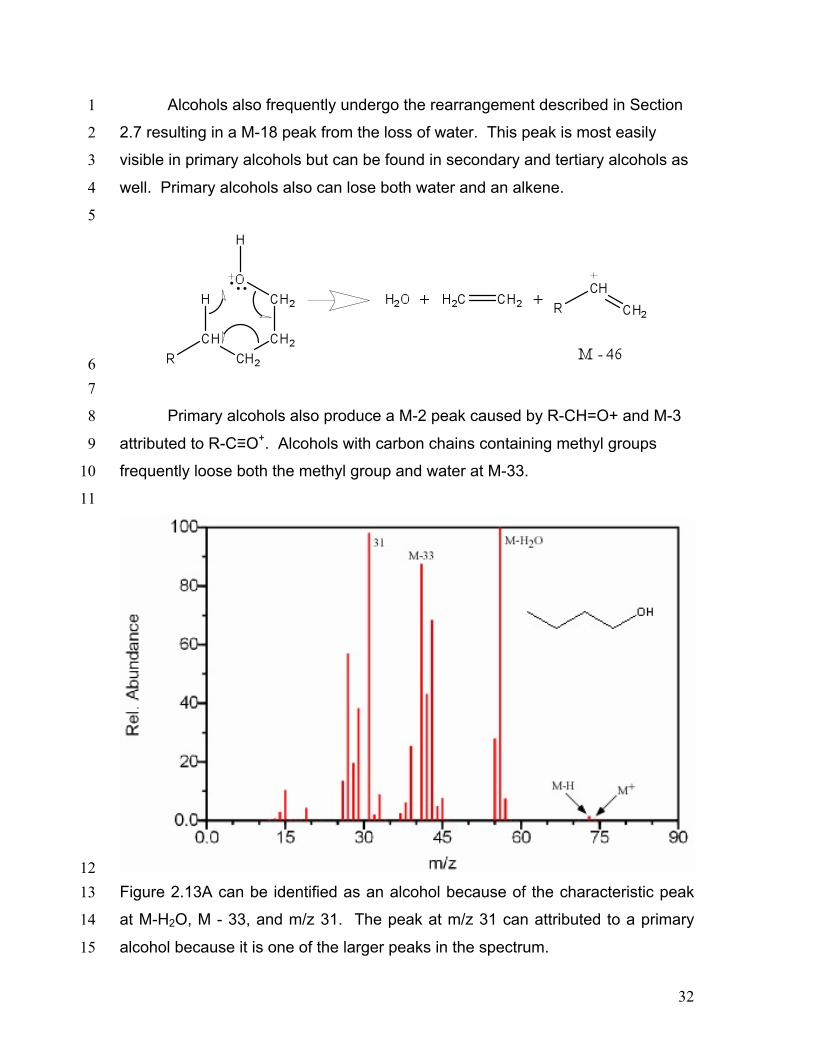
Alcohols also frequently undergo the rearrangement described in Section 1
2.7 resulting in a M-18 peak from the loss of water. This peak is most easily 2
visible in primary alcohols but can be found in secondary and tertiary alcohols as 3
well. Primary alcohols also can lose both water and an alkene. 4
5
6 7
Primary alcohols also produce a M-2 peak caused by R-CH=O+ and M-3 8
attributed to R-C≡O+. Alcohols with carbon chains containing methyl groups 9
frequently loose both the methyl group and water at M-33. 10
11
12 Figure 2.13A can be identified as an alcohol because of the characteristic peak 13
at M-H2O, M - 33, and m/z 31. The peak at m/z 31 can attributed to a primary 14
alcohol because it is one of the larger peaks in the spectrum. 15

33
1 Figure 2.13B has a small peak at m/z 31 but the base peak in the spectrum 2
indicates that this alcohol is not a primary alcohol. The presence of a M - Et and 3
M - CH3 peak indicates that this four carbon alcohol (determined from its 4
molecular mass) is the secondary alcohol 2-butanol. 5
6

34
Figure 2.13C illustrates trends common to tertiary alcohols. The spectrum is 1
easily discernable since the single prevalent peak is characterized by M - CH3. 2
The lack of a molecular ion helps to confirm the spectrum of a 3
tertiary alcohol. 4
5
Figure 2.13 Fragmentation of Three Alcohols 6
Spectra from the NIST/EPA/NIH Mass Spectral Library. Reprinted with 7
permission from NIST. 8
9
Cyclic alcohols fragment similar to straight chain alcohols in that they give 10
a M-1 peak from the loss of hydrogen and an M-18 peak from the loss of water. 11
They also create a peak at m/z 57 via a complex ring cleavage. 12
13
Aromatic alcohols, unlike other alcohols, have a prominent molecular ion 14
peak due to the stability of the aromatic group. Phenols usually give a weaker 15
peak at m/z 77 attributed to a rearrangement and can be identified by two peaks 16
at M – CO and M - COH. 17
18
19
20 21
2.11 Fragmentation of Ketones and Aldehydes 22
23

35
Both ketones and aldehydes give prominent molecular ion peaks though 1
the M+ peak is more prominent in ketones. The majority of compounds in these 2
categories undergo an important rearrangement, the McLafferty rearrangement. 3
4
5 6
This rearrangement is mediated by the p systems of the carbonyle group 7
but can occur in other p systems such as in nitriles (Section 2.17). The only 8
ketones and aldehydes that do not undergo this rearrangement lack a three-9
carbon side chain allowing for the necessary hydrogen donation. 10
11
2.11.1 Ketones 12
13
One major fragment of ketones is the creation of the resonance stabilized 14
acylium ion resulting from the cleavage of the ά bond. The base peak in the 15
spectrum is usually caused by the removal of the larger alkyl group since it forms 16
a more stable radical illustrated by 4-Octanone (Figure 2.14). 17
18

36
1 2
While ketones undergo a single McLafferty rearrangement 3
described above, they also undergo a subsequent McLafferty rearrangement. 4
5

37
1
2 3
The second rearrangement is mediated by the p system of the alkene 4
group. The ketone functional group is often easily discernable due to the 5
prevalent fragments and rearrangements described above. The configuration of 6
the carbon structure can be difficult to discern. Reduction of the carbonyl group 7
to a methylene group is commonly performed to determine the complete 8
structure of the molecule. 9
10

38
1 Figure 2.14 Fragmentation of a Ketone 2
Spectra from the NIST/EPA/NIH Mass Spectral Library. Reprinted with 3
permission from NIST. 4
5
The base peak in Figure 2.14 is the result of a McLafferty rearrangement 6
and an α cleavage. 7
8
9 10
2.11.2 Fragmentation of Cyclic Ketones 11
12
Cyclic ketones major cleavage is also at the ά bond. Due to the ring 13
structure, this cleavage will be detected as the molecular ion unless another 14

39
bond is broken. Saturated cyclic ketones produce a fragment at m/z 55 1
illustrated by cyclohexanone. 2
3
4 5
In cyclohexanone, this peak is the base peak. In absence of a reference 6
standard, cyclic ketones are difficult to identify given the difficulty explained 7
earlier in determining the composition of the alkyl portion of the ketone. 8
9
2.11.3 Fragmentation of Aromatic Ketones 10
11
Aromatic ketones create fragments via almost identical pathways as 12
aliphatic ketones. One prominent peak, and usually the base peak, is the result 13
of the cleavage of the less stable alkyl fragment resulting in the ArC≡O fragment 14
located at m/z 105. The alpha cleavage resulting in a benzyl radical is 15
infrequent given the stability of the competing reaction (Figure 2.15). 16
17

40
1
2 3
The cleavage of the bond α to the aromatic group results in a peak at m/z 4
77. 5
6
7 8
Further fragmentation results in a peak at m/z 55 after the loss of HC≡CH 9
Some aromatic ketones undergo the typical McLafferty rearrangement if the 10
other alkyl component contains an abstractable hydrogen atom. 11
12

41
1 2
3
4 Figure 2.15 Fragmentation of a Cyclic Ketone 5
Spectra from the NIST/EPA/NIH Mass Spectral Library. Reprinted with 6
permission from NIST. 7
8
2.11.4 Fragmentation of Aldehydes 9
10
The major peaks observed in spectrums of aldehyde are the result of the 11
same ά cleavage as in ketones. This fragmentation results in an M-1 peak and a 12
peak at M-R from the COH+ ion. The presence of an M-1 peak helps to identify 13
the aldehyde but the hydrocarbon rearrangement at C2H5 prevents the M-R (m/z 14
29) peak from being truly useful. Another prominent peak is the McLafferty 15

42
rearrangement located at m/z 44. The only aldehydes that do not contain this 1
peak are ones that lack an the necessary hydrogen atom for this rearrangement. 2
3
Straight chain aldehydes have unique features that help in identification. 4
These compounds will have a M - 18 fragment from the loose of water, M – 28 5
from the loss of ethylene, M – 43 loss of CH2=CH–O and M – 44 from the loss of 6
CH2=CH–OH (Figure 2.16). 7
8
9 Figure 2.16 Fragmentation of an Aldehyde 10
Spectra from the NIST/EPA/NIH Mass Spectral Library. Reprinted with 11
permission from NIST. 12
13
The patterns resulting from aromatic ketones are almost identical to those 14
governing aromatic aldehydes. The characteristic molecular ion is accompanied 15
by a M-1 peak from the loss of hydrogen. The ArC≡O fragment looses CO to 16
form the phenyl ion at m/z 77 that further degrades to give a peak at m/z 51. 17
18
2.12 Fragmentation of Carboxylic Acids 19

43
1
The molecular ion of straight chain carboxylic acids is weak but usually 2
present. The prominent and often times the base peak results from the 3
McLafferty rearrangement. 4
5
6 7
Short chain carboxylic acids give prevalent peaks at M – OH and M – 8
CO2H. In larger carboxylic acids these peaks are less prevalent. Long chain 9
carboxylic acids are better identified by the fragments at CnH2n-1O2 (Figure2.17). 10
There is also the presence of the hydrocarbon fragment at CmH2m+1 illustrated in 11
Section 2.9. 12
13
14 Figure 2.17 Fragmentation of a Carboxylic Acid 15

44
Spectra from the NIST/EPA/NIH Mass Spectral Library. Reprinted with 1
permission from NIST. 2
3
Aromatic acids have a more prominent molecular ion peak but undergo 4
similar fractionation to short chain hydrocarbons. They produce large peaks at M 5
– OH and M – CO2H. Aromatic acids can also loose water if an ortho group 6
contains an abstractable hydrogen atom. 7
8
9 10
2.13 Fragmentation of Ethers 11
12
The molecular ion peak is usually weak in ethers. The oxygem atom 13
mediates the major fragment and creates a β cleavage that results in a 14
resonance stabilized cation. This peaks is prominent and sometimes are the 15
base peak. 16
17
18 19
The fragment can also undergo a subsequent rearrangement which 20
typically creates the base peak when the ά carbon is substituted. 21
22

45
1 2
Ethers also produce prominent alkyl fragments when the C–O bond (α 3
bond) is broken and the fragment containing oxygen is a radical. 4
5
6 7
8 Figure 2.18 Fragmentation of an Ether 9
Spectra from the NIST/EPA/NIH Mass Spectral Library. Reprinted with 10
permission from NIST. 11
12

46
The base peak in Figure 2.18 is the result of both a β cleavage and the 1
above rearrangement. 2
3
4 5
Aromatic ethers have a slightly different pattern of fragmentation. They 6
produce prominent molecular ions due to the stability of the benzene ring. The 7
major fractionation occurs at the β bond to the aromatic ring. This fragment can 8
decompose further with the loss of CO. 9
10
11 12
Aromatic ethers also cleave at the bond ά to the ring to create a peak at 13
m/z 78 and 77 due to hydrogen migration. 14
15
16 17

47
When the alkyl portion of the sample is larger than two carbons, the β is 1
accompanied by hydrogen migration caused by the presence of the aromatic 2
group. This cleavage results in a peak located at m/z 94. 3
4
5 6
2.14 Fragmentation of Esters 7
8
The molecular ion peak of straight chain esters is sometimes discernable. 9
A prevalent peak and often the base peak results from the familiar McLafferty 10
rearrangement. The size of the alcohol that formed the ester and the presence 11
of ά substituents can normally be discerned by the mass of these two peaks. 12
13
14 15
The cleavage of the above bonds results in other fragments, however 16
these peaks are too small to be of great significance. For example, hexanoic 17
acid methyl ester produces the following fragments. 18
19
20

48
1 2
The resonance stabilized ion gives a discernable peak for 3
almost all esters. The R’+ ion is prominent in short chain esters but is barely 4
visible in esters with more than six carbon atoms. For hexanoic acid methyl 5
ester, the R’+ ion is only 9.5% of the base peak. 6
7
Until this point, this chapter has covered individual functional groups in 8
isolation. Since esters have both an alcohol and an acid component, 9
fractionation patterns can be observed from both of these types of compounds. 10
The prevalence of the fragments described earlier is dependent on the size of 11
each part of the ester. The increased size of each portion results in a unique 12
rearrangement. 13
14
When the acid portion is the major component like in hexanoic acid methyl 15
ester, the fractionation pattern is partially characterized by typical acid peaks. 16
For these straight chain esters, cleavage of successive carbon atoms gives an 17
alkyl fragment and a fragment containing oxygen. This pattern results in the 18
familiar grouping of fragments spaced 14 units apart with the largest fragment in 19
the cluster resulting from the CnH2n-1O2 ion (Figure 2.19). 20
21

49
1 Figure 2.19 Fragmentation of an Ester 2
Spectra from the NIST/EPA/NIH Mass Spectral Library. Reprinted with 3
permission from NIST. 4
5
The base peak in Figure 2.19 is a result of the McLafferty rearrangement. 6
7
8 9
When the alcohol portion of the ester is the prominent portion of the ester, 10
fragments similar to that of an alcohol is observed. These esters will loose a 11
molecule of acid like alcohols loose a molecule of water. 12
13

50
1 2
Like alcohols, the prevalence of this rearrangement is so frequent that the 3
molecular ion is normally absent from the spectra. These long chain alcohols will 4
also loose the alkyl fragment from the alcohol accompanied by two hydrogen 5
migration. 6
7
8 9
10
In aromatic esters, the molecular ion is prominent due to the aromatic 11
group. There are two distinctive types of aromatic esters that have their own 12
unique fractionation patterns. Esters synthesized from aromatic acids mostly 13
undergo ά cleavages. 14
15

51
1 2
The loss of ·OR results in the base peak because of the multiple 3
resonance forms stabilizing the cation. When the alkyl portion of the alcohol 4
becomes longer, the McLafferty rearrangement and the loss of R with two 5
hydrogen migrations explained above is more favorable. Increasing the size of 6
the R chain will cause the alkyl portion to retain the charge. 7
8
9 10
The presence of an aromatic group in the alcohol that formed the ester 11
results in the creation of the CH3C≡O+ ion. These esters also undergo a 12
rearrangement that results in the loss of a ketene molecule. 13
14
15 16
2.15 Fragmentation of Amines 17
18
The presence of nitrogen in an amine can be detected by its odd 19
molecular weight and the even fragments that it produces (Section 2.3). Often 20

52
times the presence of the molecular ion in longer straight chain amines is not 1
detectable. In these cases, chemical ionization techniques are often used in 2
determining the molecular mass in order to determine the presence of nitrogen. 3
4
The base peak in most amines results from the cleavage of the β bond. 5
The loss of the largest branch (R”) is preferred because the larger alkly fragment 6
stabilizes the produced radical. 7
8
9 10
Like alcohols, if the ά carbon is bonded to a hydrogen atom, a M – H peak 11
is usually visible. In primary amines with an unbranched ά carbon, cleavage of 12
the β bond produces a peak at m/z 30. This peak is not conclusive proof of a 13
primary amine because secondary and tertiary amines undergo a rearrangement 14
similar to that of alcohols. 15
16
17 18
Amines also produce even fragments caused the cleavage of C – C bonds 19
farther away from the functional group. The fragment containing the nitrogen 20
group usually retains the charge resulting at peaks characterized by CnH2n+2N 21
spaced at 14 units. There is also the less prevalent hydrocarbon pattern of 22
CnH2n+1, CnH2n, and CnH2n-1. 23

53
1
2

54
1 2
Figure 2.20 Fragmentation of Three Amines - The mass spectrum is easily 3
recognized as an amine due to its odd molecular ion and the presence of even 4
fragments. The base peak in each spectrum, due to b cleavage distinguishes 5
between the primary, secondary, and tertiary amine. 6
Spectra from the NIST/EPA/NIH Mass Spectral Library. Reprinted with 7
permission from NIST. 8
9
Cyclic amines produce a discernable molecular ion peak unless the ά 10
carbon is substituted. The loss of hydrogen from the ά carbon is also a 11
prominent peak. The ring is cleaved when the β bond is broken and subsequent 12
alkene molecules fragment from the remaining ring structure. 13
14
The molecular ion of an aromatic amine is expectedly intense. The loss of 15
the hydrogen atom bonded to the nitrogen gives a prominent peak at M – 1. 16
Similar to ethers, the loss of HCN from the aniline ion produces peaks at C5H6 17
and C5H5. Unlike ethers however, the hetero atom not the aromatic group 18
controls the major pathways of fractionation resulting in β cleavage. 19
55
1
2 3
2.16 Fractionation of Amides 4
5
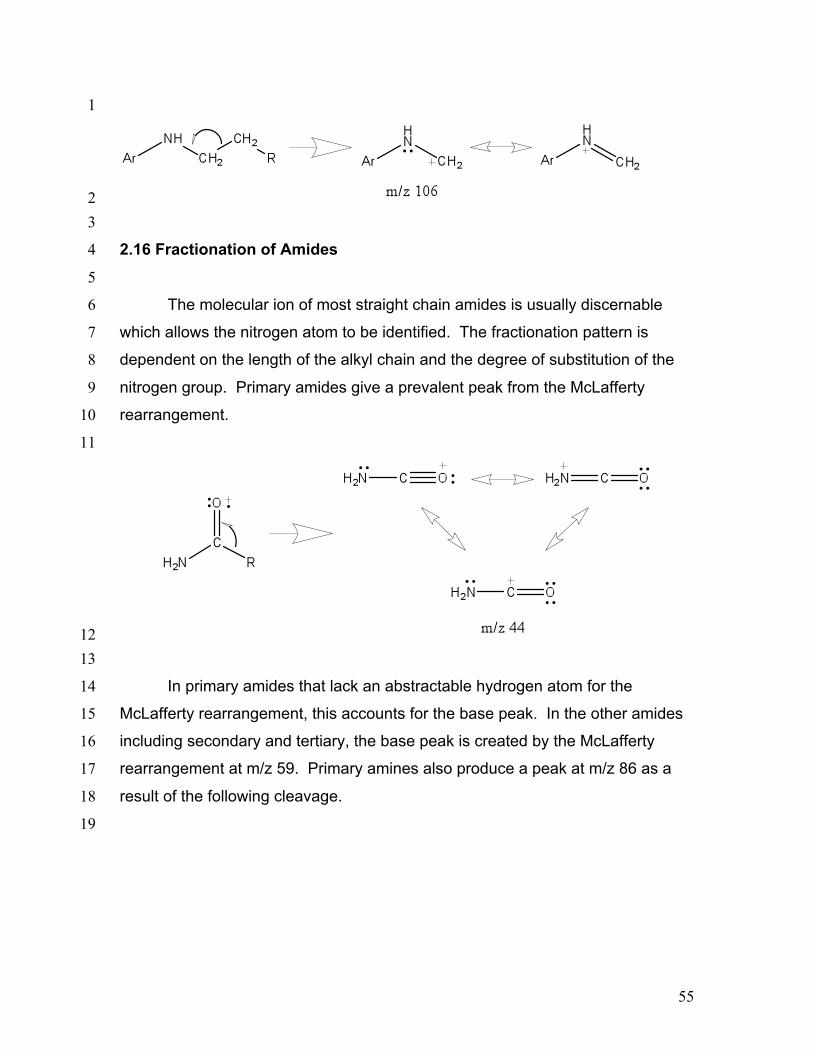
The molecular ion of most straight chain amides is usually discernable 6
which allows the nitrogen atom to be identified. The fractionation pattern is 7
dependent on the length of the alkyl chain and the degree of substitution of the 8
nitrogen group. Primary amides give a prevalent peak from the McLafferty 9
rearrangement. 10
11
12 13
In primary amides that lack an abstractable hydrogen atom for the 14
McLafferty rearrangement, this accounts for the base peak. In the other amides 15
including secondary and tertiary, the base peak is created by the McLafferty 16
rearrangement at m/z 59. Primary amines also produce a peak at m/z 86 as a 17
result of the following cleavage. 18
19

56
1 2
When the alkyl groups bonded to the nitrogen are longer than two 3
carbons, another rearrangement is discernable. 4
5
6 7
Aromatic amides have a more prominent molecular ion peak. The 8
common fragments are characterized by the loss of NR2 to form a resonance 9
stabilized cation followed by the subsequent loss of CO. 10
11
12 13
2.17 Fragmentation of Nitriles 14
15
The presence of the nitrogen can usually be identified by the odd 16
molecular weight according to the nitrogen rule (Section 2.3). This identification 17
technique is usually unable to identify a nitrile because these compounds lack a 18
molecular ion. The presence of a M-1 peak complicates the identification of the 19

57
molecular ion. This peak is formed by a loss of an α hydrogen to form a 1
resonance stabilized cation. 2
3
4 5
A prominent and frequent base peak is the result of the McLafferty 6
rearrangement at m/z 41 in compounds whose α carbon is not branched. This 7
peak, however, is unable to confirm that a compound is a nitrile because 8
hydrocarbon chains frequently form a peak at C3H5. 9
10
11 12
A unique peak at m/z 97 is characteristic of nitriles that contain a straight 13
chain of seven carbons or more. 14
15
16 17
2.18 Reviewing General Principals 18
19
58
After surveying common compounds encountered in organic chemistry 1
and their corresponding spectra we are able to make some generalizations about 2
fractionation patterns. When dealing with a compound’s molecular ion; 3
4
1. The molecular ion of ethers, carboxylic acids, aldehydes, and nitrogen 5
containing molecules such as amides and nitriles can be very faint or 6
potentially absent. The molecular ion of alcohols and branched 7
compounds is almost always undetected. 8
2. Increasing a compound’s size or the branching of the alkly portion will 9
decrease the intensity of the molecular ion. 10
3. Cyclic structures, elements of unsaturation, and aromatic groups increase 11
the intensity of the molecular ion. 12
13
Unknown compounds, in the absence of a reference standard, can often be 14
more difficult but not impossible to discern given the prevalence of multiple 15
fragments. The majority of compounds, however, will abide by the following 16
rules. 17
18
1. Resonance stabilized cations are favored because they help delocalize 19
the positive charge throughout the molecule. 20
2. The cleavage of bonds is favored at substituted carbon atoms that 21
produce the most stable cation. As a result, tertiary cations are favored 22
over secondary which are favored over primary which are more stable 23
than CH3+. 24
3. The longest chain is eliminated most frequently because the greater 25
number of carbon atoms allows for the delocalization of the radical. 26
4. The combination of rule two and three can be good predictors of the 27
prevalence of fragments. Achieving a balance between the stability of the 28
radical and the cation produces the most prevalent peaks. The following 29
example illustrates this point. 30

59
1
2 5. The β bond to the heteroatom is frequently broken since the heteroatom’s 3
non bonding electrons allow for resonance forms that stabilize the cation. 4
6. Rearrangements account for prominent peaks in the spectrum such as the 5
loss of water from an alcohol or the McLafferty rearrangement. 6
7
Besides having a general set of guidelines that govern general fractionation, it 8
is also important to be able to identify patterns that are indicative of particular 9
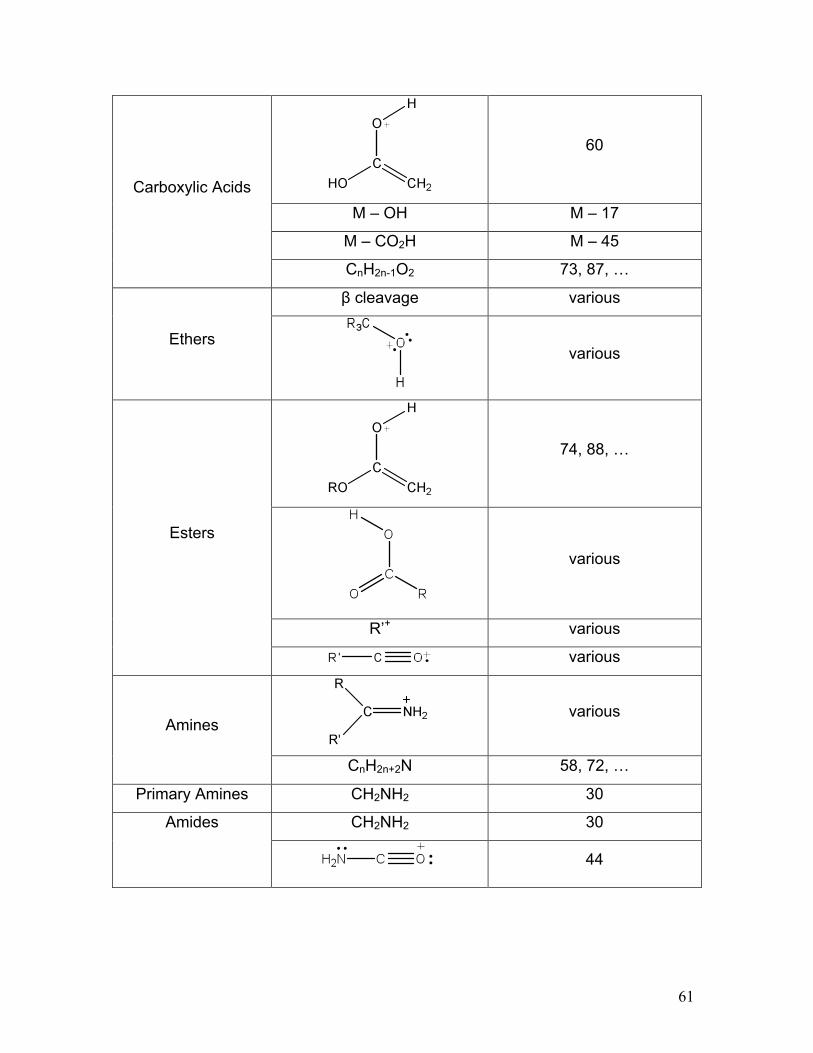
functional groups. As a result, a condensed table of the commonly observed 10
fragmentation patterns is listed in the table below. 11
12
Table 2.2 A Review of Common Fragmentation Patterns 13
Functional Group Observed Fragments M/Z Value
CnH2n+1 43, 57, 71, …
M – CH3 M – 15
M – CH2CH3 M – 29
Straight Chain
Alkanes
M – CH2CH2CH3 M – 43
Branched Alkanes CnH2n Various
Cyclic Alkanes M – H2C=CH2 M – 28
CnH2n-1 Various Alkenes
CnH2n Various

60
91
77 Aromatics
56
M – H2O M – 18
M – (H2O & H2C=CH2) M – 46 Alcohols
M – (CH3 & H2O) M – 33
Primary Alcohols CH2OH 31
43 + R
Ketones
Various
44
COH 29
M – H2O M – 18
M – H2C=CH2 M – 28
Aldehydes
M – H2C=CH–OH M – 44
61
60
M – OH M – 17
M – CO2H M – 45
Carboxylic Acids
CnH2n-1O2 73, 87, …
β cleavage various
Ethers
various
74, 88, …
various
R’+ various
Esters
various
various Amines
CnH2n+2N 58, 72, …
Primary Amines CH2NH2 30
CH2NH2 30 Amides
44

62
59
86
M – H M - 1
Nitriles
41
1
2.19 Searchable Databases 2
3
The proliferation of databases and the number of compounds that they 4
contained has made the interpretation of spectra less important. These 5
databases cover over 200,000 compounds, the two most commonly used 6
databases are the one produced by the National Institute of Standards and 7
Technology (NIST) along with the Wiley Registry of Mass Spectral Data. Using 8
these databases can be of great assistance when performing routine analysis 9
and sometimes are the only way to positively identify a particular compound. 10
11
These databases cannot be the exclusive tool that chemists rely on to 12
interpret data. Like other tools, it is necessary to know when and how to use it. 13
Databases are a perfect tool for performing routine analysis when the analyte 14
and the reference standard have a high percent match. When the quality of the 15
match becomes low, it is necessary to access the validity of the database match. 16
It is also necessary to understand these fractionation patterns when performing 17
research especially when synthesizing new compounds that are not contained in 18

63
the published databases, and for which there is obviously no reference 1
compound. Only the combination of manual interpretation along with the usage 2
of a library can the composition of an unknown sample truly be discerned. 3
4
6.20 References 5 6 de Hoffmann, E.; Stroobant, V. Mass Spectrometry Principles and Applications, 7 2nd ed.; John Wiley & Sons: New York, 2002. 8 9 Linstrom, P.; Mallard, W., Eds., NIST Chemistry WebBook, NIST. Standard 10 Reference database Number 69, June 2005, National Institute of Standards and 11 Technology, Gaithersburg MD, 20899 (http://webbook.nist.gov). 12 13 McLafferty F.; Ture’ek, F. Interpretation of Mass Spectra, 4th ed.; University 14 Science Books: California, 1993. 15 16 Silverstein R.; Bassler, G.; Morrill, T. Mass Spectrometry. Spectrometric 17 Identification of Organic Compounds, 5th ed.; John Wiley & Sons: New York, 18 1991; 3-89. 19 20 Wade, L. Infrared Spectroscopy and Mass Spectrometry. Organic Chemistry, 6th 21 ed.; Pearson Prentice Hall: New Jersey, 2006; 508-558. 22 23 24
6.21 Questions 25 26 Determine the identity of the products of the given reaction by using the mass spectra. 27 Then propose a likely mechanism of fragmentation for the numbered peaks. 28 29 30 31
1)
Cl
NH3+
32 a) 33

64
67
54
1 b) 2
43
56
3 4
2)
+ NBS
hν
5 6

65
1
3) + H2SO4
H2O
2 3 4
5 6
4)
1. BH3 THF
2. H2O2, OH 7
66
1
3 1
7 0
42
55
2 3
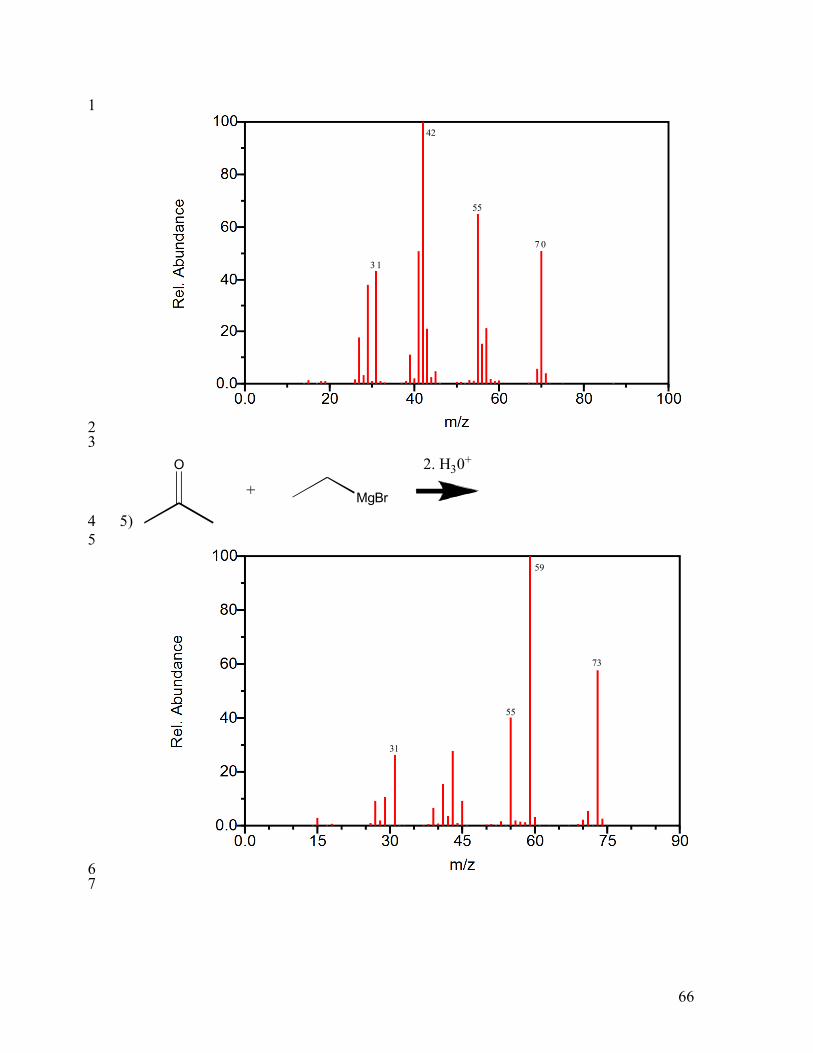
5) MgBr
O
+
2. H30+
4 5
59
73
55
31
6 7

67
6)
+ HI
1 2
3
7)
1. O3
2. (CH3)2S 4
5

68
a) 1 4 3
7158
2 b) 3
4 5
8) + HCl 6
7

69
77
6 3
5756
1 2
3

70
9)
OH
Cl
O
+
1 2
43
5 687
10 1
3
10)
OH 1. NaH
2. EtBr 4
5

71
1
11)
1. KMnO4, NaOH
2. H+ 2 3
a) 4 5
6 b) 7

72
1 2

73
12) Br + NaCN
1 2
4 1
29
3
13) C
O
O
+ NH3
4 5
6 7

74
14)
OH
Et
O
+ CH3OH
1 2
3 4
6.22 Problem Solutions 5
6 7 1) 8 9
Cl
NH3+ +
NH2
10 11 a) The M+ peak at 82 suggests that the spectrum is of cyclohexene. 12
13 14
H2CCH2
CH
CHCH2
H2C
CH2CH2
CH
CHCH2
H2C
CH2CH2
CH
CHCH2
H2C
15

75
CH3CH2
CH
CHCH
H2C
CH2CH
CHCH
H2C
m/z 67
CH2CH2
CH
CHCH
H2CH
1 m/z 67 2
m/z 54
+
3 4
b) The odd M+ peak at 99 suggests the nitrogen containing compound 5 cyclohexanamine. 6
7
NH2 NH2
NH2
NH2
m/z 43 8
NH2 NH2
m/z 56 9 2) 10

76
+ NBS
hν
Br
1 2 The pair of peaks at 121 and 123 as well as at 149 and 151 indicates that the 3 compound contains bromine. These, in combination with other prominent 4 fragments, suggest that the compound is 2-bromo-2-methlybutane. 5
6 7
Br Br
m/z 121 8
Br
m/z 71 9 10
11 3) 12
+ H2SO4
H2O OH
13 14 The peak at m/z 87 is deceiving because it is not the molecular ion in this case. 15 By utilizing other prominent peaks (m/z 73 and 45) and our knowledge of organic 16 chemistry, we can deduce that the mass spectrum is of 2-pentanol. 17 18
OH
O
m/z 87 19 OH OH OH
m/z 7320

77
1
OHH2CH
OHCH2
H
CH
CH2
CH
m/z 552
OH OH OH
m/z 45 3
CHCH2
CH
OHH
H2C OHm/z 31
4 5 4) 6
1. BH3 THF
2. H2O2, OH
OH
7 8 The molecular ion is missing from the spectrum which is to be expected from a straight 9 chain alcohol. While it would be possible to determine the molecular weight from a soft 10 ionization technique, the existence of other prominent peaks indicates that the spectrum is 11 of 1-pentanol. 12

78
O
H
H2C
H O
HCH2
H
CH2
CH2
m/z 70 1
H
CHCH2
CH2
CH2
O
H
CHCH2
CH2
CH2
CHCH2
CH2
CH2
HC
m/z 55 2
H
CHCH2
CH2
CH2O
H
CHCH2
m/z 42 3
4 5

79
5) 1
MgBr
O
+
2. H30+
OHEt
2 3 The molecular ion is missing from the spectrum which is to be expected. The existence 4 of other prominent peaks indicates that the spectrum is of 2-methyl-2-butanol. 5 6
CH3
OHEtOHEt OHEt
m/z 73 7
OHEt OH OH
m/z 59 8
H2C
CH3
OHEt
H
CH2
m/z 55 9
H2C OH
m/z 31 10 11 12 6) 13
+ HI I
14 15 The molecular ion at 184 as well as the large gap in the spectrum in combination with the 16 peak at 127 indicates that the spectrum contains iodine and can be attributed to tert-butyl 17 iodide. 18 19

80
CH3
II I
m/z 169 1 I+ 2
m/z 127 3
I
m/z 57 4 5 6 7) 7
1. O3
2. (CH3)2S
O
H
O
8 9 10 a) The molecular ion at 86 doesn’t help distinguish compound a from b. The more 11 intense molecular ion suggests that a) is the ketone, 2-pentanone, rather than the 12 aldehyde. 13
14 15
CCH3
O
C
O
C
O
m/z 71 16
C
OH2CH
C
OH
m/z 58 17

81
C
O
C
O
C
O
m/z 43 1 2
3 b) The presence of the M-1 peak helps to indicate that compound b) is the aldehyde, 4 pentanal. 5
H
O
C
O
C
O
m/z 85 6
CH2
CH2 CH
O
H2C
H
H3C CH
O
m/z 58 7
CH
OCHH
CH
OH
m/z 44 8
CH
O
CH
O
CH
O
m/z 29 9 10 11 8) 12
+ HCl
Cl 13

82
1 While the molecular ion is absent from the spectrum, the peaks at m/z 77 and 63 indicate 2 the presence of a chlorine atom in the sample indicating that the compound is 2-chloro-3 butane. 4
5
Cl Cl Cl
m/z 77 6
Cl Cl Cl
m/z 63 7
Cl m/z 57 8
ClH m/z 56 9 10 11 9) 12
OH
Cl
O
O
O
+
13 14 While the molecular ion is abscent, the other prominent peaks indicate both the functional 15 group and the hydrocarbon structure of the compound sec-butyl acetate. 16 17

83
O
O
O
O
O
O
m/z 101 1
O
O
O
O
O
O
m/z 872 3
CHO
OHC
HCH
CH
m/z 56 4
O
O O O
m/z 43 5
O
O
CH3m/z 15 6
7 8 10) 9 10
OH 1. NaH
2. EtBr
O
11 12

84
The molecular ion of this ether is stabilized by the aromatic group. At m/z 122 it 1 indicates that the spectrum is of ethoxybenzene. 2 3
4 O
CH2
CH2
HH H
H
O
H
OH
m/z 94 5 O
m/z 77 6 7 8
9

85
11) 1
C
O
OH
HO
O
1. KMnO4, NaOH
2. H+
2 3 4 a) The molecular ion at 102 fails to distinguish between the two expected carboxylic 5 acids. The prevelant peaks at m/z 87 and 57 as indicates that the compound is pivalic 6 acid. 7
8
H3C C
O
OH C
O
OH C
O
OH
m/z 87 9
C
O
OH
m/z 57 10 11 b) The missing molecular ion can be expected from a carboxylic acid. The prevelant 12 peaks at m/z 73 and 60 indicates that the compound is pentanoic acid. 13
14
HO
O
HO
O
m/z 73 15
HO
OHC
H
HO
OH
m/z 60 16 17
18

86
12) 1 Br + NaCN N C 2
3 The lack of a molecular ion is to be expected from a nitrile. The base peak at m/z 41 4 indicates that the compound is butanenitrile. 5 6
N
C
CH2
HN
C
H
m/z 41 7
N C CH2CH3
m/z 29 8 9
10 13) 11
CO
O
+ NH3 C
O
NH2 12 13
14
H2C
CH2
CH2C
NH2
O
H3C
H2C
H2C
CH2C
NH2
O
m/z 86 15
16
17 18 19

87
14) 1
OH
Et
O
+ CH3OH O
Et
O
2 3
4
O
Et
OH2CH
O
Et
OH
m/z 102 5
O
Et
O
Et
O
Et
O
m/z 996 7
O
Et
O
O
O
O
O
m/z 59 8 9
10