Embed Size (px)
Citation preview
Subscriber access provided by INRA Institut National de la Recherche Agronomique
Analytical Chemistry is published by the American Chemical Society. 1155Sixteenth Street N.W., Washington, DC 20036
Article1
H NMR, GC#EI-TOFMS, and Data Set Correlation for FruitMetabolomics: Application to Spatial Metabolite Analysis in Melon
Benoit Biais, J. William Allwood, Catherine Deborde, Yun Xu, Mickael Maucourt, BertrandBeauvoit, Warwick B. Dunn, Daniel Jacob, Royston Goodacre, Dominique Rolin, and Annick Moing
Anal. Chem., 2009, 81 (8), 2884-2894• Publication Date (Web): 19 March 2009
Downloaded from http://pubs.acs.org on April 14, 2009
More About This Article
Additional resources and features associated with this article are available within the HTML version:
• Supporting Information• Access to high resolution figures• Links to articles and content related to this article• Copyright permission to reproduce figures and/or text from this article
1H NMR, GC-EI-TOFMS, and Data Set Correlationfor Fruit Metabolomics: Application to SpatialMetabolite Analysis in Melon
Benoit Biais,*,†,§ J. William Allwood,*,| Catherine Deborde,†,§ Yun Xu,| Mickael Maucourt,‡,§
Bertrand Beauvoit,‡ Warwick B. Dunn,⊥ Daniel Jacob,#,∇ Royston Goodacre,|,⊥ Dominique Rolin,†,‡
and Annick Moing†,§
INRA, UMR619 Fruit Biology, BP81, F-33140 Villenave d’Ornon, France, Universite de Bordeaux, UMR619 Fruit Biology,BP81, F-33140 Villenave d’Ornon, France, Plateforme Metabolome-Fluxome-Genomique Fonctionnelle Bordeaux, IFR103 BVI, BP81, F-33140 Villenave d’Ornon, France, School of Chemistry, Manchester Interdisciplinary Biocentre, TheUniversity of Manchester, 131 Princess Street, Manchester M1 7DN, U.K., Manchester Centre for Integrative Systems Biology,Manchester Interdisciplinary Biocentre, The University of Manchester, 131 Princess Street, Manchester M1 7DN, U.K., Centre deBioinformatique de Bordeaux-Genomique Fonctionnelle Bordeaux, Universite de Bordeaux, 146 rue Leo Saignat,F-33076 Bordeaux, France, and INRA, UMA1251, IFR103 BVI, BP 81, F-33140 Villenave d’Ornon, France
A metabolomics approach combining 1H NMR and gaschromatography-electrospray ionization time-of-flightmass spectrometry (GC-EI-TOFMS) profiling was em-ployed to characterize melon (Cucumis melo L.) fruit. Ina first step, quantitative 1H NMR of polar extracts andprincipal component analyses (PCA) of the correspond-ing data highlighted the major metabolites in fruit flesh,including sugars, organic acids, and amino acids. In asecond step, the spatial localization of metabolites wasinvestigated using both analytical techniques. Direct 1HNMR profiling of juice or GC-EI-TOFMS profiling oftissue extracts collected from different locations in thefruit flesh provided information on advantages and draw-backs of each technique for the analysis of a sugar-richmatrix such as fruit. 1H NMR and GC-EI-TOFMS datasets were compared using independently performed PCAand multiblock hierarchical PCA (HPCA), respectively.In addition a correlation-based multiblock HPCA wasused for direct comparison of both analytical data sets.These data analyses revealed several gradients of me-tabolites in fruit flesh which can be related with differ-ences in metabolism and indicated the suitability ofmultiblock HPCA for correlation of data from two (orpotentially more) metabolomics platforms.
The interest for plant metabolomics1 grows constantly becauseof its potential applications in plant functional genomics,2 food
science,3 and human nutrition4 and has been successfully appliedto fleshy fruits.5-8 Another goal in metabolomics is high-throughput screening of crude samples with little or no samplepreparation.9 For the latter, metabolomics is often used to obtainmetabolic fingerprints at specific times of whole tissues or organsand therefore can provide information on plant physiology throughtemporal and/or spatial localization of metabolites as performedfor Arabidopsis rosettes,10 potato tubers,11 and strawberry flow-ers.12 However, plant metabolome complexity limits the ability tocollect global metabolomics data using one single technology;thus, several techniques are usually combined to cover primaryand secondary metabolites, i.e., gas chromatography/mass spec-trometry (GC/MS), liquid chromatography/mass spectrometry(LC/MS), or NMR; several different extraction procedures mayalso be applied to increase coverage.1,13,14 Thus far, for the studyof primary metabolites, one of two main technologies (1H NMR
* To whom correspondence should be addressed. Fax: +33 (0) 557 122 541(B.B.); +44 (0)161 306 4556 (J.W.A.). E-mail: [email protected] (B.B.);[email protected] (J.W.A.).
† INRA, UMR619 Fruit Biology.‡ Universite de Bordeaux, UMR619 Fruit Biology.§ Plateforme Metabolome-Fluxome-Genomique Fonctionnelle Bordeaux.| School of Chemistry, The University of Manchester.⊥ Manchester Centre for Integrative Systems Biology, The University of
Manchester.# Centre de Bioinformatique de Bordeaux-Genomique Fonctionnelle Bor-
deaux, Universite de Bordeaux.∇ INRA, UMA1251.
(1) Hall, R. D. New Phytol. 2006, 169, 453–468.(2) Hall, R. D.; Beale, M.; Fiehn, O.; Hardy, N.; Sumner, L. W.; Bino, R. Plant
Cell 2002, 14, 1437–1440.(3) Wishart, D. Trends Food Sci. Technol. 2008, 19, 482–493.(4) Hall, R. D.; Brouwer, I. D.; Fitzgerald, M. A. Physiol. Plant. 2008, 132,
162–175.(5) Moco, S.; Capanoglu, E.; Tikunov, Y.; Bino, R.; Boyacioglu, D.; Hall, R. D.;
Vervoort, J.; De Vos, R. C. H. J. Exp. Bot. 2007, 58, 4131–4146.(6) Mounet, F.; Lemaire-Chamley, M.; Maucourt, M.; Cabasson, C.; Giraudel,
J.-L.; Deborde, C.; Lessire, R.; Gallusci, P.; Bertrand, A.; Gaudillere, M.;Rothan, C.; Rolin, D.; Moing, A. Metabolomics 2007, 3, 273–288.
(7) Roessner-Tunali, U.; Hegemann, B.; Lytovchenko, A.; Carrari, F.; Bruedi-gam, C. Plant Physiol. 2003, 133, 84–99.
(8) Pereira, G. E.; Gaudillere, J. P.; van Leeuwen, C.; Hilbert, G.; Maucourt,M.; Deborde, C.; Moing, A.; Rolin, D. Anal. Chim. Acta 2006, 563, 346–352.
(9) Johnson, H. E.; Lloyd, A. J.; Mur, L. A. J.; Smith, A. R.; Causton, D. R.Metabolomics 2007, 3, 517–530.
(10) Gibon, Y.; Usadel, B.; Blaesing, O.; Kamlage, B.; Hoehne, M.; Trethewey,R.; Stitt, M. Genome Biol. 2006, 7, R76.
(11) Shepherd, T.; Dobson, G.; Verall, S. R.; Conner, S.; Griffiths, D. W.; McNicol,J. W.; Davies, H. V.; Stewart, D. Metabolomics 2007, 3, 475–488.
(12) Hanhineva, K.; Rogachev, I.; Hokko, H.; Mintz-Oron, S.; Venger, I.;Karenlampi, S.; Aharoni, A. Phytochemistry 2008, 69, 2463–2481.
(13) Allwood, J. W.; Ellis, D. I.; Goodacre, R. Physiol. Plant. 2008, 132, 117–135.
(14) Sumner, L. W.; Mendes, P.; Dixon, R. A. Phytochemistry 2003, 62, 817–836.
Anal. Chem. 2009, 81, 2884–2894
10.1021/ac9001996 CCC: $40.75 2009 American Chemical Society2884 Analytical Chemistry, Vol. 81, No. 8, April 15, 2009Published on Web 03/19/2009
and GC/MS) has been employed, on polar extracts.15 1H NMRtechnology has extensively been employed as a high-through-put technique for nontargeted fingerprinting with little or nosample preparation but has also been applied for targetedprofiling and the absolute quantification of metabolites whenused with an electronic reference.16 The main disadvantage of1H NMR is its relatively low sensitivity.17 GC-EI-TOFMS ismuch more sensitive than 1H NMR and appeared to be perfectlysuited for the detection of volatile metabolites.13,14 The maindrawbacks of GC-EI-TOFMS include that nonvolatile metabolitesrequire derivatization18 and that, in this case, the quantificationis relative to a single internal standard and not absolute. Althoughthe two platforms offer differing advantages for the study ofprimary metabolism, surprisingly, they have previously rarely beencombined within a single study.
For 1H NMR as well as for GC-EI-TOFMS (gas chromato-graphy-electrospray ionization time-of-flight mass spectrom-etry), data preprocessing and processing are important stepsfor the generation of relevant biological information frommetabolomics.19,20 1H NMR classical data preprocessing andprocessing consists generally in line broadening, phase cor-rection, alignment at δ 0.00 ppm using a reference signal (e.g.,sodium trimethylsilyl [2,2,3,3-2H4] propionate (TSP)), baselinecorrection, and data reduction (bucketing) for nontargetedfingerprinting or peak area integration for absolute quantifica-tion prior to multi- and univariate statistical analyses. ForGC-EI-TOFMS, data processing classically employs chromato-gram alignment and baseline correction (when necessary),peak picking, deconvolution, relative quantification, and finallyarray construction, prior to multi- and univariate data analyses.1,19-21
Although the use of more refined algorithms such as genetic orneural network based algorithms is increasing, principal compo-nent analysis (PCA) remains widely used for multivariate analysisof NMR or GC/MS profiling data. PCA models on the naturalvariance within a data set, and so if the process of interestcontributes the majority of the variance within the total explainedvariance then it is an extremely apt method to identify underlyingmetabolite variables which contribute to that variance. However,in situations where the “normal” variance is greater than thatexplained by the process of interest then the more sophisticatedgenetic or neural network based algorithms may identify theunderlying variables of significance which are not associated withthe greatest variance (the “normal” condition), although care mustbe taken not to over train/fit such algorithm-based models.
A metabolomics approach by 1H NMR and GC-EI-TOFMSprofiling was developed in order to characterize melon (Cu-cumis melo L.) fruit. The first step was to describe the global
metabolite composition of melon fruit flesh extracts. Thesecond step was to assess the spatial localization of the majorpolar metabolites in the melon flesh through 1H NMR andGC-EI-TOFMS profiling and their combined chemometricanalysis. This strategy showed (i) advantages, drawbacks, andcomplementarity of the two analytical techniques for fleshyfruits metabolomics and (ii) the interest of multiblock hierar-chical PCA for the correlation of corresponding 1H NMR andGC/MS data sets. The metabolite profiles and gradients,revealed by the combined 1H NMR and GC-EI-TOFMSapproach, offer promising prospects for the future study of fruitphysiology and food quality through multiplatform-basedmetabolite analyses.
METHODS AND MATERIALSSample Collection and Handling. Three C. melo cultivars
were studied, Cezanne, Escrito, and Hugo. Fruits were harvestedand processed within 2 h and stored at -80 °C. Fruit cultivationand processing is detailed in the Supplementary Methods 1 sectionin the Supporting Information.
Chemicals. Methanol-d4 (99.8%) was purchased from Eu-risotop (Gif sur Yvette, France). TSP (98%) was purchased fromAldrich (Saint Quentin Fallavier, France). Succinic-d4 acid,glycine-d5, and malonic-d2 acid standard metabolites (all of 99%purity or greater), all solvents (HPLC grade), O-methylhy-droxylamine chloride, N-acetyl-N(trimethylsilyl)-trifluoroaceta-mide, pyridine, and n-alkanes (C10, C12, C15, C19, C22) werepurchased from Sigma-Aldrich Ltd. (Gillingham, U.K.). Allother chemicals were of reagent grade.
Extraction and 1H NMR Analysis of Polar Metabolitesof Ground Flesh Samples. The polar metabolites wereextracted from ground melon samples as previously described16
with slight modifications (Supplementary Methods 2 section inthe Supporting Information). The lyophilized titrated extracts werestored in darkness under vacuum at room temperature, before1H NMR analysis was completed within a week. Quantitative1H NMR spectra were recorded at 500.162 MHz and 300 K ona Bruker Avance spectrometer (Wissembourg, France) usinga 5 mm inverse probe and an electronic reference for quanti-fication as described previously.6
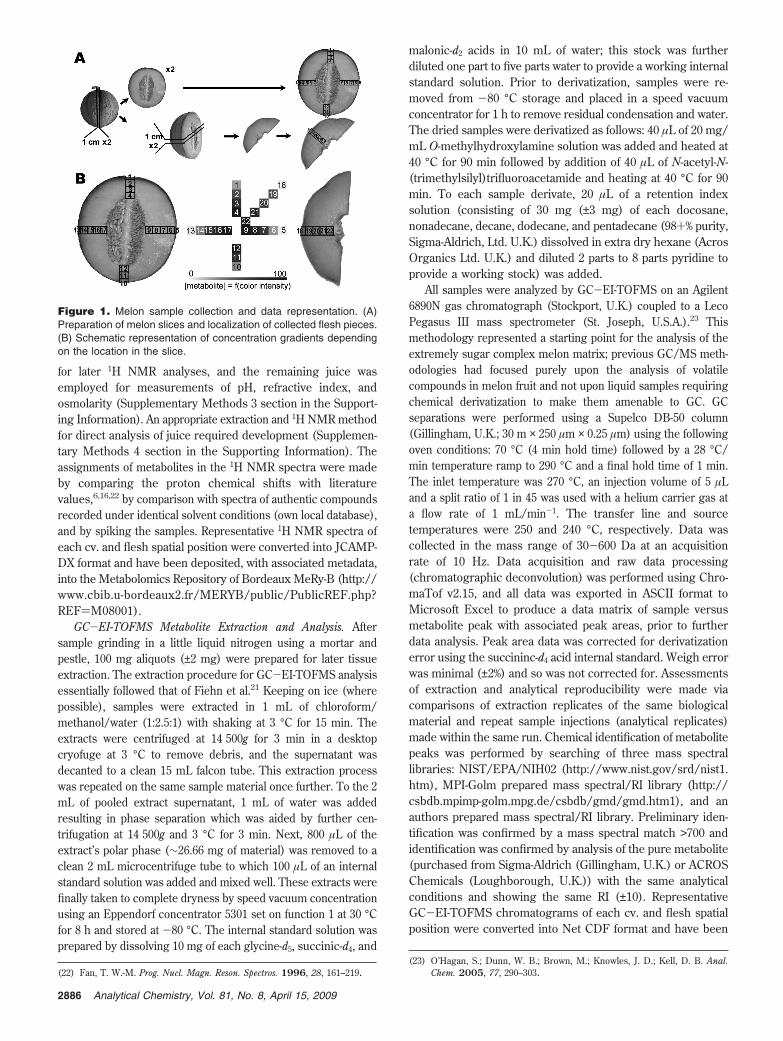
Spatial Localization of Metabolites in Melon. Sampling ofMelon Flesh Pieces for Spatial Study. For each cultivar (cv.), onemelon was cut in half lengthways and two slices (one each for 1HNMR and GC/MS) were made (thickness: 1 cm, longitudinalslice). On the remaining part of the fruit, two 1 cm thick half-equatorial slices (one each for 1H NMR and GC/MS) were cut.The slices for 1H NMR were processed immediately, and thosefor GC/MS were deep frozen in liquid N2 and stored at -80°C. The slices were divided into 22 small sections (ap-proximately 7 mm × 7 mm), cut from the skin to the center ofthe fruit, and numbered as shown in Figure 1A. The sections1, 5, 10, 13, and 18 were gathered under the name of epicarp (epi),sections 2, 3, 6, 7, 11, 14, 15, 19, and 20 as the outer mesocarp(out meso), and sections 4, 8, 9, 12, 16, 17, 21, and 22 as the innermesocarp (in meso).
Juice Collection and Global 1H NMR Analyses. Each flesh cubewas immediately crushed with a garlic press, aliquots of 150 µLwere rapidly deep frozen in liquid nitrogen and stored at -80 °C
(15) Krishnan, P.; Kruger, N. J.; Ratcliffe, R. G. J. Exp. Bot. 2005, 56, 255–265.(16) Moing, A.; Maucourt, M.; Renaud, C.; Gaudillere, M.; Brouquisse, R.;
Lebouteiller, B.; Gousset-Dupont, A.; Vidal, J.; Granot, D.; Denoyes-Rothan,B.; Lerceteau-Kohler, E.; Rolin, D. Funct. Plant Biol. 2004, 31, 889–902.
(17) Elipe, S.; Victoria, M. Anal. Chim. Acta 2003, 497, 1–25.(18) Roessner, U.; Wagner, C.; Kopka, J.; Trethewey, R. N.; Willmitzer, L. Plant
J. 2000, 23, 131–142.(19) Trygg, J.; Gullberg, J.; Johansson, A.; Jonsson, P.; Moritz, T. Plant
Metabolomics 2006, 57, 117–128.(20) Jonsson, P.; Stenlund, H.; Moritz, T.; Trygg, J.; Sjostrom, M.; Verheij, E. R.;
Lindberg, J.; Schuppe-Koistinen, I.; Antii, H. Metabolomics 2007, 2 (3),135–143.
(21) Fiehn, O.; Kopka, J.; Dormann, P.; Altmann, T.; Trethewey, R. N.; Willmitzer,L. Nat. Biotechnol. 2000, 18, 1157–1161.
2885Analytical Chemistry, Vol. 81, No. 8, April 15, 2009
for later 1H NMR analyses, and the remaining juice wasemployed for measurements of pH, refractive index, andosmolarity (Supplementary Methods 3 section in the Support-ing Information). An appropriate extraction and 1H NMR methodfor direct analysis of juice required development (Supplemen-tary Methods 4 section in the Supporting Information). Theassignments of metabolites in the 1H NMR spectra were madeby comparing the proton chemical shifts with literaturevalues,6,16,22 by comparison with spectra of authentic compoundsrecorded under identical solvent conditions (own local database),and by spiking the samples. Representative 1H NMR spectra ofeach cv. and flesh spatial position were converted into JCAMP-DX format and have been deposited, with associated metadata,into the Metabolomics Repository of Bordeaux MeRy-B (http://www.cbib.u-bordeaux2.fr/MERYB/public/PublicREF.php?REF)M08001).
GC-EI-TOFMS Metabolite Extraction and Analysis. Aftersample grinding in a little liquid nitrogen using a mortar andpestle, 100 mg aliquots (±2 mg) were prepared for later tissueextraction. The extraction procedure for GC-EI-TOFMS analysisessentially followed that of Fiehn et al.21 Keeping on ice (wherepossible), samples were extracted in 1 mL of chloroform/methanol/water (1:2.5:1) with shaking at 3 °C for 15 min. Theextracts were centrifuged at 14 500g for 3 min in a desktopcryofuge at 3 °C to remove debris, and the supernatant wasdecanted to a clean 15 mL falcon tube. This extraction processwas repeated on the same sample material once further. To the 2mL of pooled extract supernatant, 1 mL of water was addedresulting in phase separation which was aided by further cen-trifugation at 14 500g and 3 °C for 3 min. Next, 800 µL of theextract’s polar phase (∼26.66 mg of material) was removed to aclean 2 mL microcentrifuge tube to which 100 µL of an internalstandard solution was added and mixed well. These extracts werefinally taken to complete dryness by speed vacuum concentrationusing an Eppendorf concentrator 5301 set on function 1 at 30 °Cfor 8 h and stored at -80 °C. The internal standard solution wasprepared by dissolving 10 mg of each glycine-d5, succinic-d4, and
malonic-d2 acids in 10 mL of water; this stock was furtherdiluted one part to five parts water to provide a working internalstandard solution. Prior to derivatization, samples were re-moved from -80 °C storage and placed in a speed vacuumconcentrator for 1 h to remove residual condensation and water.The dried samples were derivatized as follows: 40 µL of 20 mg/mL O-methylhydroxylamine solution was added and heated at40 °C for 90 min followed by addition of 40 µL of N-acetyl-N-(trimethylsilyl)trifluoroacetamide and heating at 40 °C for 90min. To each sample derivate, 20 µL of a retention indexsolution (consisting of 30 mg (±3 mg) of each docosane,nonadecane, decane, dodecane, and pentadecane (98+% purity,Sigma-Aldrich, Ltd. U.K.) dissolved in extra dry hexane (AcrosOrganics Ltd. U.K.) and diluted 2 parts to 8 parts pyridine toprovide a working stock) was added.
All samples were analyzed by GC-EI-TOFMS on an Agilent6890N gas chromatograph (Stockport, U.K.) coupled to a LecoPegasus III mass spectrometer (St. Joseph, U.S.A.).23 Thismethodology represented a starting point for the analysis of theextremely sugar complex melon matrix; previous GC/MS meth-odologies had focused purely upon the analysis of volatilecompounds in melon fruit and not upon liquid samples requiringchemical derivatization to make them amenable to GC. GCseparations were performed using a Supelco DB-50 column(Gillingham, U.K.; 30 m × 250 µm × 0.25 µm) using the followingoven conditions: 70 °C (4 min hold time) followed by a 28 °C/min temperature ramp to 290 °C and a final hold time of 1 min.The inlet temperature was 270 °C, an injection volume of 5 µLand a split ratio of 1 in 45 was used with a helium carrier gas ata flow rate of 1 mL/min-1. The transfer line and sourcetemperatures were 250 and 240 °C, respectively. Data wascollected in the mass range of 30-600 Da at an acquisitionrate of 10 Hz. Data acquisition and raw data processing(chromatographic deconvolution) was performed using Chro-maTof v2.15, and all data was exported in ASCII format toMicrosoft Excel to produce a data matrix of sample versusmetabolite peak with associated peak areas, prior to furtherdata analysis. Peak area data was corrected for derivatizationerror using the succininc-d4 acid internal standard. Weigh errorwas minimal (±2%) and so was not corrected for. Assessmentsof extraction and analytical reproducibility were made viacomparisons of extraction replicates of the same biologicalmaterial and repeat sample injections (analytical replicates)made within the same run. Chemical identification of metabolitepeaks was performed by searching of three mass spectrallibraries: NIST/EPA/NIH02 (http://www.nist.gov/srd/nist1.htm), MPI-Golm prepared mass spectral/RI library (http://csbdb.mpimp-golm.mpg.de/csbdb/gmd/gmd.htm1), and anauthors prepared mass spectral/RI library. Preliminary iden-tification was confirmed by a mass spectral match >700 andidentification was confirmed by analysis of the pure metabolite(purchased from Sigma-Aldrich (Gillingham, U.K.) or ACROSChemicals (Loughborough, U.K.)) with the same analyticalconditions and showing the same RI (±10). RepresentativeGC-EI-TOFMS chromatograms of each cv. and flesh spatialposition were converted into Net CDF format and have been
(22) Fan, T. W.-M. Prog. Nucl. Magn. Reson. Spectros. 1996, 28, 161–219.(23) O’Hagan, S.; Dunn, W. B.; Brown, M.; Knowles, J. D.; Kell, D. B. Anal.
Chem. 2005, 77, 290–303.
Figure 1. Melon sample collection and data representation. (A)Preparation of melon slices and localization of collected flesh pieces.(B) Schematic representation of concentration gradients dependingon the location in the slice.
2886 Analytical Chemistry, Vol. 81, No. 8, April 15, 2009
deposited, with associated metadata, into the MetabolomicsRepository of Bordeaux MeRy-B (http://www.cbib.u-bordeaux2.fr/MERYB/public/PublicREF.php?REF)M08001).
Data Statistical Analysis and Visualization. All the pH,osmolarity, and 1H NMR data were submitted to N-way ANOVA(analysis of variance) and Tukey’s test using SAS Softwarev8.0124 to reveal significant differences between means. For1H NMR, PCA was used to highlight differences between cvs.and gradients (and/or specific localization) of metabolitesdepending on the tissue and position in the fruit. PCA wasperformed with the R software v2.5.1 (http://www.r-project.org/) and the FactoMiner package with mean-centered datascaled to unit variance.
The GC-EI-TOFMS data was first submitted to classical PCA(on mean-centered data scaled to unit variance) using theMATLAB R2006 software package (The MathWorks Inc. Natick,U.S.A.) as described previously.25 Since GC-EI-TOFMS data isvery information-rich and due to the variable changes within tissuetypes for some metabolite species, classical PCA may not be ableto highlight and describe the interesting trends that one wishesto observe, at least not in the first few principal components (PCs).Standard PCA routines are much more applicable to data setsconsisting of a small number of sample groups each containinglarge numbers of robust and reproducible replicate samples. Suchsample sets generally employ tissue pooling to make up eachbiological replicate, whereas in this study each sample is collectedfrom an independent fruit position, and so the sample set can begrouped according to relative fruit position (epicarp, outer andinner mesocarp), but the heterogeneity within these groups ofsamples is huge when compared to that seen between replicateswithin groups of pooled tissue samples.
The lack of success with the conventional PCA approach doesnot necessarily mean that the GC-EI-TOFMS platform cannotbe used to detect the spatial distribution of metabolites. Asdiscussed above, the reason could be the high complexity of thedata set, and the trend we are seeking may be overwhelmed byother irrelevant information. Similar situations also occur in thefield of statistical process control (SPC) where researchers wantto detect the occurrence of abnormality as early as possible. Inthe SPC scenario, abnormal signals are frequently overwhelmedby “normal” signals. An effective approach to improve thesensitivity of detecting abnormality is to employ several chemicaland/or physical sensors to monitor the process and to combinetheir signals by using multiblock PCA models. Multiblock PCAmodels26,27 are extensions of standard PCA which aim to combineseveral different but potentially connected data sets (called“blocks”), with emphasis upon modeling the “common trend”between blocks. The common trend of the different blocks arerevealed in the “super scores” plot, the distribution of the samplesof each individual block are shown in their respective “blockscores”, and like classical PCA, the contribution of variables tothe trend shown in the blocks scores plot is shown in their “blockloadings” plot. In SPC applications, if all the sensors employed
(considering each sensor as an individual block within themultiblock PCA model) can detect abnormal signals, even whenthey are extremely weak, such signals will be much more easilyhighlighted with a multiblock PCA model than several indepen-dent standard PCA models (based upon one model per eachsensor). This would especially be the case if abnormality happenedto be detected by all of the sensors, i.e., a common trend acrossall the blocks. Multiblock PCA specifically looks for the commontrend (abnormality in the case of SPC), if the trend is presentbetween the different blocks then it will modeled upon; however,in the case of a standard PCA routine only the pattern of “normal”signals would be illustrated and not the underlying trend towardabnormality. In this study, the same approach can be employed,especially if the gradient distribution of metabolites is not the maintrend within the GC-EI-TOFMS data set and standard PCA failedto reveal it. If such a trend should exist within all three meloncultivars, the three cultivars can be considered as three differentblocks, and thus a multiblock PCA model can be constructed thatwould stand a better chance of revealing the trend within its firstfew PCs than a standard PCA routine.
In this study, a multiblock PCA model called hierarchical PCA(HPCA) was used. In addition to HPCA, N-way ANOVA was usedto identify potentially significant metabolites differing in theirspatial distribution. Since there are a large number of multiplecomparisons, the threshold of the p-value was down adjustedaccording to Benjamini and Hochberg procedure28 by setting thefalse discovery rate (FDR) to 0.05. We also attempted to combinethe GC-EI-TOFMS and 1H NMR data together by building asix block HPCA model to find which metabolites showedsimilar trends across the different analytical data sets. All HPCAand N-way ANOVA were performed using the Multiblocktoolbox for Matlab (available from http://www.models.kvl.dk/source/MBToolbox/) and the statistics tool box, respectively,for the MATLAB R2006 software package (The MathWorksInc.). Prior to HPCA, both GC/MS and 1H NMR data sets werescaled by mean centering to unit variance.
Multi Experiment Viewer (MeV) v4.0 software29 was used toobtain “heat-map-like” graphics (for both 1H NMR and GC-EI-TOFMS) where the color intensity depends on the metaboliteconcentration. Data were presented in a cross where eachbranch represents one part of the longitudinal slice. Data forthe equatorial slice were added in a diagonal branch (see theexample graphic in Figure 1B).
RESULTS AND DISCUSSIONEstablishing a Baseline Metabolome for Melon Flesh. To
establish a baseline metabolic profile of melon fruit flesh, ethanolicextraction and 1H NMR analysis was performed. Twenty-sevenpolar metabolites were identified according to the chemicalshifts given in Supporting Information Table S1, including threecarbohydrates, two oligosaccharides, two polyols, three organicacids, three amino acids, and two quaternary amines. Onerepresentative 1H NMR spectrum is presented in SupportingInformation Figure S1A; each identified resonance was integrated,(24) SAS Institute. SAS/STAT User’s Guide, version 6, 4th ed.; SAS Institute
Inc.: Cary, NC, 1990.(25) Allwood, J. W.; Ellis, D. I.; Heald, J. K.; Goodacre, R.; Mur, L. A. J. Plant J.
2006, 46, 351–368.(26) Smilde, A. K.; Westerhuis, J. A.; Jong, S. J. Chemom. 2003, 17, 323–337.(27) Westerhuis, J. A.; Kourti, T.; Macgregor, J. F. J. Chemom. 1998, 12, 301–
321.
(28) Benjamini, Y.; Hochberg, Y. J. R. Stat. Soc., Ser. B 1995, 57, 289–300.(29) Saeed, A.; Sharov, V.; White, J.; Li, J.; Liang, W.; Bhagabati, N.; Braisted,
J.; Klapa, M.; Currier, T.; Thiagarajan, M.; Sturn, A.; Snuffin, M.; Rezantsev,A.; Popov, D.; Ryltsov, A.; Kostukovich, E.; Borisovsky, I.; Liu, Z.; Vinsavich,A.; Trush, V.; Quackenbush, J. BioTechniques 2003, 34, 374–378.
2887Analytical Chemistry, Vol. 81, No. 8, April 15, 2009
and the corresponding metabolite was quantified (SupportingInformation Table S2). The absolute metabolite concentrationswere submitted to PCA which revealed cv. differences (SupportingInformation Figure S1B). The concentrations of individual me-tabolites, for the three cvs., are presented in Supporting Informa-tion Table S2. These results are in general agreement with otherdata on C. melo L.30-34 They have highlighted that (i) the extractshave particularly high sugar concentrations and (ii) there is atleast a 3 order range in concentration for all the polar metabolitesdetected in the 1H NMR spectra.
The use of this hot ethanolic extraction has brought proofs ofrobustness and reproducibility for 1H NMR analysis.16 Theextraction concentrated several minor metabolites permittingtheir detection by 1H NMR. Sample extracts are prepared in abuffered solution, thus avoiding the shift of metabolite peaksdue to pH or ionic strength variations between samples. Asimilar extraction was attempted to produce samples suitablefor GC-EI-TOFMS, only fresh material was used and notfreeze-dried. In a preliminary experiment, it was noted thatfreeze-dried melon extracts contained such high sugar levelsthat chemical derivatization was inhibited or chromatographywas heavily overloaded with monosaccharides. Similarly, theamended ethanolic method16 resulted in very high concentra-tions of sugars leading to the same difficulties. In future studiesthis problem may be averted by use of a two-stage analysis,where first a concentrated sample is analyzed for sugar content,a second sample will be prepared by subjecting the sameextract to a solid-phase extraction (SPE) for the removal ofsugars35 and analyzed for the lower concentration samplecomponents.
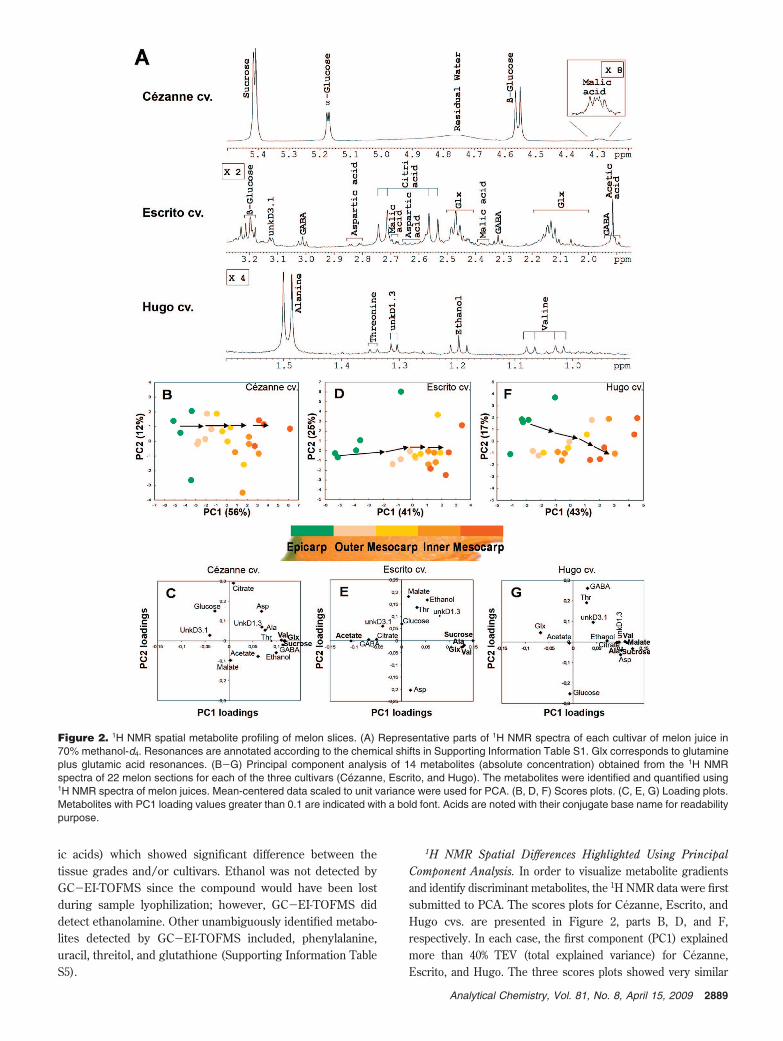
Spatial Localization of Metabolites in Melon. 1H NMR andGC-EI-TOFMS Metabolic Profiling of Melon Juice and Flesh.Classical analyses to quickly assess fruit quality include pH,osmolarity, and refractive index measurements. These parameterswere measured for each flesh piece (Figure 1A) from theirsqueezed juice (Supporting Information Table S3) revealing somesignificant gradients between the epicarp and the inner mesocarp.The osmolarity and refractive index showed parallel changes witha clear gradient from the epicarp to the inner mesocarp. In orderto gain metabolic insights into the components of pH, osmolarity,and total soluble solids, metabolic profiles of melon juice fromeach flesh section (Figure 1A) were prepared in methanol-d4 using1H NMR spectroscopy. Representative parts of the spectrumof each cultivar are shown in Figure 2A; 15 metabolites wereidentified (according to chemical shift, Supporting InformationTable S1) and 14 were quantified (Supporting Information TableS4). The major metabolites in juice were sugars (sucrose, glucose)and amino acids (alanine, valine, threonine, aspartic acid, andGABA). As the samples were not buffered, it was impossible todistinguish accurately the glutamine and glutamic acid resonances;
thus they were described as “glx” metabolite. Citric acid was themajor organic acid detected, although malic and acetic acids werealso detected. Ethanol was detected in several samples. Finally,two metabolites which could not be identified were named asunknowns (unkD3.1 and unkD1.3).
As the samples contained approximately 30% water (v/v), a waterpresaturation sequence was used to remove the water peak at 4.8ppm. Unfortunately, the �-glucose doublet was also affected by thepresaturation since its area was decreased between a proton 1D pulsesequence and a Noesy-Presat pulse sequence (NOESYGPPR1D: apresaturation experiment for water suppression incorporating thefirst increment of the NOESY pulse sequence and a spoil gradient)(data not shown). Thus, the glucose triplet pattern at 3.20 ppm(Figure 2A), which was not affected, was used for the absolutequantification of �-glucose. Both sucrose (5.41 ppm) and R-glucose(5.18 ppm) doublets were generally not affected by the waterpresaturation, although in some cases the R-glucose doubletappeared to be decreased. The concentration of R-glucose wasdetermined using the calculated �-glucose concentration and thenatural abundance ratio of R-glucose and �-glucose (36% R, 64%�, assessed with nonpresaturated acquisitions, data not shown).
The juice-based direct profiling method in methanol-d4 wasadvantageous due to the speed and ease of sample processing.The 1H NMR spectra were acquired from preserved samples,since the addition of 70% methanol-d4 directly into the juiceblocks enzymatic activities. Moreover, it allowed for thedetection and quantification of endogenous ethanol, an interest-ing indicator of metabolic changes.36 However, drawbacks werethe lower sensitivity of the technique and a longer shimmingtime before spectrum acquisition due to the methanol-d4/watermixture (70/30, v/v). Both the baseline and spatial 1H NMRmethod gave valuable information on the metabolite composi-tion of melon fruit flesh, but the two data sets may not becompared directly: some differences may be attributed toindividual fruit variability and/or the extraction process.
Metabolic profiles of polar extracts from melon flesh sections(Figure 1A) were generated by GC-EI-TOFMS postderivatizationwith O-methylhydroxylamine and N-acetyl-N-(trimethylsilyl)trif-luoroacetamide. Deconvolution of the chromatographic profilesproduced an output consisting of 105 metabolite features, 58 ofwhich had been assigned metabolite identifications (by matchingof retention index and mass spectra to authentic chemicalstandards) and a further 12 of which had been assigned asunknown sugars based upon mass spectra. The table of unam-biguously identified metabolite features is available in the Sup-porting Information (Table S5). The major metabolites in themelon flesh extracts were sugars (sucrose, glucose, fructose,trehalose) and amino acids (alanine, �-alanine, valine, threonine,aspartic acid, glycine, lysine, leucine, GABA, serine, and tyrosine,several of which revealed tissue specific gradients not detectedby 1H NMR). Similar to 1H NMR, citric acid was the mostconcentrated organic acid detected, followed by malic acid;however, the improved sensitivity of GC-EI-TOFMS led to thedetection of a series of lower concentration organic and fattyacids (including fumaric, succinic, glyceric, stearic, hexade-canoic, glucuronic, galacturonic, myristic, shikimic, and glutam-
(30) Stepansky, A.; Kovalski, I.; Schaffer, A. A.; Perl-Treves, R. Genet. Resour.Crop Evol. 1999, 46, 53–62.
(31) Gao, Z.; Petreikov, M.; Zamski, E.; Schaffer, A. A. Physiol. Plant. 1999,106, 1–8.
(32) Wang, Y.; Wyllie, S. G.; Leach, D. N. J. Agric. Food Chem. 1996, 44, 210–216.
(33) Chachin, K.; Iwata, T. Bull. Univ. Osaka Prefect., Ser. B 1988, 40, 27–35.(34) Hashinaga, F.; Koga, T.; Ishida, K. Bull. Fac. Agric., Kagoshima Univ. 1984,
34, 29–37.(35) Suzuki, H.; Achnine, L.; Xu, R.; Matsuda, S. P. T.; Dixon, R. A. Plant J.
2002, 32, 1033–1048.(36) Tadege, M.; Dupuis, I.; Kuhlemeier, C. Trends. Plant Sci. 1999, 4, 320–
325.
2888 Analytical Chemistry, Vol. 81, No. 8, April 15, 2009
ic acids) which showed significant difference between thetissue grades and/or cultivars. Ethanol was not detected byGC-EI-TOFMS since the compound would have been lostduring sample lyophilization; however, GC-EI-TOFMS diddetect ethanolamine. Other unambiguously identified metabo-lites detected by GC-EI-TOFMS included, phenylalanine,uracil, threitol, and glutathione (Supporting Information TableS5).
1H NMR Spatial Differences Highlighted Using PrincipalComponent Analysis. In order to visualize metabolite gradientsand identify discriminant metabolites, the 1H NMR data were firstsubmitted to PCA. The scores plots for Cezanne, Escrito, andHugo cvs. are presented in Figure 2, parts B, D, and F,respectively. In each case, the first component (PC1) explainedmore than 40% TEV (total explained variance) for Cezanne,Escrito, and Hugo. The three scores plots showed very similar
Figure 2. 1H NMR spatial metabolite profiling of melon slices. (A) Representative parts of 1H NMR spectra of each cultivar of melon juice in70% methanol-d4. Resonances are annotated according to the chemical shifts in Supporting Information Table S1. Glx corresponds to glutamineplus glutamic acid resonances. (B-G) Principal component analysis of 14 metabolites (absolute concentration) obtained from the 1H NMRspectra of 22 melon sections for each of the three cultivars (Cezanne, Escrito, and Hugo). The metabolites were identified and quantified using1H NMR spectra of melon juices. Mean-centered data scaled to unit variance were used for PCA. (B, D, F) Scores plots. (C, E, G) Loading plots.Metabolites with PC1 loading values greater than 0.1 are indicated with a bold font. Acids are noted with their conjugate base name for readabilitypurpose.
2889Analytical Chemistry, Vol. 81, No. 8, April 15, 2009
patterns, with PC1 discriminating the samples depending uponspatial location along the melon slice from epicarp to innermesocarp. The epicarp samples were located on the negative sideof PC1, whereas the inner mesocarp samples were on the positiveside. The corresponding loadings plots are presented in Figure2, parts C, E, and G. Their observation showed the maindiscriminant metabolites (loading factors higher than 0.1) on PC1.Some of these discriminant metabolites were common to the threemelon cvs., like sucrose, valine, and alanine, and to a lesser extentethanol and “glx” (glutamine and glutamic acid resonances). Forsugars, the gradients observed in the present experiment werein agreement with those previously showed on melon using near-infrared imaging.37 Other metabolites appeared to be specificallydiscriminating for one cv., e.g., GABA for Cezanne, acetic acidfor Escrito, and malic or aspartic acid for Hugo.
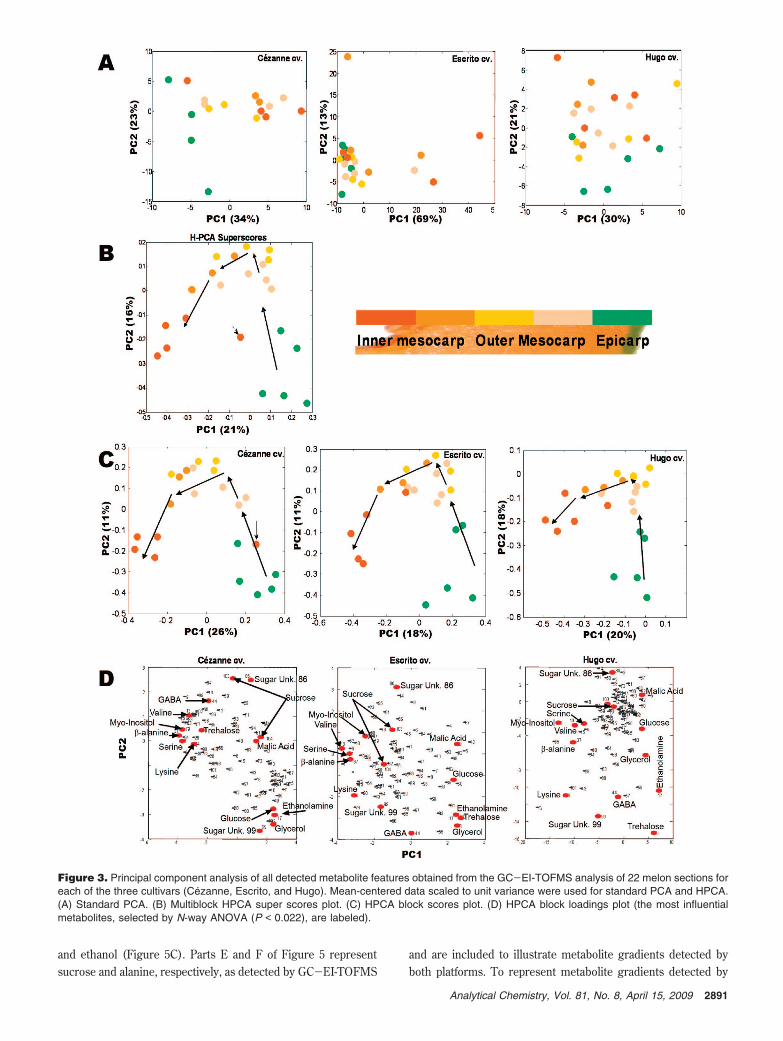
GC-EI-TOFMS Spatial Differences Highlighted Using PrincipalComponent Analysis and Multiblock Hierarchical Principal Com-ponent Analysis. In order to visualize metabolite gradients andidentify discriminant metabolites from the GC-EI-TOFMS dataset, the data were first submitted to a standard PCA. Unfortunately,PCA did not successfully cluster the sample groups according totissue grade (Figure 3A); this probably resulted from the highcomplexity of GC-EI-TOFMS data compared to 1H NMR.GC-EI-TOFMS detected over 100 metabolite features com-pared to the 14 metabolites quantified within the 1H NMR dataset. The alternative sample preparations, tissue extraction, andderivatization versus juice, different locations of the tissueslices, independent sectioning of the tissue slices, and differentextractions may have also contributed to this increased datacomplexity/variability. For future experimentation, all sampleprocessing will be undertaken by a single technician, thusincreasing the metabolic reproducibility by producing a seriesof identical samples for analysis upon multiple platforms.
It is also likely that the small number of bulk metabolitesdetected by the 1H NMR and their spatial distributions wereless variable than the shifts seen within many of the low-abundance metabolite species observed by GC-EI-TOFMSwhich were outside of the detection limits of 1H NMR. It isalso likely that the bulk metabolite detection is more variableand less reliable within the relatively quantified GC-EI-TOFMSdata set, due to saccharide overloading and saturation of thedetector, when compared to the fully quantified 1H NMR dataset. These issues are currently being addressed by researchersat the University of Manchester and Max Plank Institute ofMolecular Plant Physiology (Golm, Germany), who are makingsubstantial developments to the GC-EI-TOFMS methodologyand data-processing strategies. Although the detection andquantification of bulk metabolite species was more reliableupon the 1H NMR platform, 1H NMR did not detect some ofthe significant metabolite gradients observed within the GC-EI-TOFMS data set including ethanolamine, �-alanine, pyruvicacid, lysine, serine, and stearic acid. It must also be stated thatthe GC-EI-TOFMS detected GABA amino acid gradientcommon to all three cultivars, whereas the 1H NMR showedmore variable data. However, without further biological replica-tion and analysis of identical sample material, it is difficult tosay which instrument is faithfully recording the metabolite
levels, although it is likely that the 1H NMR is more faithfulwith regard to bulk metabolites and GC-EI-TOFMS withregard to low-abundance metabolites. Care must be takenthough when directly assessing relatively quantified dataagainst absolutely quantified data since the results will differ.
Due to the lack of success with the conventional PCA approach,a multiblock HPCA model was built. The HPCA revealed thedifferences between epicarp and mesocarp and highlightedthe discriminant metabolites for the three individual melon cvs.The super scores and block scores plots for Cezanne, Escrito,and Hugo are presented in Figure 3, parts B and C, respectively.On the super scores plot, PC1 explained 21% TEV, while PC2explained 16% TEV. In comparison to the results of the standardPCA, PC1 in the multiblock HPCA model clearly discriminatedthe samples depending on the location of the section on the slice.The TEV values explained why classical PCA was not successfulfor the GC-EI-TOFMS data set when compared to the 1H NMRdata set. In the 1H NMR data set, the main trend (more than40% TEV) is due to the spatial difference of metabolites,whereas in the GC-EI-TOFMS data set, such trends are muchweaker (21% TEV) and thus multiblock HPCA was required toreveal them. PC1 clustered the samples into groups (epicarp,inner and outer mesocarp) according to the spatial location.The epicarp samples were located on the positive side of PC1while the inner mesocarp samples were on the negative side.The corresponding loadings plot is presented in Figure 3D.Observation of the loadings plots showed the main discriminantmetabolites were present on PC1. Some of these discriminantmetabolites were common to the three cvs., such as ethanolamine,sucrose, valine, serine, alanine, and �-alanine, and others appearedto be specifically discriminating according to cultivar, e.g., treha-lose, GABA, threonine, phenylalanine, and glycerol. A univariatedata analysis was undertaken using N-way ANOVA with a falsediscovery rate set at 5% (i.e., a 95% confidence limit) on theGC-EI-TOFMS data set; 47 variables were identified as significantbetween different melon tissue locations, whereas 82 variableswere identified as significantly different between melon cvs.(Supporting Information Table S5).
GC-EI-TOFMS and 1H NMR Correlation Analysis withMultiblock Hierarchical Principal Component Analysis. By put-ting both analytical data sets into a single HPCA model, all of theblocks scores were found to show the same trend, thus makingthem comparable to each other (Figure 4). More interestingly,by examining the loadings plot, it was discovered that the samecompounds detected by both analytical techniques show similarpositions within the plots. Four identified metabolites (commonto both data sets), alanine, sucrose, valine, and GABA, werehighlighted as showing similar trends. It can be clearly seen thatthey appear in a similar position in the loadings plots within thesame cvs. of melon but analyzed by different techniques. Thisdemonstrates the great potential of using multiblock PCA tocombine different data sets together and correlate the knowledgediscovered by the different metabolomic platforms.
Spatial Gradients for Individual Metabolite. The concentrationsof individual discriminating metabolites were visualized with heatmaps (as explained in Figure 1B) to highlight metabolite gradi-ents. Figure 5 presents the graphics obtained from 1H NMR forsucrose (Figure 5A), alanine (Figure 5B), valine (Figure 5D),(37) Sugiyama, J. J. Agric. Food Chem. 1999, 47, 2715–2718.
2890 Analytical Chemistry, Vol. 81, No. 8, April 15, 2009
and ethanol (Figure 5C). Parts E and F of Figure 5 representsucrose and alanine, respectively, as detected by GC-EI-TOFMS
and are included to illustrate metabolite gradients detected byboth platforms. To represent metabolite gradients detected by
Figure 3. Principal component analysis of all detected metabolite features obtained from the GC-EI-TOFMS analysis of 22 melon sections foreach of the three cultivars (Cezanne, Escrito, and Hugo). Mean-centered data scaled to unit variance were used for standard PCA and HPCA.(A) Standard PCA. (B) Multiblock HPCA super scores plot. (C) HPCA block scores plot. (D) HPCA block loadings plot (the most influentialmetabolites, selected by N-way ANOVA (P < 0.022), are labeled).
2891Analytical Chemistry, Vol. 81, No. 8, April 15, 2009
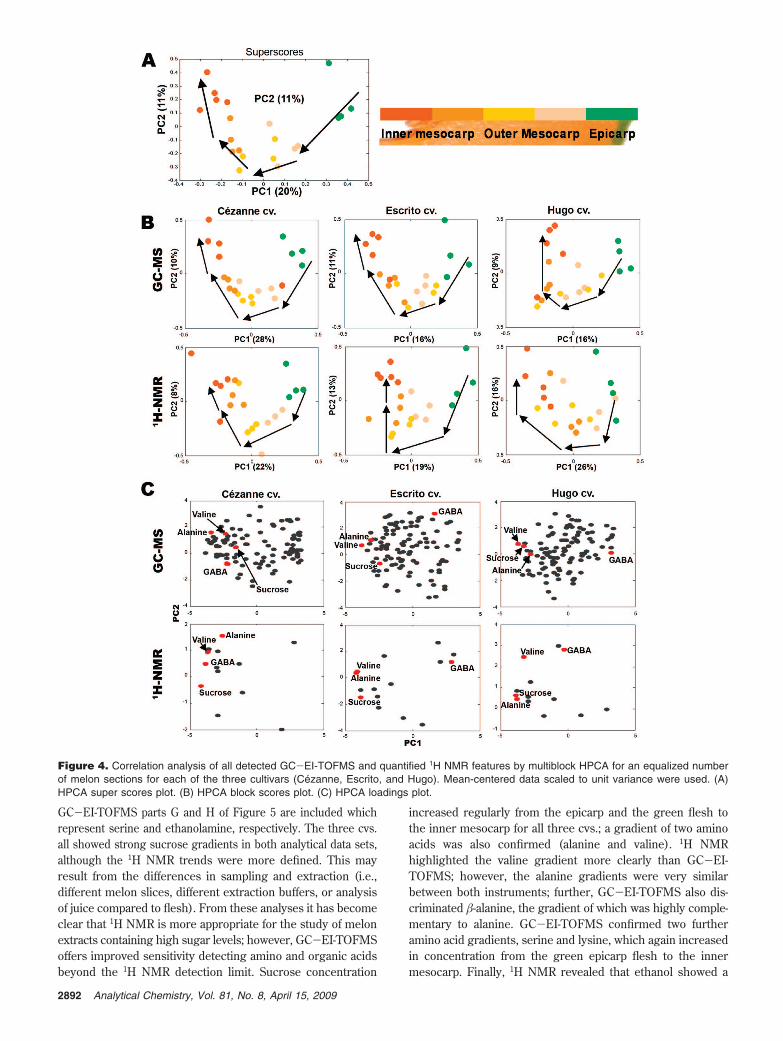
GC-EI-TOFMS parts G and H of Figure 5 are included whichrepresent serine and ethanolamine, respectively. The three cvs.all showed strong sucrose gradients in both analytical data sets,although the 1H NMR trends were more defined. This mayresult from the differences in sampling and extraction (i.e.,different melon slices, different extraction buffers, or analysisof juice compared to flesh). From these analyses it has becomeclear that 1H NMR is more appropriate for the study of melonextracts containing high sugar levels; however, GC-EI-TOFMSoffers improved sensitivity detecting amino and organic acidsbeyond the 1H NMR detection limit. Sucrose concentration
increased regularly from the epicarp and the green flesh tothe inner mesocarp for all three cvs.; a gradient of two aminoacids was also confirmed (alanine and valine). 1H NMRhighlighted the valine gradient more clearly than GC-EI-TOFMS; however, the alanine gradients were very similarbetween both instruments; further, GC-EI-TOFMS also dis-criminated �-alanine, the gradient of which was highly comple-mentary to alanine. GC-EI-TOFMS confirmed two furtheramino acid gradients, serine and lysine, which again increasedin concentration from the green epicarp flesh to the innermesocarp. Finally, 1H NMR revealed that ethanol showed a
Figure 4. Correlation analysis of all detected GC-EI-TOFMS and quantified 1H NMR features by multiblock HPCA for an equalized numberof melon sections for each of the three cultivars (Cezanne, Escrito, and Hugo). Mean-centered data scaled to unit variance were used. (A)HPCA super scores plot. (B) HPCA block scores plot. (C) HPCA loadings plot.
2892 Analytical Chemistry, Vol. 81, No. 8, April 15, 2009
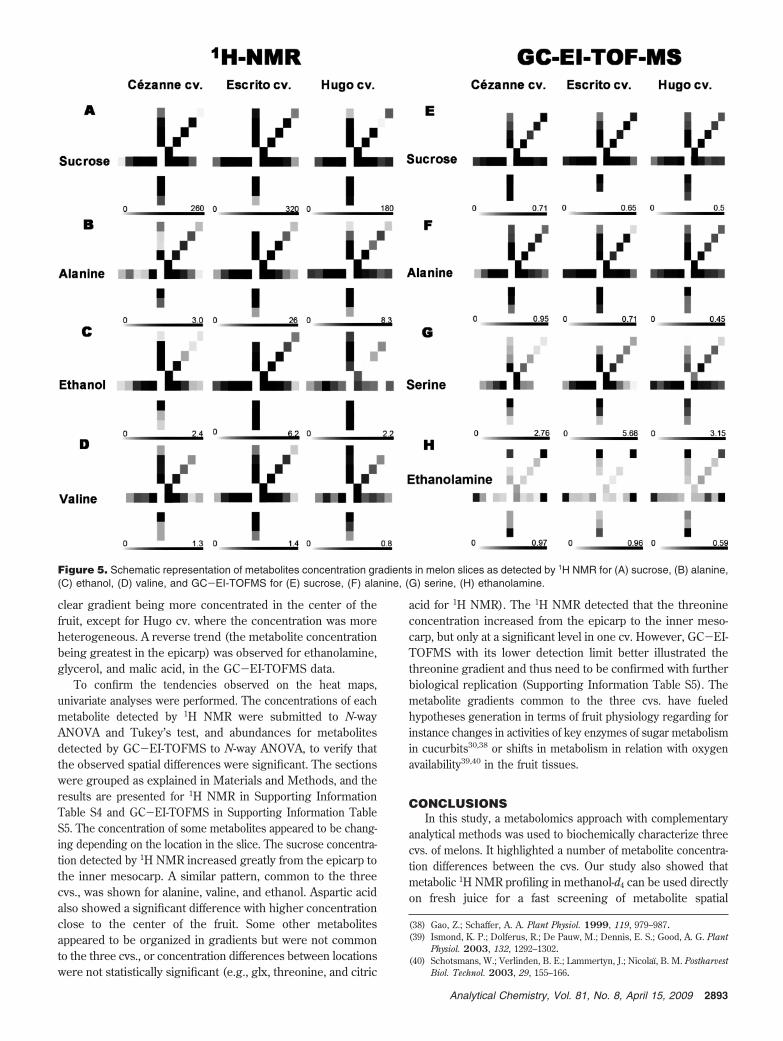
clear gradient being more concentrated in the center of thefruit, except for Hugo cv. where the concentration was moreheterogeneous. A reverse trend (the metabolite concentrationbeing greatest in the epicarp) was observed for ethanolamine,glycerol, and malic acid, in the GC-EI-TOFMS data.
To confirm the tendencies observed on the heat maps,univariate analyses were performed. The concentrations of eachmetabolite detected by 1H NMR were submitted to N-wayANOVA and Tukey’s test, and abundances for metabolitesdetected by GC-EI-TOFMS to N-way ANOVA, to verify thatthe observed spatial differences were significant. The sectionswere grouped as explained in Materials and Methods, and theresults are presented for 1H NMR in Supporting InformationTable S4 and GC-EI-TOFMS in Supporting Information TableS5. The concentration of some metabolites appeared to be chang-ing depending on the location in the slice. The sucrose concentra-tion detected by 1H NMR increased greatly from the epicarp tothe inner mesocarp. A similar pattern, common to the threecvs., was shown for alanine, valine, and ethanol. Aspartic acidalso showed a significant difference with higher concentrationclose to the center of the fruit. Some other metabolitesappeared to be organized in gradients but were not commonto the three cvs., or concentration differences between locationswere not statistically significant (e.g., glx, threonine, and citric
acid for 1H NMR). The 1H NMR detected that the threonineconcentration increased from the epicarp to the inner meso-carp, but only at a significant level in one cv. However, GC-EI-TOFMS with its lower detection limit better illustrated thethreonine gradient and thus need to be confirmed with furtherbiological replication (Supporting Information Table S5). Themetabolite gradients common to the three cvs. have fueledhypotheses generation in terms of fruit physiology regarding forinstance changes in activities of key enzymes of sugar metabolismin cucurbits30,38 or shifts in metabolism in relation with oxygenavailability39,40 in the fruit tissues.
CONCLUSIONSIn this study, a metabolomics approach with complementary
analytical methods was used to biochemically characterize threecvs. of melons. It highlighted a number of metabolite concentra-tion differences between the cvs. Our study also showed thatmetabolic 1H NMR profiling in methanol-d4 can be used directlyon fresh juice for a fast screening of metabolite spatial
(38) Gao, Z.; Schaffer, A. A. Plant Physiol. 1999, 119, 979–987.(39) Ismond, K. P.; Dolferus, R.; De Pauw, M.; Dennis, E. S.; Good, A. G. Plant
Physiol. 2003, 132, 1292–1302.(40) Schotsmans, W.; Verlinden, B. E.; Lammertyn, J.; Nicolaı, B. M. Postharvest
Biol. Technol. 2003, 29, 155–166.
Figure 5. Schematic representation of metabolites concentration gradients in melon slices as detected by 1H NMR for (A) sucrose, (B) alanine,(C) ethanol, (D) valine, and GC-EI-TOFMS for (E) sucrose, (F) alanine, (G) serine, (H) ethanolamine.
2893Analytical Chemistry, Vol. 81, No. 8, April 15, 2009
localization in fleshy fruit such as melon. The GC-EI-TOFMSspatial method provided useful information which correlatedwith the results of the 1H NMR study, via an indirectcomparison of independently performed PCA and multiblockHPCA, and via a correlation-based superblock HPCA for directcomparison of both analytical data sets. GC-EI-TOFMS alsoindicated a number of gradients for metabolites beyond thedetection limits of 1H NMR. The study has shown that GC-EI-TOFMS may not be as apt for the analysis of bulk metaboliccomponents as 1H NMR, but still provides data of much valuein this combined multiplatform approach. The multiblock HPCAmethod has great potential for correlation of data betweenmetabolomic platforms other than just between 1H NMR andGC-EI-TOFMS, although due to both techniques coveringprimary metabolism they are particularly comparable. Usefulinsights toward more appropriate metabolite extraction andanalytical methods for melon analysis by GC-EI-TOFMS werealso gained. A number of metabolite gradients from the epicarpto the inner mesocarp were found in all cvs. that can be relatedto metabolism changes. The remaining question is to knowhow these gradients become established during the fruitdevelopment; further investigation on several replicate fruitsat different stages of growth could answer this point and iscurrently being undertaken.
ACKNOWLEDGMENTThis study was partially funded by the EU within the plant
metabolomics project META-PHOR (FOOD-CT-2006-036220). Wegratefully thank Sylvie Bochu and Francoise Leix-Henry fromCEFEL (France) for providing the melons, and Drs. Arthur A.
Schaffer (Volcani Centre, Israel) and Robert Hall (Plant ResearchInternational, Holland) for critical reading of the manuscript. Thefirst two authors contributed equally to this work.
SUPPORTING INFORMATION AVAILABLESupplementary methods including (1) melon sample growth,
collection, and handling, (2) extraction of polar metabolites fromground flesh samples for 1H NMR analysis, (3) spatial analysisof pH, refractive index, and osmolarity of melon juice, (4) 1HNMR analysis of melon juice, and supplementary data including(Figure S-1) baseline 1H NMR metabolite profiling of groundsamples of melon fruit, (Table S-1) 1H chemical shifts used foridentification and/or quantification of metabolites in polarextracts (in D2O) and in juices (in CD3OD/H2O) of melonfruits, (Table S-2) concentration of metabolites identified inflesh polar extracts of three melon cultivars (Cezanne, Escrito,and Hugo), (Table S-3) pH, osmolarity, and refractive indexmeasurements of juice collected in different locations of threemelon cultivars (Cezanne, Escrito, and Hugo), (Table S-4)concentration changes, depending on the location in the sliceof one melon, for metabolites identified in three melon cultivars(Cezanne, Escrito, and Hugo), and (Table S-5) a selection ofunambiguously identified metabolites detected in polar extractsof three melon cultivars (Cezanne, Escrito, and Hugo) byGC-EI-TOFMS. This material is available free of charge viathe Internet at http://pubs.acs.org.
Received for review December 2, 2008. Accepted March 2,2009.
AC9001996
2894 Analytical Chemistry, Vol. 81, No. 8, April 15, 2009


![Age-specific urinary metabolite signatures and functions in patients … · 2019-09-14 · for diagnosing bipolar disorder [11]. Our group has also used metabolomics to identify some](https://img.pdfslide.us/doc/110x75/5f4b7d6e9d960e13e83bb8ba/age-specific-urinary-metabolite-signatures-and-functions-in-patients-2019-09-14.jpg)