Embed Size (px)
Citation preview

1. Catchment Overview
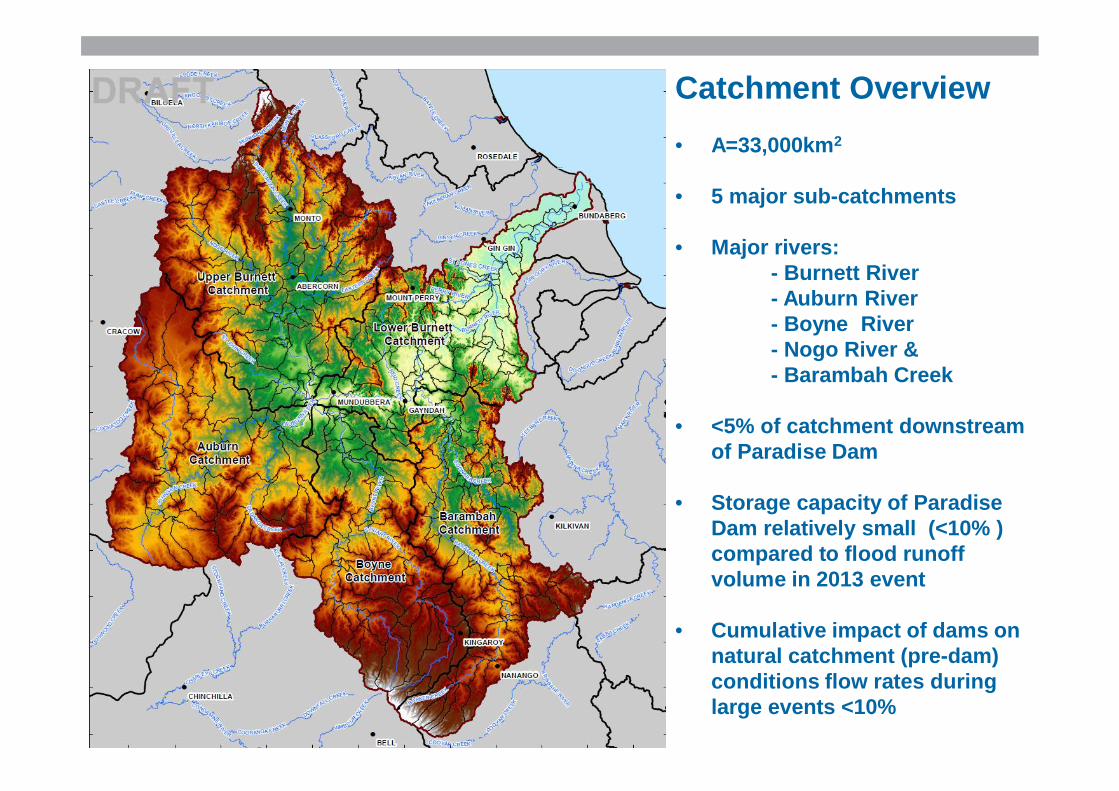
Catchment Overview• A=33,000km2
• 5 major sub-catchments
• Major rivers: - Burnett River- Auburn River- Boyne River- Nogo River & - Barambah Creek
• <5% of catchment downstream of Paradise Dam
• Storage capacity of Paradise Dam relatively small (<10% ) compared to flood runoff volume in 2013 event
• Cumulative impact of dams on natural catchment (pre-dam) conditions flow rates during large events <10%
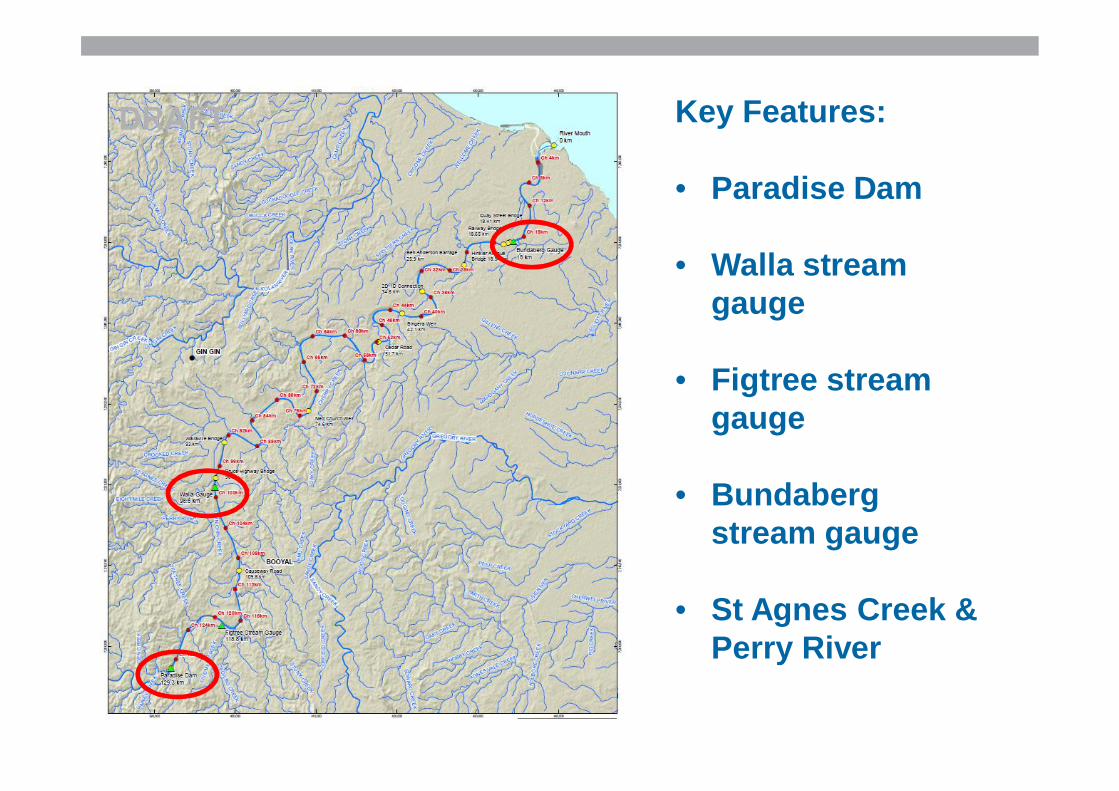
Key Features:
• Paradise Dam
• Walla stream gauge
• Figtree stream gauge
• Bundaberg stream gauge
• St Agnes Creek & Perry River
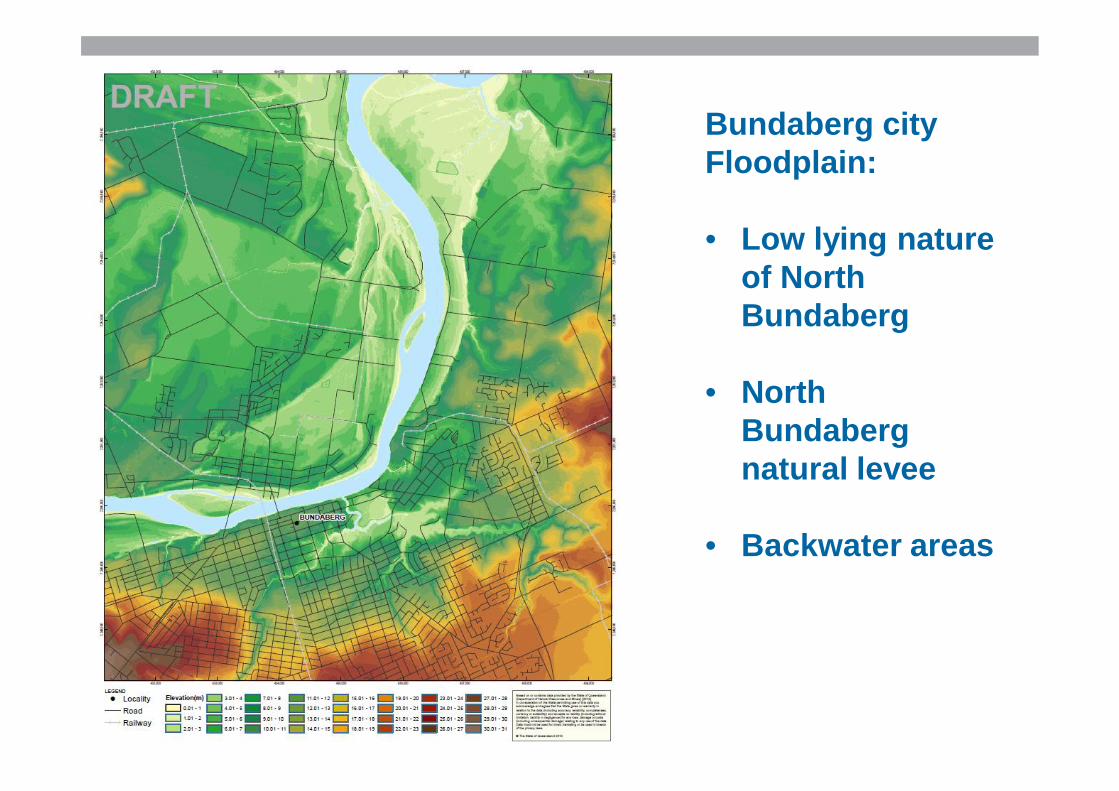
Bundaberg city Floodplain:
• Low lying nature of North Bundaberg
• North Bundaberg natural levee
• Backwater areas
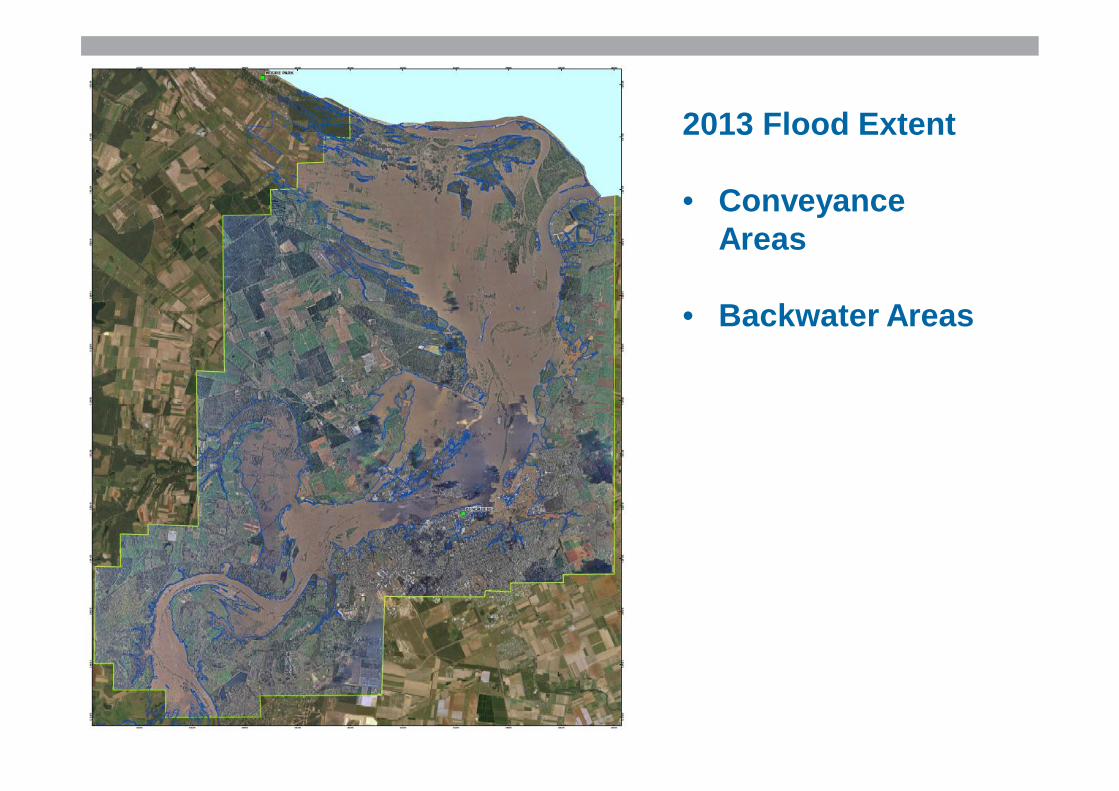
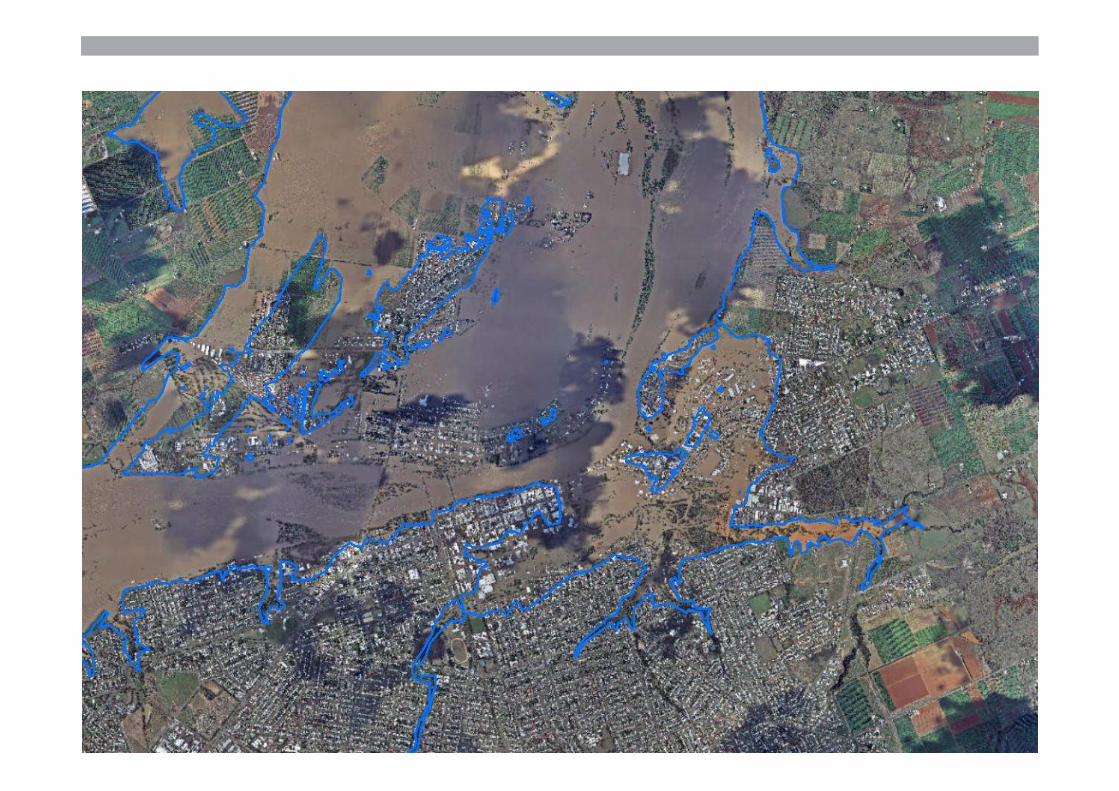
2013 Flood Extent
• Conveyance Areas
• Backwater Areas
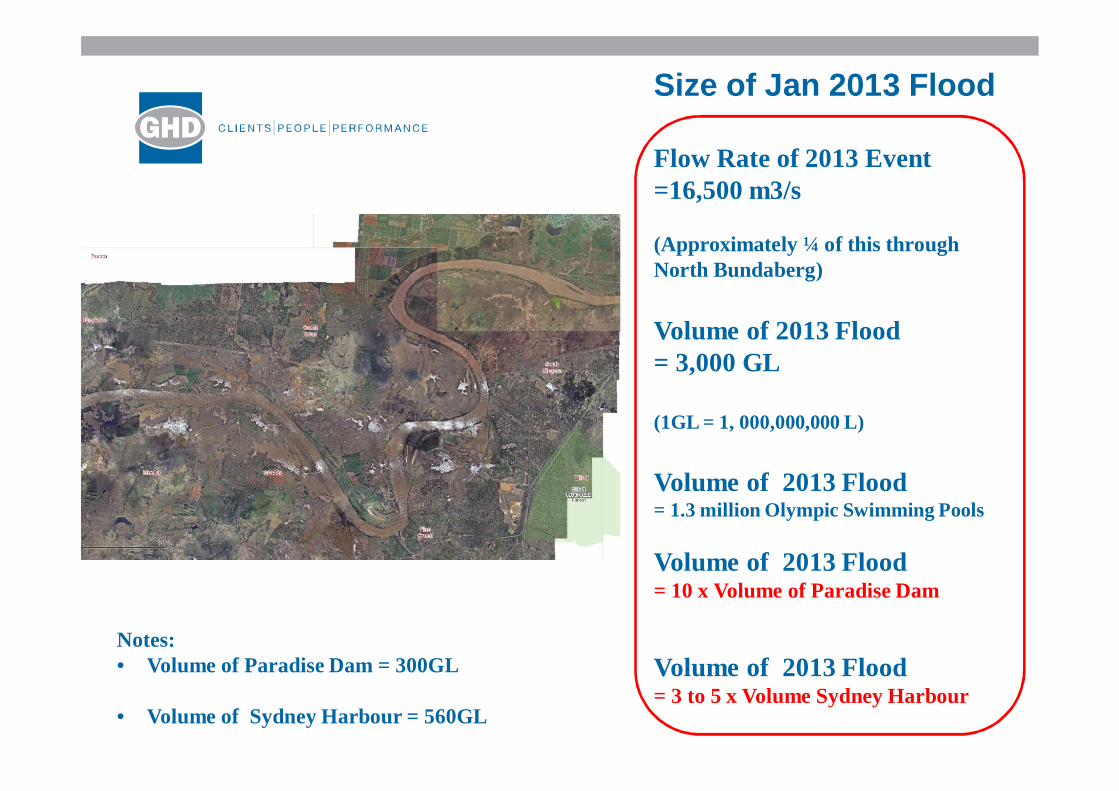
Size of Jan 2013 Flood
Flow Rate of 2013 Event=16,500 m3/s
(Approximately ¼ of this through North Bundaberg)
Volume of 2013 Flood= 3,000 GL
(1GL = 1, 000,000,000 L)
Volume of 2013 Flood= 1.3 million Olympic Swimming Pools
Volume of 2013 Flood= 10 x Volume of Paradise Dam
Volume of 2013 Flood= 3 to 5 x Volume Sydney Harbour
Notes:• Volume of Paradise Dam = 300GL
• Volume of Sydney Harbour = 560GL
22. Flood Study & Mapping Project
Flood Modelling and Mapping Study Objectives:
• Develop calibrated flood models of the Burnett River system(Paradise Dam to River Mouth)
• Assess design flood events (e.g. the 1 in 50yr to 1 in 500yr events)
• Prepare flood level, depth, velocity, hazard and emergency maps;
• Sensitivity Analysis.
How did we model the Burnett catchment ?
2 different types of numerical models were developed:
• A hydrologic model: used to estimate the rainfall runoff process. Outputs: flow rate hydrographs.
• A hydraulic model: used to simulate the dynamic propagation of flood flows across a floodplain. Outputs: Flood extents, levels, depths and velocities.
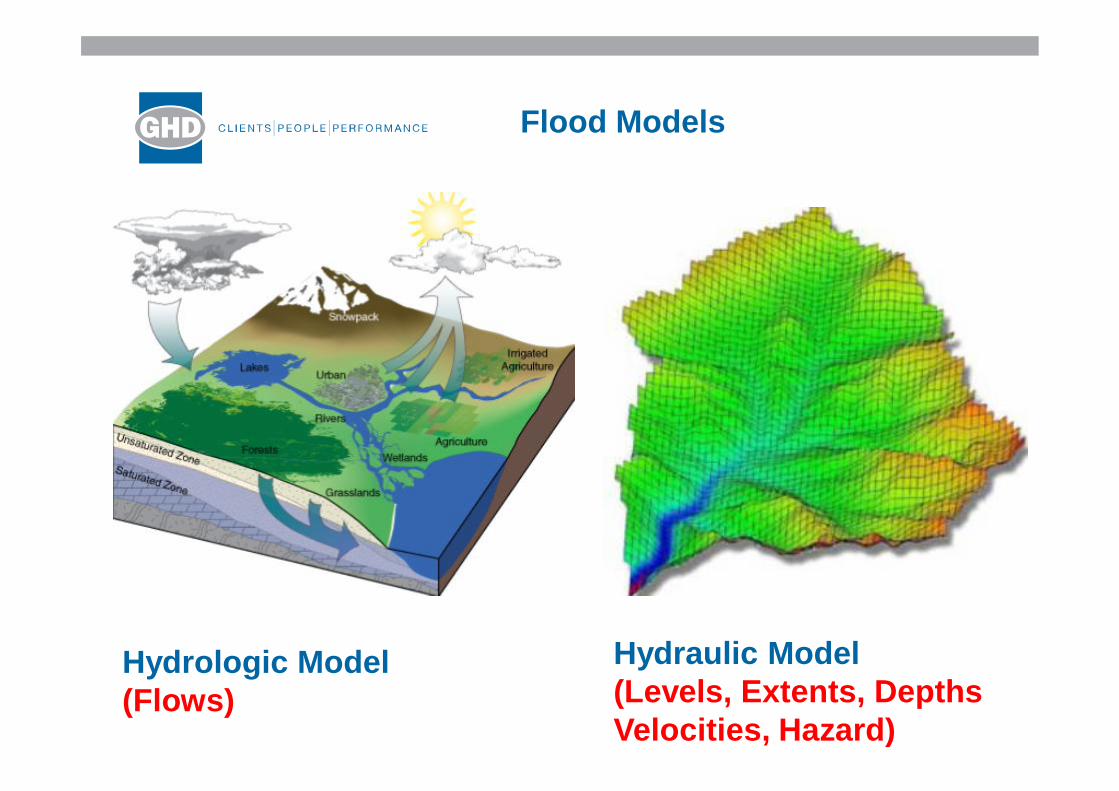
Flood Models
Hydrologic Model (Flows)
Hydraulic Model (Levels, Extents, Depths Velocities, Hazard)
Hydrologic Modelling
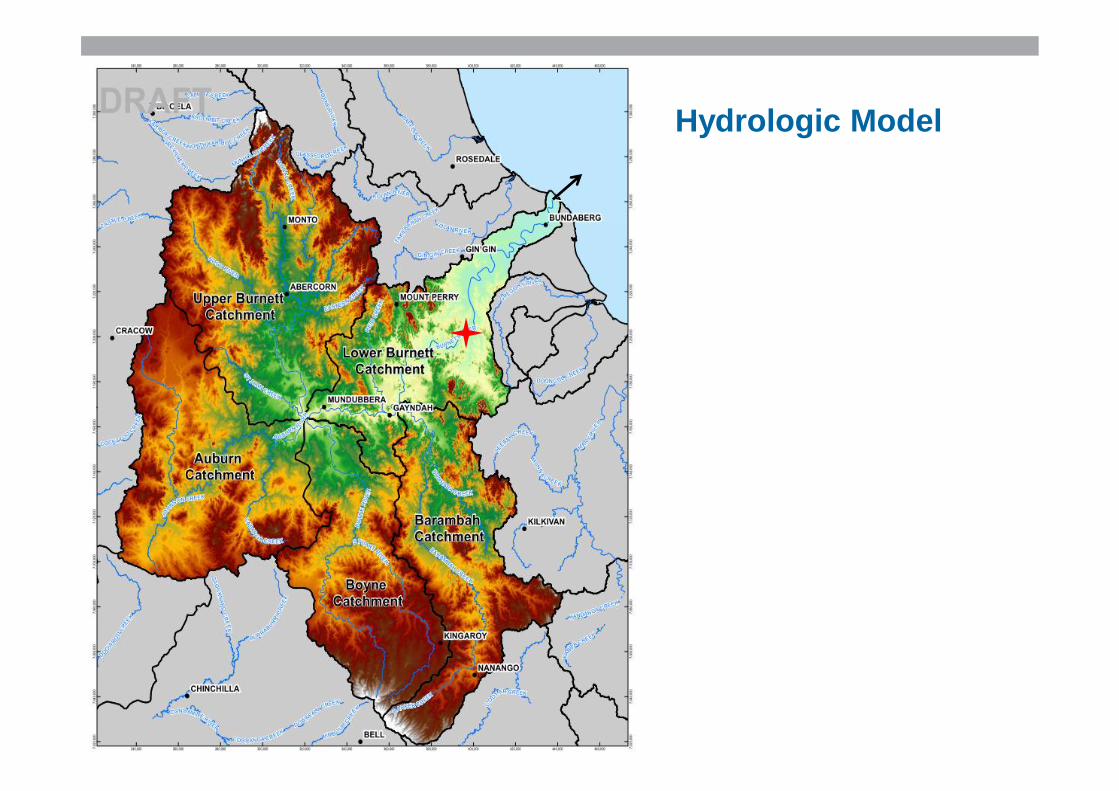
Hydrologic Model
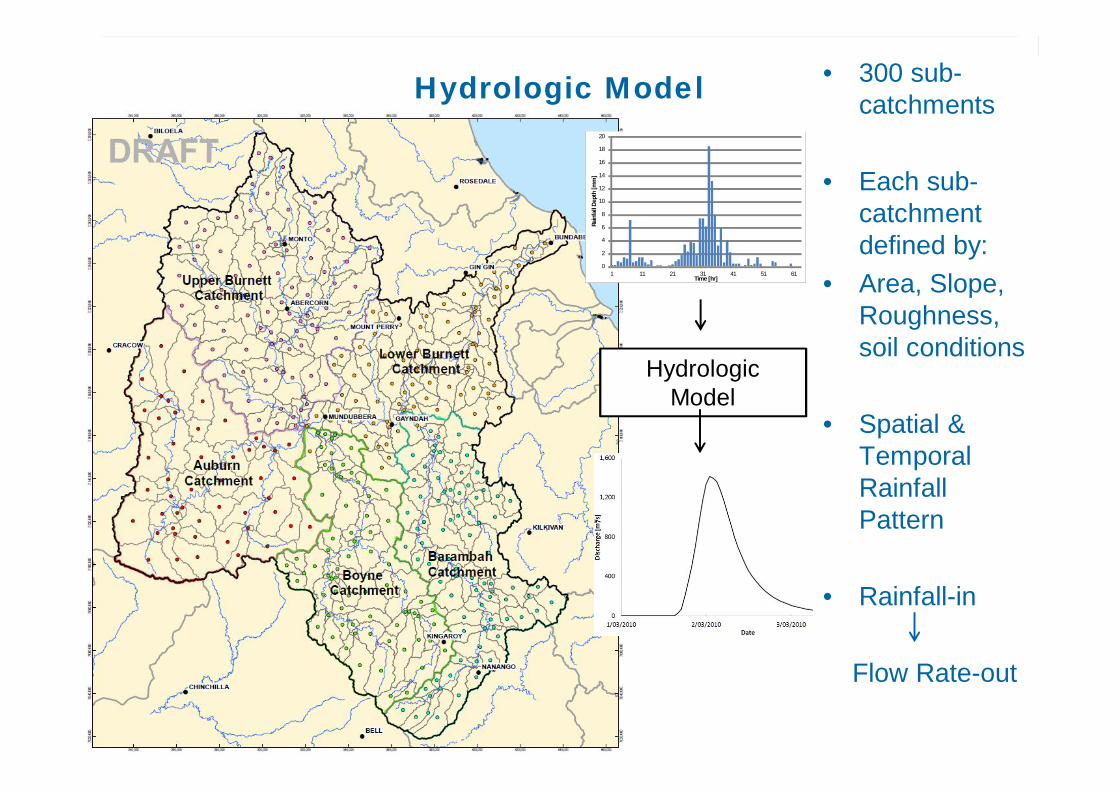
Hydrologic Model • 300 sub-catchments
• Each sub-catchment defined by:
• Area, Slope, Roughness, soil conditions
• Spatial & Temporal Rainfall Pattern
• Rainfall-in
Flow Rate-out
0
2
4
6
8
10
12
14
16
18
20
1 11 21 31 41 51 61
Rain
fall
Dept
h [m
m]
Time [hr]
Hydrologic Model
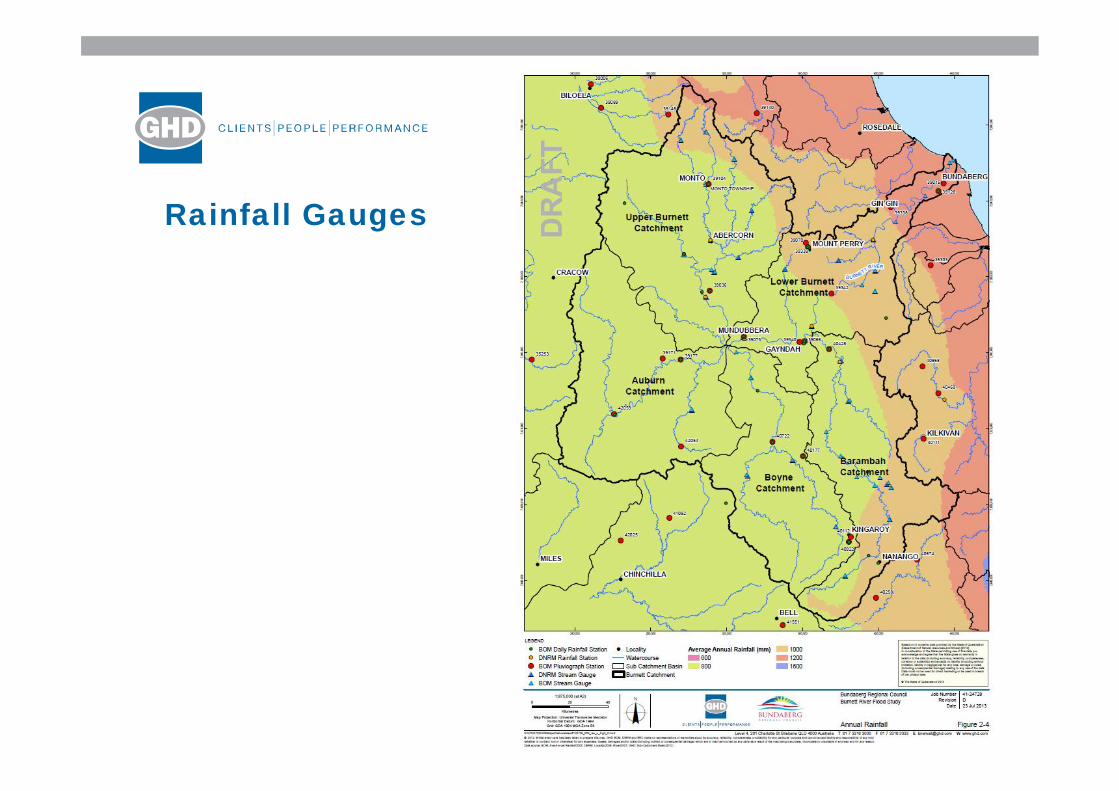
Rainfall Gauges
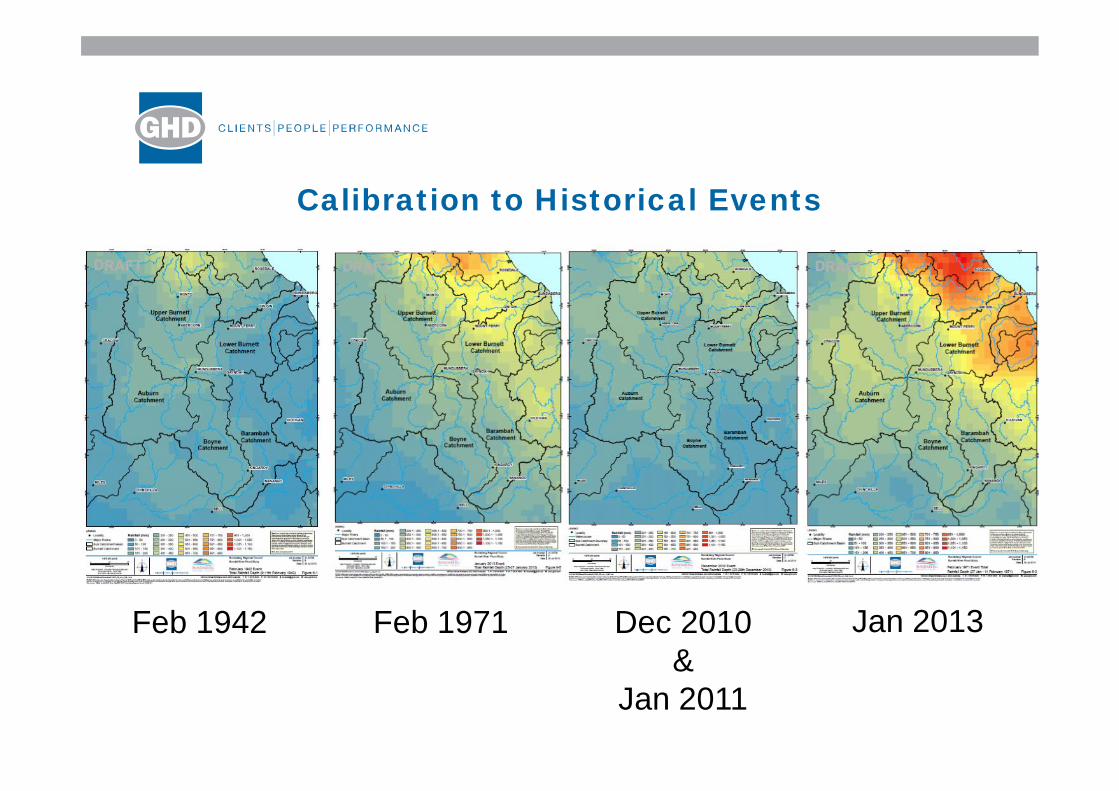
Feb 1942 Feb 1971 Dec 2010 &
Jan 2011
Jan 2013
Calibration to Historical Events
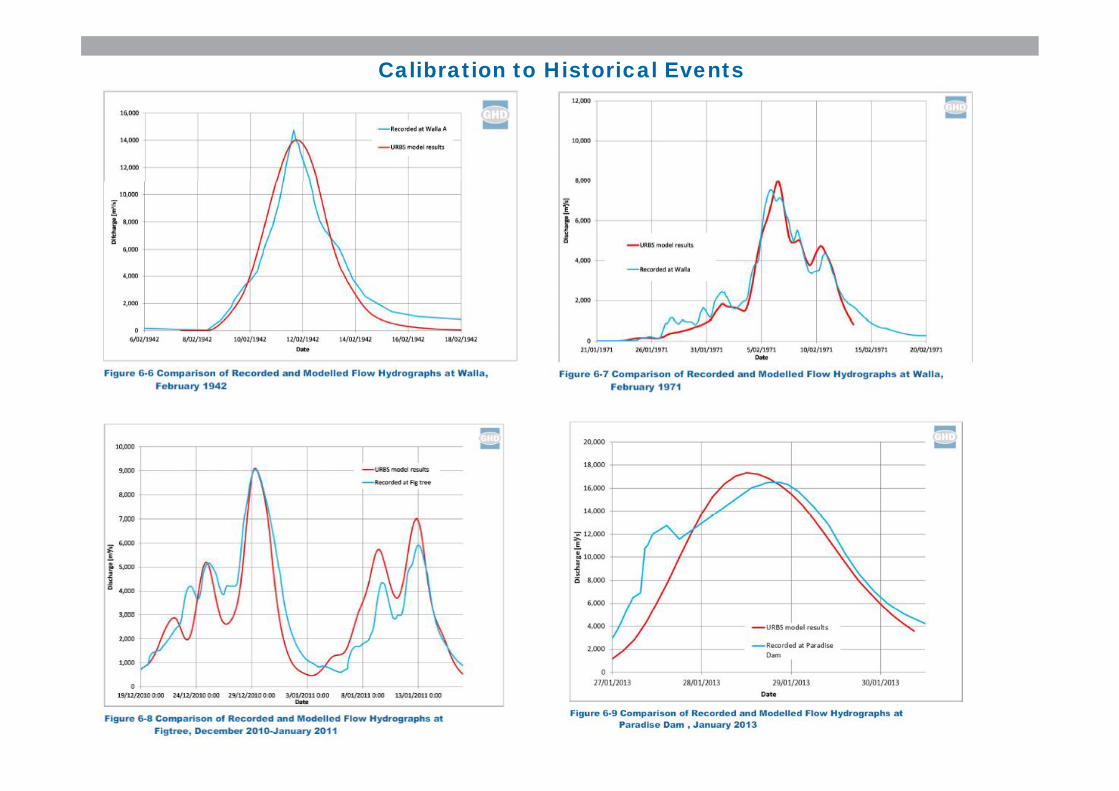
Calibration to Historical Events
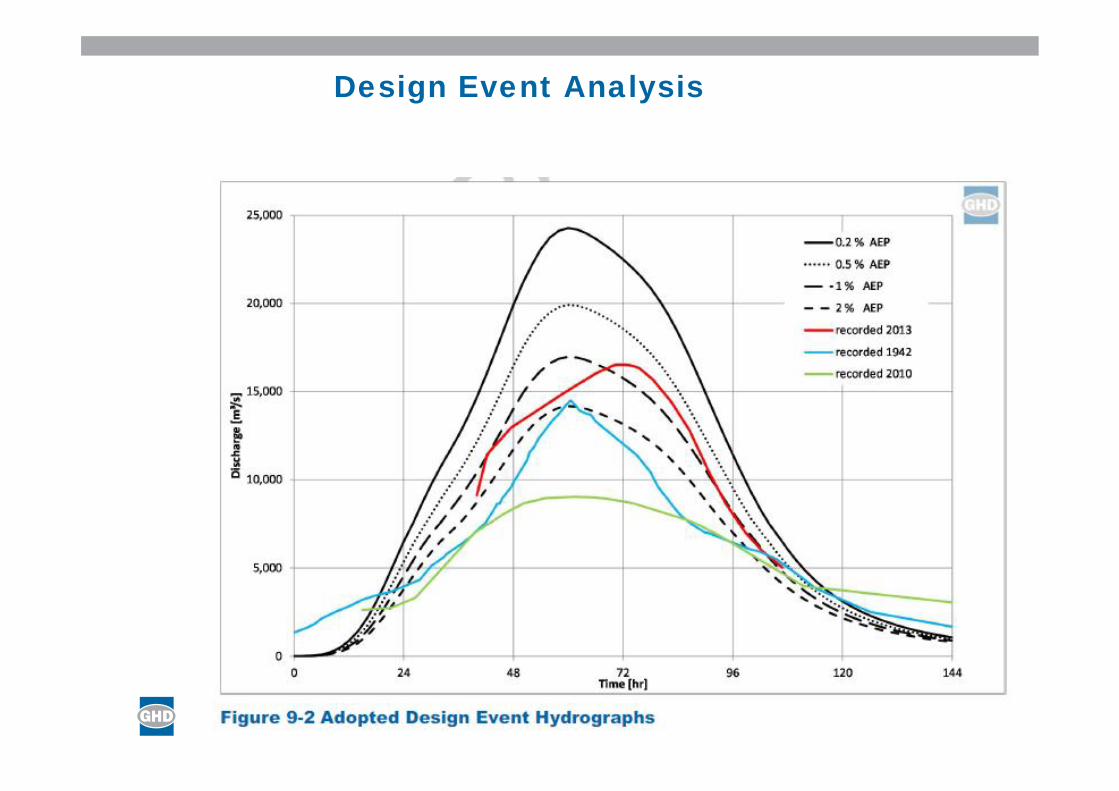
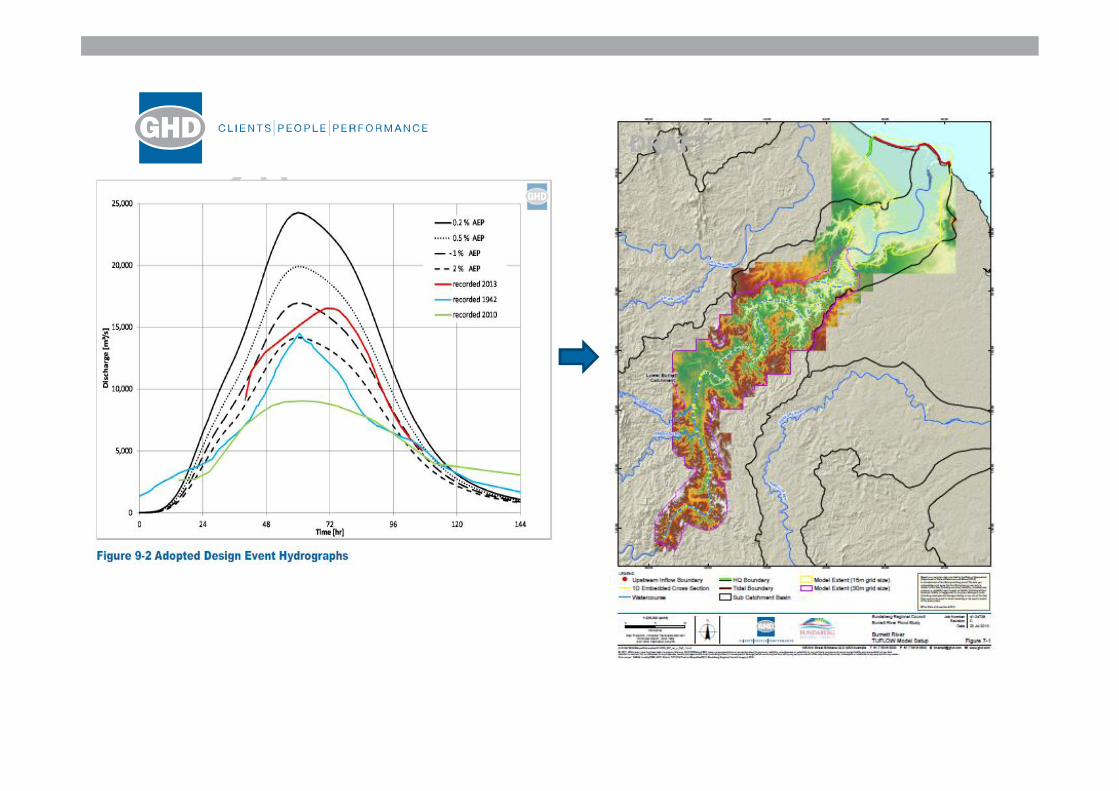
Design Event Analysis
Hydraulic Modelling
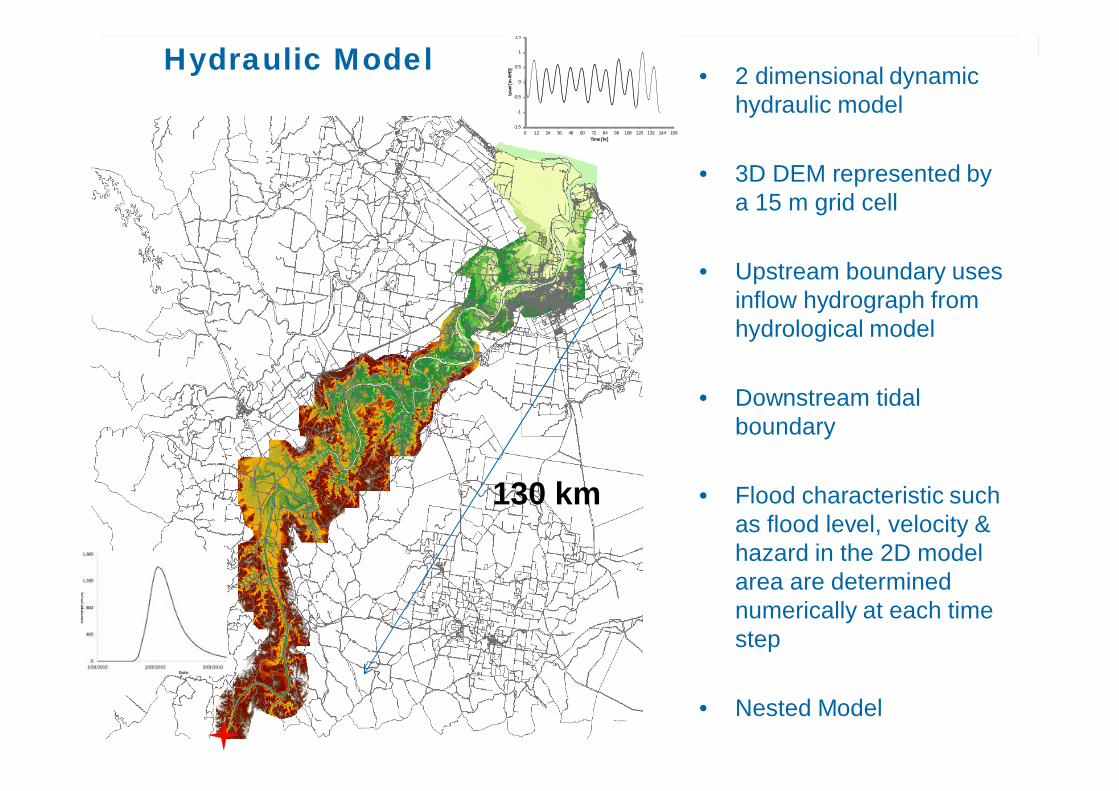
Hydraulic Model • 2 dimensional dynamic hydraulic model
• 3D DEM represented by a 15 m grid cell
• Upstream boundary uses inflow hydrograph from hydrological model
• Downstream tidal boundary
• Flood characteristic such as flood level, velocity & hazard in the 2D model area are determined numerically at each time step
• Nested Model
130 km
-1.5
-1
-0.5
0
0.5
1
1.5
0 12 24 36 48 60 72 84 96 108 120 132 144 156
Leve
l [m
AHD
]
Time [hr]
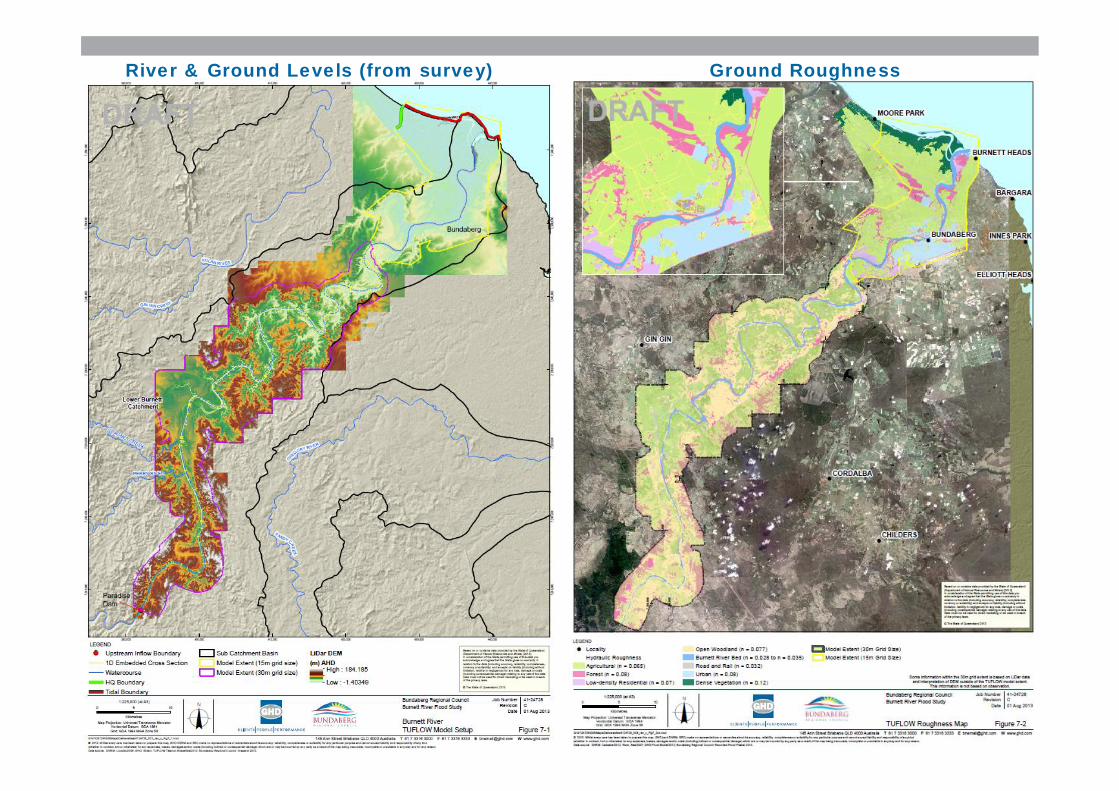
River & Ground Levels (from survey) Ground Roughness
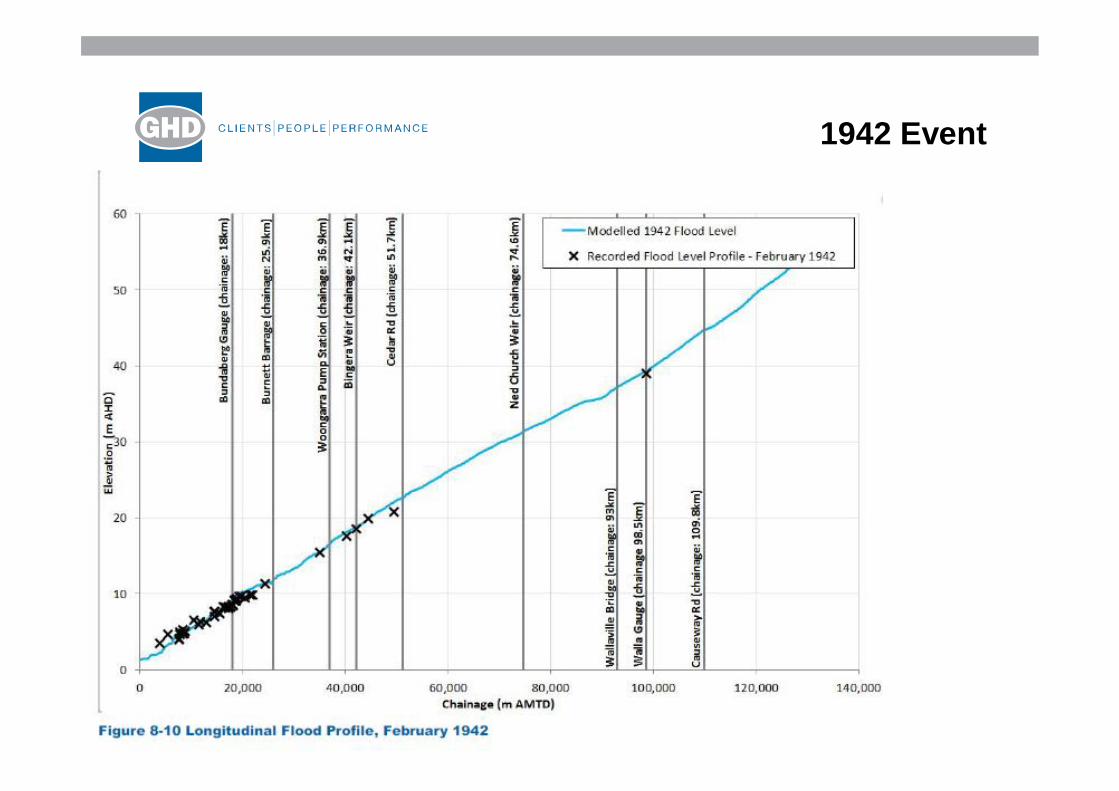
1942 Event
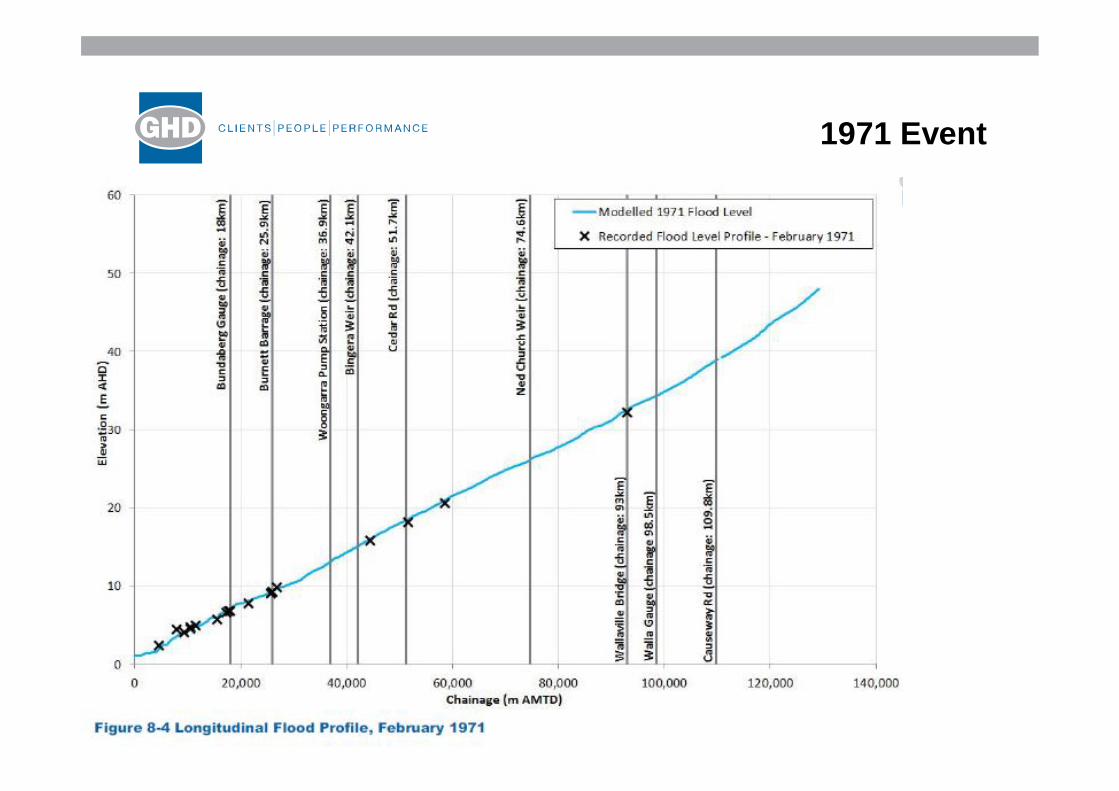
1971 Event
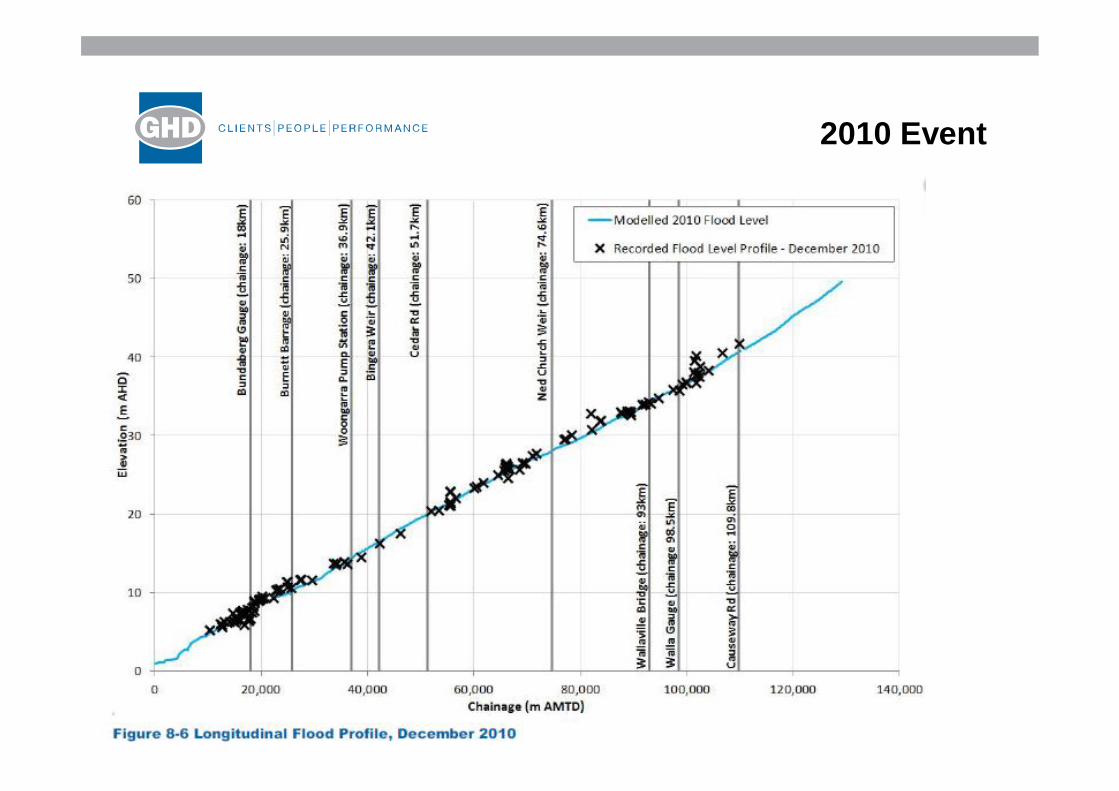
2010 Event
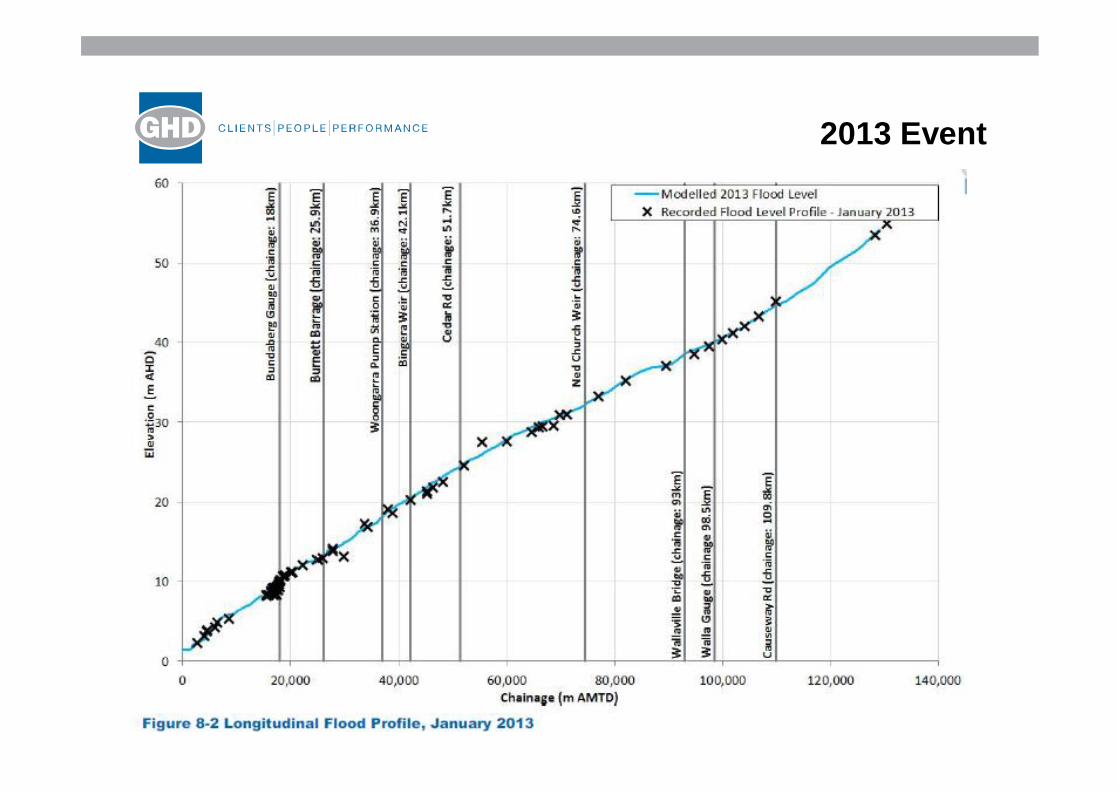
2013 Event
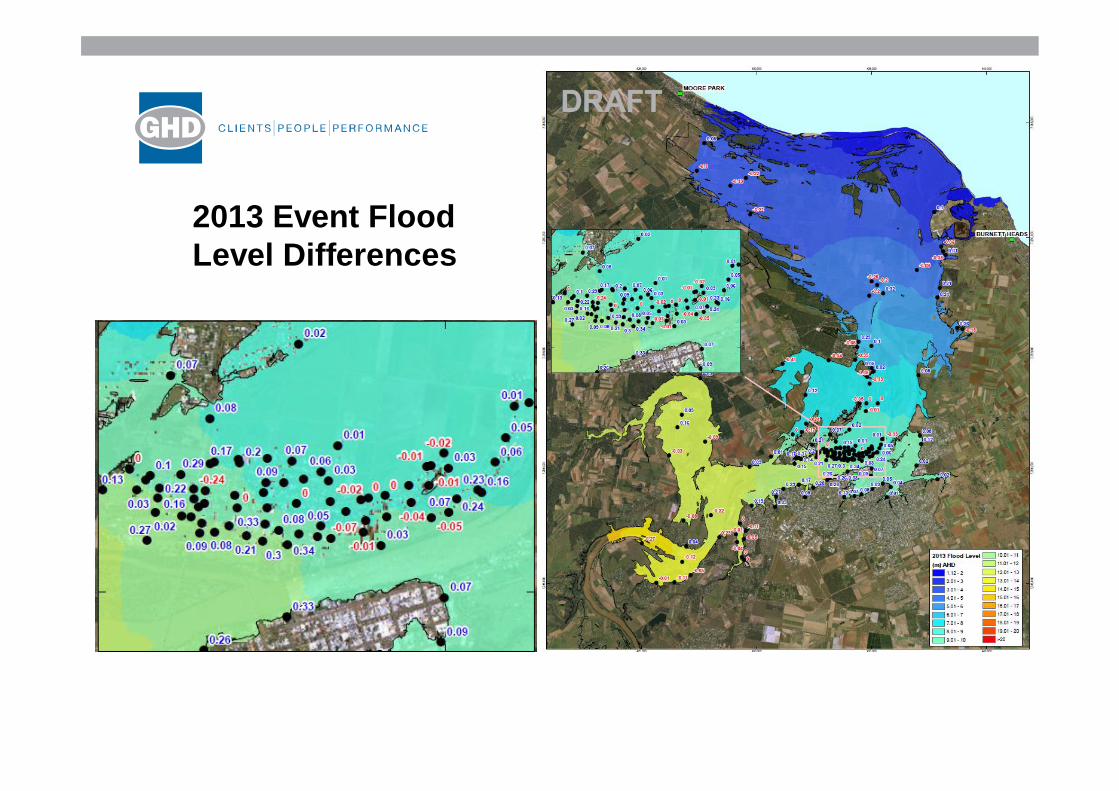
2013 Event Flood Level Differences
January 29, 2013
2013 Flood Animation
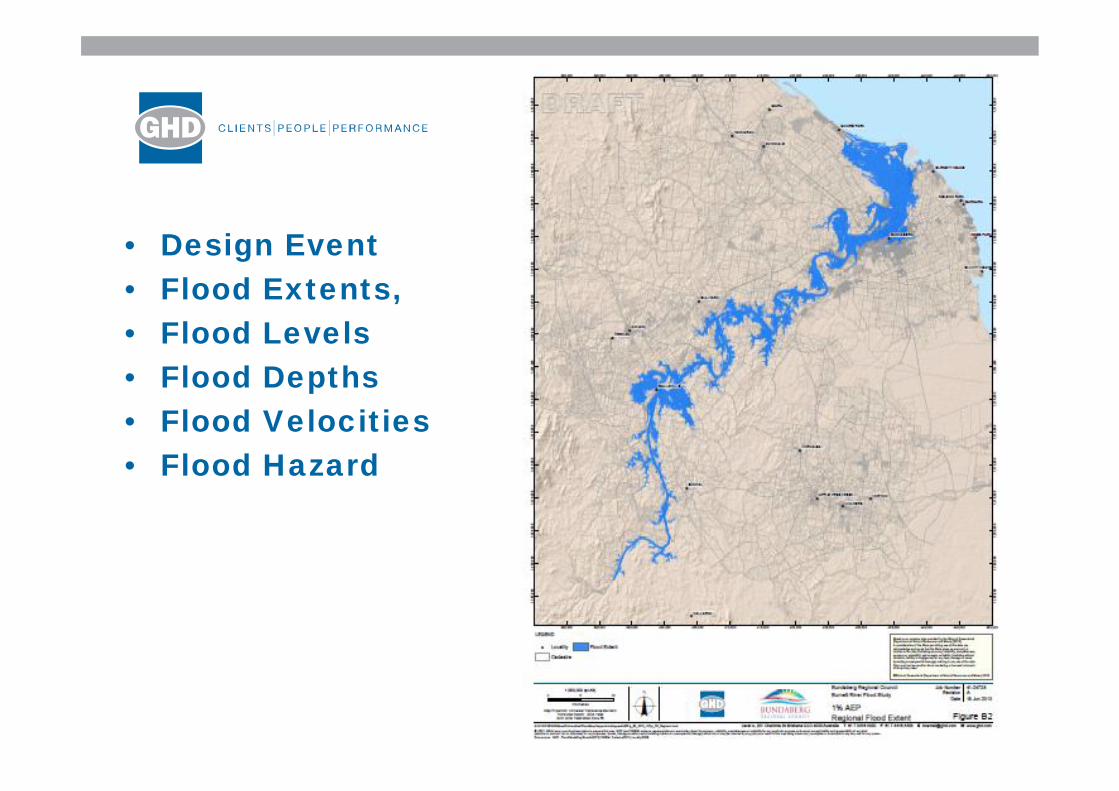
• Design Event • Flood Extents,• Flood Levels• Flood Depths• Flood Velocities• Flood Hazard
Design Event Analysis
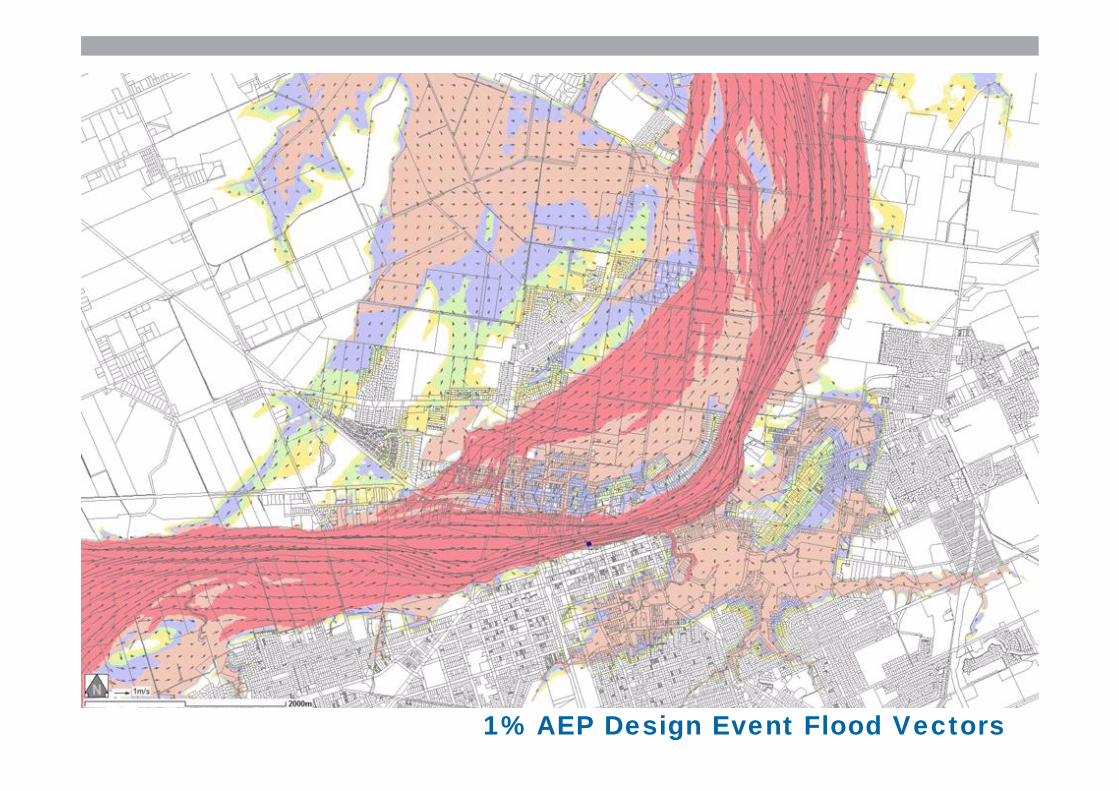
1% AEP Design Event Flood Vectors
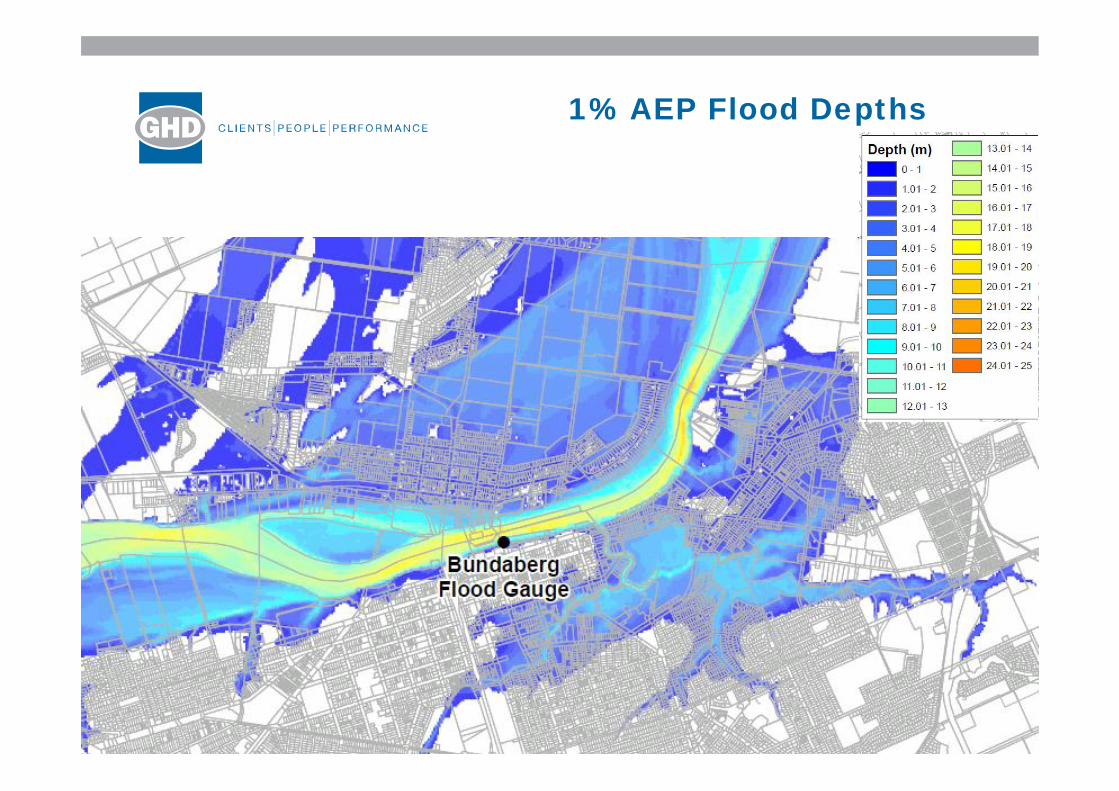
1% AEP Flood Depths
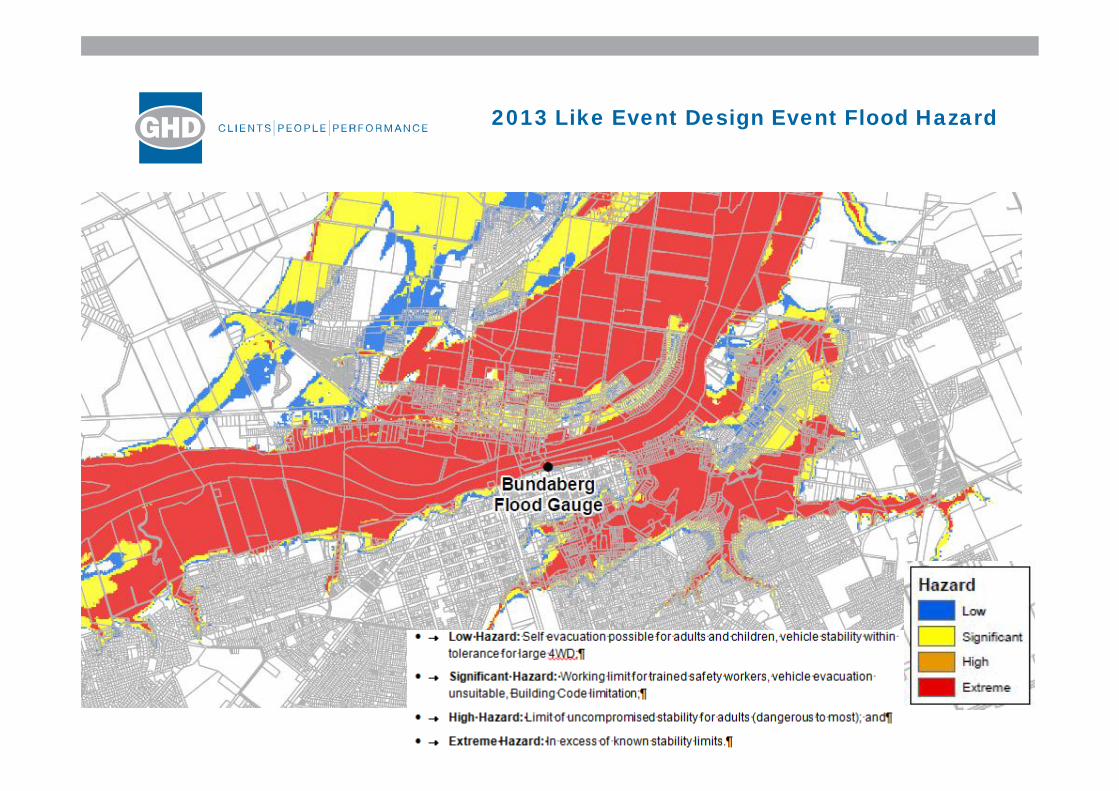
2013 Like Event Design Event Flood Hazard
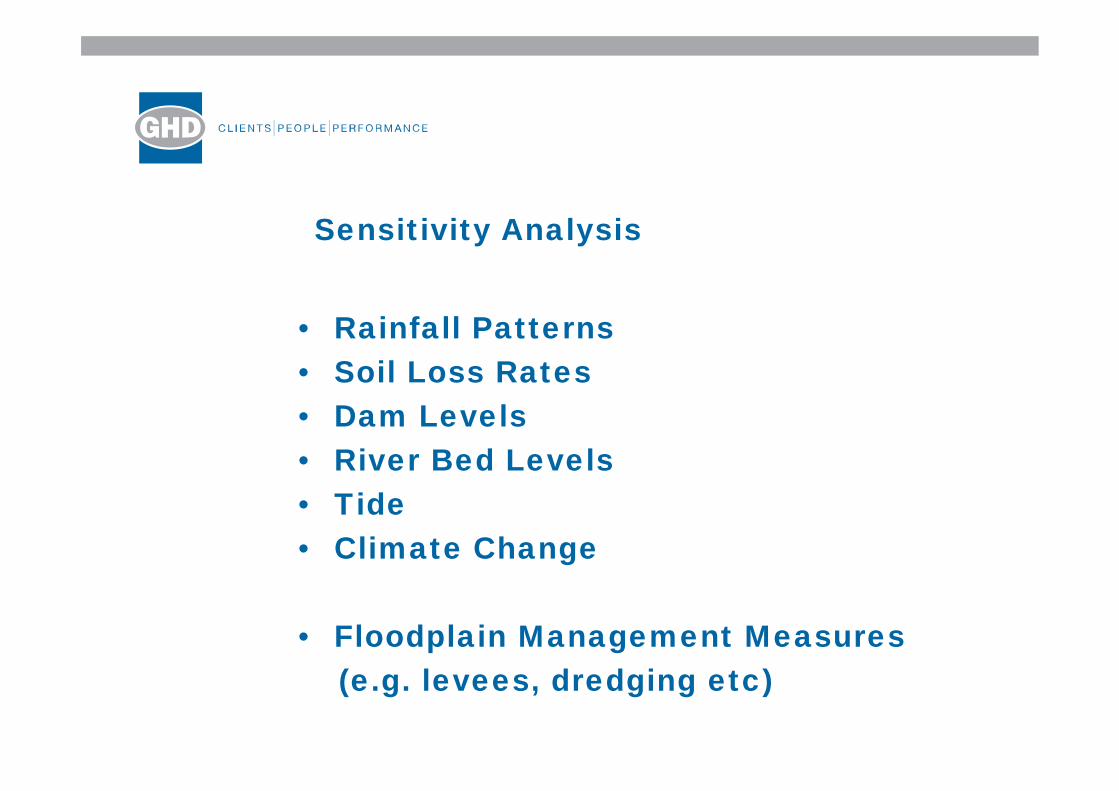
Sensitivity Analysis
• Rainfall Patterns• Soil Loss Rates• Dam Levels• River Bed Levels• Tide• Climate Change
• Floodplain Management Measures(e.g. levees, dredging etc)
3. Floodplain Action Plan
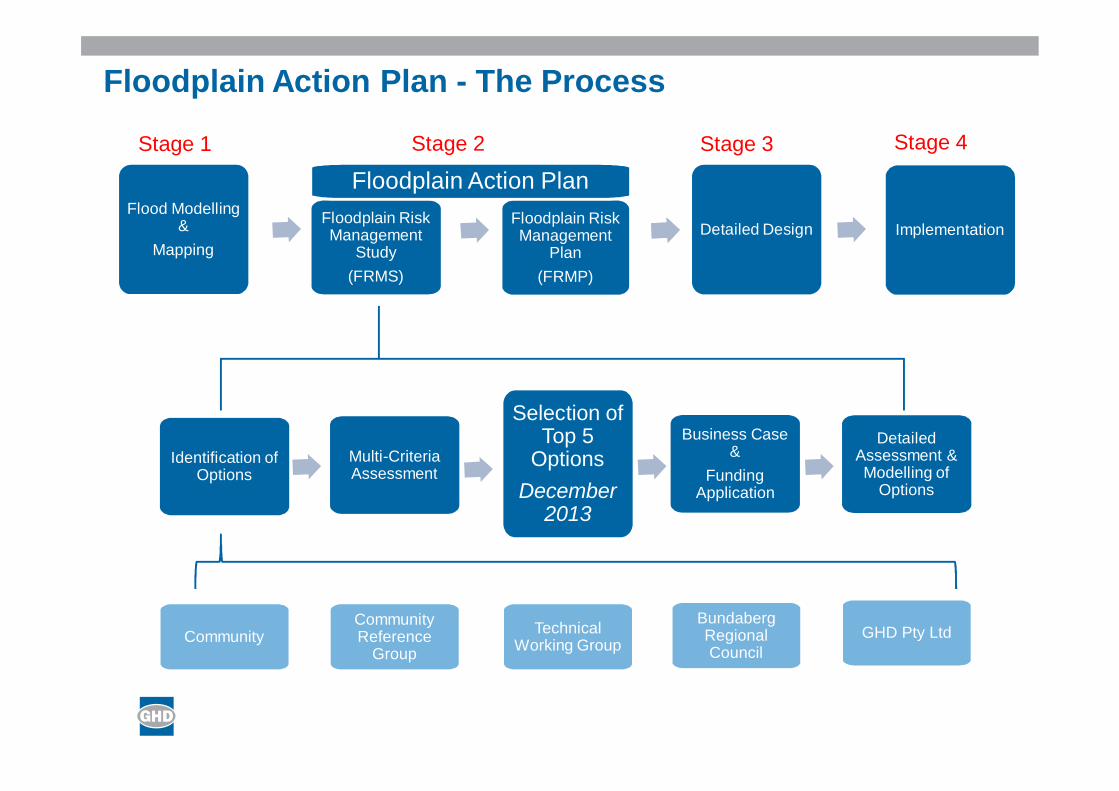
Flood Modelling &
Mapping
Floodplain Action Plan - The Process
Identification of Options
Multi-Criteria Assessment
December 2013
Selection of Top 5
OptionsDecember
2013
Business Case &
Funding Application
Detailed Assessment & Modelling of
Options
Detailed Design ImplementationFloodplain Risk Management
Study(FRMS)
Floodplain Risk Management
Plan(FRMP)
Floodplain Action Plan
CommunityCommunity Reference
GroupTechnical
Working Group
Bundaberg Regional Council
GHD Pty Ltd
Stage 1 Stage 2 Stage 3 Stage 4
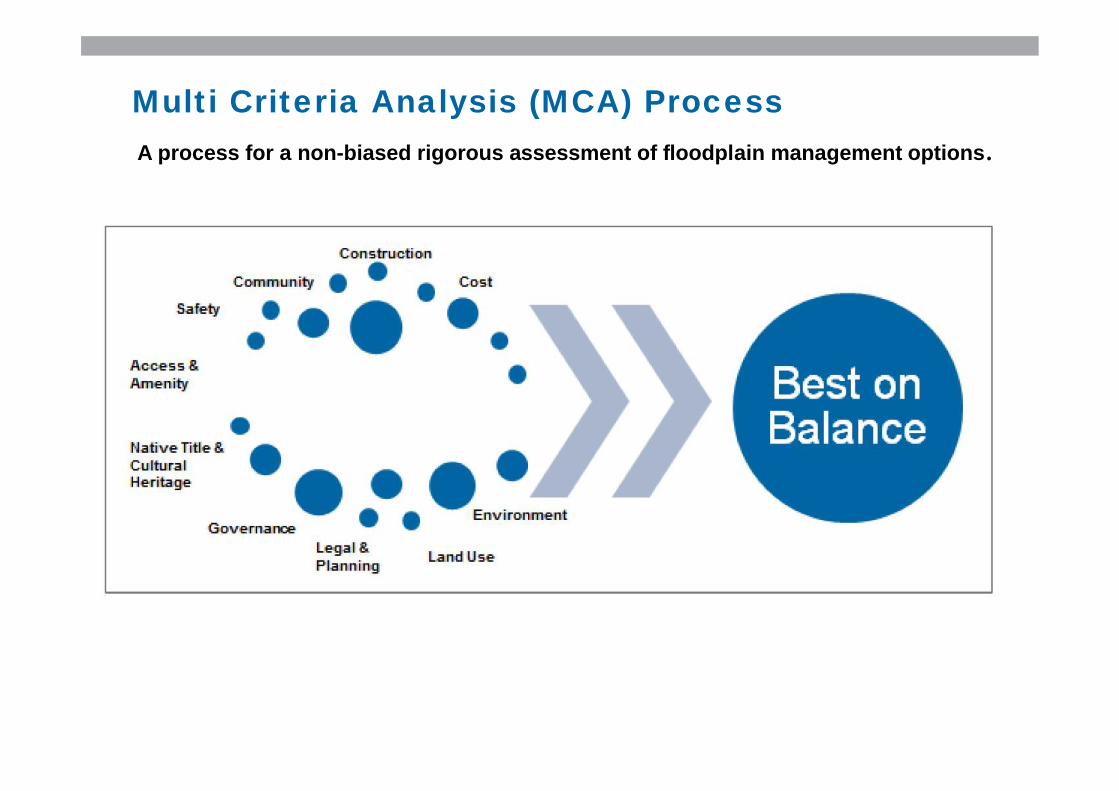
Multi Criteria Analysis (MCA) ProcessA process for a non-biased rigorous assessment of floodplain management options.
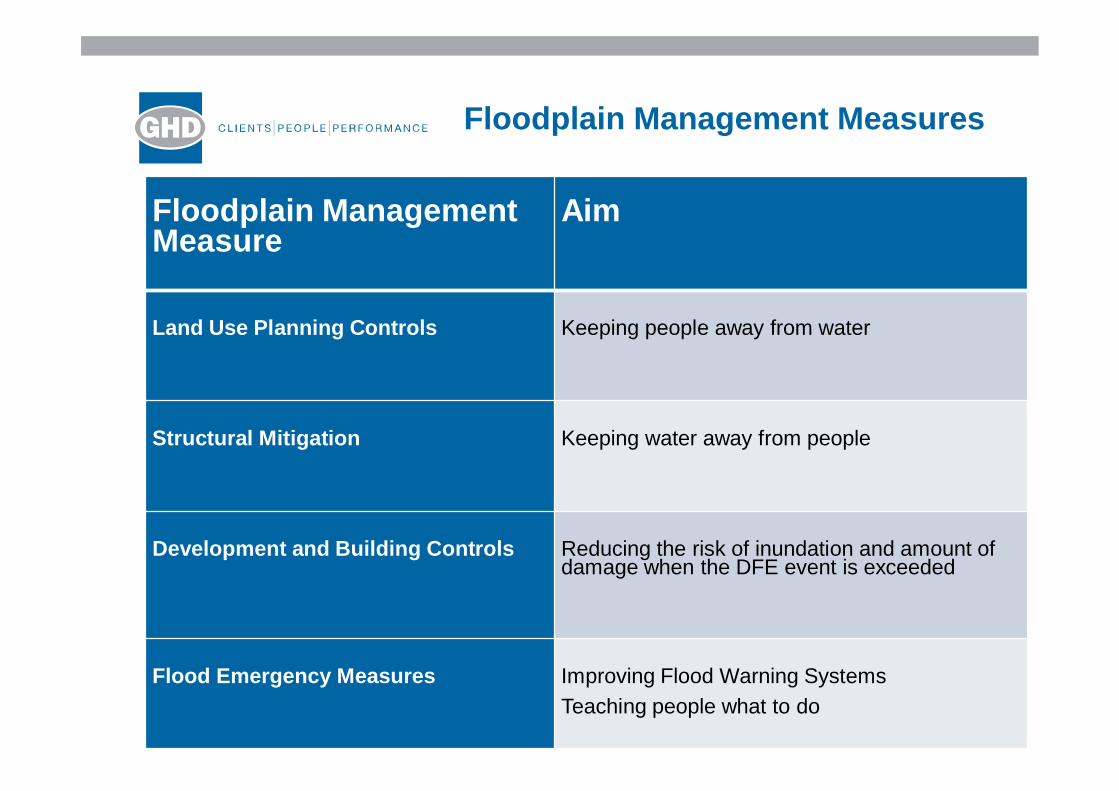
Floodplain Management Measures
Floodplain Management Measure
Aim
Land Use Planning Controls Keeping people away from water
Structural Mitigation Keeping water away from people
Development and Building Controls Reducing the risk of inundation and amount of damage when the DFE event is exceeded
Flood Emergency Measures Improving Flood Warning SystemsTeaching people what to do
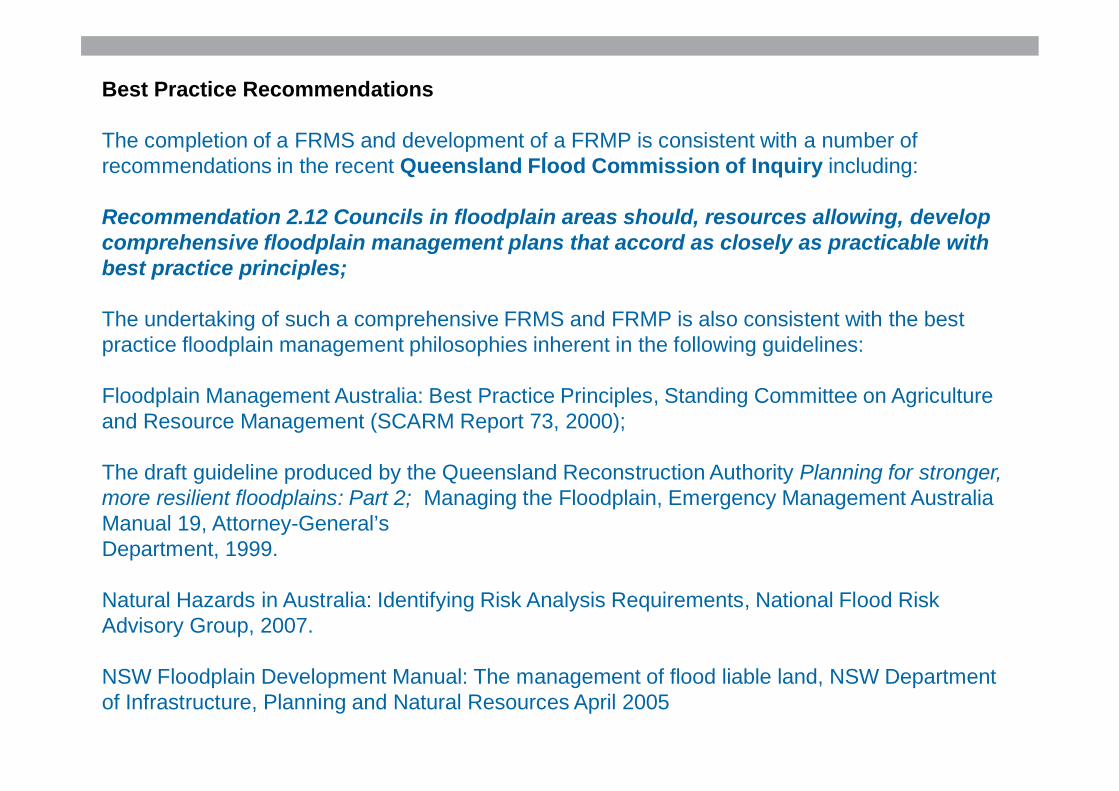
Best Practice Recommendations
The completion of a FRMS and development of a FRMP is consistent with a number ofrecommendations in the recent Queensland Flood Commission of Inquiry including:
Recommendation 2.12 Councils in floodplain areas should, resources allowing, develop comprehensive floodplain management plans that accord as closely as practicable with best practice principles;
The undertaking of such a comprehensive FRMS and FRMP is also consistent with the best practice floodplain management philosophies inherent in the following guidelines:
Floodplain Management Australia: Best Practice Principles, Standing Committee on Agriculture and Resource Management (SCARM Report 73, 2000);
The draft guideline produced by the Queensland Reconstruction Authority Planning for stronger, more resilient floodplains: Part 2; Managing the Floodplain, Emergency Management Australia Manual 19, Attorney-General’sDepartment, 1999.
Natural Hazards in Australia: Identifying Risk Analysis Requirements, National Flood RiskAdvisory Group, 2007.
NSW Floodplain Development Manual: The management of flood liable land, NSW Department of Infrastructure, Planning and Natural Resources April 2005
4. Key Outputs
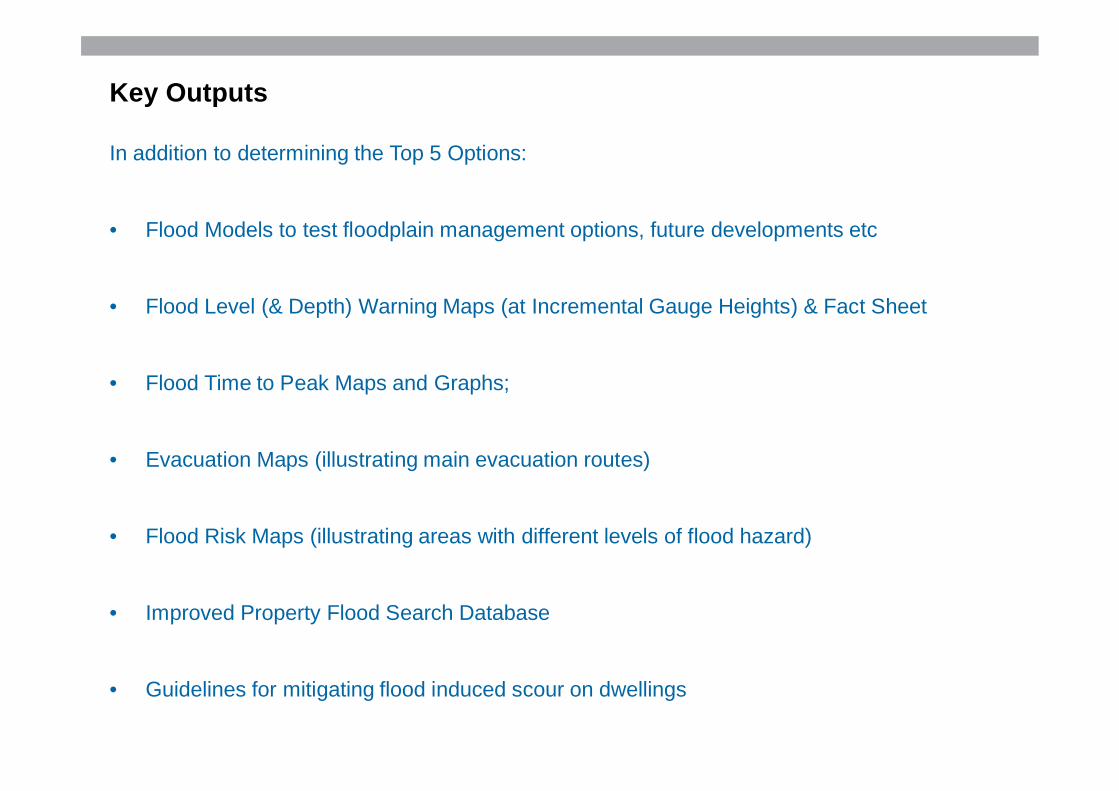
Key Outputs
In addition to determining the Top 5 Options:
• Flood Models to test floodplain management options, future developments etc
• Flood Level (& Depth) Warning Maps (at Incremental Gauge Heights) & Fact Sheet
• Flood Time to Peak Maps and Graphs;
• Evacuation Maps (illustrating main evacuation routes)
• Flood Risk Maps (illustrating areas with different levels of flood hazard)
• Improved Property Flood Search Database
• Guidelines for mitigating flood induced scour on dwellings
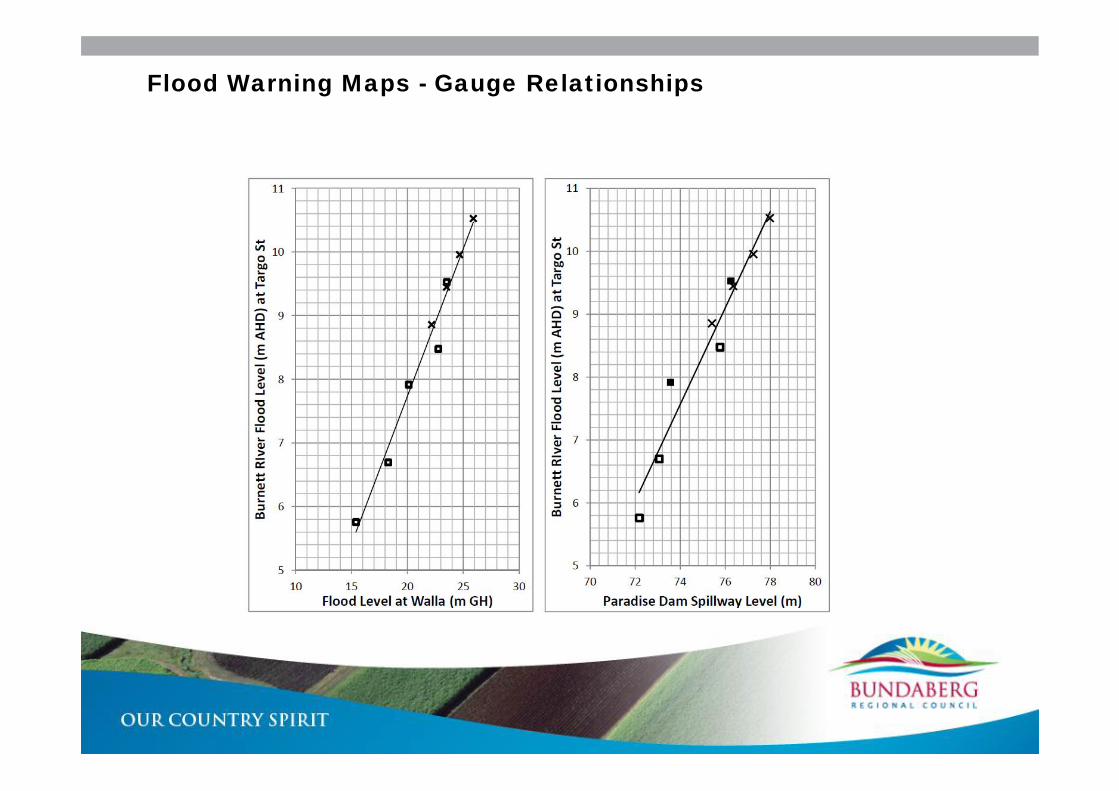
Flood Warning Maps - Gauge Relationships
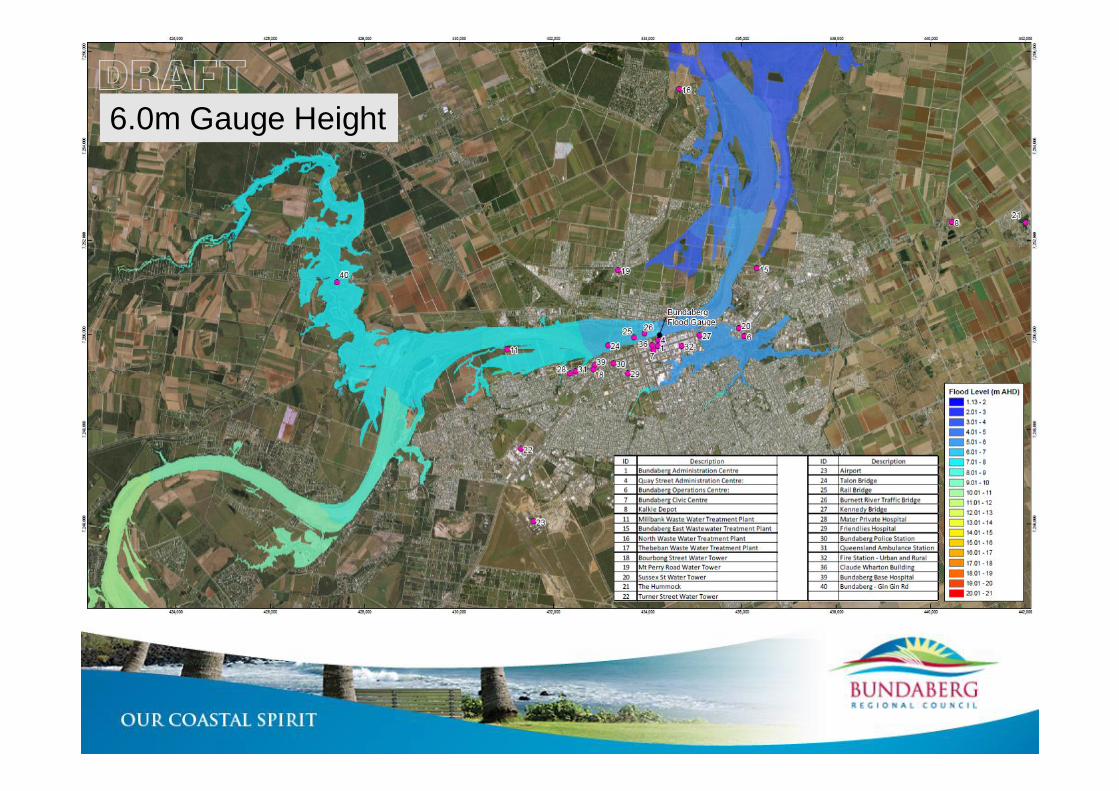
6.0m Gauge Height
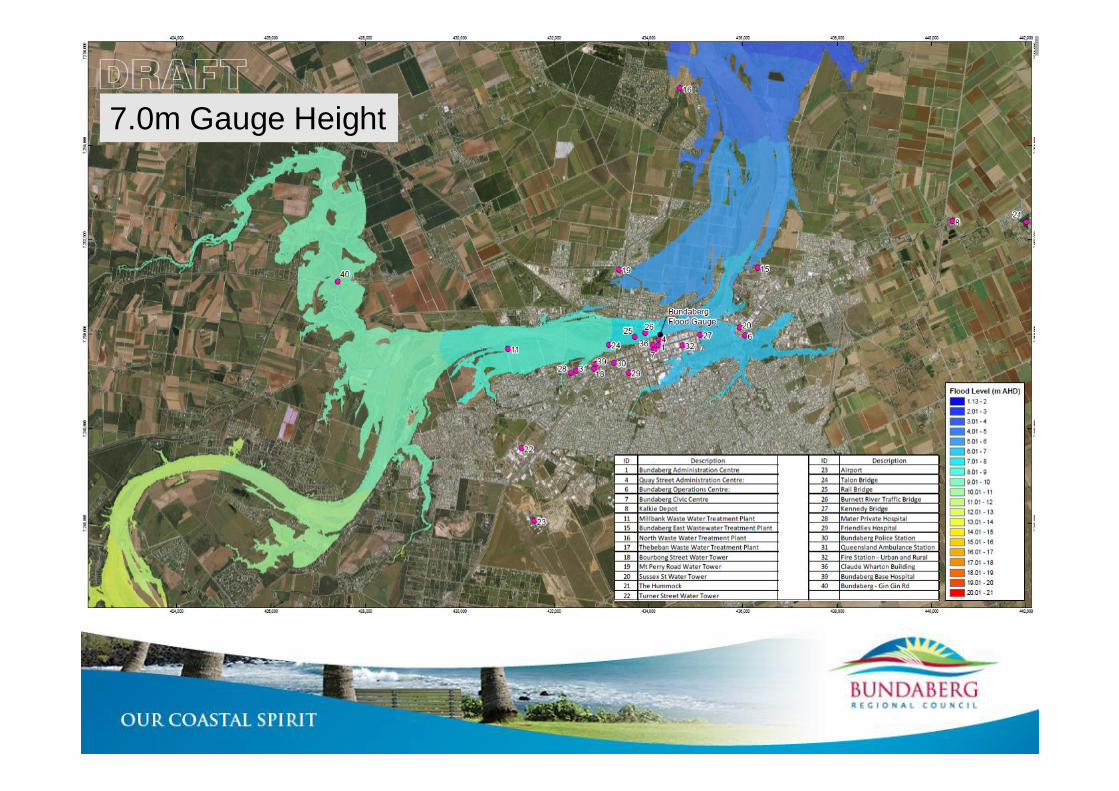
7.0m Gauge Height
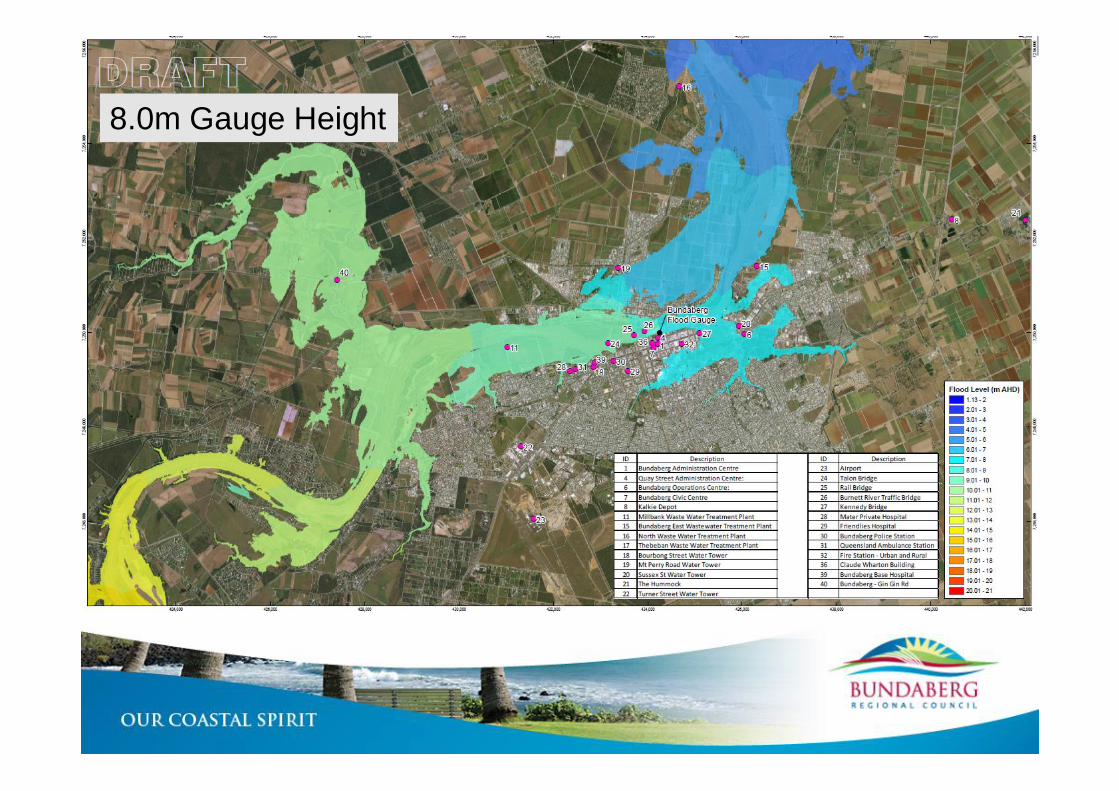
8.0m Gauge Height
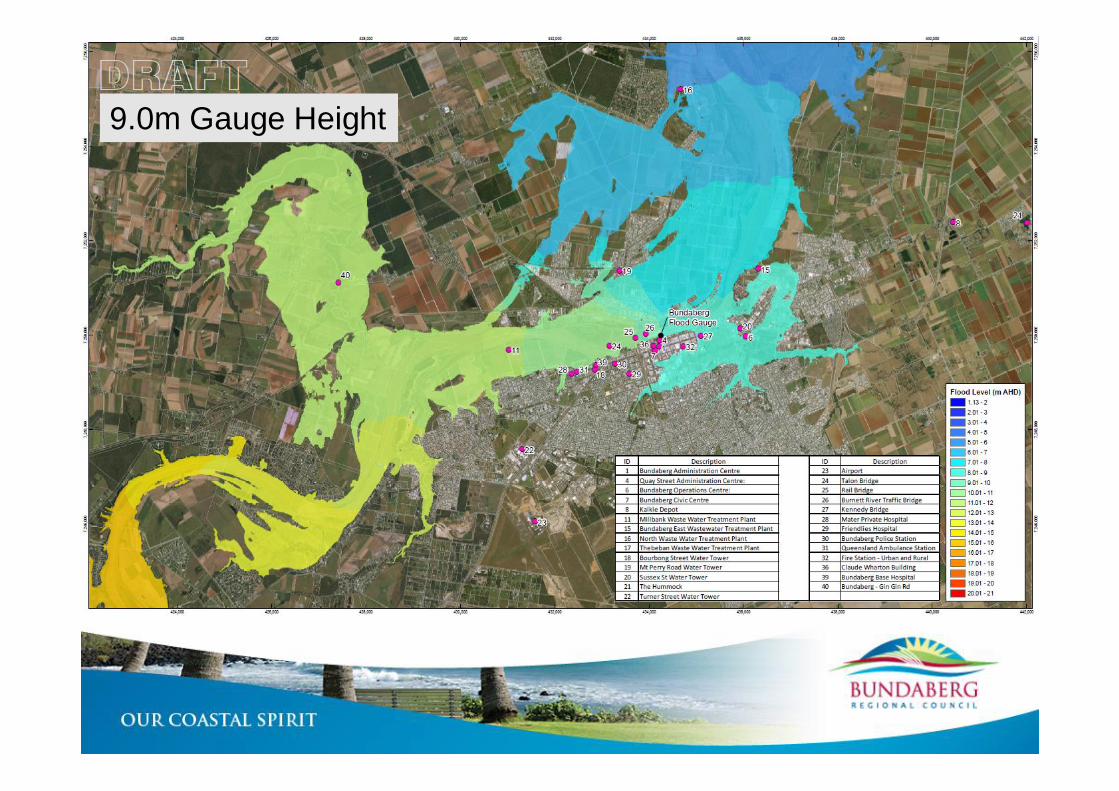
9.0m Gauge Height
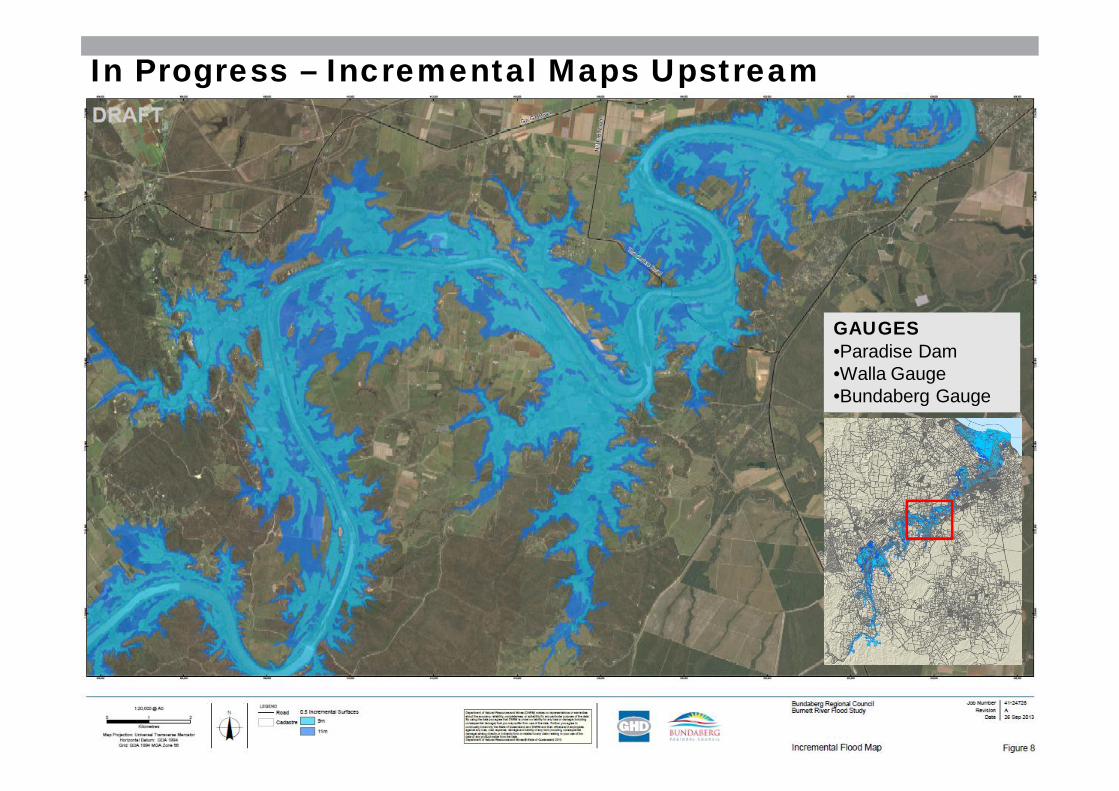
In Progress – Incremental Maps Upstream
GAUGES•Paradise Dam•Walla Gauge•Bundaberg Gauge
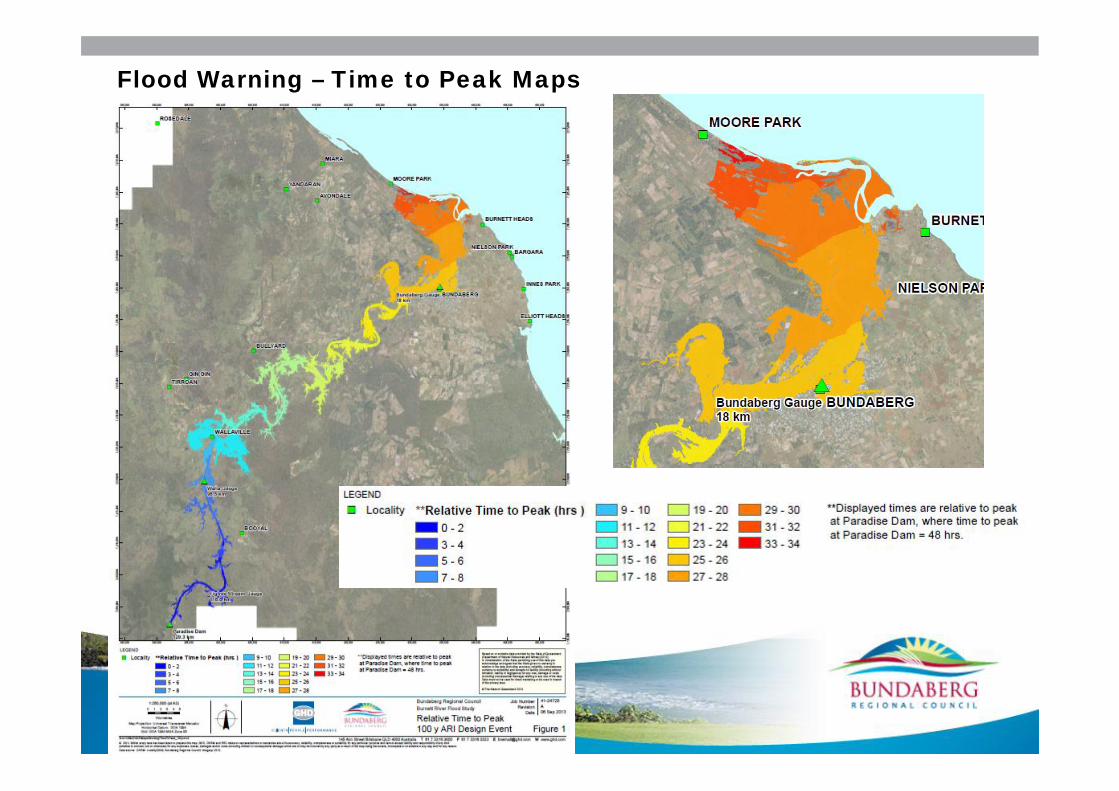
Flood Warning – Time to Peak Maps

4. Information Boards