Embed Size (px)
Citation preview
~~
l \
~ '1
I , , "' f
TECHNICAL REPORT STANDARD TITLE PAGE
1. Report No. 2. Government Accession No. 3. Recipient' 5 Catalog No.
FHWA/TX-79/10+209-1F
r.41.~T~i~tl~e~a~nd~Su~b7ti~tl~e--------------~----------------------------~-5~.~R-ep-o-rt~D~0-te----------------------
FATIGUE LOADING OF CANTILEVER SIGN STRUCTURES FROM TRUCK WIND GUSTS
7. Author' 5)
Bruce M. Creamer, Karl H. Frank, and Richard E. K1ingner 9. Performing Organi zotion Name and Addre ..
Center for Highway Research
April 1979 YPerforming Organization Code
8. Performing Orgoni zation Report No.
Research Report 209-1F
10. Work Unit No.
11. Contract or Grant No. The University of Texas at Austin Austin, Texas 78712 Research Study 3-5-77-209
1-;"-;;--;-------:------:-:------;-;-;-;------____________________________ -11 3. Type 0 I Rep ort an d Peri 0 d Covered 12. Sponsoring Agency Name and Address
Texas State Department of Highways and Public Transportation; Transportation Planning Division
P. O. Box 5051
Interim
14. Sponsoring Agency Code
Austin Texas 78763 15. Supplementary Nates
Study conducted in cooperation with the U. S. Department of Transportation, Federal Highway Administration
Research Study Title: ''Fatigue Loading in Sign Structures" 16. Abstract
This is the final report of an experimental and analytical study to determine the fatigue loading on cantilever highway signs from gusts produced by trucks passing under the sign. Three sign structures were instrumented in the field to determine their response from truck gusts. These signs were then analyzed using a three-dimensional dynamic analysis computer program. A loading was developed from the computer analysis which produced a response which simulated the response measured in the field study. A matrix of standard Texas State Department of Highways and Public Transportation standard sign structures was analyzed using the same computer program and the simulated loading. The result of this analysis was the development of dynamic load factors for these signs.
A simple method of estimating the three primary modal frequencies of typical signs was developed using single degree of freedom models. Means of correcting the results of these simple models to agree with the computer analysis was developed. The resulting frequencies allow the dynamic load factor to be calculated without the use of the complex three-dimensional computer analysis.
A method of analyzing the anchor bolts of the signs for fatigue is presented. The analysis uses the loading developed in this study amplified using the dynamic loading factors calculated from the modal frequencies estimated from the single degree of freedom models. The low measured stresses in the superstructure did not indicate any potential fatigue problems. The anchor bolt fatigue stresses are primarily caused by bending of the bolt between the base plate and the foundation.
17. Key Words
fatigue loading, cantilever highway signs, wind gusts, trucks, computer program, simulated loading, dynamic load fac tors
18. Di stribution Statement
No restrictions. This document is available to the public through the National Technical Information Service, Springfield, Virginia 22161
19. Security Classil. (of this report) 20. Security Cleruil. (01 this page) 21. No. 01 Page. 22. Price
Unc lass ified Unclassified 114
Form DOT F 1700.7 (S-69)

FATIGUE LOADING OF CANTILEVER SIGN STRUCTURES
FROM TRUCK WIND GUSTS
by
Bruc e M. Creamer
Karl H. Frank
and
Richard E. Klingner
Research Report No. 209-1F
Research Report No. 3-5-77-209
"Fatigue Loading in Sign Structures"
Conducted for
Texas State Department of Highways and Public Transportation
In Cooperation with
U. S. Department of Transportation Federal Highway Administration
by the
CENTER FOR HIGHWAY RESEARCH THE UNIVERSITY OF TEXAS AT AUSTIN
April 1979

The contents of this report reflect the views of the authors who are responsible for the facts and accuracy of the data presented herein. The contents do not necessarily reflect the views or policies of the Federal Highway Administration. This report does not constitute a standard, specification or regulation.
There was no invention or discovery conceived or first actually reduced to practice in the course of or under this contract, including any art, method, process, machine, manufacture, design or composition of matter, nor any new and useful improvement thereof, or any variety of plant which is or may be patentable under the patent laws of the United States of America or any foreign country.
ii

SUMMARY
This is the final report of an experimental and
analytical study sponsored by the Texas State Department of High
w~s and Public Transportation to determine the fatigue loading
on cantilever highway signs from gusts produced by trucks passing
under the sign. Three sign structures were instrumented in the
field to determine their response from truck gusts. These signs
were then analyzed using a three-dimensional dynamic analysis com
puter program. A loading was developed from the computer analysis
which produced a response which simulated the response measured in
the field study.
A matrix of standard Texas State Department of Highways
and Public Transportation standard sign structures was analyzed
using the same computer program and the simulated loading. The
result of this analysis was the development of dynamic load
factors for these signs.
A simple method of estimating the three primary modal fre
quencies of typical signs was developed using single degree of
freedom models. Means of correcting the results of these simple
models to agree with the computer analysis was developed. The
resulting frequencies allow the dynamic load factor to be calculated
without the use of the complex three-dimensional computer analysis.
A method of analyzing the anchor bolts of the signs for
fatigue is presented. The analysis uses the loading developed in
this study amplified using the dynamic loading factors calculated
from the modal frequencies estimated from the single degree of
freedom models. The low measured stresses in the superstructure
did not indicate any potential fatigue problems. The anchor bolt
fatigue stresses are primarily caused by bending of the bolt between
the base plate and the foundation.
iii
IMP L E MEN TAT ION
This report develops a method for checking the fatigue of
cantilever highway sign structures for truck-induced gust loading.
The anchor bolts are the critical elements governed by this loading.
The low damping of the structures results in many stress cycles
from a single loading event. The numerous cycles produced require
that the stress ranges in the bolts be less than the threshold
stress range of 10 ksi.
The design method presented makes use of a linear varying
pressure distribution and a dynamic load factor estimated from the
sign's modal frequencies. A simpler and conservative method using
the triangular loading of 1.25 psf at the bottom of the sign and
zero at the top in conjunction with dynamic load factors of 2.1 for
shear and 1.6 for base torque is recommended for most designs. A
more rigorous design using the actual dynamic load factors can be
performed using the methods presented in the report for situations
which warrant a more accurate result.
iv

Chapter
1
2
3
INTRODUCTION
1.1 Purpose 1.2 Objectives
CONTENTS
1.3 Dynamic Response Theory 1.3.1 General Equation of Motion 1. 3.2 Damping . . . . . . 1.3.3 Structural Idealization
1.4 Experimental Procedure 1.5 Analytical Procedure.
EXPERIMENTAL AND ANALYTICAL RESPONSE
2.1 Experimental Results ..... . 2.1.1 Experimental Determination of
Frequency, Period, and Damping 2.1.2 Forces in Truss Members 2.1.3 Maximum Sign Responses ...•.
2.2 Load ing Func tion ...•....... 2.3 Correlation of Experimental and Analytical
Resul ts .... . . . . . . . 2.3.1 Nodal Load Application 2.3.2 Relative Member Responses
THE PARAMETRIC STUDY
Page
1
1 2 7 7 9
12 14 16
21
21
21 24 26 28
32 32 32
36
3.1 Introduction. . 36 3.2 SAP4 Natural Frequencies 37 3.3 The Dynamic Load Factor 47
3.3.1 The Dynamic Load Factor for Base Shear 47 3.3.2 Torsional Dynamic Load Factor. . 51 3.3.3 Dynamic Load Factor Design Curves. . 54
3.4 Estimating the Natural Frequency. . . . . . 55 3.4.1 Torsional Natural Frequency Estimate 55 3.4.2 Flexural Natural Frequency Estimate 58 3.4.3 Rocking Natural Frequency Estimate 64
3.5 Sign Geometries at Mode Shifting . . . . . 71
v
Chapter
4
5
DESIGN OF ANCHOR BOLTS FOR FATIGUE
4.1 Static Design Load ....•. 4.2 Fatigue Stress Cycles for Design 4.3 Allowable Flexural Bending Stress 4.4 Design Example
CONCLUSIONS
APPENDICES . . .
A SIGN GEOMETRIES
B DISTRIBUTION OF SIGN PRESSURE TO NODAL POINTS
REFERENCES . . . . .
vi
Page
74
74 76 78 78
88
90
91
95
104
Table
2.1
2.2
2.3
2.4
2.5
2.6
2.7
2.8
2.9
3.1
3.2
3.3
3.4
3.5
3.6
LIS T o F TAB L E S
Experimental Response Values
Summary of Experimental Damping and Natural Frequency . . . . . . .
Experimental Force Ratios for the Double Cantilever (Sign No. 1) . • • . .
Experimental Force Ratios for Sign No.3
Maximum Recorded Loading Events for Sign
Maximum Recorded Loading Events for Sign
Comparison of Experimental and Analytical Frequencies for Sign No. 1 . .
Comparison of Experimental and Analytical Member Force Ratios for Sign No. 1
Comparison of Experimental and Analytical Member Force Ratios for Sign No. 3
(a) 10 ft Truss Length (b) 25 ft Truss Length (c) 40 ft Truss Length
Modal Natural Frequencies
No.
No.
.
1
3
(a) (b) (c) (d)
Eigenvectors for 10 ft Truss Sign Structure Eigenvectors for 25 ft Truss Sign Structure Eigenvectors for 40 ft Truss Sign Structure
SAP4 Shear DLF
Torsional DLF .
Torsional Frequency Prediction Accuracy
Flexural Frequency Correlation
vii
Page
23
24
25
26
27
27
33
33
35
38 39 40
41 42 43 44
48
52
59
65
Table
3.7
3.8
4.1
Correlation of the Rocking Model Natural Frequencies
Torsional-Flexural Mode Shift Sign Geometries
Effect of Damping on Free Vibration Response of an Underdamped System . . . . . . . . . . . . .
viii
Page
69
73
77
Figure
1.1
1.2
1.3
1.4
1.5
1.6
1.7
1.8
1.9
1.10
1.11
2.1
2.2
2.3
3.1
3.2
3.3
3.4
3.5
LIS T o F FIG U RES
Box-type tractor trailer passing under Tidwell Exit sign (Sign No.3)
Double cantilever (Sign No.1)
Single cantilever (Sign No.2)
Single cantilever (Sign No.3)
Single degree of freedom system
Response to impulse loads ...•
General response to triangular load •
The effect of damping on response .
Strain gage locations on single cantilever
Instrumentation van and gasoline generator
Strain traces from a vertical forced vibration test of double cantilever sign . . • .
Sanborn strip chart recorder and 10 channel amplifier • . . . . . . . . .
Particle flow paths around a truck
Simulated truck-induced loading
Shape definitions
Shear DLF vs SAP4 flexural frequency
Dominant frequency vs shear DLF . • .
Torsional frequency vs torsional DLF
Torsional frequency model ..... .
ix
Page
3
5
5
6
8
10
11
13
15
17
18
22
29
31
46
49
50
53
56

Figure
3.6
3.7
3.8
3.9
3.10
4.1
4.2
4.3
A.l
A.2
A.3
B.l
B.2
B.3
B.4
B.5
Torsional frequency correction curves
Flexural frequency model
Flexural frequency correction factors
Rocking frequency model . • .
Rocking frequency correction factor •
Experimental-analytical chord 4 force load frequency histogram
Design example
Applied live load forces on anchor bolt group
Dimensions of double cantilever sign--Sign No. 1
Dimensions of single cantilever sign--Sign No. 2
Tidwell Exit sign, Sign No.3, and standard SDHPT design structure
Horizontal distribution of sign force to support brackets . . . . . . . .
Distribution of pressure on sign and lighting case
Vertical distribution of sign force to truss chords •... . . . .
Distribution of vertical forces to truss
Resultant forces on truss • . .
Page
60
61
66
67
70
75
79
85
92
93
94
97
98
99
101
103
C HAP T E R 1
INTRODUCTION
1.1 Purpose
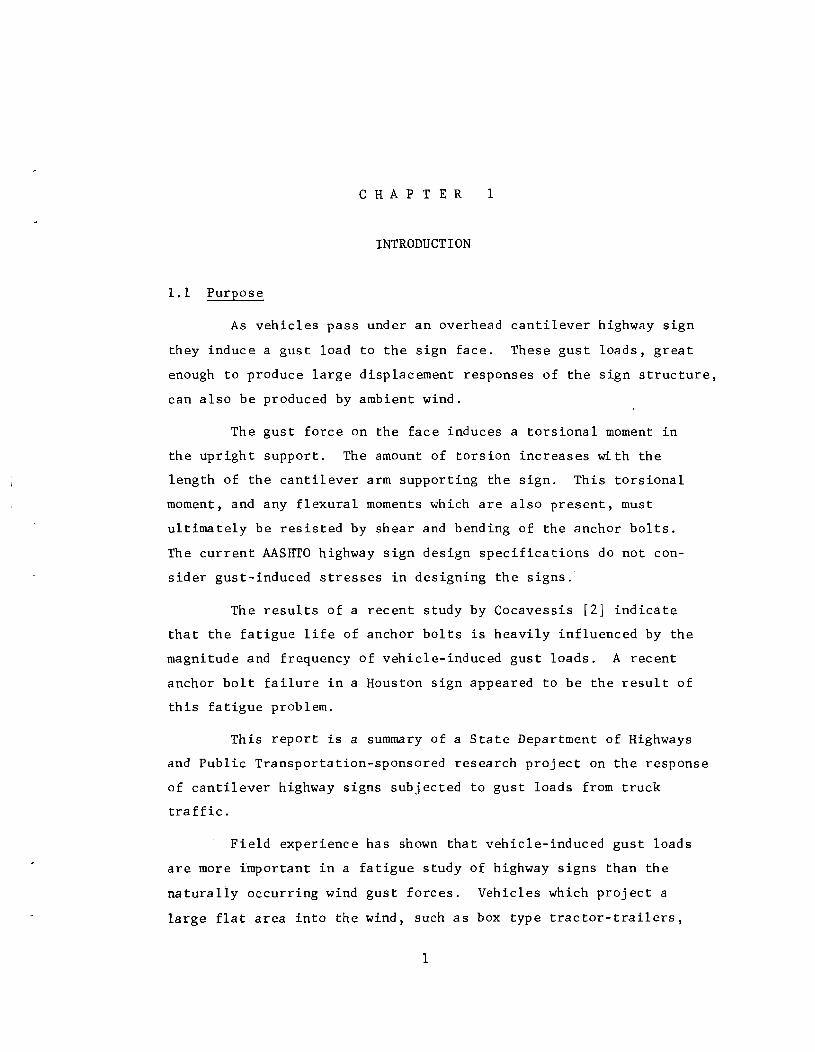
As vehicles pass under an overhead cantilever highway sign
they induce a gust load to the sign face. These gust loads, great
enough to produce large displacement responses of the sign structure,
can also be produced by ambient wind.
The gust force on the face induces a torsional moment in
the upright support. The amount of torsion increases with the
length of the cantilever arm supporting the sign. This torsional
moment, and any flexural moments which are also present, must
ultimately be resisted by shear and bending of the anchor bolts.
The current AASHTO highway sign design specifications do not con
sider gust-induced stresses in designing the signs.
The results of a recent study by Cocavessis [2] indicate
that the fatigue life of anchor bolts is heavily influenced by the
magnitude and frequency of vehicle-induced gust loads. A recent
anchor bolt failure in a Houston sign appeared to be the result of
this fatigue problem.
This report is a summary of a State Department of Highways
and Public Transportation-sponsored research project on the response
of cantilever highway signs subjected to gust loads from truck
traffic.
Field experience has shown that vehicle-induced gust loads
are more important in a fatigue study of highway signs than the
naturally occurring wind gust forces. Vehicles which project a
large flat area into the wind, such as box type tractor-trailers,
1
2
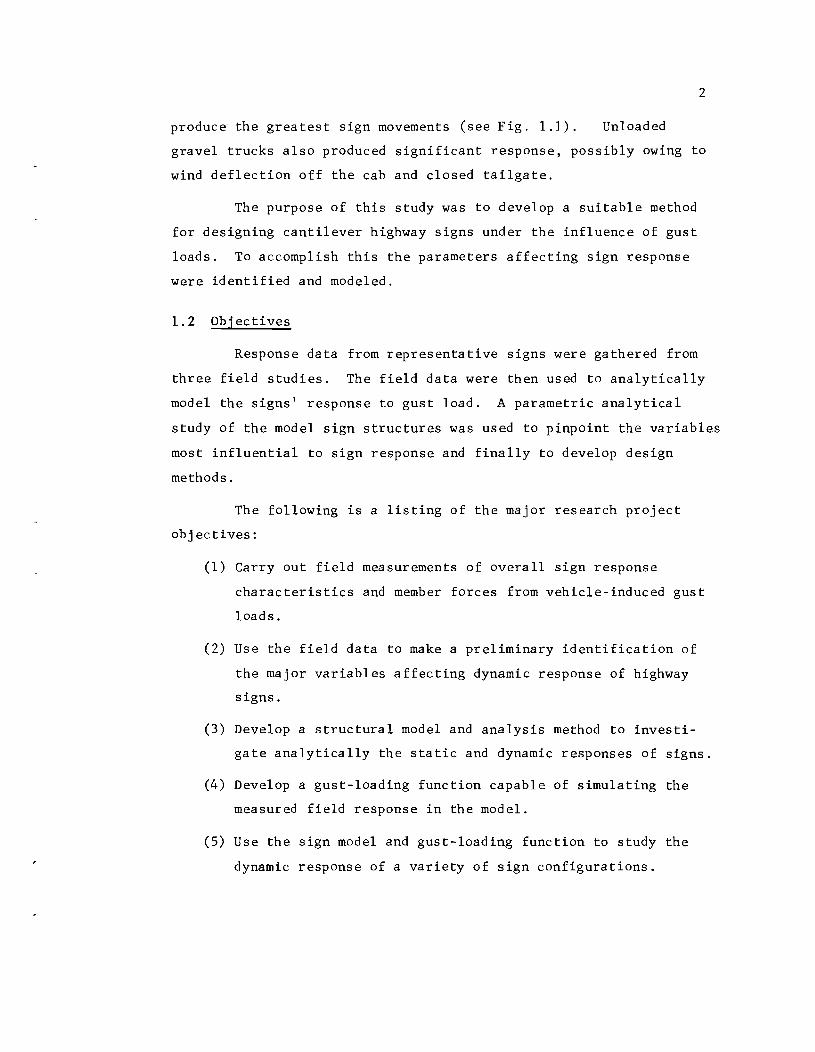
produce the greatest sign movements (see Fig. 1.1). Unloaded
gravel trucks also produced significant response, possibly owing to
wind deflection off the cab and closed tailgate.
The purpose of this study was to develop a suitable method
for designing cantilever highway signs under the influence of gust
loads. To accomplish this the parameters affecting sign response
were identified and modeled.
1.2 Objectives
Response data from representative signs were gathered from
three field studies. The field data were then used to analytically
model the signs' response to gust load. A parametric analytical
study of the model sign structures was used to pinpoint the variables
most influential to sign response and finally to develop design
methods.
The following is a listing of the major research project
objectives:
(1) Carry out field measurements of overall sign response
characteristics and member forces from vehicle-induced gust
loads.
(2) Use the field data to make a preliminary identification of
the major variables affecting dynamic response of highway
signs.
(3) Develop a structural model and analysis method to investi
gate analytically the static and dynamic responses of signs.
(4) Develop a gust-loading function capable of simulating the
measured field response in the model.
(5) Use the sign model and gust-loading function to study the
dynamic response of a variety of sign configurations.

,
, J I , J
"s. 1.\ _-tn. ' .. "0. " an a ..... ... unci., TidwoU 10 .. "'~ (SI,. _G. ))
•

4
(6) Use the results of the parametric study in (5) to make design
recommendations.
In the field study, strain gages were used to measure member
forces. A strip chart recorder was used to record the time depen
dent member force characteristics. The truss members framing into
the vertical upright were gaged, as explained in Chapter 4, to
determine the resulting anchor bolt forces.
Many factors affect the response of a structure to an impulse
load such as that caused by the gust from a vehicle. One important
factor is the amount of damping in the structural system. Damping
is a measure of the structure's ability to dissipate the kinetic
response energy and return to the initial, at-rest state. A struc
ture with a high amount of damping will rapidly cease motion after
the load is no longer applied.
The majority of analytical work reported in Ref. [2] and
the analysis presented in this thesis utilized a general purpose
structural analysis program SAP4 developed at the University of
California at Berkeley [3]. The sign model description and program
development are discussed in detail in a later section. The loading
function developed to simulate truck gust loading effects is also
discussed in a later section.
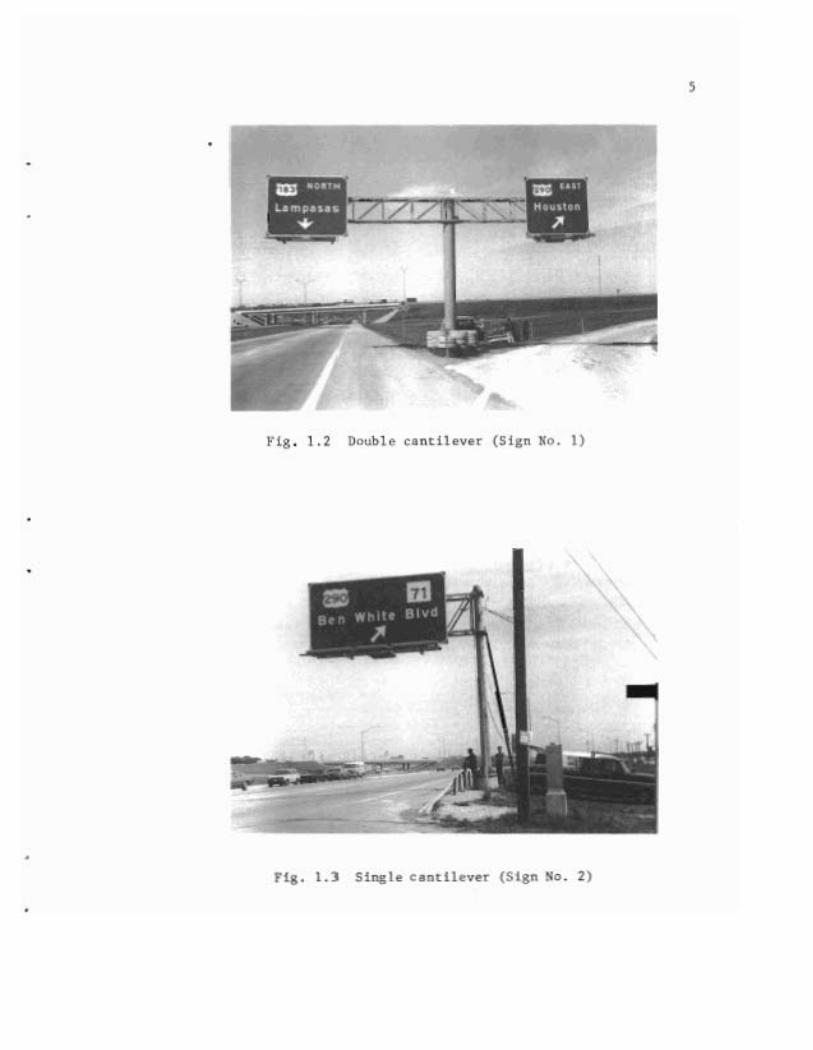
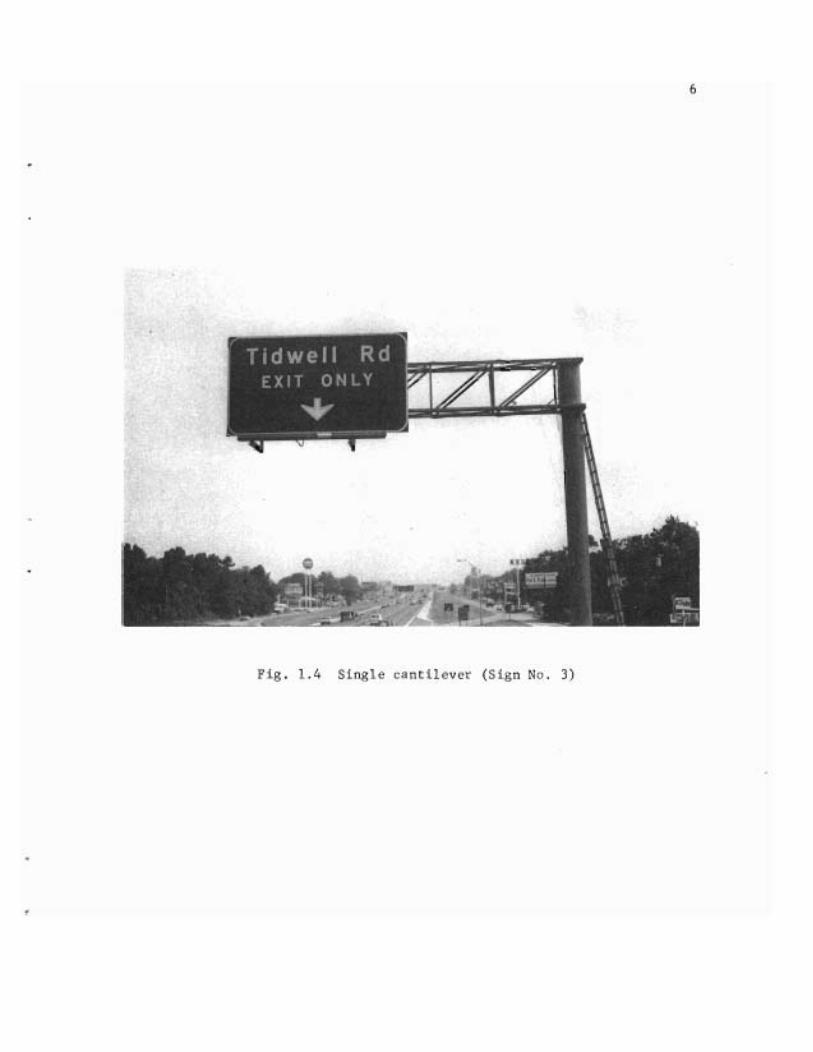
The field study is based on the instrumentation of three
highway signs. The response of two of the signs was reported in
Ref. [2]. The first sign is a double-cantilever type located in
Austin, Texas, at the junction of U.s. Highways 183 and 290. The
second sign is a single-cantilever type on Ben White Boulevard in
Austin. The third sign is also a single cantilever, located on
U.S. Highway 59 at the Tidwell exit in Houston, Texas. Photographs
of each sign are shown in Figs. 1.2, 1.3, and 1.4. The dimensions
and member sizes of each sign are given in the Appendix. The signs
will be referred to as Numbers 1, 2, and 3, respectively.
,
•
•
•
•
PI~ . I .• SiOjlI< <>.<110,,, (SI," .0. l)
•
7
The analytical study is based on a parametric study of sign
response using SAP4. The objective of the analytical study is to
develop recommendations, aids, and procedures for the fatigue design
of sign anchor bolts, without the necessity of a detailed, three
dimensional dynamic analysis. The ultimate goal is the development
of a simple and convenient design process.
1.3 Dynamic Response Theory
A structure's dynamic response depends on its mass, damping,
and stiffness, as well as the characteristics of the applied load.
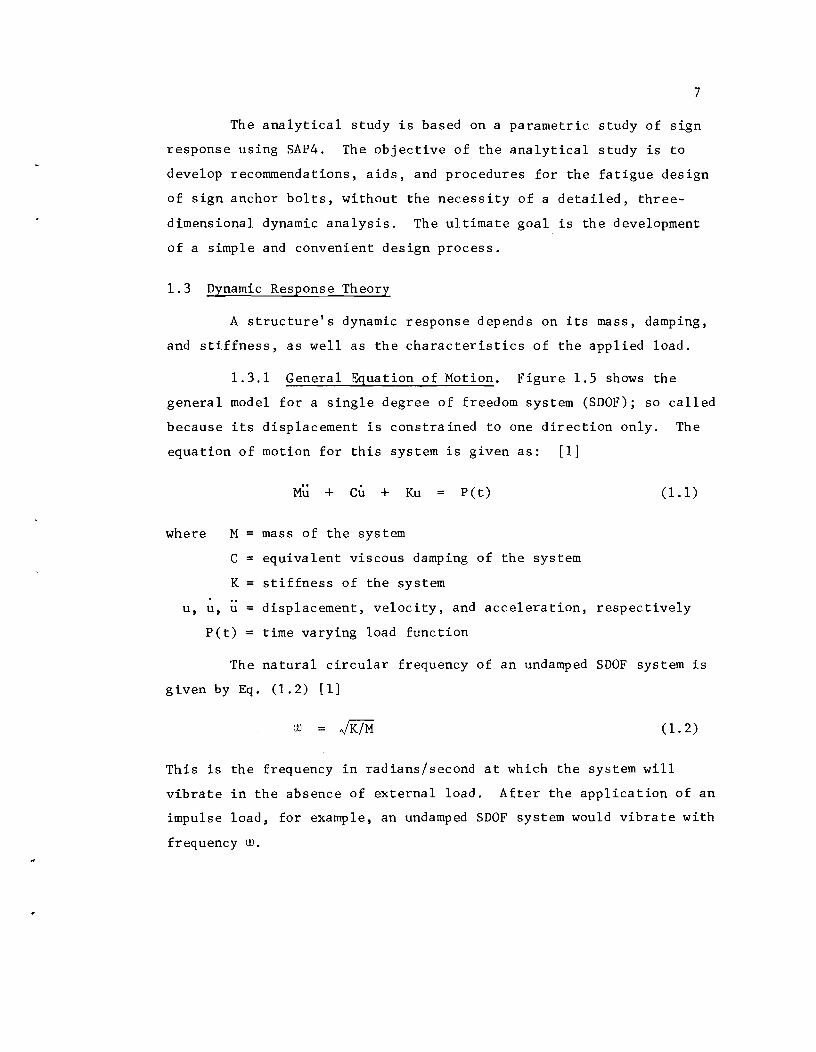
1.3.1 General Equation of Motion. Figure 1.5 shows the
general model for a single degree of freedom system (SDOF); so called
because its displacement is constrained to one direction only. The
equation of motion for this system is given as: [1]
where
M~ + Cu + Ku P(t)
M = mass of the system
C = equivalent viscous damping of the system
K = stiffness of the system
(1.1)
u, u, u = displacement, velocity, and acceleration, respectively
P(t) = time varying load function
The natural circular frequency of an undamped SDOF system is
given by Eq. (1.2) [1]
w (1. 2)
This is the frequency in radians/second at which the system will
vibrate in the absence of external load. After the application of an
impulse load, for example, an undamped SDOF system would vibrate with
frequency w.

8
r u
~------------~
M P (t)
M :: MASS C :: DAMPER K = STIFFNESS
P (f) :: LOAD u :: DISPLACEMENT
Fig. 1.5 Single degree of freedom system
9
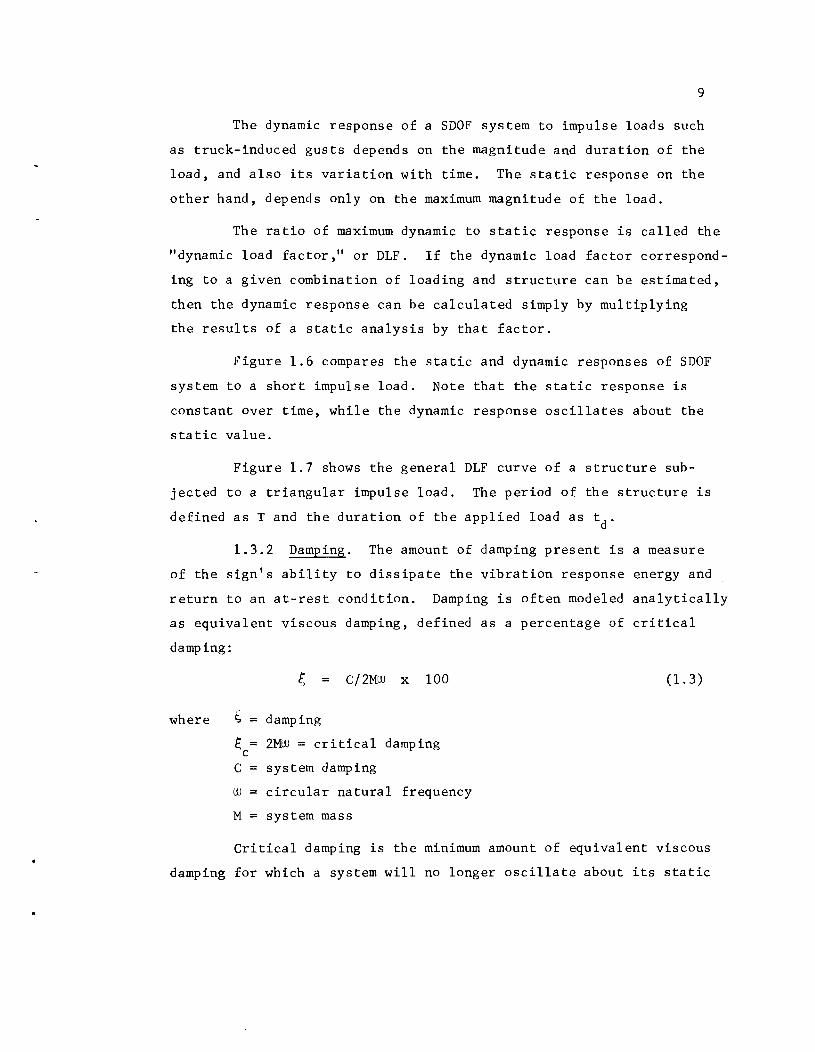
The dynamic response of a SDOF system to impulse loads such
as truck-induced gusts depends on the magnitude and duration of the
load, and also its variation with time. The static response on the
other hand, depends only on the maximum magnitude of the load.
The ratio of maximum dynamic to static response is called the
"dynamic load factor," or DLF. If the dynamic load factor correspond
ing to a given combination of loading and structure can be estimated,
then the dynamic response can be calculated simply by multiplying
the results of a static analysis by that factor.
Figure 1.6 compares the static and dynamic responses of SDOF
system to a short impulse load. Note that the static response is
constant over time, while the dynamic response oscillates about the
static value.
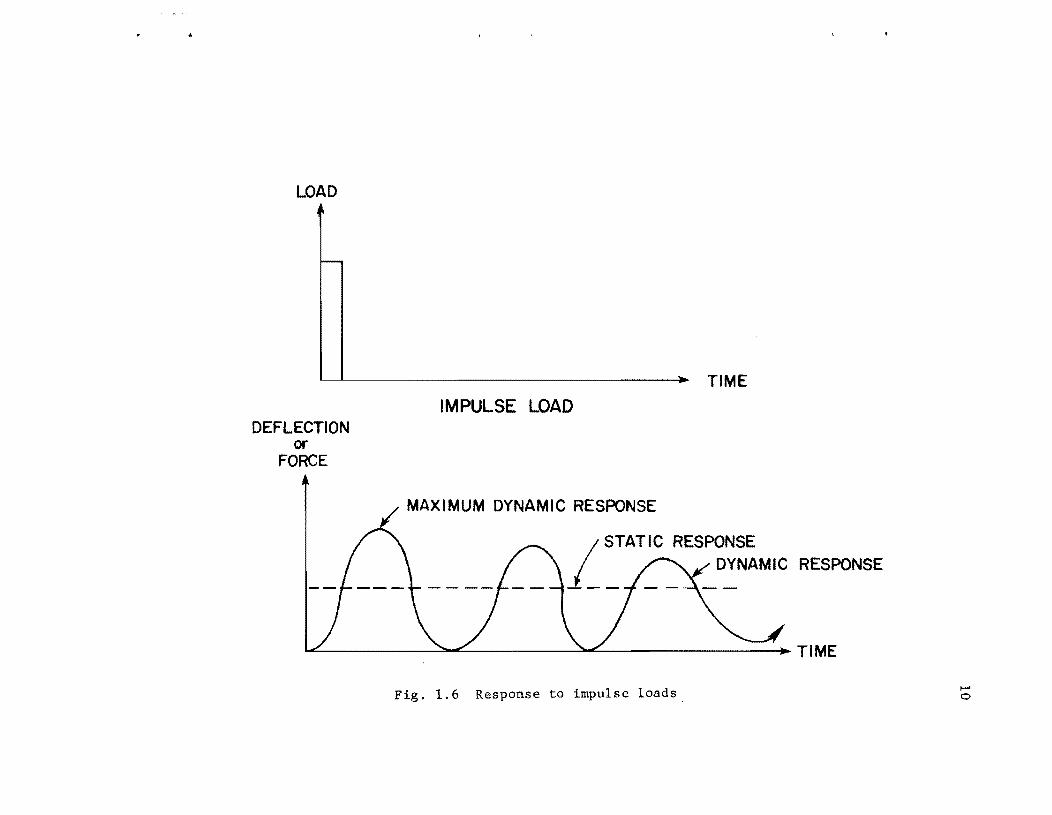
Figure 1.7 shows the general DLF curve of a structure sub
jected to a triangular impulse load. The period of the structure is
defined as T and the duration of the applied load as td'
1.3.2 Damping. The amount of damping present is a measure
of the sign's ability to dissipate the vibration response energy and
return to an at-rest condition. Damping is often modeled analytically
as equivalent viscous damping, defined as a percentage of critical
damping:
C/2MW x 100 (1. 3)
where ~ damping
~ = 2MW = critical damping c
C = system damping
W = circular natural frequency
M = system mass
Critical damping is the minimum amount of equivalent viscous
damping for which a system will no longer oscillate about its static
LOAD
DEFLECTION or
FORCE
IMPULSE LOAD
MAXIMUM DYNAMIC RESPONSE
TIME
RESPONSE
_'L~ ________ ~'-'~ ________ ~>£~ __________ ~=:~. TIME
Fig. 1.6 Response to impulse loads I-' o
~
1.5
1.2
-)(
o E 0.9
l1.. ~ a
0.6
0.3
-x ___ x~
~x
td /2 td td
O. I I , I , I , ,
o 0.5 1.0 1.5 2.0 2.5 3.0 3.5 4.0
td /T
Fig. 1.7 General response to triangular load t-' t-'

.,
12
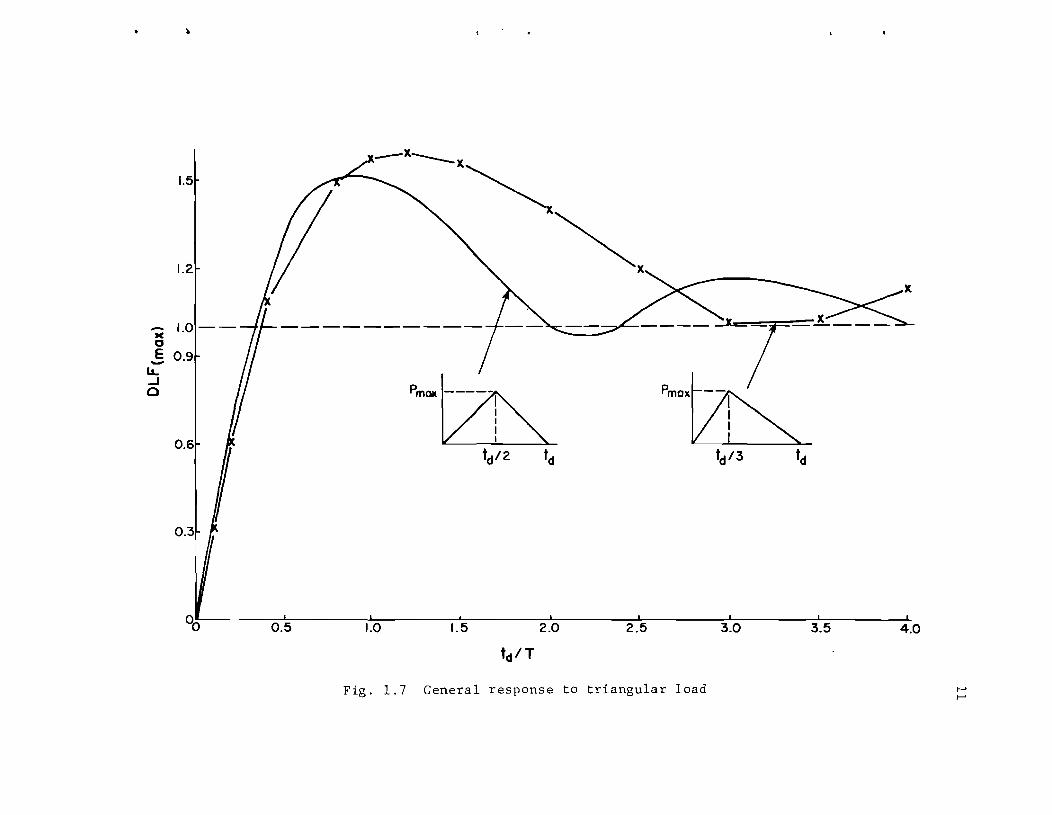
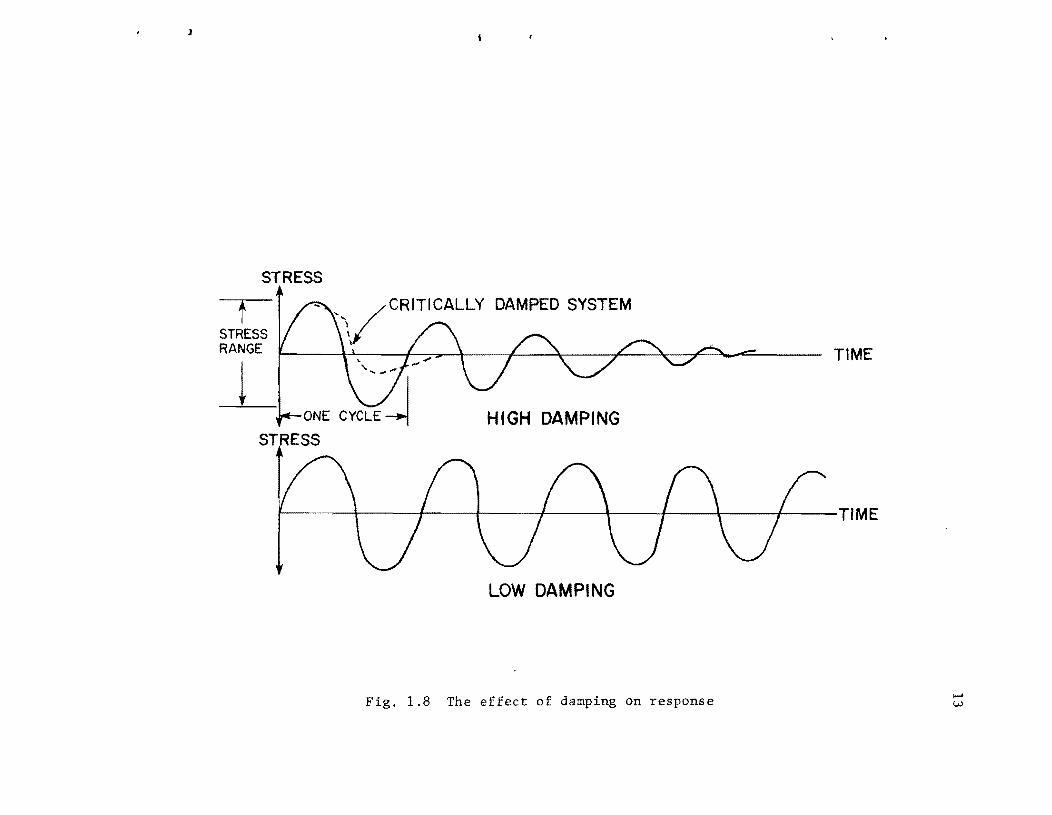
equilibrium position. A highly damped structure will quickly expend
dynamic energy, with a corresponding rapid decrease in stress magni
tude within a small number of oscillations. A low damping ratio
results in a low rate of decrease in stress magnitude, over a large
number of response cycles. Figure 1.8 shows the effect of damping
on response.
As shown by Eq. (1.4), the amount of damping has a direct
effect on the fatigue life:
where N
N A
S 3 R
number of cycles in fatigue life
A = function of fatigue behavior of detail
SR = stress range
(1. 4)
In a lightly damped structure, a given load produces a large number
of stress cycles. This decreases the stress range required to pro
duce a fatigue failure in the structure.
1.3.3 Structural Idealization. A typical cantilever highway
sign is composed of a three-dimensional frame supported by a tubular
upright. For consistancy with common nomenclature this frame will be
referred to as a "truss," even though it is not composed of pin
ended members only. Each joint of the truss is capable of rotational
and translational displacements about three axes. The sign must be
analyzed as a multiple degree of freedom (MDOF) system
The number of natural vibration frequencies is equal to the
number of degrees of freedom. The equations of motion for an N-degree
of freedom system are given in Eq. (1.5): [1]
[M] {ti} + [c] {~} + [K] {u} (1. 5)
where [M] = N x N mass matrix
J
STRESS .l
f STRESS RANGE
-,\/CRITICALLY DAMPED SYSTEM
t HIGH DAMPING
TIME
f I I 'j I \ { TIME
LOW DAMPING
Fig. 1.8 The effect of damping on response l-' W
[C] N x N damping matrix
[K] N x N stiffness matrix
tu, u, ~l = N x 1 vector of displacements, velocities, and accelerations, respectively
tp(t)l = N x 1 vector of applied loading functions
If the loading stops after a short length of time, the vector
tp(t)l then becomes zero, and the system vibrates at its natural
frequencies.
1.4 Experimental Procedure
14
The three cantilever highway signs described in Sec. 1.2 were
instrumented. The anchor bolt reactions induced by gust forces were
of interest, but the bolts were not accessible for strain gaging.
Consequently, forcffiin the anchor bolts were determined by measuring
the forces carried by the truss members framing into the upright.
The forces in the framing members were measured by means of strain
gages and the resulting anchor bolt forces calculated.
In all signs the four chord members, the dead load diagonals
(on the vertical panels), and one top and one bottom wind load diagonal
(on the horizontal panels) were gaged in each arm. Equal and opposite
forces were assumed in the two corresponding wind load diagonals not
gaged. Figure 1.9 shows the numbering and arrangement of members
gaged.
Polyamide-backed SR-4 strain gages of 1/2 in. gage length were
used on all signs. The gaging process began with the removal of the
galvanized protective coating over a small area at approximately the
centroidal axis of the member, so as to minimize the effects of
flexural strains on the measured values. The exposed steel was
thoroughly cleaned with acetone and a neutralizer. Eastman 910
adhesive was used to fix the gage to the metal. Two coats of
Barrier B liquid waterproofing were applied and a Barrier E patch-type

15
2
3
Fig. 1.9 Strain gage locations on single cantilever

16
waterproofing was applied to protect the strain gage from moisture.
Lead wires were soldered to the gages prior to mounting.
The gages were connected through a ten-channel amplifier to
an eight-~hannel Sanborn strip chart analog recorder. A portable,
gasoline-powered generator was used to supply power for the recorder
and amplifier. All equipment and instruments were transported and
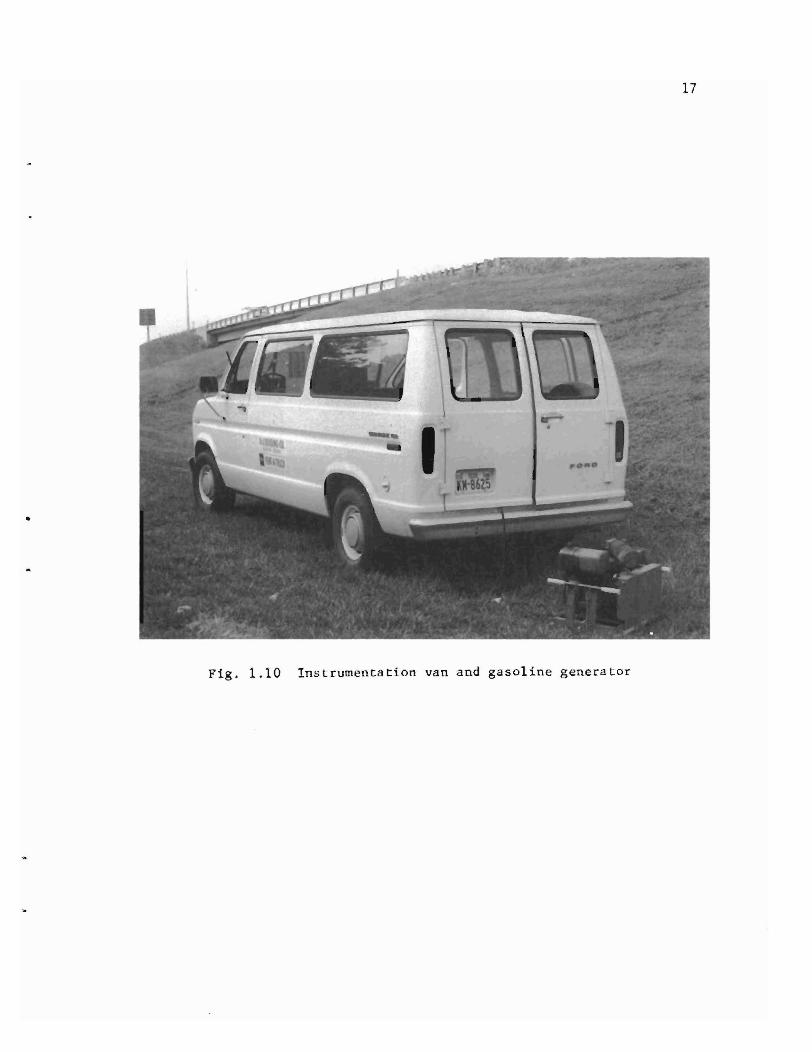
housed in the instrumentation van shown in Fig. 1.10.
Measurements taken from the strip chart were converted into
stress ranges through the following formula:
S = N x 2.00 R G.F.
x G x E (1.6)
where SR = stress range
N = number of chart divisions between peaks
G.F. strain gage factor
G = combined amplifier-recorder system gain
E = steel modulus of elasticity, taken as 29 x 103 ksi
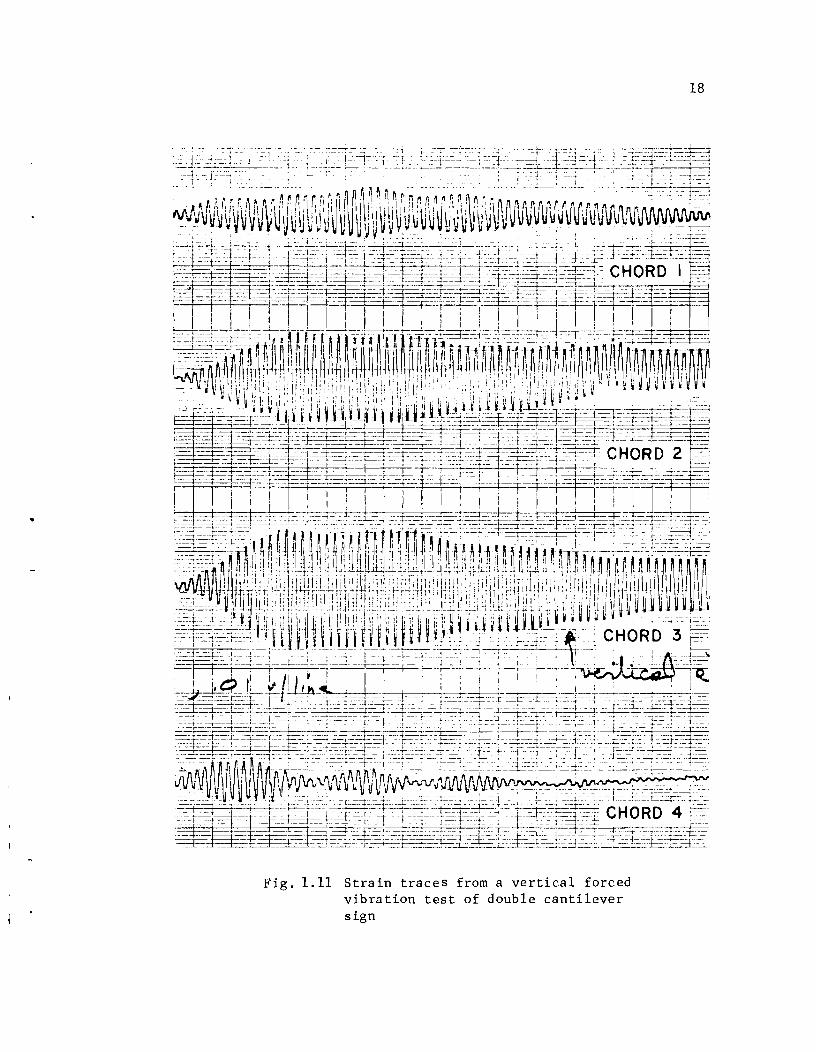
A sample strip chart output for SignNo. 1 is shown in Fig. 1.11.
All signs were excited artificially in order to estimate
experimentally the fundamental natural frequency and corresponding
modal damping ratio. Excitation was accomplished by standing on the
sign truss as close as possible to the upright and shaking the truss
horizontally and vertically. In this way the effect of the individual's
mass on the sign response was minimized.
1.5 Analytical Procedure
All analyses were carried out using SAP4, a general-purpose
structural analysis program for static and dynamic response of
linear structures. This program computes and assembles the struc
ture's mass and stiffness matrices using input descriptions of nodal
geometry and member properties. All of the cantilever highway sign
analyses were based on a three-dimensional model.
17
•
Fig. 1.10 Instrumentation van and gasoline generator
•
Fig. loll Strain traces from a vertical forced vibration test of double cantilever sign
18
19
Preliminary development and refinement of the structural
model is described in Ref. 2. Actual member sizes and properties
were used for corresponding model elements. The modeling assumptions
are presented below:
(1) All chord and support members were modeled as continuous
beam elements. In view of their flexible end connections,
web diagonals and struts were considered as pin-ended
elements.
(2) The base of the support was assumed to be fully fixed.
Effects of foundation flexibility were neglected.
(3) All members connecting the truss chords to the tubular
upright were modeled using a stiffness equal to that of the
upright in order to simulate the high rigidity of the actual
plate connection.
(4) The sign, walkway, lights, and lighting ballast box were
input as lumped masses at nodal points.
(5) Gust loads were applied only to the sign face, walkway, and
lighting case; any effects on member surfaces were neglected.
The projected member areas were very small compared to the
sign area.
SAP4 assembles a diagonal mass matrix by lumping distributed
member masses at connecting nodes. One-half of each member's mass is
applied to each of its end nodes.
The loading function, explained in more detail in a later
section, was developed to simulate the effect of truck-induced gusts.
A time-varying pressure distribution was applied to the major surface
areas. The loading duration was related to an assumed vehicle speed.
A parametric study was performed on a variety of different
signs. The following major load cases were investigated:
20
(1) A gravity load analysis resulting from member self-weights.
(2) A static concentrated loading of 20 kips applied horizontally
at the free end of the truss.
(3) A static gust loading equal in magnitude to the maximum value
of the dynamic gust loading function.
(4) A dynamic analysis based on the gust loading function.
The variables in the study included the truss length, width,
and depth, member areas and lengths, upright height, upright stiff
ness, and member arrangement. Most of the signs analyzed were taken
from "Interstate Signing Standards," Texas State Department of High
ways and Public Transportation, April 1978 Revision.
The gravity load case was included for completeness and
to check the program input. The static and dynamic gust load cases
were included to enable the calculation of a dynamic load factor
for each sign.

C HAP T E R 2
EXPERIMENTAL AND ANALYTICAL RESPONSE
2.1 Experimental Results
The dynamic response of the signs to the passage of a truck
was recorded on a strip chart recorder, as shown in Fig. 2.1. The
axial force in each strain-gaged member was computed from one-half
the stress range using the equation in the previous chapter. Member
stresses were assumed to be uniform across the cross section.
2.1.1 Experimental Determination of Frequency, Period, and
Damping. The natural modal frequency, period, and damping as a per
cent of the critical damping were obtained from strain measurements
of the free vibration of the sign after initial excitation. Excita
tion was generated by standing on the truss near the upright support
and shaking the truss in either the horizontal or vertical direction,
as desired.
The natural frequency of oscillation was obtained by count
ing the number of positive or negative peaks occurring in a known
time interval. The frequency in cycles per second (cps) is the
number of peaks divided by the time interval. The period is the
inverse of the natural frequency.
The horizontal or vertical modal damping was estimated
using the logarithmic decrement technique in which: [lJ
where ~ = the percent of critical damping
VI = a given peak strain amplitude
V2
strain amplitude in the next peak
21
(2.1)

Fig. 2.1 Sanborn strip chart recorder and 10 channel amplifier
22
23
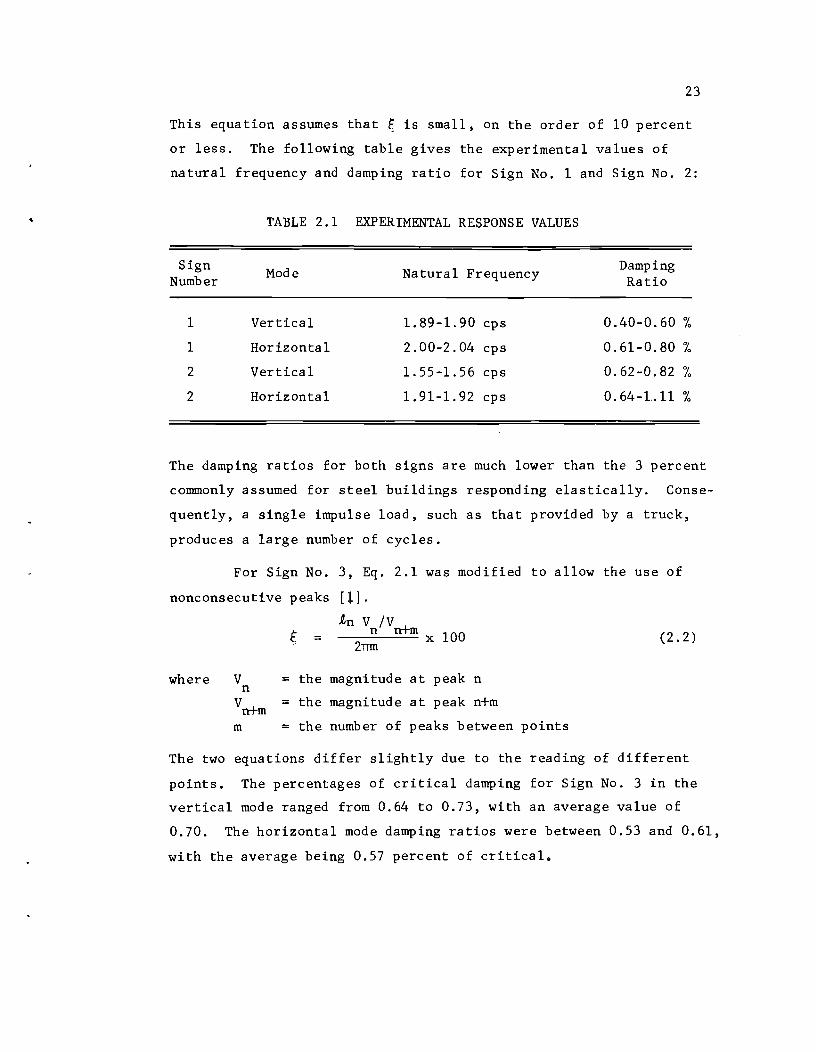
This equation assumes that E is small, on the order of 10 percent
or less. The following table gives the experimental values of
natural frequency and damping ratio for Sign No. 1 and Sign No. 2:
TABLE 2.1 EXPERIMENTAL RESPONSE VALUES
Sign Mode Natural Frequency Damping
Number Ratio
1 Vertical 1.89-1.90 cps 0.40-0.60 %
1 Horizontal 2.00-2.04 cps 0.61-0.80 %
2 Vertical 1.55-1.56 cps 0.62-0.82 I.
2 Horizontal 1. 91-1. 92 cps 0.64-1..11 %
The damping ratios for both signs are much lower than the 3 percent
commonly assumed for steel buildings responding elastically. Conse
quently, a single impulse load, such as that provided by a truck,
produces a large number of cycles.
For Sign No.3, Eq. 2.1 was modified to allow the use of
nonconsecutive peaks [1].
l,n V /Vnt n m x 100
2TTm = (2.2)
where V = the magnitude at peak n n
Vntm
= the magnitude at peak n+m
m = the number of peaks between points
The two equations differ slightly due to the reading of different
points. The percentages of critical damping for Sign No. 3 in the
vertical mode ranged from 0.64 to 0.73, with an average value of
0.70. The horizontal mode damping ratios were between 0.53 and 0.61,
with the average being 0.57 percent of critical.

24
The average natural frequencies of vibration for the
horizontal and vertical modes of Sign No.3, as determined from
forced vibration data, are shown below. In the vertical mode, the
frequency ranged from 1.90-2.00 cps, with an average value of
1.98 cps, resulting in a vertical period of 0.51 seconds. The
horizontal mode frequency average was 1.88 cycles per second, the
range being 1.80-1.93 cps, resulting in a horizontal period of
0.52 seconds. Table 2.2 summarizes the average experimental
natural frequencies and damping ratios for all three signs.
TABLE 2.2 SUMMARY OF EXPERIMENTAL DAMPING AND NATURAL FREQUENCY
Sign Vertical Horizontal Vertical Horizontal Natural Natural Damping Damping No. Frequency Frequency Ratio Ratio
1 1.90 cps 2.01 cps 0.49 % 0.69 %
2 1.55 cps 1.91 cps 0.73 % 0.77 %
3 1.98 cps 1.88 cps 0.70 % 0.57 %
2.1.2 Forces in Truss Members. Member forces were calcu
lated for each significant truck loading event. The magnitude of
the member response varied depending upon the vehicle speed, truck
shape, and time interval between trucks. Due to the member force
magnitude differences, it was not convenient to compare separate
events directly; member force ratios will be examined instead.
Force ratios were obtained by dividing the particular member force
for an event by the corresponding force in chord member 4.
(See Fig. 1.9 for numbering of members.) The strip chart recorder
used did not allow the recording of more than eight member strains
simultaneously. The sixteen members gaged in the double cantilever
could not all be recorded for the same event. Various combinations
25
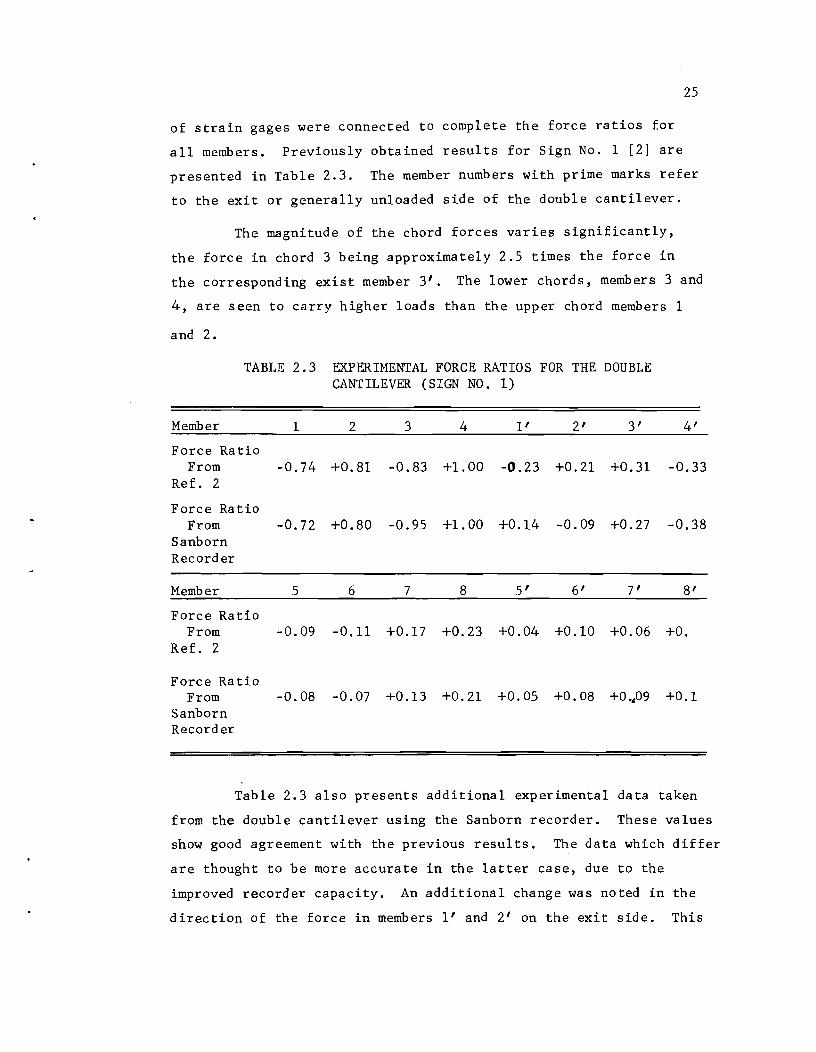
of strain gages were connected to complete the force ratios for
all members. Previously obtained results for Sign No. 1 [2] are
presented in Table 2.3. The member numbers with prime marks refer
to the exit or generally unloaded side of the double cantilever.
The magnitude of the chord forces varies significantly,
the force in chord 3 being approximately 2.5 times the force in
the corresponding exist member 3'. The lower chords, members 3 and
4, are seen to carry higher loads than the upper chord members 1
and 2.
TABLE 2.3 EXPERIMENTAL FORCE RATIOS FOR THE DOUBLE CANTILEVER (SIGN NO.1)
Member 1 2 3 4 11 2' 3'
Force Ratio From -0.74 +0.81 -0.83 +1.00 -0.23 +0.21 +0.31
Ref. 2
Force Ratio From -0.72 +0.80 -0.95 +1.00 +0.14 -0.09 +0.27
Sanborn Recorder
Member 5 6 7 8 5' 6' 7'
Force Ratio From -0.09 -0.11 +0.17 +0.23 +0.04 +0.10 +0.06
Ref. 2
Force Ra tio From -0.08 -0.07 +0.13 +0.21 +0.05 +0.08 +0.~09
Sanborn Recorder
4'
-0.33
-0.38
8'
+0.
+0.1
Table 2.3 also presents additional experimental data taken
from the double cantilever using the Sanborn recorder. These values
show good agreement with the previous results. The data which differ
are thought to be more accurate in the latter case, due to the
improved recorder capacity. An additional change was noted in the
direction of the force in members l' and 2' on the exit side. This
change is consistent with the anticipated response of the truss.
All of the chords now show force direction continuity with their
respective members. Due to the lack of significant truck load
data, force ratios for Sign No.2 were not calculated.
26
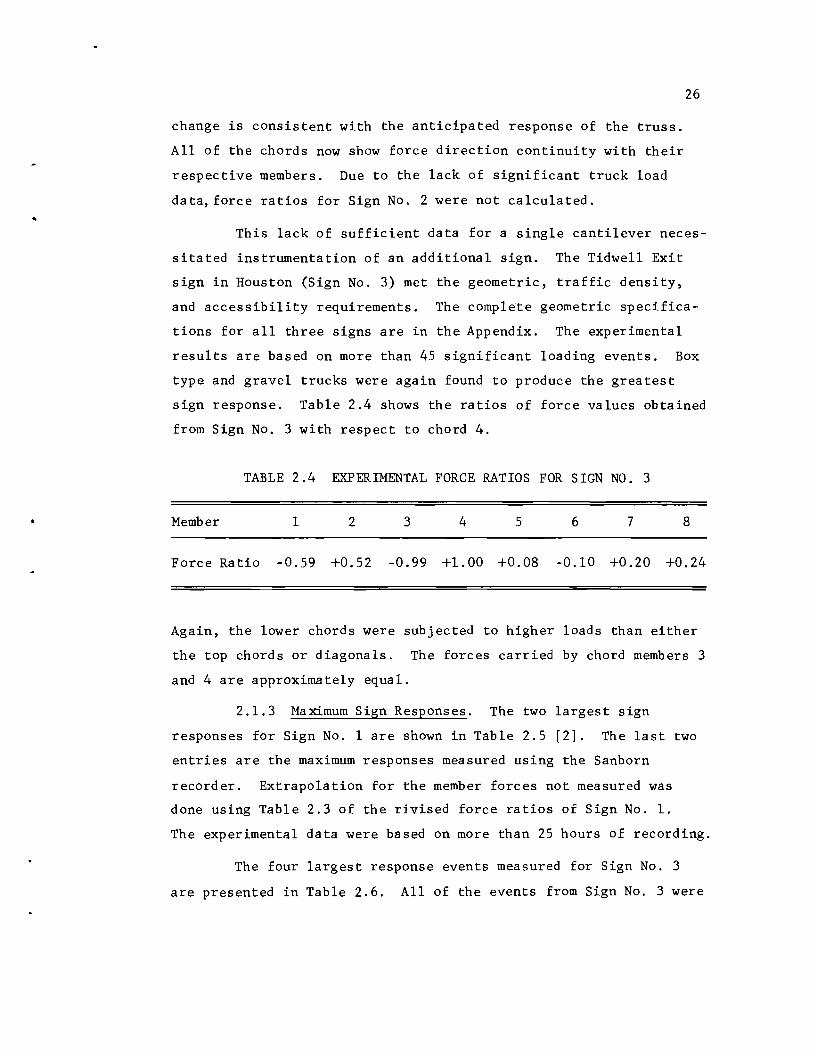
This lack of sufficient data for a single cantilever neces
sitated instrumentation of an additional sign. The Tidwell Exit
sign in Houston (Sign No.3) met the geometric, traffic density,
and accessibility requirements. The complete geometric specifica
tions for all three signs are in the Appendix. The experimental
results are based on more than 45 significant loading events. Box
type and gravel trucks were again found to produce the greatest
sign response. Table 2.4 shows the ratios of force values obtained
from Sign No. 3 with respect to chord 4.
TABLE 2.4 EXPERIMENTAL FORCE RATIOS FOR SIGN NO.3
Member 1 2 3 4 5 6 7 8
Force Ratio -0.59 +0.52 -0.99 +1.00 +0.08 -0.10 +0.20 +0.24
Again, the lower chords were subjected to higher loads than either
the top chords or diagonals. The forces carried by chord members 3
and 4 are approximately equal.
2.1.3 Maximum Sign Responses. The two largest sign
responses for Sign No.1 are shown in Table 2.5 [2]. The last two
entries are the maximum responses measured using the Sanborn
recorder. Extrapolation for the member forces not measured was
done using Table 2.3 of the rivised force ratios of Sign No.1.
The experimental data were based on more than 25 hours of recording.
The four largest response events measured for Sign No.3
are presented in Table 2.6. All of the events from Sign No.3 were
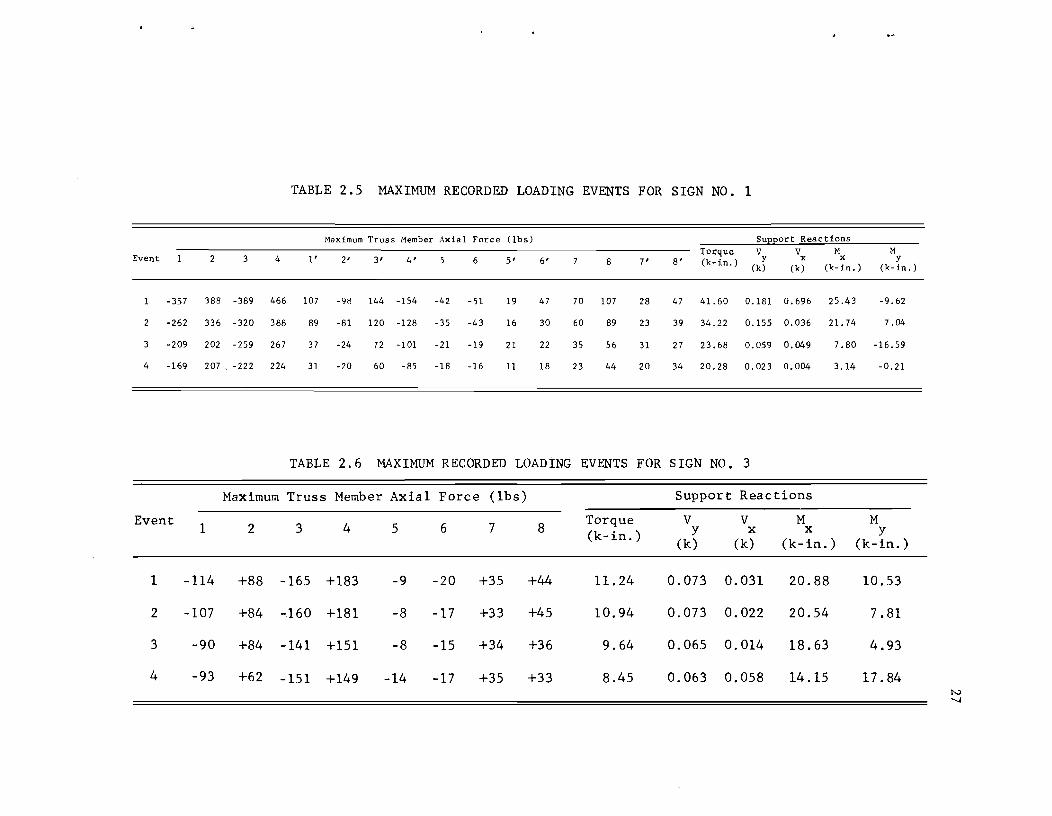
TABLE 2.5 MAXIMUM RECORDED LOADING EVENTS FOR SIGN NO. 1
Maximum Truss Member Axial Force (lbs) SUEEort Reactions
Torque V V M M Event 2 3 4 I' 2' 3' 4' 5 6 5' 6' 8 7' 8' (k-in.) y x x y
(k) (k) (k-in. ) (k-in. )
-357 388 -389 466 107 -98 144 -154 -42 -51 19 47 70 107 28 47 41. 60 0.181 0.696 25.43 -9.62
2 -262 336 -320 388 89 -81 120 -128 -35 -43 16 30 60 89 23 39 34.22 0.155 0.036 21. 74 7.04
3 -209 202 -259 267 37 -24 72 -101 -21 -19 21 22 35 56 31 27 23.68 0.059 0.049 7.80 -16.59
4 -169 207 . -222 224 31 -20 60 -85 -18 -16 11 18 23 44 20 34 20.28 0.023 0.004 3.14 -0.21
TABLE 2.6 MAXIMUM RECORDED LOAD1NG EVENTS FOR SIGN NO.3
Maximum Truss Member Axial Force (lbs) Support Reactions
Event 1 2 3 4 5 6 7 8 Torque V V M M (k-in. ) y x x y
(k) (k) (k-in.) (k-in.)
1 -114 +88 -165 +183 -9 -20 +35 +44 11.24 0.073 0.031 20.88 10.53
2 -107 +84 -160 +181 -8 -17 +33 +45 10.94 0.073 0.022 20.54 7.81
3 -90 +84 -141 +151 -8 -15 +34 +36 9.64 0.065 0.014 18.63 4.93
4 -93 +62 -151 +149 -14 -17 +35 +33 8.45 0.063 0.058 14.15 17.84 N .......,
measured in the space of three hours and are unlikely to contain
the maximum daily loading event.
28
The values in these two tables indicate that the shear in
the direction parallel to the truss length, V , is generally much x
smaller than V. Comparing the last two events in Table 2.6, we y
can see how sensitive M is to changes in the forces in members 1, y
2, 5, and 6. The torsional moment did not exhibit the same degree
of sensitivity to member force changes. Box type trucks were found
to produce the largest sign response.
2.2 Loading Function
An analytical study of cantilever highway signs required
the development of a loading function. Measurement of the actual
gust forces by placing pressure gages on the sign face was not
practical, due to the very nature of the highly turbulent flow.
The loading function was developed in Ref. [2] by analytically
examining member force ratios from various shapes of loading func
tion. The member force ratios were then compared with the experi
mental data and modifications to the assumed function were made as
necessary.
Wind tunnel tests have given the general flow patterns of
air particles around vehicle-shaped obstructions [4]. This pattern
is shown in Fig. 2.2. As a truck cuts through the surrounding air,
momentum is transferred to the air particles. The momentum results
from deflection, negative pressure, and drag along the truck surface.
At some distance from the truck frictional forces will eventually
damp out this imparted motion. Examining the path of an individual
particle, we can see that momentum is imparted in both the horizontal
and vertical directions. The vertical motion is caused by upward
deflection by the cab, and front of the trailer if present. The
peak pressure occurs at some point behind the back of the cab. The

AIR PARTICLE
FlOW PATHS
DIRECTIONS OF IMPARTED WIND MOMENTUM
D
Fig. 2.2 Particle flow paths around a truck N \D
30
horizontal motion of the particle is the result of negative or
suction pressure; through the action of viscous shear forces, the
particle is drawn in the direction of vehicle motion. The magni
tude of horizontal force is a function of the vehicle's frontal
area. The efficiency of horizontal momentum transfer is a function
of frictional drag and depends upon truck length, contour, rough
ness, and velocity. The horizontal velocity of the particle will
always be less than the velocity of the vehicle.
The pressure applied to the sign face increases from zero
to its maximum value over a certain rise time, and then returns to
zero. The rise time is a function of the vehicle speed. The hori
zontal forces were assumed to vary with time in the same manner as
the vertical forces.
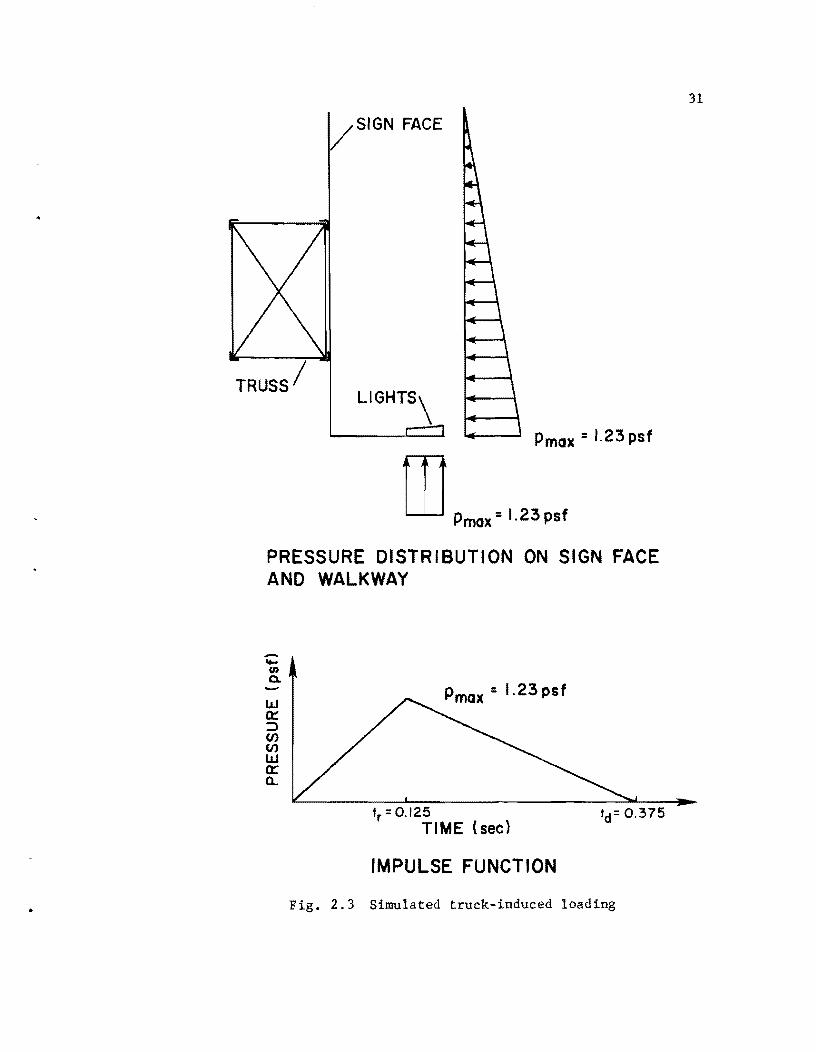
The loading function developed is shown in Fig. 2.3. This
pressure distribution is not presumed to be the actual gust loading
present in the field, but rather one that simulates the member
forces measured. The shape of the function and its duration were
related to vehicle speed: a truck moving at 55 mph travels
approximately 81 ft in one second; maximum truck length limits
the gust duration to less than one second. The rise time of one
eighth of a second represents the time taken for the first 10 ft of
the truck to pass under the sign face. The total duration of three
eighths of a second corresponds to the time required for the whole
vehicle to pass under the sign. By matching the member stresses
from the largest recorded loading event on the double cantilever
sign to the analytical output for the same sign, the peak pressure
was calculated to be 1.23 psf. This pressure corresponds to a wind
velocity of 19.2 mph using the standard wind pressure formula:
2 P = 0.00256 V CD (2.3)
/SIGN FACE
Pmax = 1.23 psf
ill Pmax' 1.23 psI
PRESSURE DISTRIBUTION ON SIGN FACE AND WALKWAY
-.... (I)
0.
w Ct: :::> CJ) CJ) w a: a..
Pmax : 1.23 psf
tr =O.I25 TIME {sec}
IMPULSE FUNCTION
Fig. 2.3 Simulated truck-induced loading
31
where p = wind pressure in psf
V wind velocity in mph
CD = the drag coefficient (1.3 assumed)
32
The pressure distribution was assumed to vary linearly with
elevation, as shown to reflect the decrease in particle motion with
distance above the truck. The maximum pressure is applied hori
zontally to the bottom of the sign face and vertically to the
lighting fixtures. The pressure at the top of the sign face was
assumed to be zero. Because the greater portion of the horizontal
load is below the sign centerline, over the lower truss chords, the
increased lower chord forces found experimentally can be simulated
analytically.
2.3 Correlation of Experimental and Analytical Results
2.3.1 Nodal Load Application. The loading function out
lined in the previous section was applied through the sign to the
truss nodes as required by the SAP4 computer program.
In the work done by Cocavessis [2], the loads were applied
to the nodes as a function of their tributary areas. This method
resulted in the application of approximately 40 percent of the load
to the top nodes and 60 percent to the bottom nodes.
For the parametric study of cantilever signs, investigated
in detail in the next chapter, a more rational load distribution
method was used. Again, approximately 40 percent and 60 percent of
the load was applied to the top and bottom modes, respectively; but
the load variation along the truss length was slightly altered. A
description of the alternate method used is given in the Appendix.
2.3.2 Relative Member Responses. Before a parametric
study was begun, the accuracy of the structure model and loading
function was checked against the experimental data. In this section
33
the experimental values of modal natural frequencies and member
force ratios will be compared to the analytically derived values.
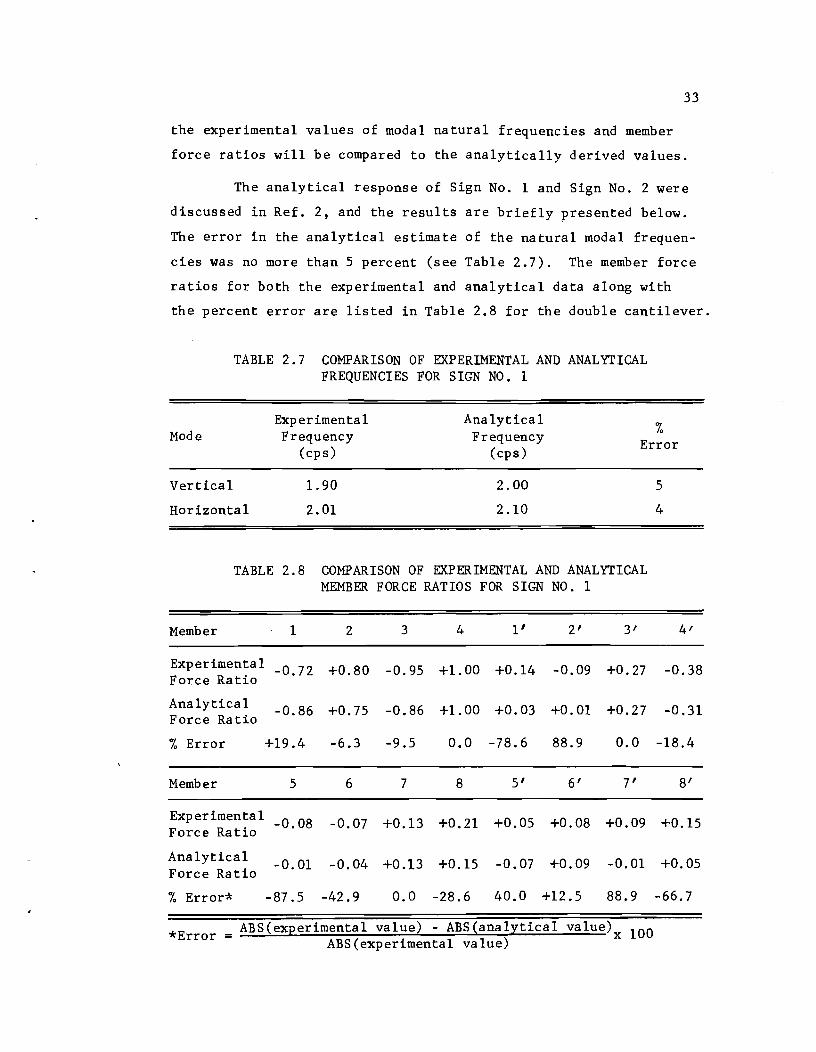
The analytical response of Sign No. 1 and Sign No. 2 were
discussed in Ref. 2, and the results are briefly presented below.
The error in the analytical estimate of the natural modal frequen
cies was no more than 5 percent (see Table 2.7). The member force
ratios for both the experimental and analytical data along with
the percent error are listed in Table 2.8 for the double cantilever.
TABLE 2.7 COMPARISON OF EXPERIMENTAL AND ANALYTICAL FREQUENCIES FOR SIGN NO.1
Experimental Analytical ,. Mode Frequency Frequency Error
(cps) (cps)
Vertical 1.90 2.00 5
Horizontal 2.01 2.10 4
TABLE 2.8 COMPARISON OF EXPERIMENTAL AND ANALYTICAL MEMBER FORCE RATIOS FOR SIGN NO. 1
Member 1 2 3 4 I' 2' 3' 4'
Experimental -0.72 +0.80 -0.95 +1.00 +0.14 -0.09 +0.27 -0.38 Force Ratio
Analytical -0.86 +0.75 -0.86 +1.00 +0.03 +0.01 +0.27 -0.31 Force Ratio
% Error +19.4 -6.3 -9.5 0.0 -78.6 88.9 0.0 -18.4
Member 5 6 7 8 5' 6' 7' 8'
Experimental -0.08 -0.07 +0.13 +0.21 +0.05 +0.08 +0.09 +0.15
Force Ratio
Analytical -0.01 -0.04 +0.13 +0.15 -0.07 +0.09 -0.01 +0.05
Force Ratio
,. Error* -87.5 -42.9 0.0 -28.6 40.0 +12.5 88.9 -66.7
*Error = ABS(exEerimental value) - ABS{anal~tical value\ 100 ABS(experimental value)
----------------------------------------------~========~==-~----------~-
34
There is very good agreement for the main side members where the
larger strain displacements could be more accurately read. Accu
racy is good on those members which are the most influential in
transferring force to the anchor bolts, namely the chord members
and wind load diagonals. The error was large for those members
which were found to carry very low forces.
It was not possible to measure the exact wall thickness of
the upright support for Sign No. 3 in the field; all other dimen
sions of the tubular support were measured. From Texas Department
of Highways and Public Transportation standard drawings and the
known dimensions, the thickness was estimated to be either 0.25 in.
or 0.375 in.
The analytically derived natural frequency values for both
thicknesses were compared to the measured results. For the
0.25 in. thickness, the horizontal frequency was 2.00 cps and the
vertical frequency was 2.11 cps. The horizontal frequency for the
0.375 in. thickness was 2.34 cps and the vertical frequency was
2.46 cps. The experimental values of 1.88 cps horizontal and
1.98 cps vertical correspond more closely to the 0.25 in. thick
upright, and that value was therefore assumed in subsequent
analyses.
The analytical and experimental force ratio values are
compared in Table 2.9 for Sign No.3. The force ratios predicted
correspond fairly well to the measured ratios. The direction of
the forces in the members correspond exactly. The magnitudes
differ the most in the diagonal members where the forces are rela
tively small in the noise range of the recorder system and are
very difficult to measure. The analytical results did not dupli
cate the experimental results in the equality of force carried by
chords 3 and 4. The force in the chords is highly dependent on
the amount of overturning force applied to the lighting fixture.
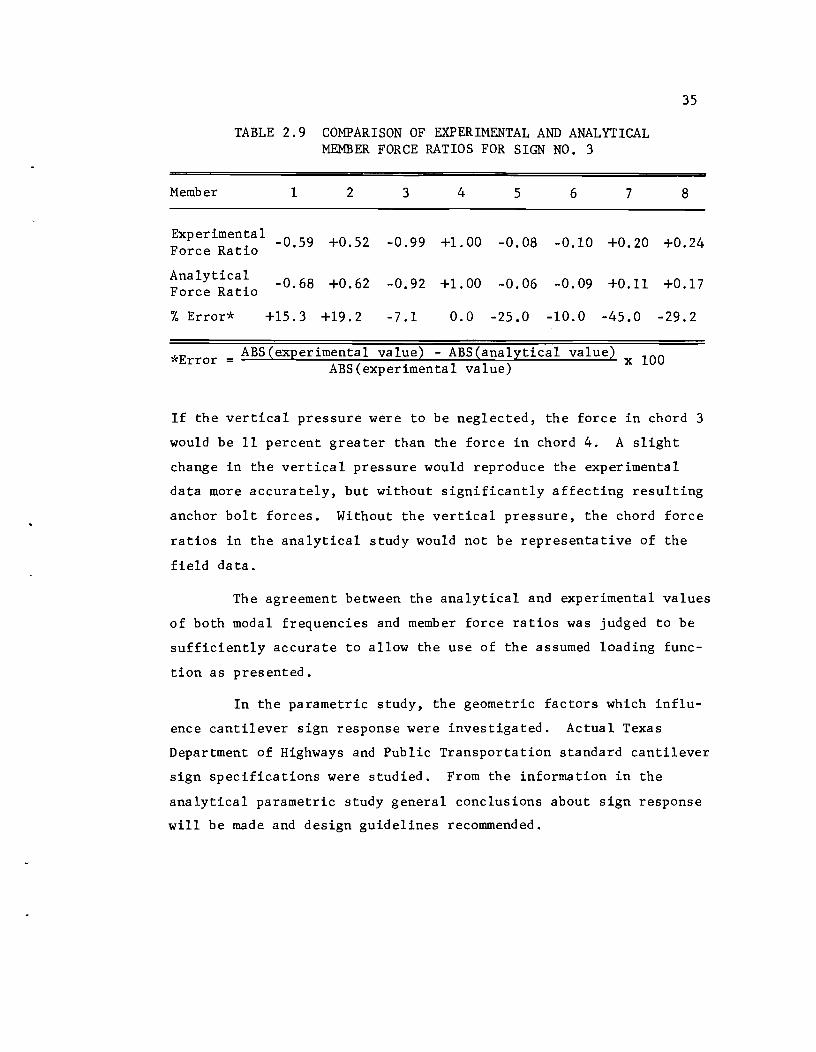
TABLE 2.9 COMPARISON OF EXPERIMENTAL AND ANALYTICAL MEMBER FORCE RATIOS FOR SIGN NO. 3
Member 1 2 3 4 5 6 7
Experimental -0.59 +0.52 -0.99 +1.00 -0.08 -0.10 +0.20 Force Ratio
Analytical -0.68 +0.62 -0.92 +1.00 -0.06 -0.09 +0.11 Force Ratio
% Error* +15.3 +19.2 -7.1 0.0 -25.0 -10.0 -45.0
35
8
+0.24
+0.17
-29.2
*Error = ABS{exEerimental value) - ABS(analytical value) x 100 ABS(experimental value)
If the vertical pressure were to be neglected, the force in chord 3
would be 11 percent greater than the force in chord 4. A slight
change in the vertical pressure would reproduce the experimental
data more accurately, but without significantly affecting resulting
anchor bolt forces. Without the vertical pressure, the chord force
ratios in the analytical study would not be representative of the
field data.
The agreement between the analytical and experimental values
of both modal frequencies and member force ratios was judged to be
sufficiently accurate to allow the use of the assumed loading func
tion as presented.
In the parametric study, the geometric factors which influ
ence cantilever sign response were investigated. Actual Texas
Department of Highways and Public Transportation standard cantilever
sign specifications were studied. From the information in the
analytical parametric study general conclusions about sign response
will be made and design guidelines recommended.
C HAP T E R 3
THE PARAMETRIC STUDY
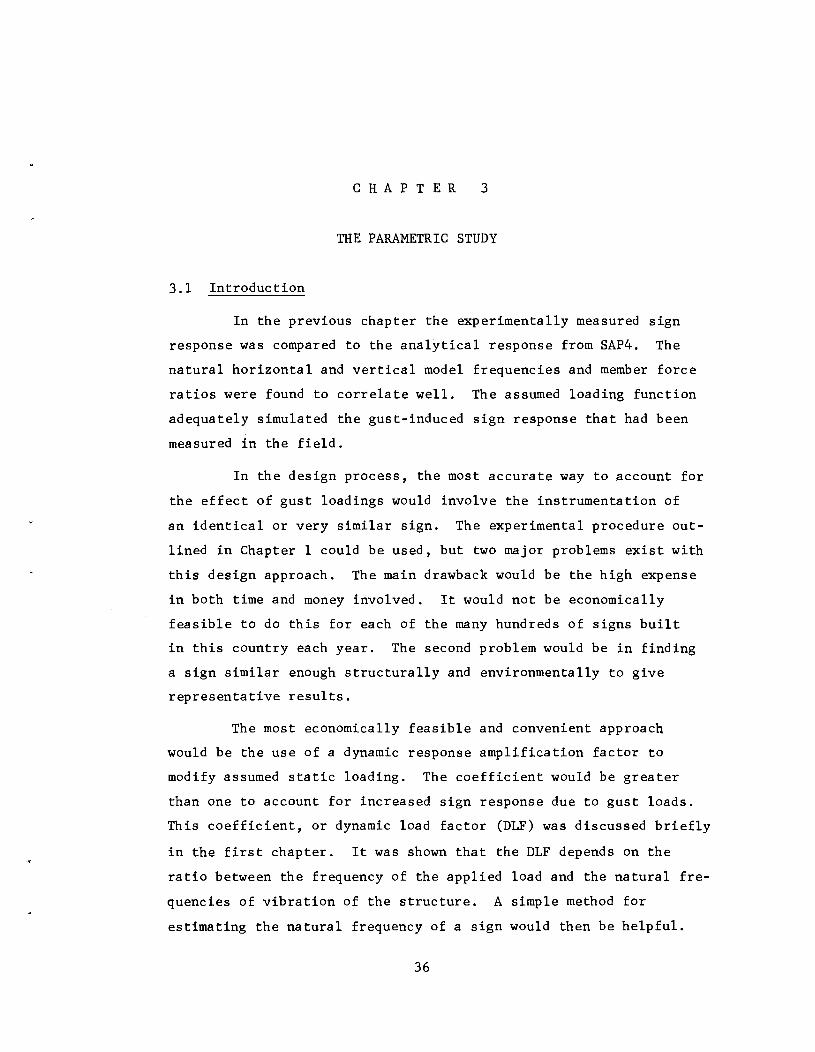
3.1 Introduction
In the previous chapter the experimentally measured sign
response was compared to the analytical response from SAP4. The
natural horizontal and vertical model frequencies and member force
ratios were found to correlate well. The assumed loading function
adequately simulated the gust-induced sign response that had been
measured in the field.
In the design process, the most accurate way to account for
the effect of gust loadings would involve the instrumentation of
an identical or very similar sign. The experimental procedure out
lined in Chapter 1 could be used, but two major problems exist with
this design approach. The main drawback would be the high expense
in both time and money involved. It would not be economically
feasible to do this for each of the many hundreds of signs built
in this country each year. The second problem would be in finding
a sign similar enough structurally and environmentally to give
representative results.
The most economically feasible and convenient approach
would be the use of a dynamic response amplification factor to
modify assumed static loading. The coefficient would be greater
than one to account for increased sign response due to gust loads.
This coefficient, or dynamic load factor (DLF) was discussed briefly
in the first chapter. It was shown that the DLF depends on the
ratio between the frequency of the applied load and the natural fre
quencies of vibration of the structure. A simple method for
estimating the natural frequency of a sign would then be helpful.
36

37
Using SAP4, a parametric study was made on actual Texas
Department of Highways and Public Transportation cantilever stan
dard sign designs to determine DLF and natural frequency values for
a variety of sign geometrics. In Texas, cantilever sign design is
based on geographic zones which reflect expected natural loading
conditions. Zone one signs are designed for 100 mph winds and no
icing, and incorporate the largest truss and upright sections.
Zone one signs are the most rigid. In contrast, zone four signs
have the smallest section areas and are the most flexible. The
zone four design loads are a 70 mph wind with or without ice buildup.
Zones one and four constitute upper and lower limits as far as sec
tion sizes and sign structure flexibility are concerned.
Within each zone the truss length varies by 5 ft intervals
from 10 to 40 ft, inclusive.
to 32 ft by 1 ft intervals.
The support height varies from 14 ft
Tables 3.1(a), (b), and (c) give the
geometric properties of the signs used in the parametric study; the
signs were chosen to represent a reasonable variety of possible
designs [5]. All combinations of 10, 25, and 40 ft truss lengths
and 14, 23, and 32 ft support heights were analyzed. Both zone one
and zone four signs were investigated for each combination. A
representative sign area was used in the study. A sign size of
80 x 120 in. was used for the 10 ft truss and a 120 x 180 in. sign
was used for the 25 and 40 ft truss lengths. The larger 12 in.
long sign was too large to be used on the 10 ft truss, necessitating
the scaled-down version. The general sign structural arrangement is
shown in the Appendix.
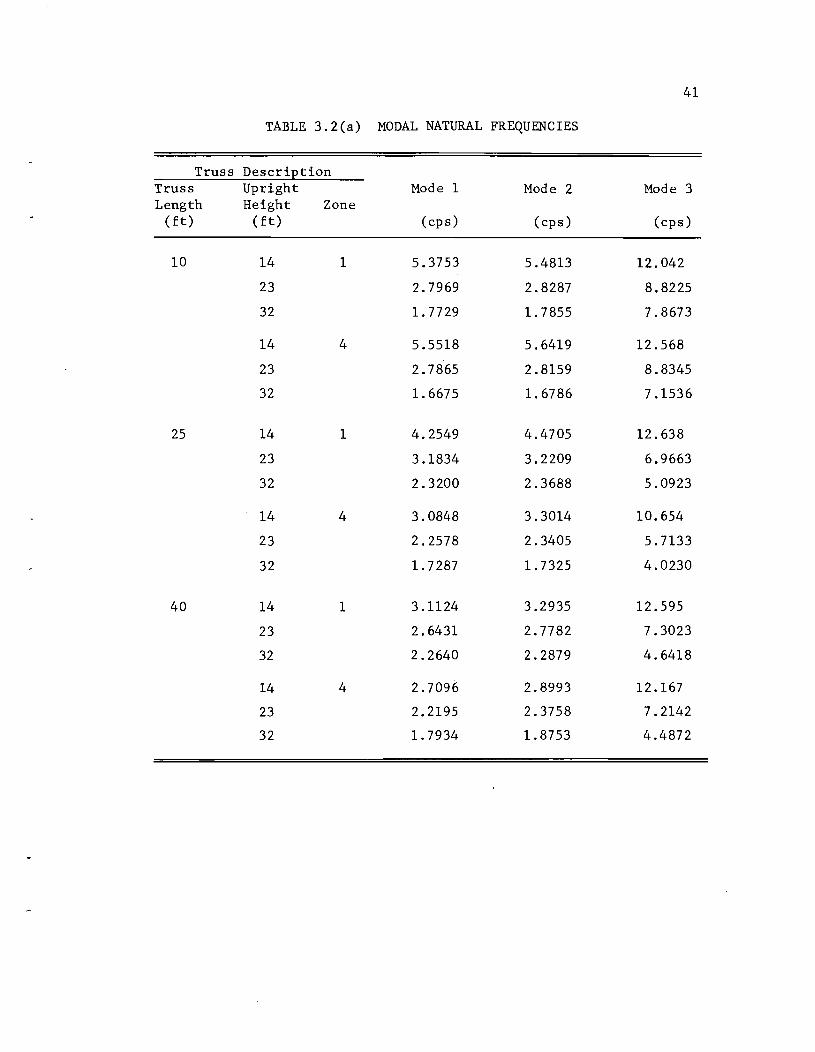
3.2 SAP4 Natural Frequencies
Table 3.2 shows the three lowest model frequencies of
vibration, as well as the corresponding mode shape ordinates at the
free end of the truss and at the top of the support.
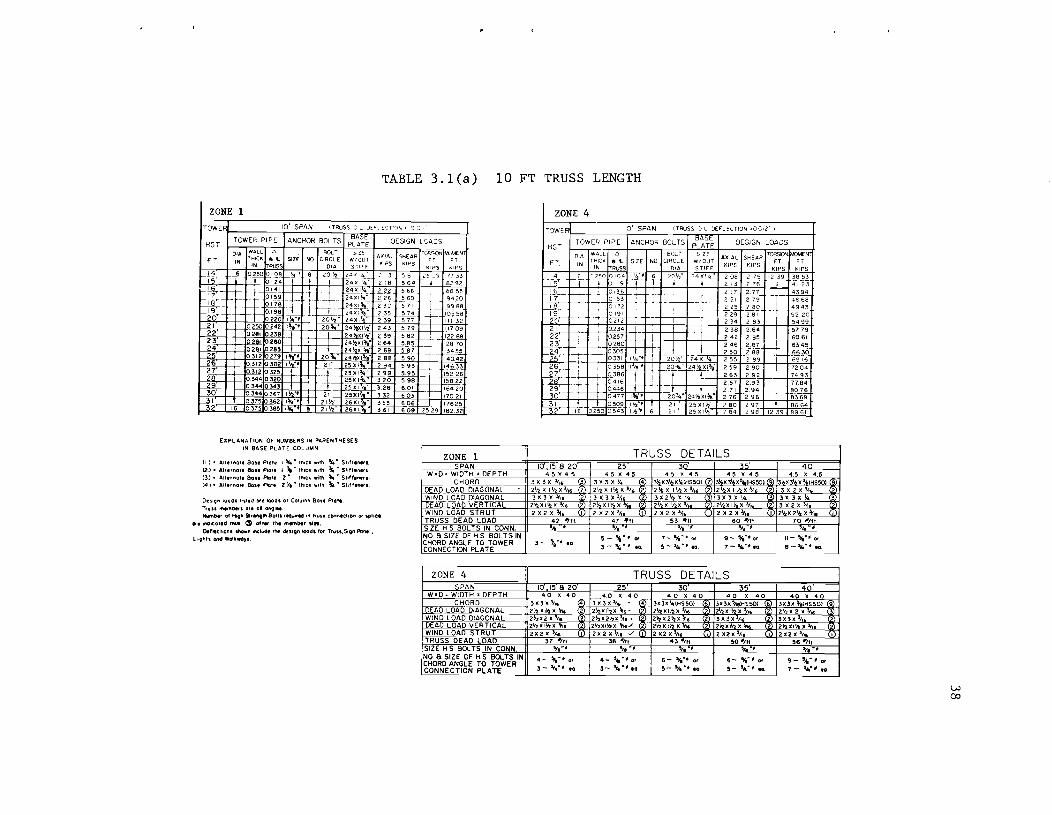
TABLE 3.1(a) 10 FT TRUSS LENGTH
ZONE 1
TOWE !:."T,)II.' ') :'"
HGT OESIGN L0AOS
FT O'A IWAl'-l " THICI( • c... IN IN RUSsi
BOLT I ~IZE I A,lClAL I ~ EAR IT':.R5()rJIW.1E"J SIZE I NO I CIRCLE WIOLIT KIP >;1 .... F" T
OIA STIFF S PS KIPS r(IPS
11~_t~...§~q25010 I S28r;-~".L~_ 15 ITTlO'24'I 16· iT
~g?i'_12_"),J,,- t' 3t~6,t~5":91??33 24):1\1,. 2:8 564 , 8.:'92
gt:~:: -21· 22 23
-+-~£~~-;t-m1-}~t ' i~~;; ~I~~ ~~~~~: '-t}~ ~~;*. ± l~t~: 20'-"1" 24XI~" 2 39 577 I 11132
4 25
:M=:l ' I0375~362I''''~:fff+R±lli±rI35H-6~1 117625 32 1603750385 1li.~I~" 361 609 2529118232
EXPLANATION OF NUM8ERS IN PARENTHESES IN BASE PLATE COLUMN
(I I • Allerl'lol, Bolt Plate I",.. .. n'lfc'" w,tl'l \." Sldllnlr •.
(2) • AllernOIl 80.' Plo'e I '- ~ Il'Ilcll .,11'1 ~"SIlfflner. (3) * AITernOIl 80.' PIa'e 2" II'IICII. WI'I'I ~ .. SI.ff,ner. (41)· AnernO'e Bo., PleUe 2 \0'," Il'Ilcll wlll'I \." SlIff'lIt,..
011011;11'1 IOlld' h\I,O ore lood. 01 COlumn 80u PIOII. Tr"" "",",De', or, 01 01'101 .. Nwmblr of HIQ" Str'nG" 8011. req",,'r"N 11'1 rr""u conn, chon or ",hel
or, lIId,co',<I ttMII " off" 11'1, "',mblr .in. o.U'ChO"' ~I'I II'I(h .. de II\e dellOn load. lor Tr"''',Sion Ponel,
l'Ql'lh and WoIlI.o)'.
ZONE 1 SPAN
W,D ~ WIDTH' DEPTH CHORD
~AD DIAGONAL ~ND LOAQ OIAGONAL ~,O_AO VERTICAL ~,9 LOAD STRUT TRUSS DEAD LDAD SIZE H S BOLTS IN CONN, NO 8 SIZE OF H.S. BOLTS IN CHORD ANGLE TO TOWER CONNECTION PLATE
ZONE 4 SPAN
~,g ~ WIDTH, DEPTH CHORD
~ LOAD DIAGONAL ~~D DIAGONAL
DEAD LOAD VERTICAL WINO LOAD STRUT TRUSS DEAD LOAD SIZE H S BOLTS IN CONN. NO.8 SIZE OF HS BOLTS IN CHORD ANGLE TO TOWE R ~'ONPLATE
ZONE 4
HG T
DIA SIZE AXIAL SHEAR TORSK)'.) M)MEN
FT IN T~~CK =~S SIZE NO CIRO~~E ~~~~; KIPS KIPS :r;S :I~S !4 ~? ~25010'1)4 '_~'" Z()i;?" 2~X'\I< ~~ _2J5 12 39 )_8_5~
--",T -.- , O-llg- -or i I 213 276 j 4123
16 -----+- 0136 __ --<--- +---~_ 2]7 2.77 4394 l-r:- ---+.---=_o~ ~ _____ ~~---~ -~ 2 __ 7~- _~ __ ~6~ ~l~= ~ ~ ~_ Ii t--~ ;-- t--=-J=a T~t~=-- ;~-i%
?O' I 0212 1 234 2831 I 5499
'-'~b-r-~ --+- ?~H' . 238 2 94 57 7_~ ~~ : 4-~~~~~~ ;:~ ~:~ -r-~
l-~t-'=-f-:::.63(ji ,_ l:::::r::::;::- --~ 288 L 6630 r-5"i:'''''-- I 1-6-33T~",. 20 112" 24XIV.' 255 2~1-- 6916
~~T' - I . +- 0358 R'=' I," -, 2<V'" 24'''t la'' 2 59 290 1-1- f-#9 4
Hir- -+-1---' Q..3_B_6 .j...-~- 263 292 74 93 t-~ -t- T 0416, 2.67 293 7794
~ - g~~ I~' 20 '241~XI ~;~ ~:: :~~~ rlf- 16 ~o+so~~; +I~~Y':~ ~;;~~" ~:~ ~~~ 12~ :~:f-
TRUSS DETAILS 10 15820 25 30 35 4
45X45 45 X 45 45 X 41.5 4!5 X 4.5 4.5 X 4.5 :3)( 3 X );'16 3 3 X 3)( 'I.,. 4 ~X31 X'4(rlS501 7 3\1.X3l.4X~(t·iS50) 9 31 X3' X3 (HS501 8 21~ X III2X3/u~ ; 2Vz X I'''.! X)", 2 21,ozX l'hXl/ul 21~X 11t2 X 3ti, 3X2X
'ti ..
3 X 3 X ¥16 3 X 3 X 3/i 2 3X2Vr X II.,. 33X3XI/.,. 3X3XV.,. 3 2 XI~""Xo/t' 2 2": X 1:'-: X Yo 2112)(I'I2;X l/,. 2 \It: X IVzX l,i 3X2X3/16 2 X 2 X ~6 I 2 X 2 X 3/16 2)( 2)( 31), I 2)( 2 X ltl& 2~X2~)(3tI&
42 .,,, 47 ." 53 ""It 60 "'/II 70 "'/ft.
'" 1, ~/." - '" ' I.,. "-~- ~'" or 7- ~.It .. , or 9- ~"'Of 11- ~ .. , Of
3- ".'" eo 3 - It.''' 80. 5 - 3/4'" eo. 7-""'.11 8-''''''' eo --
TRUSS DETAILS 10 15820 25 30 5 4 40 X 40 .. 0 X 40 40 X 4 a 40 X 40 40 )( 40
3X 3)( 'II. 4 3)(3)(3t16 4 3)(3)( '--{HS501 6 3X3)( ~/~HS50) 6 3)(3)( 'raIHSSQ) 9 21>'1XI~X ~ 2 2'!.2 x III:t X_ ~'- ~ JZL 2'1zXI't.!:X :rl6 2>'1Xr~)( 16 2'12 X 2 )(". , 2~zX2 X 716 2 2\o'zX2~X '1\. ~ W 21<.0 X 2~X ~,. 3X3X :t16 3X3X i'l ...J&L ZIIzXIYzX \'1& 2 2V2XI~X ~16./ 2 2~XI~X~. 2'flXIYiX~ 2"")(1 x ,...& 2X2X '/4 I 2)(2 )(3/t • ./ , 2 X2 x 'It& I 2 X2x '1,& 2X2)( 'II' I
37 "'/f! 38 -III 43 "'1" 50 "'/ft 567ft ~8'" ~Ia '" 't,'" .,
'II ",
41- ,~, o. 4- '.It'" or 6- 'I,'" or 6- ~ .. - 01" 9- '.It" - 01" 3- It .... , la 3- !ly.,.'" 10 I ~-'~"'.o 5- '.'" ,a. 7- ,."- '0
w (X)

TABLE 3.1(b) 25 FT TRUSS LENGTH
ZONE 4
25' SPAN 'TRUSS 0 L D£F'L(CTION -'-''--'-----1
TOWER P;P~ I ANC~OR I B~: TS I :~~~ I ~LT
ExPLAI'tIATK)N or MJM8ER$ IN P1\JtENfHESES IN BASE PLATt COLUWH
II , • Art.,I1O" 80M! PlOt. I'" ~ 'Ih(ll Wlfh ~ .. $1.tt.",.U .. 12) ~ Al1.ttWata 60 .. Plot, Iii." fnoell With %. .. S'lff'~.n f3) • AII"",ot. Bo .. PiO:" :2" th.ell wdh "" .. S"ff.~¥ •. (4J • Antrno. Sou ptfl, 2 fit" U,,;(tl •• ,tl ~ .. St,ff.",....
'u ,!, ~ TRUSS 10' 15' 8 2Q' 25' I
45X45 45)(45
DETAILS
O. "'9'" 100fl 10\1.4 ~ 10116, Of COltiml'l a ... P*'Ott Tr" .. I'I'lItmNt, ora 01 ~tl •• Humbtt 4f K;h SI~ BeNt ...... ., "" tr..,.. (()f\ofIIIfct>On Ot s.oliU
or • . tId • .c:o'-d tftw& () of .... I,. .am'" silt. o.'IK'iofI& &hown -ciwdt i'iIIIt dt&t9"l1OOlf& lOt ttvll.Sttn Po,.I,
lION' ..., WOllWOY'l.
3 X 3 X ~, 3- -:3-)(" 3 X 14 2~~XJ:/j. 21hX lihX;1,
3X,):.\' .. ~t"X3X!1j 2'~)(I~X !f"il/;'x-!Y;X ~X2x'>l. <D!'X2X'4.
42 ""ft 41 .. tt 14'" _~ __
3 -.. ~, .. , .a !t- ~., Il'!'
3~st. .. • "
TRUSS DETAILS o 35
40 x -40 3)(3x'l.li"iS5(t) 2'.tz"'I~X %'16 3 )(3X~11
2~)(I~X~ t) 12 X2x l,.,
50 "," ~."j
6-~" 01'
~- s .. ,. 'el W \0

TABLE 3.ICe) 40 FT TRUSS LENGTH
ZONE 1
~ ______ ~~~~~~~~~~~~~~~ ____ ~TOWER
DESIGN lOADS HGT
WALLI " OIA k-H1CK ~ ~ IN I'IN TRLs.::
BOLT I SIZE IAXIAL ISHEAR SIZE I NO ICIRCLE W/OUT PS FT
OIA. STIFF. KIPS KI
_~o_m~Q~ 1041010219
2'","'1 8 36" 14 15"
fH---0440Q39_9 I ~ 1_- __ .J_ - .129.8 2_~2~ _1.-- ~!"! _2.L
Q 440 Q~38 T 1 _~~?: ~O~ _1:) 2'3 t_ 5.2g.L!3 ?S_]_ 04700531 <.'i£' t _""" ~X2'~"(2) --''2.6 1 _"-3-'~ --11
__ 5~ ~9 ---.Z~_ -+ 6~~~ ~~j-(~~ -, _3_~_~'~ :~:~~~i) :-g;& -~}~~ -, . }~5-~~ --~~,-
850C 0540 J +- • ~:':flr4'\3) ~I ~1 1349 I 6Jf_~_5 _Z~_ () 5')0 C582 +_. . 42X2~'(3) _IJ~ 2}54 63~89 27, .9~OOQ626 -1 ~ ~ 42X2~/.!I"[:~} IIfj4 235'3 ~ 6~~93 2EL
1 6 }~~. ~ i:; T ---+ - ~- :~~~~~~; -~ ~'~ ~i ~~ -- -- ~~~~: -~~-3'0- f;~~ G~~~ zT;21 R 36~-.r fz:i~~~\:} ~~.;; ~t~~ 432 38 i~~-~~ -~
EXPLANATION Of NUMBERS 1"1 PARENTHESES IN BASE PLATE COLUMN
ZONE 1 SPAN
WaD = WIDTH .. DEPTH
ZONE 4
TOWER PIPE
40' SPAN 'TRUSS ° L DEFLECTION "0 754") ITOWER
I ANCHOR BOLTS I P~~~ I DESIGN LOADS
OIA IWAlLI '" THICI< It l IN IN TRUS
_3q _10 ?f-O~~
'l~-l~i _ t 0463 (25') 0516 :J 281 G 510
_ _ ,:: ~ fl:'
'J562 ~'61 7 J6 7 5 C 7 35 G797
1')(,-::
1-::73 1148
1:::'<;6 t 38£
SIZE
I~<' I
I j. ,-~ 2 •
!
, 2"1
10 15 S 20 45 X 4 5
BOLT
NO ~IRCLE
OIA
SIZE I I WI OUT AXIAL SHEAR rORSKlNlMOME1 HGT STIFF KIPS KIPS FT FT KIPS KIPS FT
_8 35%" - j 3~:Y~!~55 1~1 .. 2.2_t?I~~412~4~1 14'
76311124 • T20933~
__ 1, _t7_C.~',' 112--'+D' - 2,_,'84,5 t- - _7_",--9 J~~ __ .. __ 2~~ , 787 11.32 I 23732
~ --~~-~ ~~ ~1-i ~~ ~;}~6
35:;'-.£1 35~4 '
I
4°"'X"~i' 8791',,~54 . !18_,',?,~5 _,2_2r 4u1f;XI~e 888 1154 32918 27
4:::~2XI\."-896 1156 . 33989-28' -l - -905 1158 + 35-068 2r;r-
• -9-'-4- 11'61 -- 36153 ~ , ~ 51;4"
, l323-t11631 • 1372461 31~ 4s/2xil-.'l 94-1 116-8-Til-I-94T384261~' I
TRUSS DETAILS 25 30 35
45 X 45 45 X 45 45 )( 45 4
4.5 X 4.5
II) • AlltrnOlt Bon Plole I Sf .. " lh,C'" •• 11'1 !r." SllIfener, (ZI. AII,rnale Bo,", PIOle I ), M "",elo. .,!t1 \." ST,ffenel' (3) • AII,rrlol, 80 .. PicHe Z" tn,ck .,11'1 ~ .. St,'feners 14.1· AlttrnOTe Bale PlOlt 2 \ott ~ II'lIck .,11'1 ,~ .. SII'h"4l" CHORD
~~DDlAGQ/'(~ 3 X :3 i ¥t' 3 :3)( 3 X II .. 4 3~X3'hx'4(HS50l 7 3' X316X !o,f&{HS!:(}l 9 3' )(31 )(3 (HSSO) 8
Design IOod. 1i\led ort lood, 01 Column 8011 Plote Tr..,,, member, are 01 CI'IQI.,
Nllmblr of ""9'" STrenGth Bolt. 1'tq\,lIftd In 'run connlchon 0' ",hel
orl Indlcaled thus a> ott.r Ihe member "" o.fletl,on, .1'Io ... fI'l'I(lude ..... dttoUlI" load, for lrun,SIt;!" Pone',
LUill'lt1 and Wolk.o,.
~®---.bQAD DIAGONAL p'/;EAD.1Q.AD VERTICAL ~~D LO~D STRUT TRUSS DEAD LOAD SIZE H S BOLTS IN CONN. NO 8 SIZE OF HS BOLTS IN CHORD ANGLE TO TOWER CONNECTION PLATE
ZONE 4 SPAN
W100: WIDTH 10 DEPTH 1-"-' CHORD foEAD LOAD DiAGONAL ~INb LOAD DIAGONAL ~~OAD VERTICAL
W)ND LOAD STRUT TRUSS DEAD LOA;) SiZE H S BOLTS IN CONN NO S SIZE OF HS BOLTS IN CHORD ANGLE TO TOWER CONNECTiON PLATE
'2 ~ X III;! X 3/" 2
3 X:3 )( 3,016
2I'zxi1'.:"""'i3/16 2 2 )( 2 X ~&
42 ~fI ~ ,
3- ";tII fa
10 15820 40 X 40
3X 3 x '116 4 2112 Xl\o'z x ~6
2hX2)( '1'6 2 2'12 X !\02x ~'6 2 2X2 X'/16 I
37 "'lft ~/e M,
4- ~ ... , or
3- 'I .. '" .0
2V2 X II~X lAG 2 2~X jllz)(3/IG 21,1,)( t 'Ie: X '1\6 "3 X 2 X 3/1 :3 X:3 X 3/16 2 3)(2112 X I/~ 3 3)(3)('/ .. 3X3XV .. 3 2;;: X 11;2 X 3/j, 2 2VZXIIIz)( 3/1• 2~XI~X3" 3 )( 2 X '/II~ 2 X 2 )( 'It. I 2)(2 X'". I 2)(2)(3/, 2~X2~)( 3/1
47 .,! 53 A}'fI 60 /l'1ft 70 ""1ft % %"~ ~/8' , 'I .. '"
~ _ %, ft, or 7- 'It'" Qr 9- ~,,'" or 11- !I,,", or
:3 - '4" til eo 5 - It.''tII eo 7- '4-'.G- B-'4'" eo
TRUSS DETAILS 25 30' 35 4
40 )( 40 40 )( 40 40 X 40 40 X 40 3)(.3 X'ii. 4 .3X3X!l.(HS501 6 3X3X ~A6'HS50) 6 3)(3X ~tHS501 9 21"')(II~X lI,' 2'n:XI'/lX 16 212XI!;z X 16 2 2'/2:)( 2 XI'" 3 2joz:..Z~X '1\6 \. 2~X2~~6 2 3 X 3X '/, 3X3X i"'6 2Vlxl\02X \"fi'/ 2 2~)(1~ Xlr'l6 2~)(tYzX ~fi 21,.tzXI'h)( ;-'6 2 x 2 X '/16 ...I I 2 x2 X 'it. ) 2 X2 X'II. I 2X2 X '1t6 I
38 411ft 43 ·/ft ~O "/ft 56 ~f' '/t'" ~/, "- 'I,M, '1,-'
4 - ',,'" or 6- 'I.M
, Ot 6- ',,'. ~ Ot 9- '",- ~ Of
3- ""'., eo i ~- 'I .. -, eo ~- '.'" eo- 7 - ' ... " ~ eCL
.p-.. o
41
TABLE 3.2(a) MODAL NATURAL FREQUENCIES
Truss DescriEtion Truss Upright Mode 1 Mode 2 Mode 3 Length Height Zone
(ft) (ft) (cps) (cps) (cps)
10 14 1 5.3753 5.4813 12.042
23 2.7969 2.8287 8.8225
32 1.7729 1. 7855 7.8673
14 4 5.5518 5.6419 12.568
23 2.7865 2.8159 8.8345
32 1. 6675 1.6786 7.1536
25 14 1 4.2549 4.4705 12.638
23 3.1834 3.2209 6.9663
32 2.3200 2.3688 5.0923
14 4 3.0848 3.3014 10.654
23 2.2578 2.3405 5.7133
32 1. 7287 1. 7325 4.0230
40 14 1 3.1124 3.2935 12.595
23 2.6431 2.7782 7.3023
32 2.2640 2.2879 4.6418
14 4 2.7096 2.8993 12.167
23 2.2195 2.3758 7.2142
32 1.7934 1. 8753 4.4872
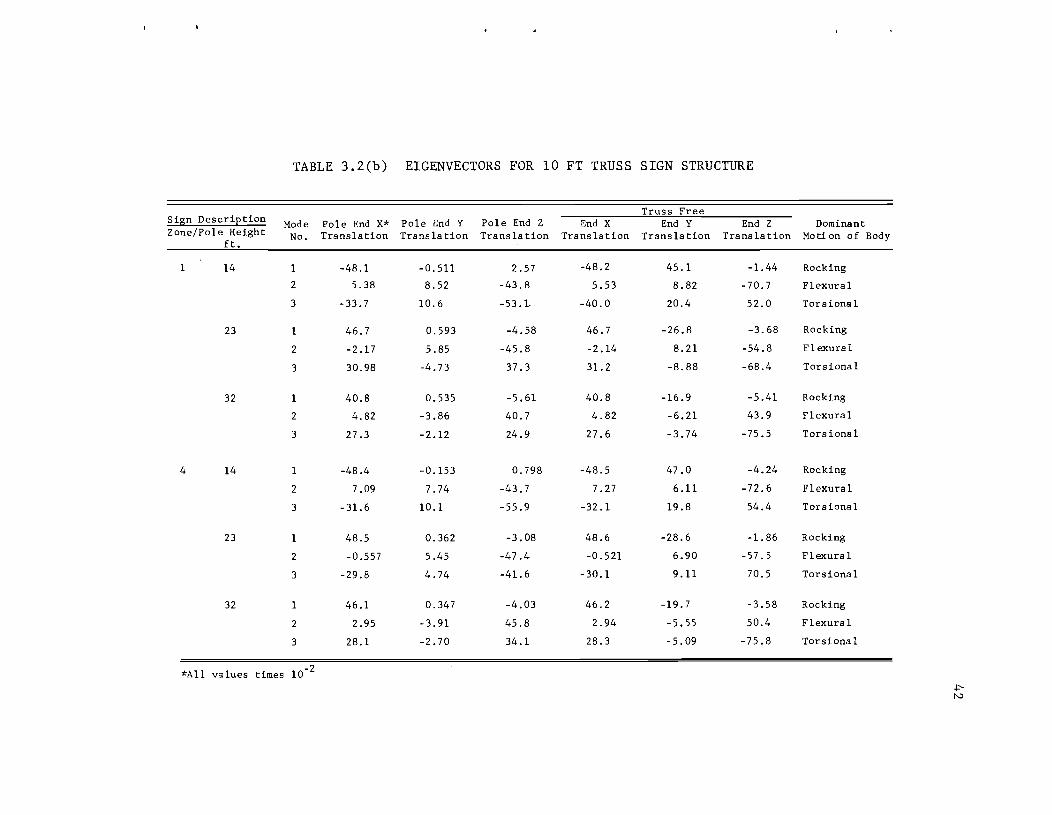
TABLE 3.2(b) EIGENVECTORS FOR 10 FT TRUSS SIGN STRUCTURE
Truss Free Sign DescriEtion Mode Pole End X* Pole End Y Pole End Z End X End Y End Z Dominant Zone/Pole Height No. Translation Tra ns la tion Trans la tion Translation Translation Translation Moti on of Body
ft.
14 1 -48.1 -0.511 2.57 -48.2 45.1 -1.44 Rocking
2 5.38 8.52 -43.8 5.53 8.82 -70.7 Flexural
3 -33.7 10.6 -53.1. -40.0 20.4 52.0 Torsional
23 46.7 0.593 -4.58 46.7 -26.8 -3.68 Rocking
2 -2.17 5.85 -45.8 -2.14 8.21 -54.8 Flexural
3 30.98 -4.73 37.3 31. 2 -8.88 -68.4 Torsional
32 1 40.8 0.535 -5.61 40.8 -16.9 -5.41 Rocking
2 4.82 -3.86 40.7 4.82 -6.21 43.9 Flexural
3 27.3 -2.12 24.9 27.6 -3.74 -75.5 Torsional
4 14 -48.4 -0.153 0.798 -48.5 47.0 -4.24 Rocking
2 7.09 7.74 -43.7 7.27 6.11 -72.6 Flexural
3 -31.6 10.1 -55.9 -32.1 19.8 54.4 Torsional
23 1 48.5 0.362 -3.08 48.6 -28.6 -1. 86 Rocking
2 -0.557 5.45 -47.4 -0.521 6.90 -57.5 Flexural
3 -29.8 4.74 -41. 6 -30.1 9.11 70.5 Torsional
32 1 46.1 0.347 -4.03 46.2 -19.7 -3.58 Rocking
2 2.95 -3.91 45.8 2.94 -5.55 50.4 Flexural
3 28.1 -2.70 34.1 28.3 -5.09 -75.8 Torsional
*All values times 10-2
+0-N
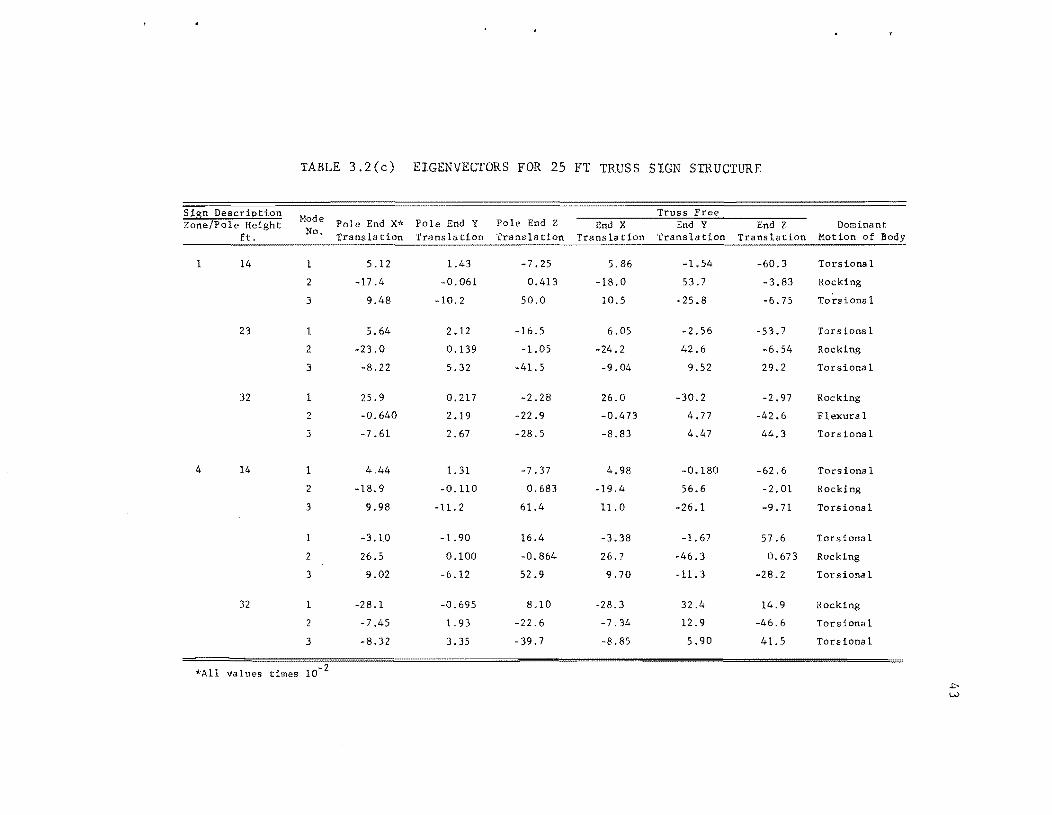
TABLE 3.2(c) EIGENVECTORS FOR 25 FT TRUSS SIGN STRUCTURE
S~8n DescriEtion Mode Truss Free
Zone/Pole Height Pole End X* Pole End Y Pole End Z End X End Y End Z Dominant ft. No. Translation Translation Trans 1a tion Translation Translation Translation Motion of
1 14 1 5.12 1.43 -7.25 5.B6 -1.54 -60.3 Torsional
2 -17 .4 -0.061 0.413 -lB.O 53.7 -3.B3 Rocking
3 9.48 -10.2 50.0 10.5 25.8 -6.75 To~sional
23 5.64 2.12 -16.5 6.05 -2.56 -53.7 Torsional
2 -23.0 0.139 -1.05 -24.2 42.6 -6.54 Rocking
3 -8.22 5.32 -41.5 -9.04 9.52 29.2 Torsional
32 1 25.9 0.217 -2.28 26.0 -30.2 -2.9.7 Rocking
2 -0.640 2.19 -22.9 -0.473 4.77 -42.6 F1exura 1
3 -7.61 2.67 -28.5 -S.S3 4.47 44.3 Torsional
4 14 1 4.44 1. 31 -7.37 4.98 -0.lS0 -62.6 Torsiona 1
2 -IS.9 -0.110 0.683 -19.4 56.6 -2.01 Rocking
3 9.9S -11. 2 61.4 11.0 -26.1 -9.71 Torsional
-3.10 -1.90 16.4 -3.3B -1. 67 57.6 Torsional
2 26.5 0.100 -0.S64 26.7 -46.3 0.673 Rocking
3 9.02 -6.12 52.9 9.70 -11. 3 -2B.2 Torsional
32 1 -28.1 -0.695 8.10 -2S.3 32.4 14.9 Rocking
2 -7.45 1. 93 -22.6 -7.34 12.9 -46.6 Torsional
3 -B.32 3.35 -39.7 -B.85 5.90 41.5 Torsional
*A11 values times 10 --I> W
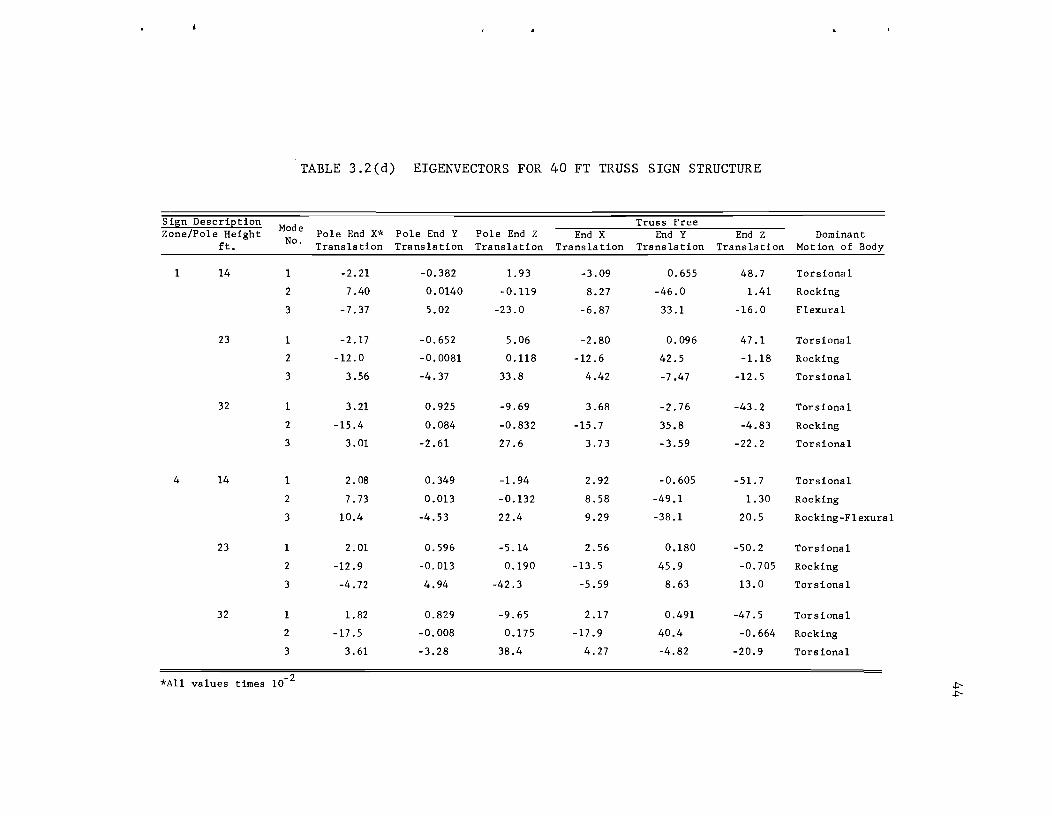
TABLE 3.2(d) EIGENVECTORS FOR 40 FT TRUSS SIGN STRUCTURE
Sign DescriEtion Mode Truss Free
Zone/Pole Height Pole End X* Pole End Y Pole End Z End X End Y End Z Dominant ft. No. Trans la tion Translation Translation Translation Translation Trans la tion Motion of Body
1 14 1 -2.21 -0.382 1. 93 -3.09 0.655 48.7 Torsiona 1
2 7.40 0.0140 -0.119 8.27 -46.0 1.41 Rocking
3 -7.37 5.02 -23.0 -6.87 33.1 -16.0 Flexural
23 1 -2.17 -0.652 5.06 -2.80 0.096 47.1 Torsional
2 -12.0 -0.0081 0.118 -12.6 42.5 -1.18 Rocking
3 3.56 -4.37 33.8 4.42 -7.47 -12.5 Torsiona 1
32 1 3.21 0.925 -9.69 3.68 -2.76 -43.2 Torsional
2 -15.4 0.084 -0.832 -15.7 35.8 -4.83 Rocking
3 3.01 -2.61 27.6 3.73 -3.59 -22.2 Torsional
4 14 1 2.08 0.349 -1.94 2.92 -0.605 -51. 7 Torsional
2 7.73 0.013 -0.132 8.58 -49.1 1. 30 Rocking
3 10.4 -4.53 22.4 9.29 -38.1 20.5 Rocking-Flexural
23 1 2.01 0.596 -5.14 2.56 0.180 -50.2 Torsional
2 -12.9 -0.013 0.190 -13.5 45.9 -0.705 Rocking
3 -4.72 4.94 -42.3 -5.59 8.63 13.0 Torsional
32 1 1. 82 0.829 -9.65 2.17 0.491 -47.5 Torsional
2 -17.5 -0.008 0.175 -17 .9 40.4 -0.664 Rocking
3 3.61 -3.28 38.4 4.27 -4.82 -20.9 Torsional
*All values times 10- 2 +--+--

45
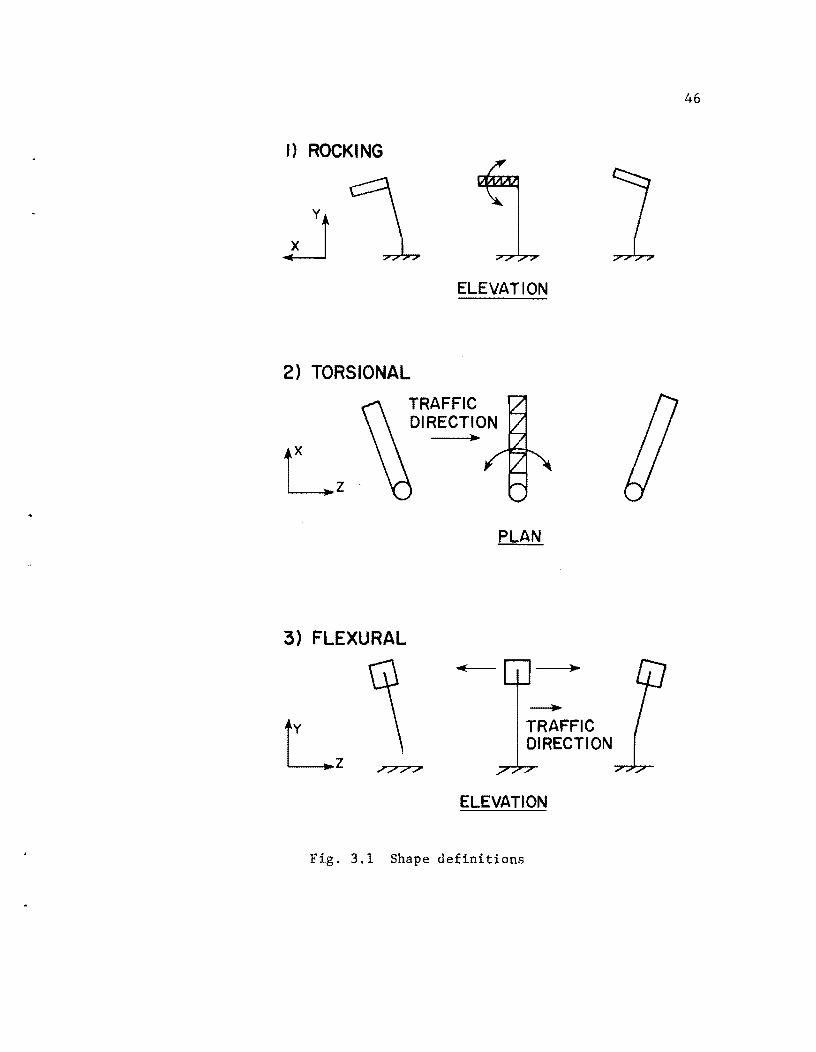
In each mode the dominant displacement direction was
determined by comparing the mode shape ordinates at the free end
and support end of the truss. Figure 3.1 describes the modal
shapes labeled as rocking, flexural, and torsional. In Table 3.2,
where more than one mode is listed, the shape was a combination
of the two listed.
A definite trend can be seen in the data. For the shortest
truss lengths, the rocking motion has the lowest natural frequency.
The lower the natural frequency, the more flexible the structure is
in the direction of motion relative to the other displacement modes.
The second mode is flexural and the third torsional. This trend is
independent of the pole height for the 10 ft truss.
The first mode of the 25 ft truss shows a transition in
which the first mode shifts from the rocking to a torsionally
dominated mode. For the longest support pole, the decreased flex
ural stiffness is more significant than the torsional effects from
a long truss. The flexural displacement mode is only found in one
case of the 25 ft truss length.
Torsional motion completely dominates the first mode of the
40 ft truss length group. The second and third modes are rocking
and torsional or flexural, respectively.
As a truck passes underneath the sign face, the displaced
air imposes an upward load on the lighting case while loading the
sign face horizontally in the direction of traffic flow. Because
the area of the sign face is much larger than that of the lighting
case area, horizontal motion dominates, as observed in the field
tests.
This dominant horizontal force is very important in the
study of the magnitude and direction of sign response. Actual sign
response is a complex summation of modal responses, the lower modes
I) ROCKING
ELEVATION
2) TORSIONAL
3) FLEXURAL
TRAFFIC DIRECTION
•
PLAN
~
TRAFFIC DIRECTION
ELEVATION
Fig. 3.1 Shape definitions
46
generally being more significant than higher modes in producing
forces at the base of the sign.
47
The sign will respond in those modes that are excited by
the applied loads. The torsional and flexural modes are character
ized by horizontal displacements of the sign and truss. They would
correspondingly be excited by the dominant horizontal wind force.
The structural response of the sign structure will be examined by
examining the relationship of sign response to the torsional and
f1 exura 1 mod es •
3.3 The Dynamic Load Factor
The dynamic load factor (DLF) is defined as the maximum
dynamic response to the loading function, divided by the maximum
force resulting from a static application of the loading function
at its peak value. Dynamic load factors for torsion moment and flex
ural shear at the support base were calculated from SAP4 outputs.
3.3.1 The Dynamic Load Factor for Base Shear. The DLF for
base shear was obtained using the static and dynamic base forces
parallel to the direction of traffic (z-direction), as calculated
by SAP4. Shear forces in the traffic direction are caused by flex
ural displacements of the upright, corresponding to the flexural
mode shape. Table 3.3 gives the static and dynamic shear forces,
the flexural natural frequency with mode number, and the torsional
natural frequency with mode number for each sign. The dominant
mode will have the lowest natural frequency and, in many cases, the
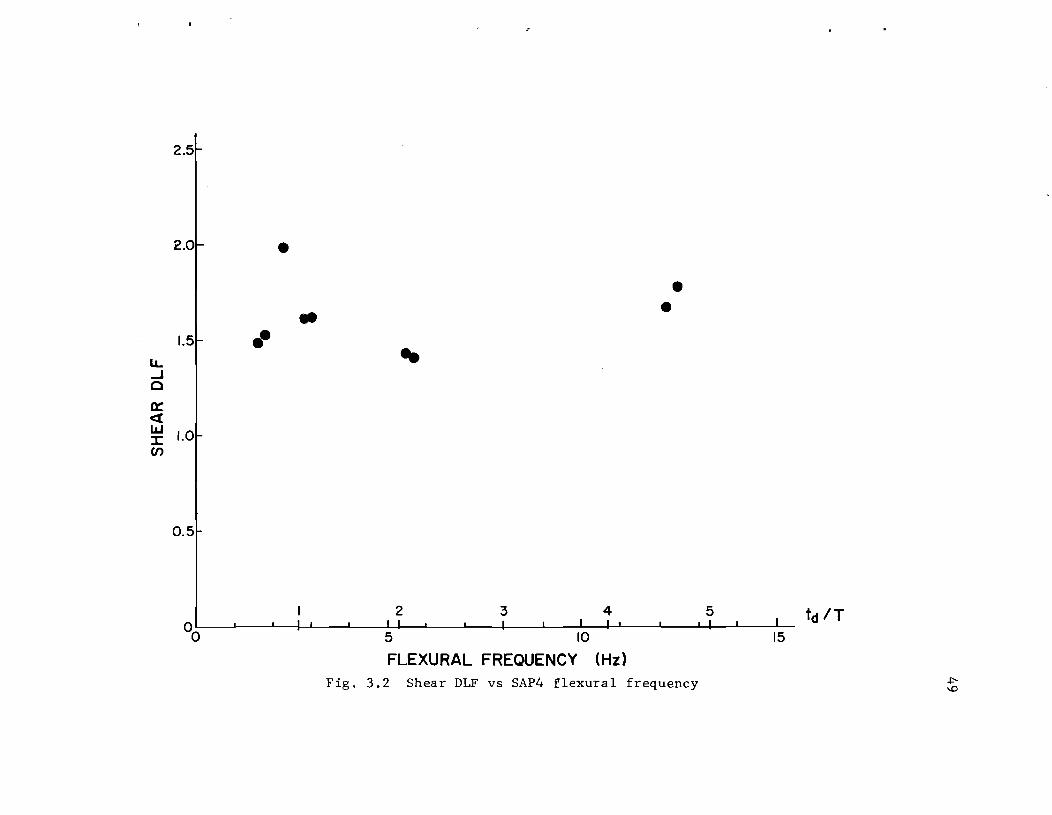
flexural mode did not dominate. Figure 3.2 shows graphically the
relationship between the flexural frequency and the shear DLF.
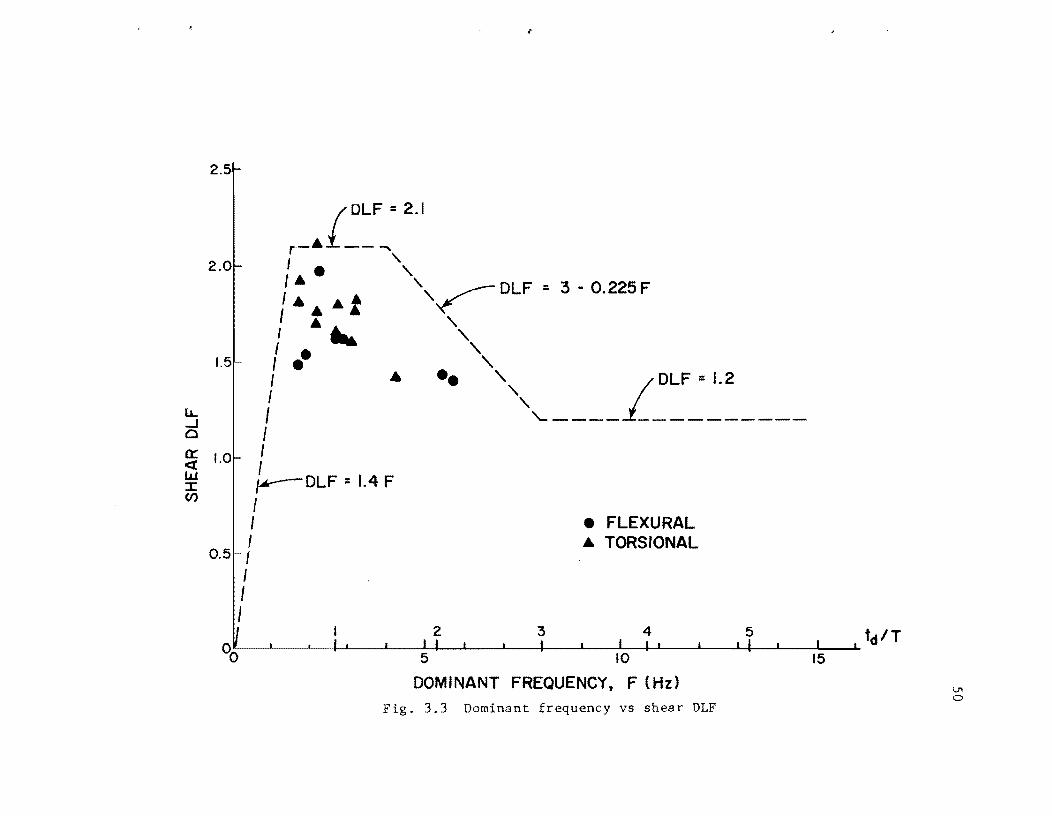
Figure 3.3 shows the shear DLF plotted against the dominant (lowest)
torsional or flexural natural frequency.
The reason for considering the dominant natural frequency
is the lack of definition of the modes. In a torsionally
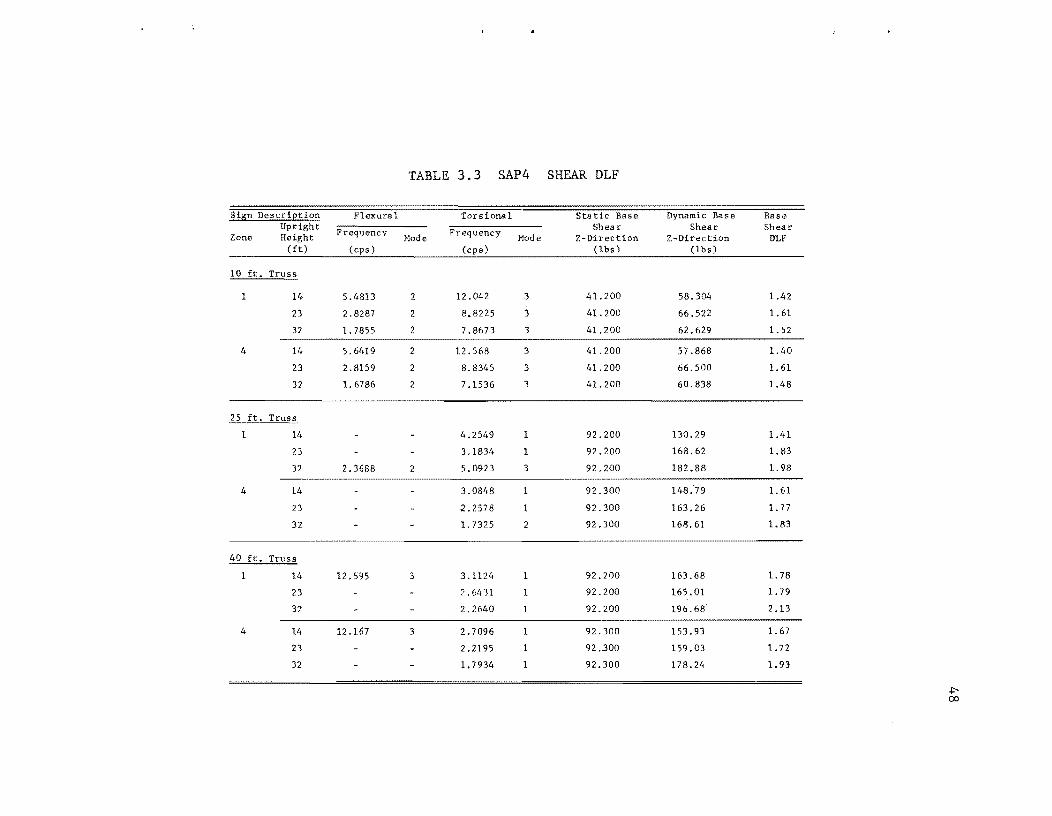
TABLE 3.3 SAP4 SHEAR DLF
Sta tic Base Dynamic Base Base Shear Shear Shear
Mode Z-Direction Z-Direction DLF (cps) (1bs) (1bs)
10 ft. Truss
1 14 5.4813 2 12.042 3 41.200 58.304 1.42
23 2.8287 2 8.8225 3 41.200 66.522 1. 61
37 1. 7855 2 7.8673 3 41. 200 62.629 1. 52
4 14 5.6419 2 12.568 3 41. 200 57.868 1.40
23 2.8159 2 8.8345 3 41.200 66.500 1. 61
32 1. 6786 2 7.1536 3 41. 200 60.838 1.48
25 ft. Truss
14 4.2549 1 92.200 130.29 1.41
23 3.1834 1 92.200 168.62 1.83
32 2.3688 2 5.0923 3 92.200 182.88 1.98
4 14 3.0848 1 92.300 148:79 1. 61
23 2.2578 1 92.300 163.26 1.77
32 1.1325 2 92.300 168.61 1. 83
40 ft. Truss
1 14 12.595 3.1124 1 92.200 163.68 1. 78
23 2.64"31 1 92" 200 165.01 1. 79
32 2.2640 1 92" 200 196.68" 2.13
4 14 12.167 3 2.7096 1 92" 300 153.93 1. 67
23 2.2195 1 92 .300 159.03 1.72
32 1.7934 1 92.300 178.24 1. 93
.p-00
2.5
2.01- •
• 1.51 ••
lL. ..J C
a:: <t ~ 1.0 U>
0.5
00
• • ..
2 3 4
5 10
FLEXURAL FREQUENCY (Hz) Fig. 3.2 Shear DLF vs SAP4 flexural frequency
5
15
td IT
~ \0
LL. ...J o
2.
2.0
1.5
0:: 1.0 <r
"
{
DLF:2.,
r-· ---I \,.
f· • , \,. : ••• t ,~DLF = :3 - O.225F
I ....... ' I" ,
f .- ' 1 ••• " I ',( DLF = I.
2
I ~----1 -----------
I ~DLF: 1.4 F w
:::J: C/)
I f 1
0.51-1 1 I I
00
_ FLEXURAL • TORSIONAL
I 2 3 4 5 t IT ,. II I I' 'I I. d
5 10 15
DOMINANT FREQUENCY, F (Hz) F . 3.3 Dominant frequency vs shear DLF
I,J\
o
51
dominated mode, some degree of flexural motion is always present,
and vice versa. The amount of flexure present in the torsional
modes based on the nodal displacements ranged from 4 to 48 percent.
The small number of points plotted in Fig. 3.2 does not , allow a general curve to be drawn. The points do show a grouping
between flexural frequency values of 2.4 and 3.0 cps. This high
response area is analogous to the curve peak in Fig. 1. 7. The
greatest response occurs when the duration of the triangular pulse,
td
, approximates the sign's natural period, T, of vibration. The
maximum amount of load energy is transferred to the sign during
this phasing. The period of the assumed loading function, t d , is
0.375 seconds, the inverse being 2.67 cycles per second. The maxi
mum DLF is seen to occur in the region of td/T equal to 1, as would
be expec ted.
The high response condition is shown more clearly in
Fig. 3.3, which has more points plotted. All of the points fall
between natural frequency values of 1.5 and 6.0 cps. The majority
of the points fall in a narrow band between 1.67 and 3.33 cps.
The higher DLF then shown in Fig. 1.7 and the scatter in results
is felt to be due to a lack of a clearly defined simple mode shape
of many of the signs.
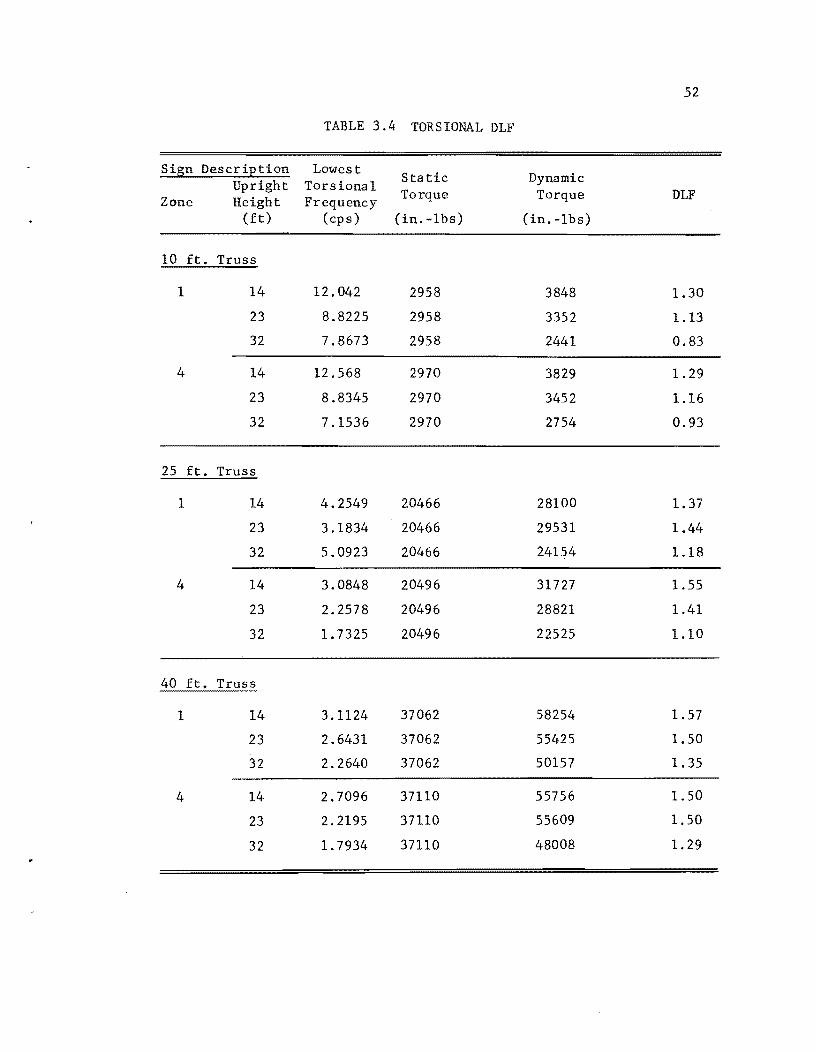
3.3.2 Torsional Dynamic Load Factor. The values of the
static and dynamic torsional moments, the lowest torsional mode
natural frequencies, and the torsional DLF are listed in Table 3.4.
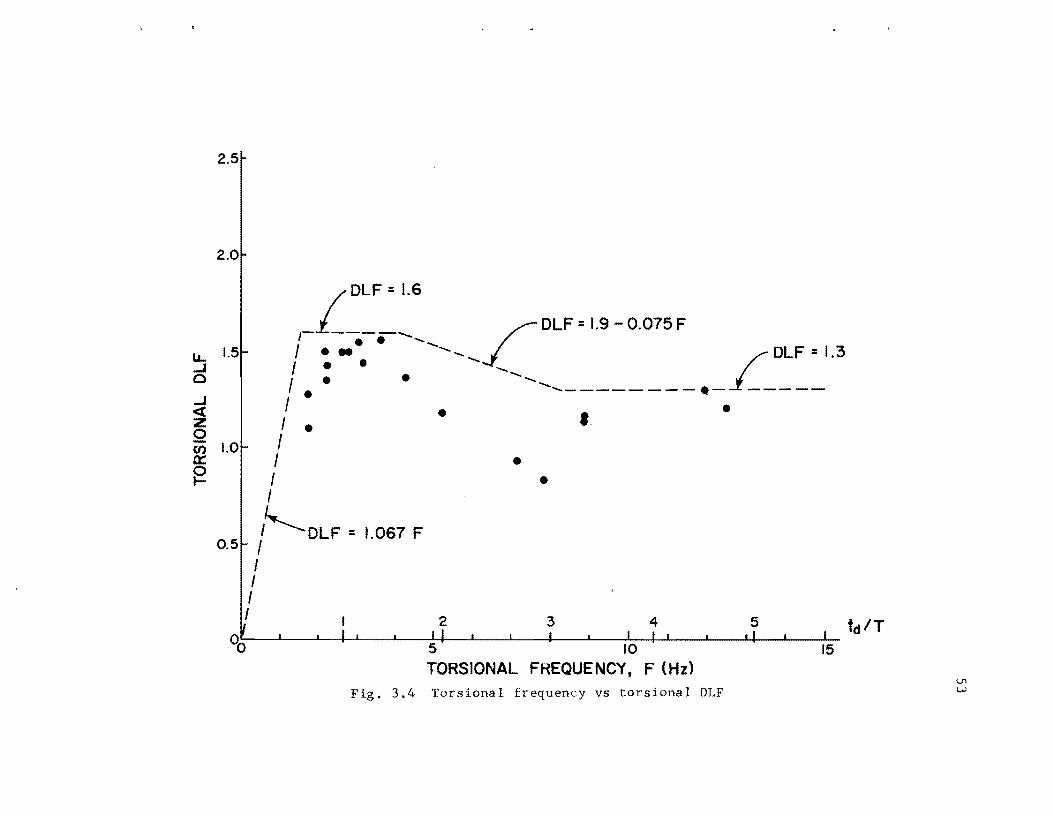
The results are plotted in Fig. 3.4. The behavior corre
sponds to the DLF curve for the triangular pulse load shown in
Fig. 1.7 with the maximum DLF occurring at td/T ~ 1. Two of the
points fall below a load factor of 1.0. These points can be
explained by examining the eigenvalues and eigenvectors for the
10 ft truss/32 ft support signs. Each of these signs has extremely
strong flexural domination of the second mode, caused by a
52
TABLE 3.4 TORS rONAL DLF
Sign DescriEtion Lowest Sta tic Dynamic Upright Torsional
Zone Height Frequency Torque Torque DLF
(ft) (cps) (in.-1bs) (in. -lbs)
10 ft. Truss
1 14 12.042 2958 3848 1.30
23 8.8225 2958 3352 1.13
32 7.8673 2958 2441 0.83
4 14 12.568 2970 3829 1.29
23 8.8345 2970 3452 1.16
32 7.1536 2970 2754 0.93
25 ft. Truss
1 14 4.2549 20466 28100 1. 37
23 3.1834 20466 29531 1.44
32 5.0923 20466 24154 1.18
4 14 3.0848 20496 31727 1.55
23 2.2578 20496 28821 1.41
32 1. 7325 20496 22525 1.10
Truss
1 14 3.1124 37062 58254 1.57
23 2.6431 37062 55425 1.50
32 2.2640 37062 50157 1.35
4 14 2.7096 37110 55756 1.50
23 2.2195 37110 55609 1.50
32 1. 7934 37110 48008 1.29
2.5
2.0
LL 1.5 ..J o ..J « Z o ~ 1.0
~
0.5
L DLF = ~~_ DLF • 1.9 - 0.075 F DLF ~1.3 1- •• ___ .I _ _L_ .. - - . I • • _____ _ • I· •
• • I I • • I • I I I I
I'OLF = 1.067 F I
• •
I I I I 2 3 4 5
OLr---L __ ~-+I~IL-~ __ ~I+I __ ~ __ L-__ +-__ L-__ ~I~I-LI __ -L __ ~'I~~ __ -L-
o 5 10 TORSIONAL FREQUENCY, F (Hz)
Fig. 3.4 Torsional frequency vs torsional DLF
td/T
V1 \,.0.)
54
combination of short truss and long flexible pole. These two signs
are the most flexible (lowest first mode frequency values) of all
the signs studied. Because of the great flexura 1 flexibility and
the short duration of load application, the signs do not have time
to develop significant torsional response. These signs constitute
a special case and it would not be realistic from a design stand
point to utilize DLF values of magnitude less than one.
3.3.3 Dynamic Load Factor Design Curves. Sign response
is directly related to td/T, the ratio between the pulse duration
and each period of vibration of the sign. Those signs with natural
periods close to the duration of the applied pulse will have the
largest dynamic load factors. The exact position of the high
response area found in the DLF graphs is a function of the assumed
pulse duration. The duration of the loading function roughly cor
responds to a 30 ft long vehicle travelling at 50 mph. If the
vehicle is travelling at a different speed, both the loading inten
sity and duration will change. As the duration changes, the fre
quency at which the peak DLF occurs will also change. This fact
makes it difficult to draw a curve through the points in either
Fig. 3.3 or Fig. 3.4 that will be representative for the range of
vehicle speeds expected in actual traffic. Some inaccuracy in
the natural frequencies from SAP4 can also be expected.
A blocking or banding approach using the curve shown in
Fig. 1.7 as a model was used to account for the variation in vehicle
speeds. The dashed lines in Figs. 3.3 and 3.4 show the recommended
va lues of DLF for specified ranges of sign na tura1 frequency. A
constant DLF of 2.1 for base shear and 1.6 for torsional base
moment was used for frequencies of 1.5 to 4 Hz. This corresponds
to a range of td/T of 0.56 to 1.50. A linear variation of DLF
with frequency was used between 0 and 1.5 Hz and between 4 and 8 Hz
for both forces. The DLF equations for these regions are given in
Figs. 3.3 and 3.4. These functions were selected to give the
55
necessary DLF of zero for td/T equal to zero and match a constant
DLF for td/T greater than 3 similar to Fig. 1.7. The DLF for both
forces is constant for td/T greater than 3 or 8 Hz. The torsional
DLF is 1.3 for this region. The shear DLF is a constant 1.2. The
actual DLF would be expected to vary between a value of 1 and these
constant values. This cyclic variation of DLF with frequency was
neglected in this region.
3.4 Estimating the Natural Frequency
In the previous sections the DLF was related to values of
model natural frequency. The natural frequencies were computed by
SAP4. It is not convenient to use a computer program for most
design situations. Consequently, simpler closed form means were
developed to estimate a sign's natural frequency.
The simplest means of estimating natural frequency is by a
single degree of freedom (SDOF)model. A SDOF model assumes dis
placements are possible in only one direction. Actual sign
response is a complex combination of displacements in many direc
tions, but the three motions.shown in Fig. 3.1 dominate. Simple
procedures for estimating the frequency of each motion will now be
discussed.
3.4.1 Torsional Natural Frequency Estimate. Figure 3.5
was used in the derivation of the torsion model. The truss was
assumed rigid with rigid body rotations occurring about the pole
centerline. Equation 3.1 gives the relationship between torque
and rotation for a prismatic circular section.
e = T L (3.1)
J G
where e = total rotation in radians
T = torque of twisting moment
L = member length

x
I
Ii: w Q
~ ~ 0:: l-
N .......
+ In
..J
UNIFORM ROTATION OF POLE ASSUMED
LT
Fig. 3.5 Torsional frequency model
Y (t )
cp (X) = x Ls I cpl(X) = Ls
cp"<X) = 0
2 I [cf.>I<X)] = L~
V1 (j\

J = polar moment of inertia of gross section
G = shear modulus of elasticity
The stiffness JG is defined as the moment required for a unit
rotation per unit length.
where
The generalized spring stiffness is defined as: [1]
K* = GJ r [¢'(x)]2 dx 'J-
K* = system generalized stiffness
¢(x) = shape function of the assumed displacements
¢'(x) = the first derivative of the shape function
57
(3.2)
Since we have assumed uniform rotation and a rigid truss,
the following shape function can be used:
where
¢(x) x L
s
¢' (x) = 1 L
s
x = vertical distance from pole base
L = support height to truss centerline s
(3.3)
Substituting into Eq. (3.2), we get expression 3.4 for the general
ized stiffness.
JLS_ 12 dx K* = GJ
o L s
GJ L
s (3.4)
The generalized mass of the system is given by expression 3.5,
neglecting any torsional inertia effects of the pole mass.
where M* generalized system mass
I = mass moment of inertia about the upright = o ~ = distributed truss mass
LT truss length
(3.5)

58
This expression reduces to expression 3.6 upon substitution of the
assumed unit rotation at the top of the pole.
M* = (3.6)
The undamped torsional natural frequency can now be obtained by
substituting into Eq. (3.7)
w =
f
1** M*
w 2n Hz
(rad/sec) (3.7)
(3.8)
Table 3.5 gives a comparison of the estimated SDOF model
frequencies corrected as given below and the torsional frequencies
from SAP4. The estimated frequencies from Eq. (3.8) divided by the
SAP4 results have been plotted in Fig. 3.6. The ratio of truss
length to support height is plotted on the abscissa in the figure.
The two curves fitted to the data points suggest a correction
coefficient for estimating the natural frequency of the model. The
point where a vertical line from the abscissa intersects the curve
is used to determine the correction coefficient plotted on the
ordinate. The corrected SDOF model frequency is obtained divid
ing by the ordinate ratio. Corrected torsional frequency values
are compared to the actual values in Table 3.5. The maximum error
is seen to be less than 6 percent.
The discontinuity in the curve in the region of LT/Ls
equalling 0.8 is caused by the shifting of the dominant natural
frequency from a flexural mode to a torsional mode.
3.4.2 Flexural Natural Frequency Estimate. The assumed
sign displacements for the derivation of the flexural model fre
quency are shown in Fig. 3.7. The truss is assumed to be made up
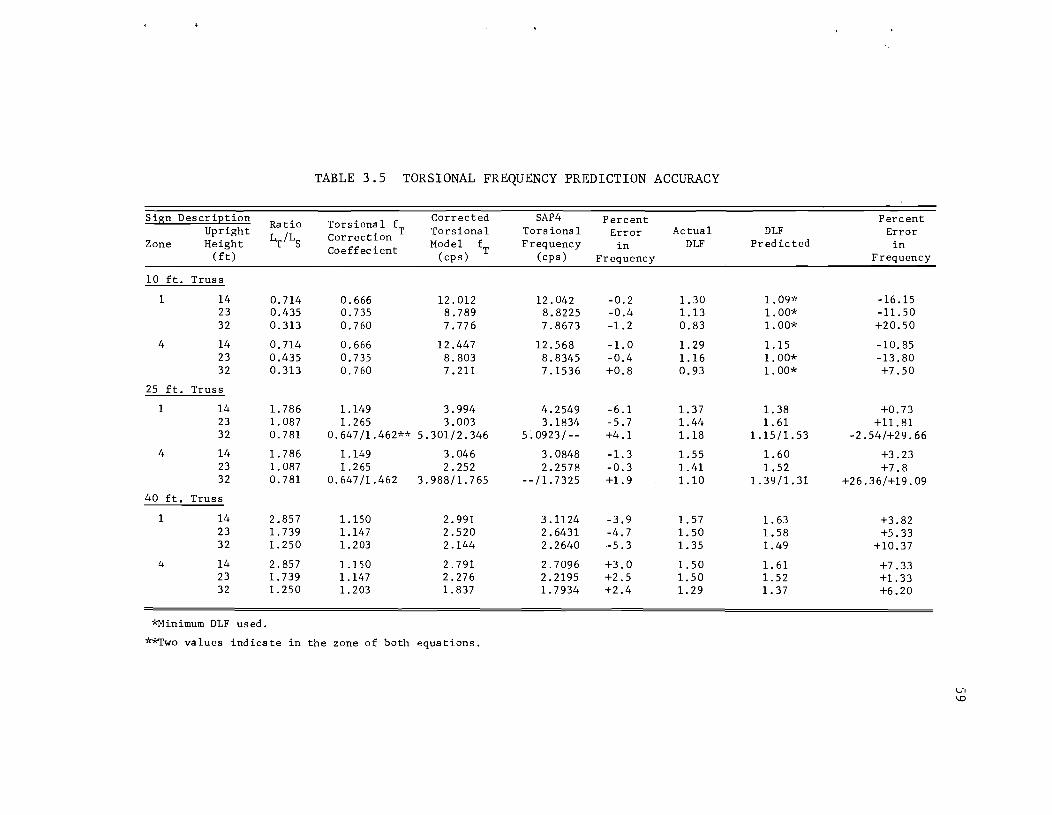
TABLE 3.5 TORSIONAL FREQUENCY PREDICTION ACCURACY
Sign Description Torsional fT
Corrected SAP4 Percent Percent Ratio Upright L.r /LS
Torsional Torsional Error Actual DLF Error Correction Zone Height
Coeffec ient Model fT Frequency in DLF Predicted in (ft) (cps) (cps) Frequency Frequency
10 ft. Truss
1 14 0.714 0.666 12.012 12.042 -0.2 1.30 1.09'-' -16.15 23 0.435 0.735 8.789 8.8225 -0.4 1.13 1.00* -11.50 32 0.313 0.760 7.776 7.8673 -1. 2 0.83 1.00* +20.50
4 14 0.714 0.666 12.447 12.568 -1. 0 1.29 1.15 -10.85 23 0.435 0.735 8.803 8.8345 -0.4 1.16 1.00* -13.80 32 0.313 0.760 7.211 7.1536 +0.8 0.93 1.00* +7.50
25 ft. Truss
1 14 1. 786 1.149 3.994 4.2549 -6.1 1. 37 1. 38 +0.73 23 1. 087 1. 265 3.003 3.1834 -5.7 1.44 1.61 +11.81 32 0.781 0.647/1.462** 5.301/2.346 5.0923/-- +4.1 1.18 1.15/1.53 -2.54/+29.66
4 14 1.786 1.149 3.046 3.0848 -1. 3 1.55 1. 60 +3.23 23 1.087 1.265 2.252 2.2578 -0.3 1.41 1.52 +7.8 32 0.781 0.647/1.462 3.988/1. 765 --/1.7325 +1.9 1.10 1.39/1.31 +26.36/+19.09
40 ft. Truss
1 14 2.857 1.150 2.991 3.1124 -3.9 1. 57 1. 63 +3.82 23 1. 739 1.147 2.520 2.6431 -4.7 1.50 1.58 +5.33 32 1. 250 1.203 2.144 2.2640 -5.3 1.35 1.49 +10.37
4 14 2.857 1.150 2.791 2.7096 +3.0 1.50 1. 61 +7.33 23 1. 739 1.147 2.276 2.2195 +2.5 1.50 1. 52 +1.33 32 1. 250 1.203 1.837 1. 7934 +2.4 1. 29 1.37 +6.20
*Minimum DLF used.
**Two values indicate in the zone of both equations.
\Jl \0
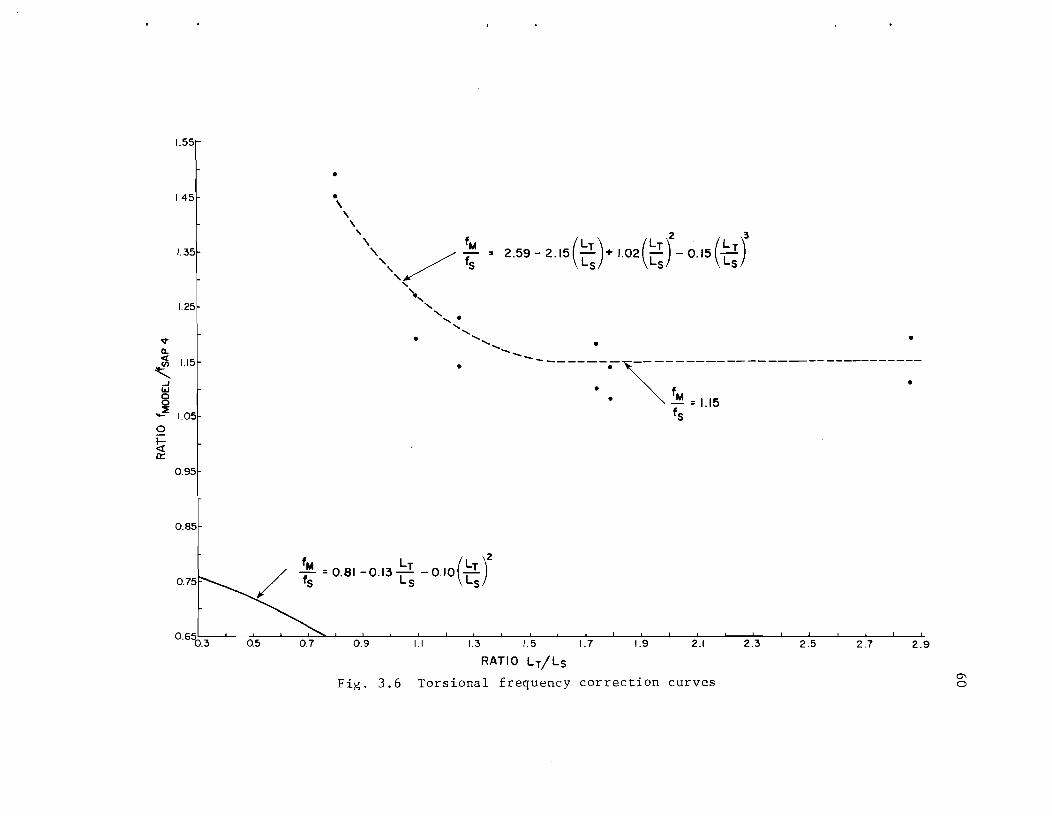
.,. Q. c:t
~ ..J W C 0
1.55
1.45
1.35
1.25
1.15
• • \ ,
" fM _ \ --"" / f5
"
2 3
2.59 -2.15(~:)+ I.02(~:) - O.15(~:)
\', ......
'-,. . """"""" ~------...... "" --
• • • •
..... ~ 1.0.5
-------~ • 1M .1.15
• f5 0 I-<f a:::
0..95
0..85
..!!!. _ L 2
/
f - O.81-0.13~ _O.IO(Lr) 5 L5 L 5
0..65' , , ......, ,"',", 0..3 0.5 0..7 0..9 1.1 1.3 1.5 1.7 1.9 2.1 2.3 2.5 2.7 2.9
RATIO Lr/Ls Fig. 3.6 Torsional frequency correction curves
Q"\ o
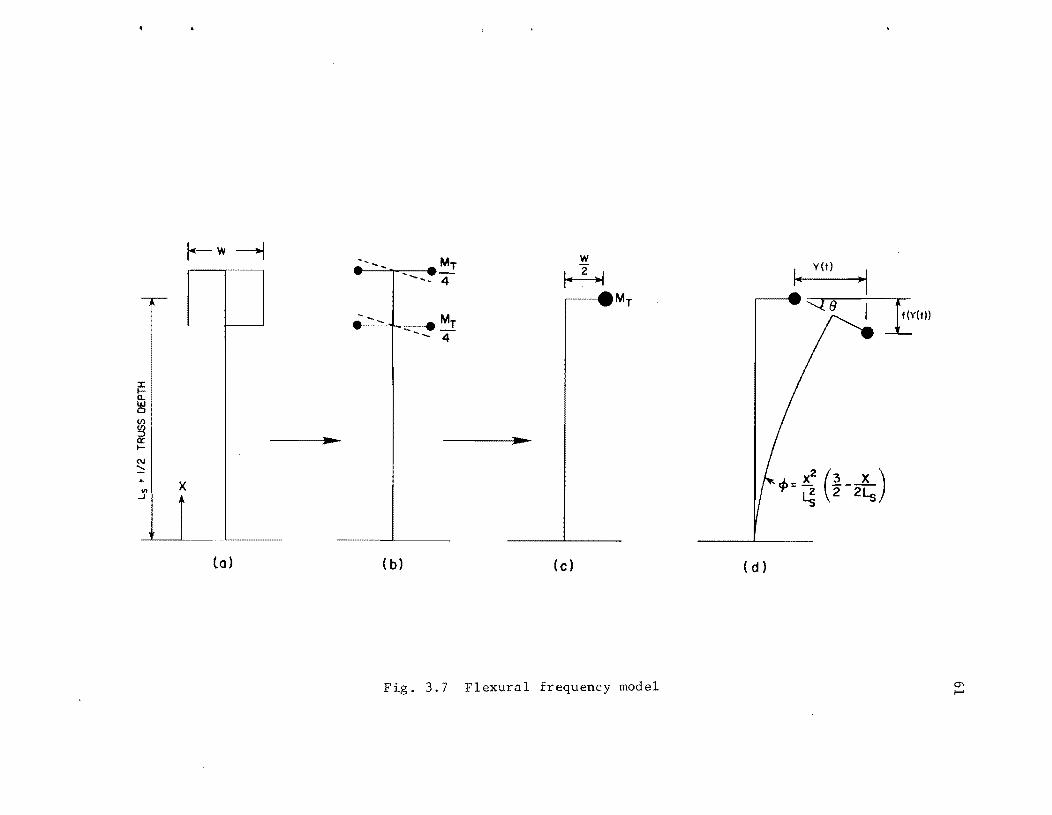
I--w-+j
--r-
J: l-ll.
~ (j')
~I l-
... N ::::: "'",1 X .J
tal
w
~ ~~ M
• ." • T '- 4
----Mr ........ ~ _ .~r - 4
(b) (c)
Fig. 3.7 Flexural frequency model
Ie YO) "1 ,----1 •• :--.--:::---
~= ~ (~-2~)
( d)
~ t-'

62
of four equal masses lumped at the corners of the truss, as shown
in Fig. 3.7(b). Any flexural displacements of the pdle will cause
equal movement in the truss masses; the movement is proportional
to the distance from the pole centerline to the mass. Figure 3.7(c)
is equivalent to the Fig. 3.7(b) and is easier to interpret. The
assumed shape function for displacements along the pole length is
given by Eq. (3.9) [1].
cb(x) 2
x
L 2 s
(3.9)
The displacement angle theta of the horizontal arm is given by
Eq. (3.10)
e ¢, (L ) = s
3 I))
4 1 s
(3.10)
For small displacements, the angle in radians is approximately
equal to its sine and tangent. The generalized stiffness is given
in expression 3.11 which includes a term for the decreased stiffness
due to axial load.
K* J1
EI[r1II/(x)]2 dx - S N[cb'(x)]2 L
dx (3. ll)
= K* - K* 1 2
where E = modulus of elasticity
I the pole flexural moment of inertia
N = axial load
C/>"(x) = second derivative of the shape function
Substituting the shape function leads to the expressions:

K* = 1
K* 2
=
K* =
/,~ 9 l8X) + EI J -o L 4 L 5
s s
L [ 2 3
-N S s 9x 4 l8x + 5
o L 2L s s
- 5.25 N L
s
3EI
L 3 s
N 5.25 L
s
9x2
- dx L 6
s
9x4
] 4LS6
dx
The expression for the generalized mass is given by
Eq. (3.13), for the support and truss mass contributions.
M* =
= rLs 2 m [M(x)] dx .J s
o
63
(3.12)
(3.13)
In the second integral term of Eq. (3.13) the generalized mass
term for the truss is shown to come from horizontal and vertical
displacement components.
Substitution of the variables leads to:
(3.14)
The natural circular frequency is then:
rad/sec (3.15)
64
The natural frequency values from Eq. (3.15) are listed
along with the SAP4 values in Table 3.6. The values are plotted
to obtain the flexural correction factor in Fig. 3.8. Flexure is
the dominant natural frequency only for the shorter truss lengths.
For ratios of truss 1ength-to-support length greater than
0.9, the flexural natural frequency was not one of the first three
modes. In all cases, the correction factors apply only to the
range of natural frequencies shown in the curves.
3.4.3 Rocking Natural Frequency Estimate. The derivation
of the rocking natural frequency is similar to that of the flexural
natural frequency. Figure 3.9 shows the geometrical assumptions
made for the rocking model.
The expression for the generalized stiffness is identical
to that from the flexural model.
K* N 5.25 L
s
The shape function for upright displacements used in the
flexural model derivation was used for the generalized mass
expression. The two terms shown correspond to support and truss
contributions.
M* = M~ + ~
M* s 2
m [ibex)] dx s
o
_ rLs [9X 4 -mgl --
o 4L 4 s
0.236 m L s s
M:f Mf1 + ~2
3x5
2L 5 s
+ 4::6] dx (3.16)
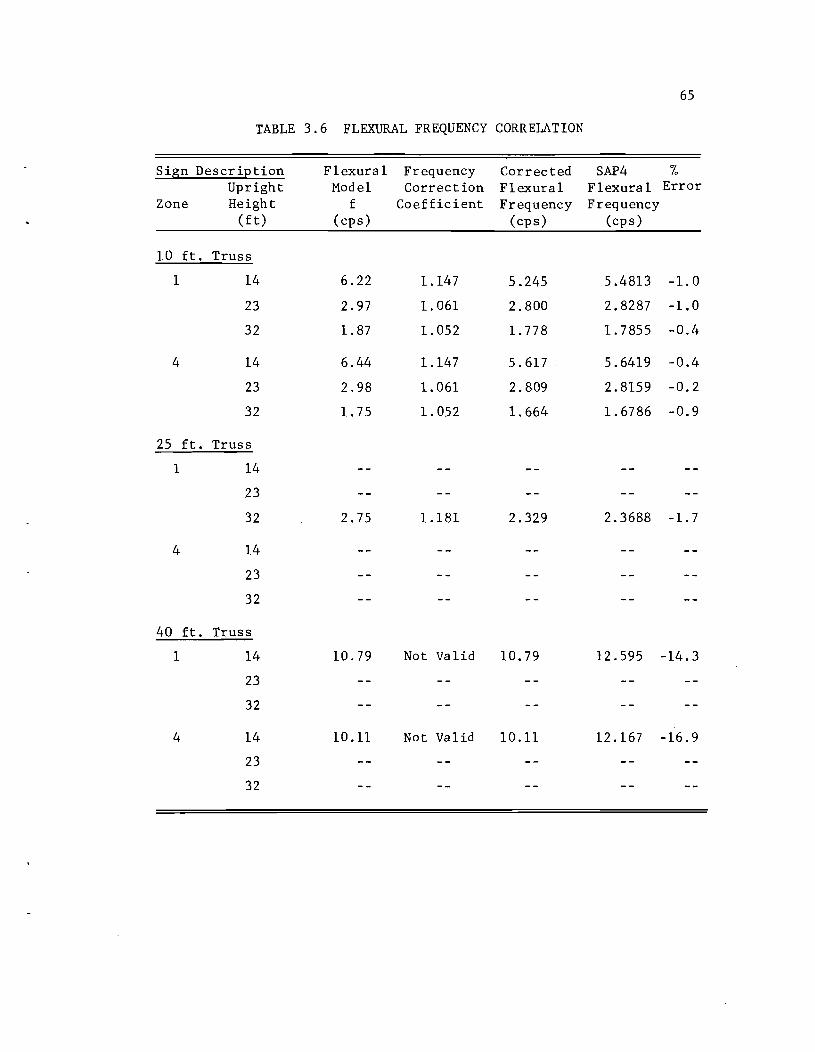
65
TABLE 3.6 FLEXURAL FREQUENCY CORRELATION
Sign DescriEtion Flexural Frequency Corrected SAP4 % Upright Model Correction Flexural Flexural Error
Zone Height f Coefficient Frequency Frequency (ft) (cps) (cps) (cps)
10 ft. Truss
1 14 6.22 1.147 5.245 5.4813 -1. 0
23 2.97 1.061 2.800 2.8287 -1. 0
32 1. 87 1. 052 1.778 1. 7855 -0.4
4 14 6.44 1.147 5.617 5.6419 -0.4
23 2.98 1.061 2.8.09 2.8159 -0.2
32 1. 75 1.052 1.664 1. 6786 -0.9
25 ft. Truss
1 14
23
32 2.75 1.181 2.329 2.3688 -1. 7
4 14
23
32
40 ft. Truss
1 14 10.79 Not Valid 10.79 12.595 -14.3
23
32
4 14 10.11 Not Valid 10.11 12.167 -16.9
23
32
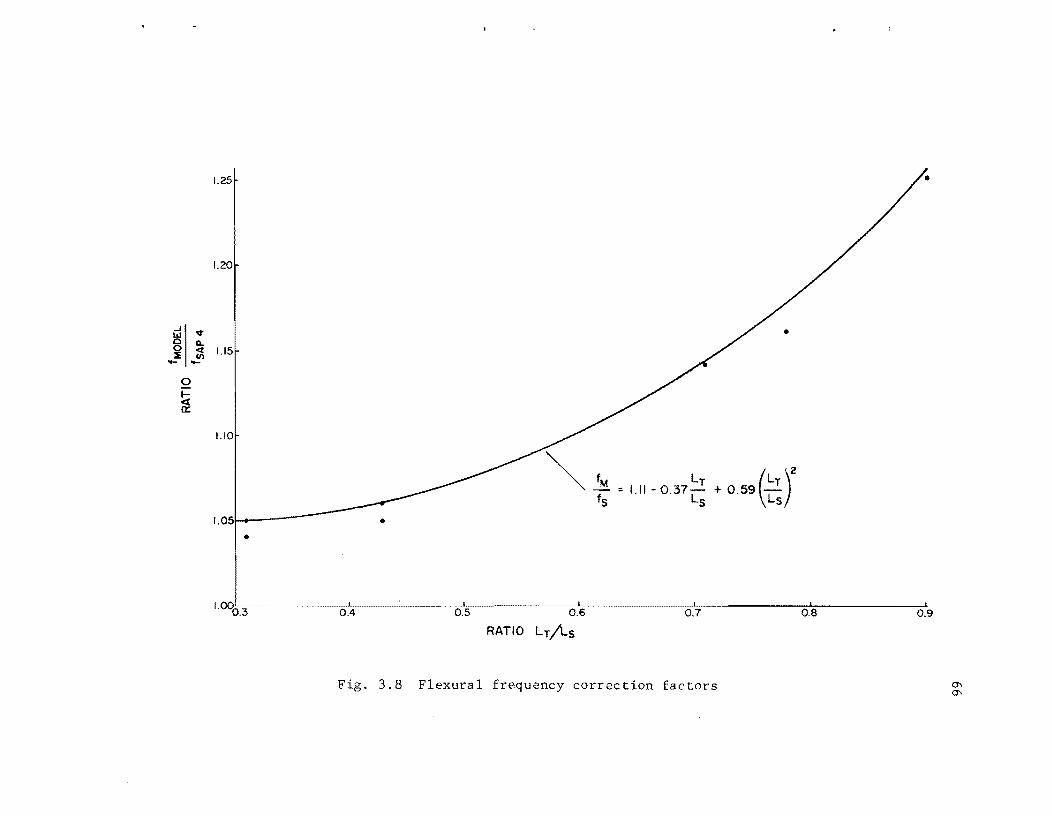
~I v o Q.. o <t ::E Ul - -
o ..... ~
1.25
1.20
1.15
1.10
I.05L...--
• •
0.5 0.6
RATIO Lr/Ls
•
~ )
2 fM Lr Lr - :: 1.11- 0.37- + 0.59 -~ LS LS
0.7
F . 3.8 Flexural frequency correction factors
0.8 0.9
0-0-

67
------xlJ I -+-rt')IN ->-~ -)( N IN en -X...J
"9-II II -)( )( -- ::J
~ (!)
"CI 0 8 :>-, u s:: (!)
;:l C" (!) ...
...... 0() s:: x .....
.!G u 0
0:::
0\
C""l
0() ..... ~
~
LI·L-_______________ ~~ ~------------------~.~I ~
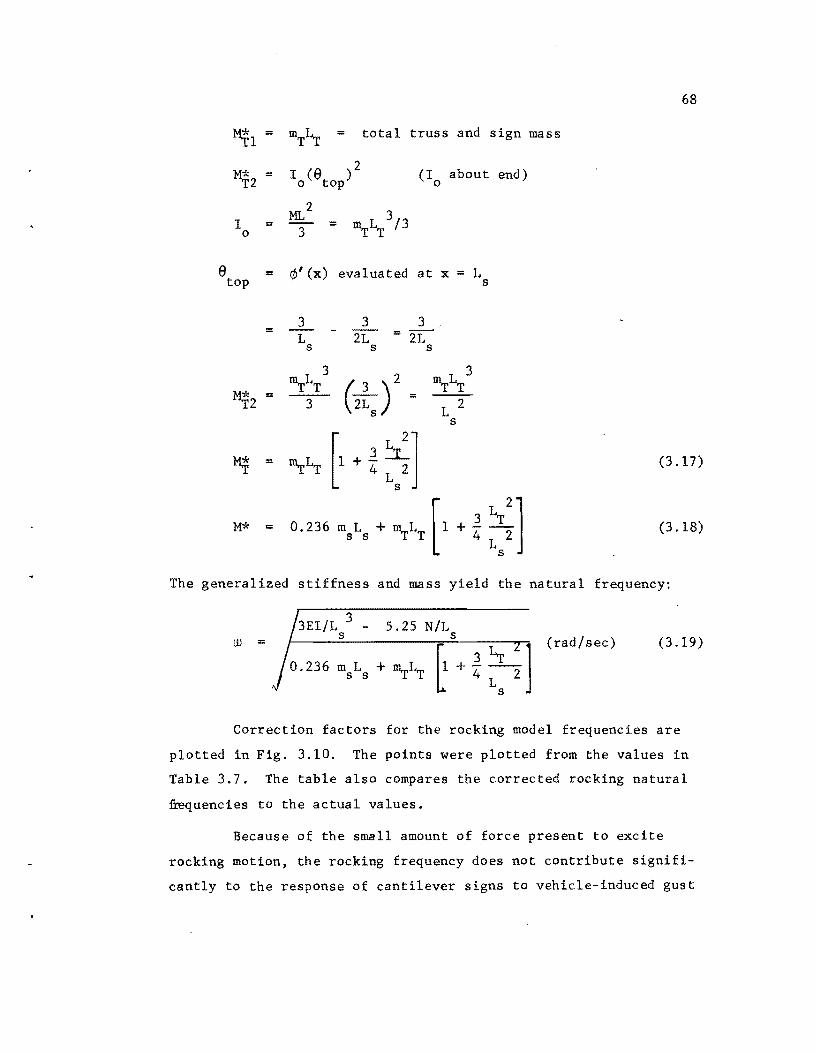
68
Mfl = mTLT
= total truss and sign mass
Mf2 = I (9 )2 (I about end) o top 0
ML2 3 I = = nl.rLT 13 0 3
9 = ¢'(x) evaluated at x = L top s
3 3 = = L 2L s s
3
(2~J2 3
M:i:2 nl.rLT mTLT = = 3 L 2
s
M:i: = 3~ [ 2] nl.rLT 1 + 4" Ls2
(3.17)
[ 2] M* 3 LT
= 0.236 msLs + nl.rLT 1 + 4' Ls2 (3.18)
The generalized stiffness and mass yield the natural frequency:
W = 3E1/L 3 _ 5.25 NIL
s 5 (rad/sec) (3.19)
Correction factors for the rocking model frequencies are
plotted in Fig. 3.10. The points were plotted from the values in
Table 3.7. The table also compares the corrected rocking natural
frequencies to the actual values.
Because of the sn~ll amount of force present to excite
rocking motion, the rocking frequency does not contribute signifi
cantly to the response of cantilever signs to vehicle-induced gust
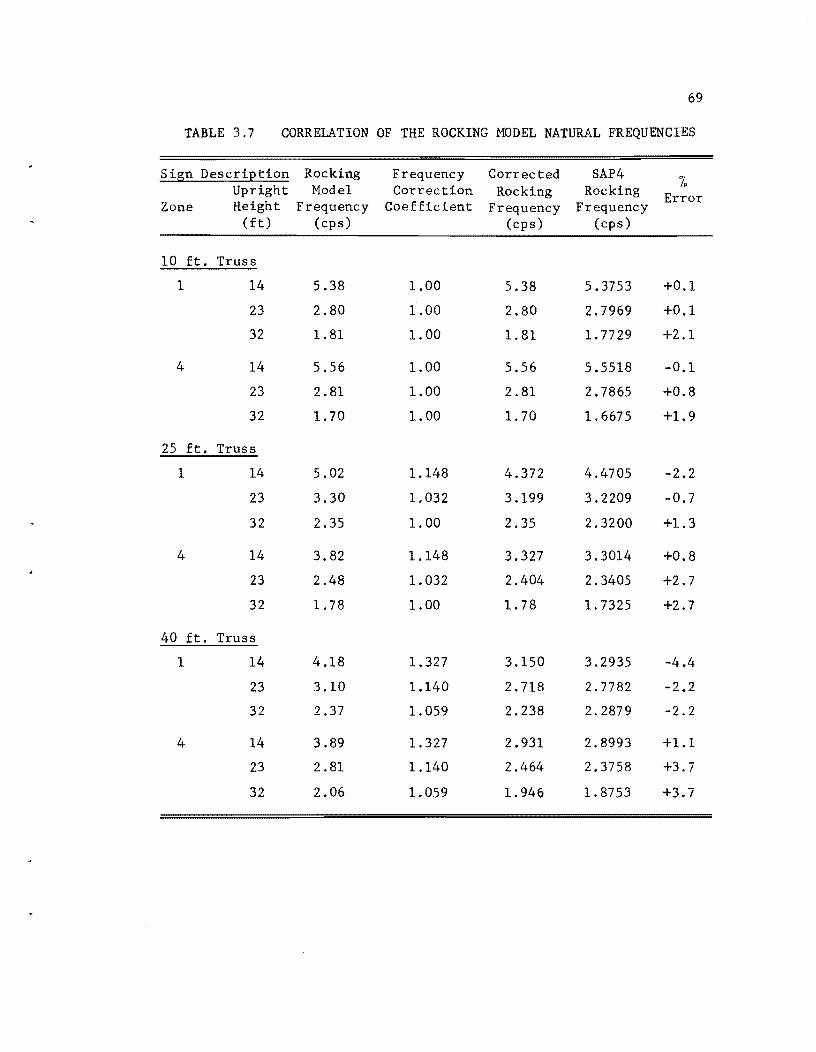
69
TABLE 3.7 CORRELATION OF THE ROCKING MODEL NATURAL FREQUENCIES
Sign DescriEtion Rocking Frequency Corrected SAP4 /, Upright Model Correction Rocking Rocking Error
Zone Height Frequency Coefficient Frequency Frequency (ft) (cps) (cps) (cps)
10 ft. Truss
1 14 5.38 1.00 5.38 5.3753 +0.1
23 2.80 1.00 2.80 2.7969 +0.1
32 1.81 1.00 1.81 1.7729 +2.1
4 14 5.56 1.00 5.56 5.5518 -0.1
23 2.81 1.00 2.81 2.7865 +0.8
32 1. 70 1.00 1. 70 1. 6675 +1.9
25 ft. Truss
1 14 5.02 1.148 4.372 4.4705 -2.2
23 3.30 1.032 3.199 3.2209 -0.7
32 2.35 1. 00 2.35 2.3200 +1.3
4 14 3.82 1.148 3.327 3.3014 +0.8
23 2.48 1.032 2.404 2.3405 +2.7
32 1. 78 1.00 1. 78 1.7325 +2.7
40 ft. Truss
1 14 4.18 1.327 3.150 3.2935 -4.4
23 3.10 1.140 2.718 2.7782 -2.2
32 2.37 1.059 2.238 2.2879 -2.2
4 14 3.89 1.327 2.931 2.8993 +1.1
23 2.81 1.140 2.464 2.3758 +3.7
32 2.06 1.059 1.946 1. 8753 +3.7
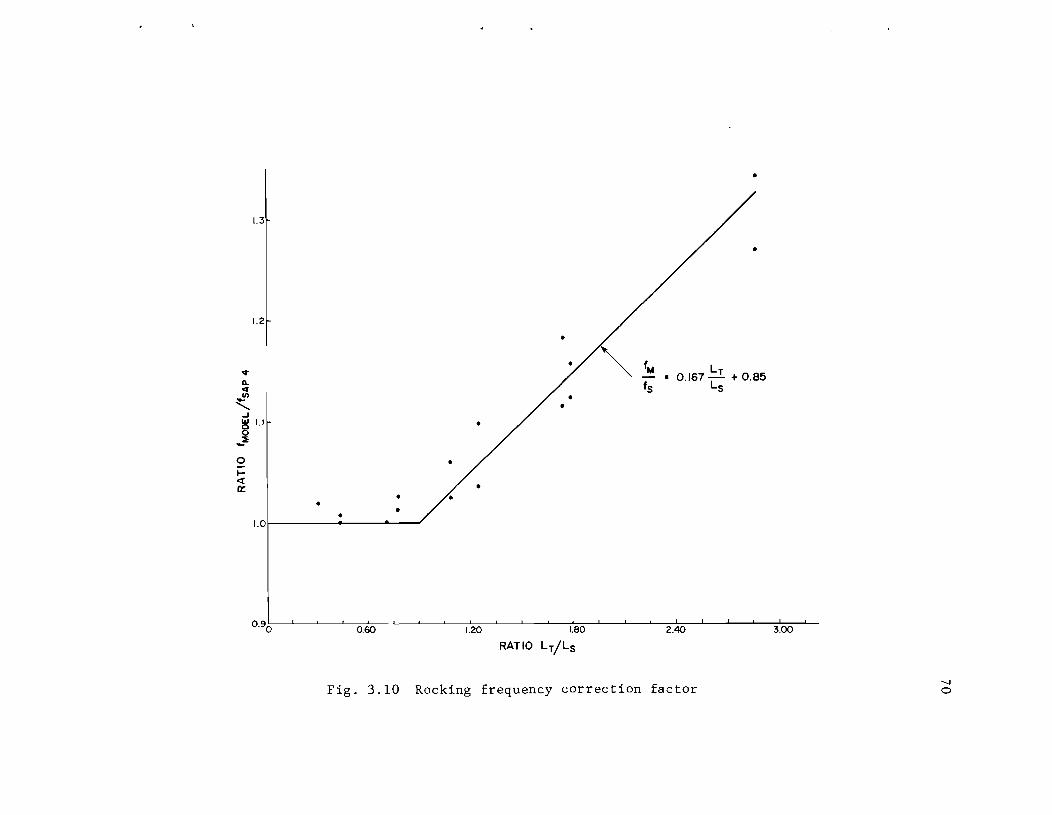
..,. IL cr
< ~ IIJ 0 0
-~ 0 l-« a:
•
1.3
•
1.2 I •
~f" L
fS 0.167 -2- + 0.85
s
•
•
/. • • • • •
1.0
09' I I ! , ,
. 0 0.60 1.20 1.80 2.40 3.00
RATIO LT/LS
Fig. 3.10 Rocking frequency correction factor """-l o
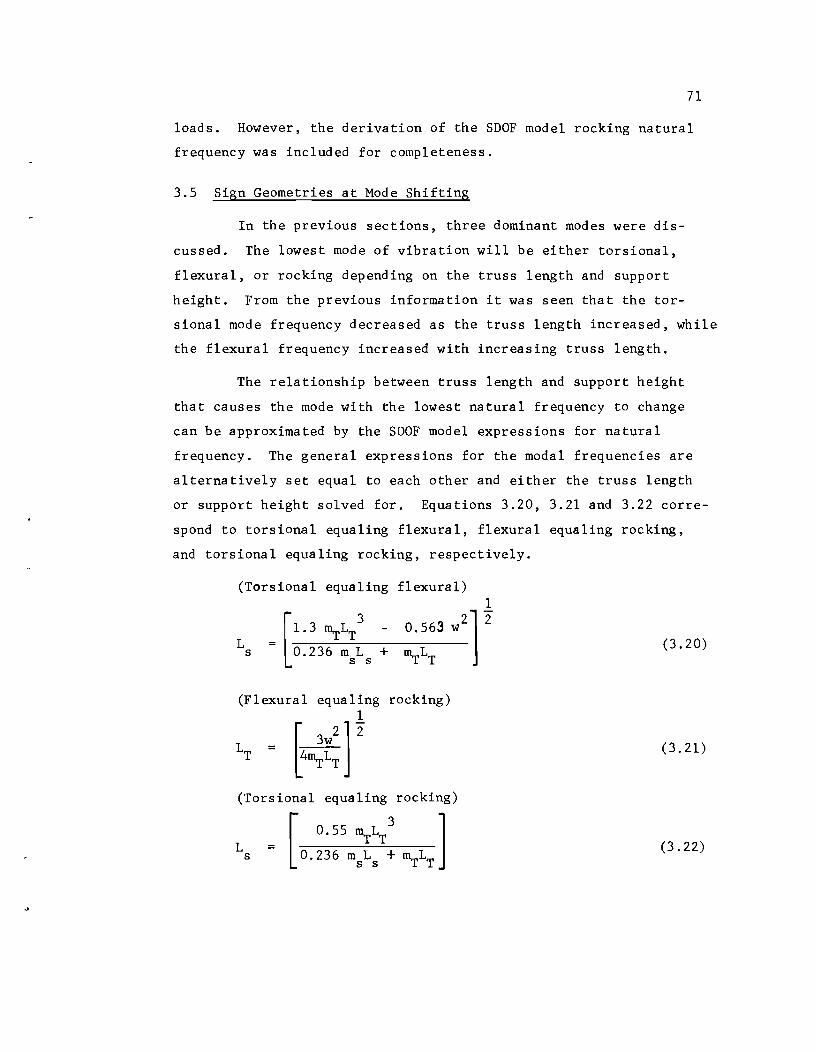
71
loads. However, the derivation of the SDOF model rocking natural
frequency was included for completeness.
3.5 Sign Geometries at Mode Shifting
In the previous sections, three dominant modes were dis
cussed. The lowest mode of vibration will be either torsional,
flexural, or rocking depending on the truss length and support
height. From the previous information it was seen that the tor
sional mode frequency decreased as the truss length increased, while
the flexural frequency increased with increasing truss length.
The relationship between truss length and support height
that causes the mode with the lowest natural frequency to change
can be approximated by the SDOF model expressions for natural
frequency. The general expressions for the modal frequencies are
alternatively set equal to each other and either the truss length
or support height solved for. Equations 3.20, 3.21 and 3.22 corre
spond to torsional equaling flexural, flexural equaling rocking,
and torsional equaling rocking, respectively.
(Torsional equaling flexural)
L s [
1.3 ~LT3 -
0.236 m L + s s
(Flexural equaling rocking)
LT = [4~i:] ~ (Torsional equaling rocking)
= [ o. 55 ~LT 3 ]
Ls 0.236 msLs + ~LT
(3.20)
(3.21)
(3.22)
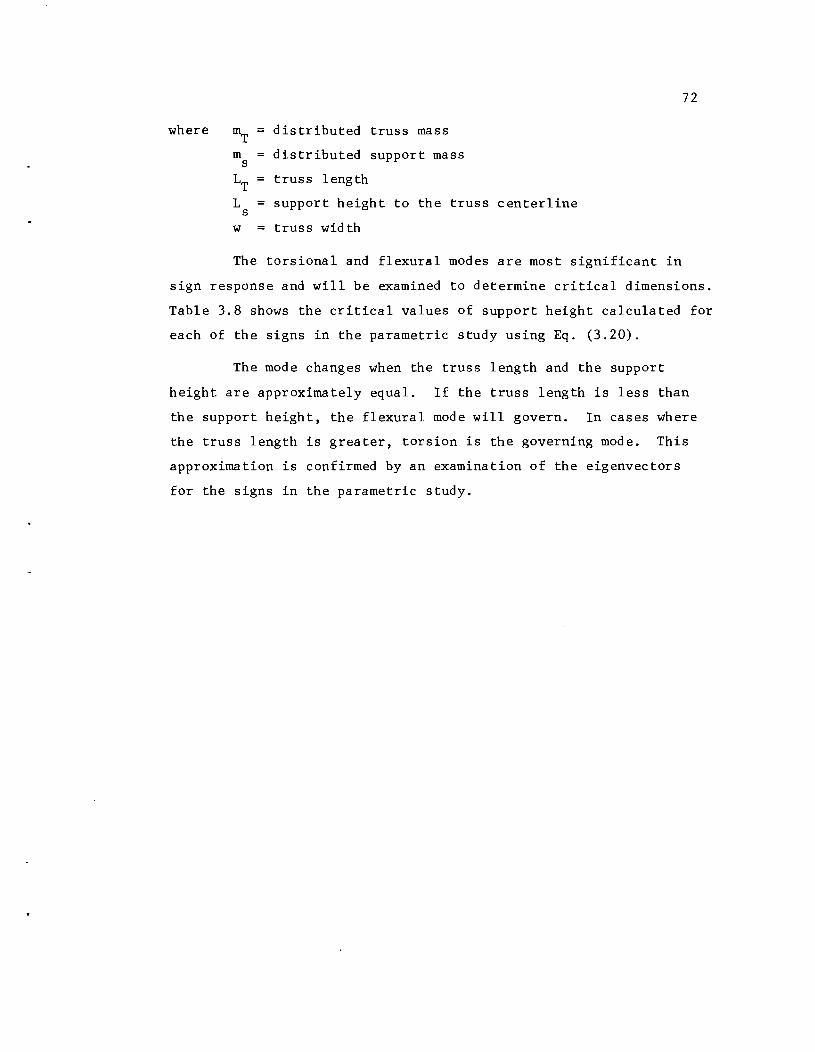
72
where ~ = distributed truss mass
m distributed support mass s
LT truss length
L = support height to the truss centerline s
w = truss wid th
The torsional and flexural modes are most significant in
sign response and will be examined to determine critical dimensions.
Table 3.8 shows the critical values of support height calculated for
each of the signs in the parametric study using Eq. (3.20).
The mode changes when the truss length and the support
height are approximately equal. If the truss length is less than
the support height, the flexural mode will govern. In cases where
the truss length is greater, torsion is the governing mode. This
approximation is confirmed by an examination of the eigenvectors
for the signs in the parametric study.

TABLE 3.8 TORS IONAL--FLEXURAL MODE SHIFT SIGN GEOMETRIES
Sign Description Upright
Zone Height (ft)
10 ft. Truss
1
4
14
23
32
14
23
32
25 ft. Truss
1
4
14
23
32
14
23
32
40 ft. Truss
1
4
14
23
32
14
23
32
Shift Value, LS (T - f) (ft)
10.9
10.6
10.2
10.9
10.6
10.3
27.6
26.8
25.8
27.7
27.1
26.3
44.3
43.0
41. 6
44.4
43.4
42.6
73
C HAP T E R 4
DESIGN OF ANCHOR BOLTS FOR FATIGUE
4.1 Static Design Load
The parametric study of cantilever highway signs presented
in the previous chapter was made using a loading function developed
in Ref. 2. The loading function reproduced analytically the
response of Sign No. 1 to its largest recorded vehicle loading. A
means of estimating natural modal frequencies. Torsional and
shear dynamic load fac tors were also developed. The dynamic load
factors were calculated from static and dynamic application of the
loading function.
A peak pressure of 1.23 psf was applied to the sign face
in the parametric study. This value will be examined to see how
it compares to response magnitudes measured in the field.
A histogram of the frequency of occurrence of the ratio of
experimental chord 4 forces to the analytical chord 4 force was
made using 76 events recorded at Signs No. 1 and 3. The histogram
is shown in Fig. 4.1. The majority of the experimental events pro
duced forces less than 50 percent of the force produced analytically
using the loading function. The very small responses, ratios less
than 0.1, were not included in the 76 events studied.
Using the statistics for a Gaussian distribution, one-sided
tolerance limits were calculated for various combinations of
exceedence and confidence levels. It was found that there is a
99 percent probability that 99 percent of the loading events produce
ratios less than 0.85. Only three measured events exceeded this
level. A peak pressure of 1.23 psf is, consequently, a conservative
74
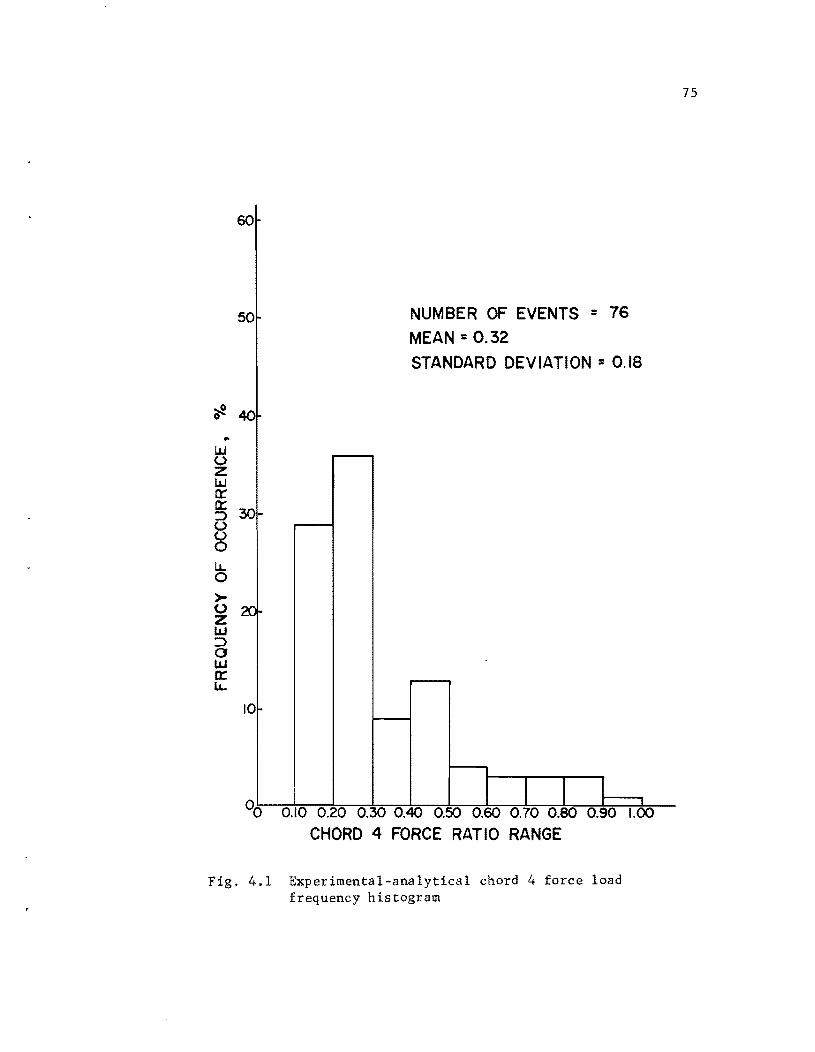
60
50 NUMBER OF EVENTS = 76 MEAN = 0.32 STANDARD DEVIATION = 0.18
I I I 00 0.10 0.20 0.30 0.40 0.50 0.60 0.70 0.80 0.90 1.00
CHORD 4 FORCE RATIO RANGE
Fig. 4.1 Experimental-analytical chord 4 force load frequency histogram
75
value. The frequency and magnitude of very large loading events
were difficult to determine for Sign No. 3 because of the short
recording time. It is unlikely that a longer observation period
would change the overall distribution of the loading.
In the design procedure, a pressure will be statically
applied to the sign face and base forces calculated. The
pressure of 1.23 psf was statistically shown to be a reasonably
conservative value. For convenience, a design pressure of
1.25 psf is recommended.
4.2 Fatigue Stress Cycles for Design
76
The fatigue life is a function of the stress range and
number of loading cycles over the design life. The higher the
applied stress range the lower the number of cycles that will cause
failure. Fatigue damage occurs when the stress range is above a
crack growth threshold. The greater the stress is above this
threshold, the greater the damage. No damage is believed to be
caused by stresses below the crack threshold. Miner's theory sug
gests that damage is accumulated in a linear fashion, as verified
by tests [6]. Failure occurs when the accumulated damage reaches
the critical point for the member in question.
The number of response cycles from a given loading event
is a function of the load magnitude and the damping of the structure.
The damping ratios measured for cantilever highway sign structures
were very low, on the order of 0.7 percent of critical damping. A
large load may produce many stress cycles above the threshold value
for damping this low.
The larger number of stress cycles produced by a single
truck as a function of damping can be examined using Eq. (4.1).
= (4.1)
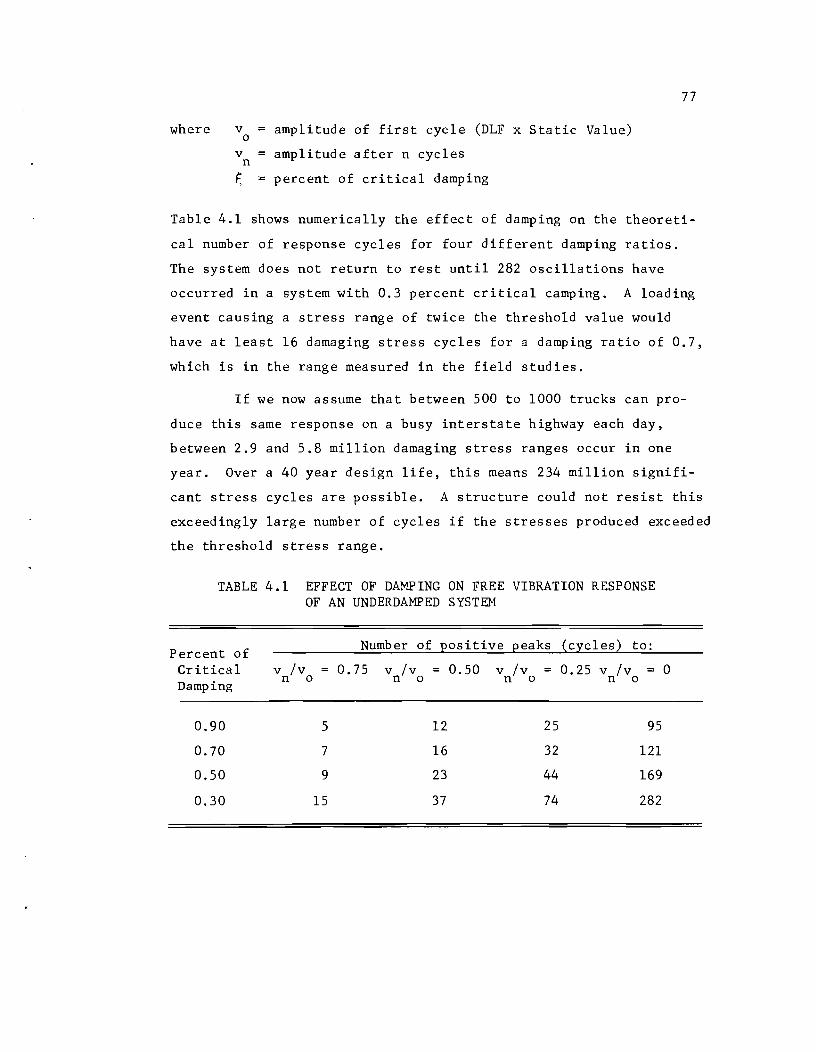
where v = amplitude of first cycle (DLF x Static Value) o
v amplitude after n cycles n
~ = percent of critical damping
77
Table 4.1 shows numerically the effect of damping on the theoreti
cal number of response cycles for four different damping ratios.
The system does not return to rest until 282 oscillations have
occurred in a system with 0.3 percent critical camping. A loading
event causing a stress range of twice the threshold value would
have at least 16 damaging stress cycles for a damping ratio of 0.7,
which is in the range measured in the field studies.
If we now assume that between 500 to 1000 trucks can pro
duce this same response on a busy interstate highway each day,
between 2.9 and 5.8 million damaging stress ranges occur in one
year. Over a 40 year design life, this means 234 million signifi
cant stress cycles are possible. A structure could not resist this
exceedingly large number of cycles if the stresses produced exceeded
the threshold stress range.
TABLE 4.1 EFFECT OF DAMPING ON FREE VIBRATION RESPONSE OF AN UNDERDAMPED SYSTEM
Percent of Critical Damping
0.90
0.70
0.50
0.30
v Iv n 0
5
7
9
15
Number of positive peaks (cycles) to:
0.75 v Iv = 0.50 v Iv = 0.25 v Iv = 0 non 0 n 0
12
16
23
37
25
32
44
74
95
121
169
282

78
4.3 Allowable Flexural Bending Stress
Bolts are subjected to repeated variations and reversals
of stress and should be designed so that the maximum stress range
does not exceed the basic allowable stress as defined in the AASHTO
fatigue specifications. Studies have shown that only the live load
need be considered in fatigue calculations. Live load on highway
signs results mainly from vehicle and ambient gusts.
Studies in Ref. 7 have shown that tightened double-nutted
connections, such as sign anchor bolts, may be considered as a
Category C detail in the AASHTO Specifications. The anchor bolt
can also be considered as a redundant load path structure, since a
single bolt fracture will not lead to collapse in most structures
[6]. AASHTO fatigue specifications prescribe a maximum allowable
stress range of 10 ksi for all Category C details expecting greater
than two million load cycles. The 10 ksi value is the threshold
below which stress cycles produce no fatigue damage. By limiting
the live load anchor bolt flexural stresses to less than the
threshold, the structure would have an infinite fatigue life. The
combination of using an allowable fatigue stress range equal to the
threshold and a static design load that provides an upper bound to
the measured values will provide a design which should not be
susceptible to fatigue, regardless of the number of loading cycles.
4.4 Design Example
The sign structure analyzed in this example is shown in
Fig. 4.2. The sign structure corresponds to Texas standard 40 ft.
truss Zone 4 design. The example is presented as a check for
fatigue on a sign structure previously designed for static loads.
A fatigue design load distributed linearly from a value of 1.25 psf
at the bottom to zero at the top of the sign is used to simulate
the truck-induced gust load. The pressure is applied to the total
sign face in the example. This produces a loading which corresponds
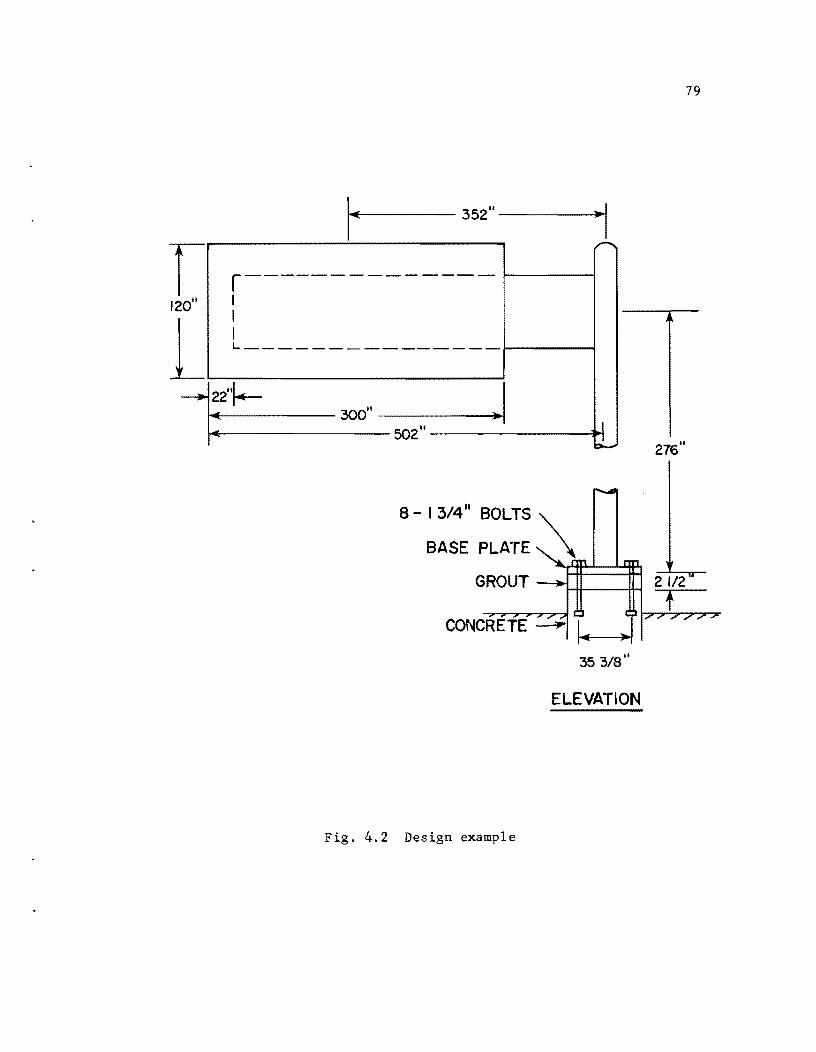
r 120"
l 1
I 1-4~f----- 352" ----)0-)0-11 I"""'"
r-------- -----I I I l.. _______________
22"1+- .1 : 30011
502"
8 - 13/4" BOLTS '"
BASE PLATE" \
J ~
GROUT ~~~
CONCRETE
353/811
ELEVATION
Fig. 4.2 Design example
79
276"
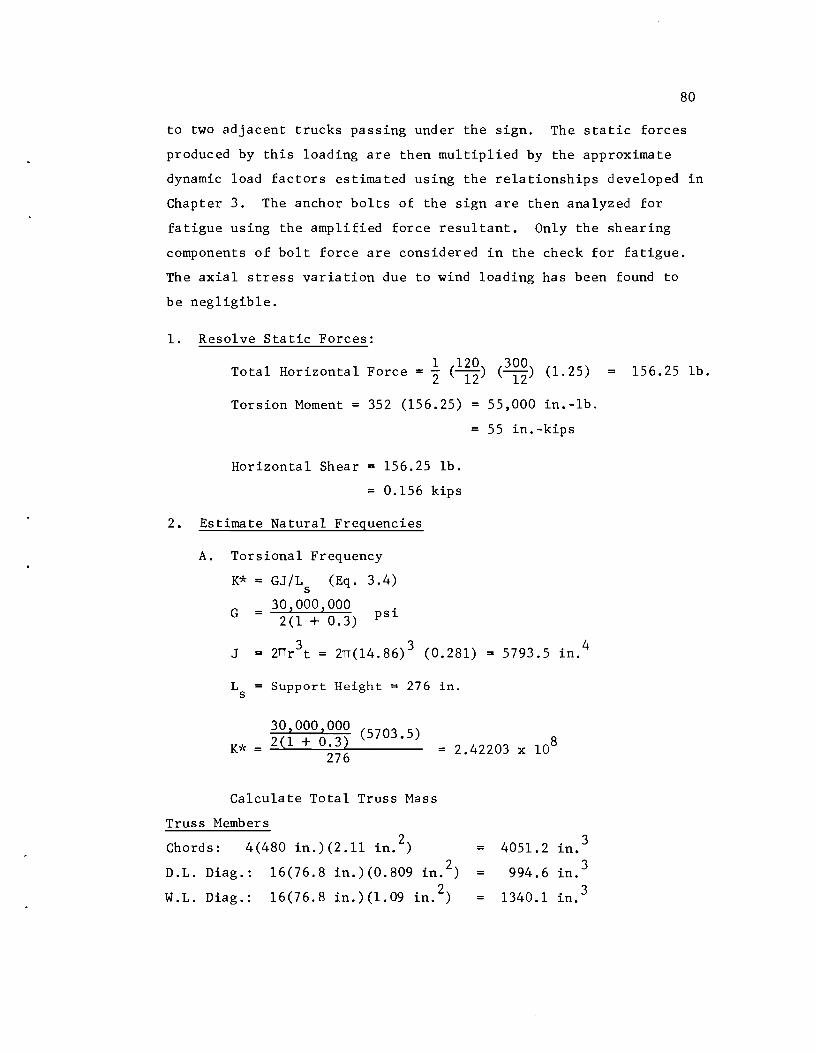
80
to two adjacent trucks passing under the sign. The static forces
produced by this loading are then multiplied by the approximate
dynamic load factors estimated using the relationships developed in
Chapter 3. The anchor bolts of the sign are then analyzed for
fatigue using the amplified force resultant. Only the shearing
components of bolt force are considered in the check for fatigue.
The axial stress variation due to wind loading has been found to
be negligible.
1. Resolve Static Forces:
Total Horizontal Force = i (li~) (3~~) (1.25)
Torsion Moment = 352 (156.25) = 55,000 in.-1b.
= 55 in. -kips
Horizontal Shear = 156.25 lb.
= 0.156 kips
2. Estimate Natural Frequencies
A. Torsional Frequency
K* = GJ/L s (Eq. 3.4)
G = 30 z000 z000
psi 2(1 + 0.3)
3 2n(14. 86) 3 (0.281) 5793.5 in. 4 J = 2n r t = =
L Support Height = 276 in. s
30 z000,000 (5703.5) K* = 2(1 + 0.3) = 2.42203 x 10⁸
276
Calculate Total Truss Mass
Truss Members
Chords: 4(480 in.)(2.11 . 2) 4051.2 in. 3 l.n. =
D.L. Diag. : 16(76.8 in.)(0.809 . 2) 994.6 in. 3 l.n.
W.L. Diag. : 16(76.8 in.) (1. 09 . 2) 1340.1 in. 3 l.n.
156.25 lb.

W.L. Strut: 16(48 in.)(0.715 . 2) ~n. = 549.1 in.
D.L. Vert. : 18(48 in.) (0.715 . 3) ~n. = 617.8 in.
Cross Brace: 8(67.9 in.)(0.621 . 3) ~n. = 337.2 in.
7890.0 in.
wt. 0.286 1b/in. 3 (7890 in.3
) = 2256.5 lb.
g = 32.2 ft/sec 2 = 386.4 in./sec 2
Truss Member Mass = 2256.5 386.4 = 1b-sec2
5.84 --.,;;.......;;;..;;~ in.
Sign, Lights, Walkway, Mounting Bracket
Walkway = (300/12 ft)(50 1b/ft) = 1250 1b
Lights = (300/12 ft)(20 1b/ft) = 5001b
3
3
3
3
Sign Face = (120/12 ft)(300/12 ft)(3 1b/ft2) = 750 1b
Bracket = 3( 1-(4811 + 11" + 3611) ft] (7.7 1b/ft) = 183 1b
12 2683 1b
2683 1b 2 = 694 1b-sec lin. Signing Structure Mass = 3864 in.
2 sec
Pole Mass between Trusses (4811)
A 26.24 in. 2
=
(26.24 in. 2)(48 in.) 1259.5 in. 3 Vol = = wt = (0.286 1b/in. 3)(1259.5 . 3)
~n. = 360.2
Pole Mass 360.2 1b 2
386.4 in./sec2 = 0.93 1b-sec lin.
1b
Total Mass 5.84 + 6.94 + 0.93 = 12.7 1b-sec2/in.
M L2 M* = __ T =
3 13.7(480)2
3 1052160.0 (Eq. 3.6)
81
2.42203 x 10 = W = /** ff5GJ = / 8 M* - M LsL~ , 1052160
15.2 rad/sec
(Eq. 3.7)
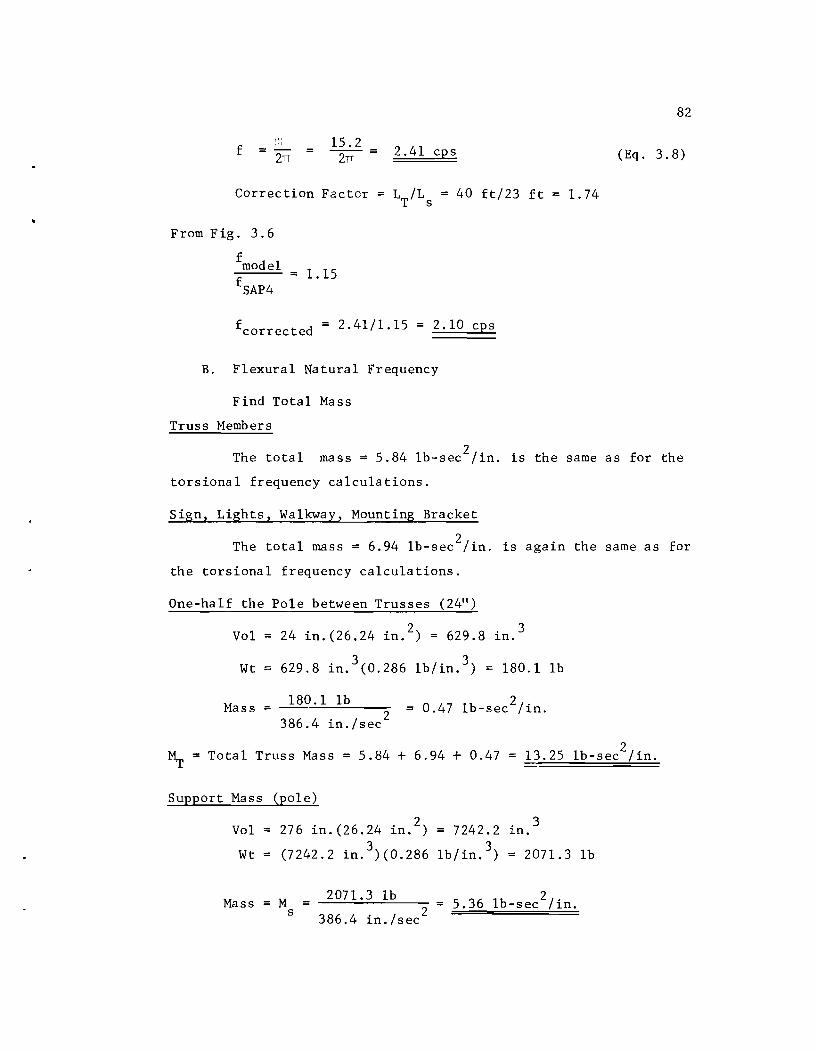
2n f '" ,., =- 15.2
--z:;:;- = 2.41 cps
Correction Factor = LT/Ls = 40 ft/23 ft = 1.74
From Fig. 3.6
fmodel f SAP4
=: 1.15
fcorrected = 2.41/1.15 2.10 cps
B. Flexural Natural Frequency
Find Total Mass
Trus s Memb er s
82
(Eq. 3.8)
The total mass = 5.84 lb-sec 2/in. is the same as for the
torsional frequency calculations.
Sign, Lights, Walkway, Mounting Bracket
The total mass = 6.94 lb-sec 2/in. is again the same as for
the torsional frequency calculations.
One-ha 1£ the Pole between Trusses (24")
Vol 24 in.(26.24 in. 2) = 629.8 in. 3
Wt 629.8 in. 3 (O.286 lb/in. 3) = 180.1 Ib
Mass 180.1 lb
386.4 in./sec 2
~ = Total Truss Mass = 5.84 + 6.94 + 0.47 13.25 lb-sec2/in.
Support Mass (pole)
Vol 276 in.(26.24 in.2
) = 7242.2 in. 3
Wt = (7242.2 in.3
)(0.286 lb/in. 3) = 2071.3 lb
Mass = M s
= 2071.3 Ib 3 lb 2/ ---'-;:;..;..."--'=-=---- = 5. 6 - sec in. 386.4 in./sec 2

83
Calculate the vertical weight supported by pole
Mass 1 1 2
= ~ + 2 Ms = 13.25 + 2(5.36) = 15.93 1b-sec lin.
2 N = 15.93 1b-:ec (386.4 in./sec 2) = 6155 1b
1n.
Calculated Generalized Stiffness
3EI K* --~
s
N 5.25 L
s
K* = 3(30000000)(2896.8) _ 5.25 (6155) (276)3 276
K* = 12400.35 - 117.1 12283.3
Calculate Generalized Mass
w = width of truss cross section = 48 in.
3 48 2 M* = 0.236(5.36) + 13.25(1 + (4 - 276) )
M* = 1.26 + 13.25(1.02) = 14.74
I = /Ii;; = )12283.3 w JM-k 14.74 = 28.9 rad/sec
f I~l 28.9
=--=--= 2n 2n 4.59 cps
Frequency Correction Factor from Fig. 3.8
LT/Ls = 40/23 = 1.74 > 0.9
(Eq. 3.12)
(Eq. 3.14)
(Eq. 3.15)
Because LT/Ls is greater than 0.9, the flexural natural frequency
is not the dominant mode. A flexural frequency correction factor
need not be determined, since the DLF factors will be estimated
using the dominant torsional natural frequency.
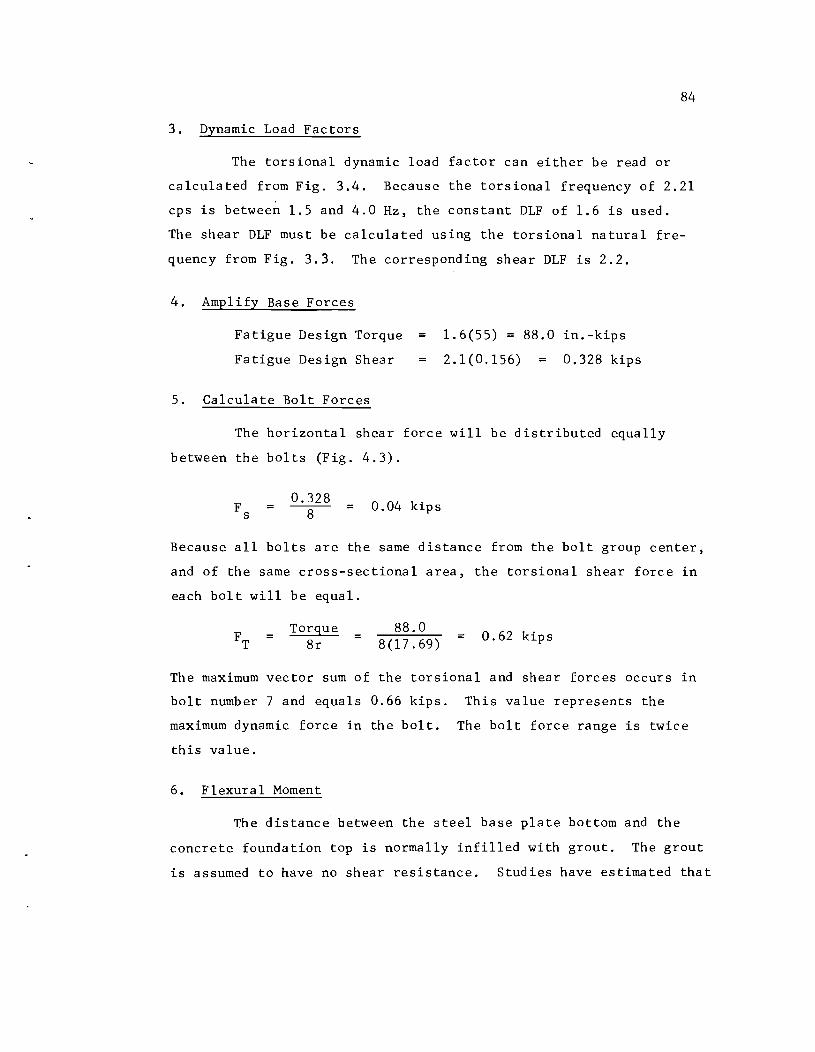
84
3. Dynamic Load Factors
The torsional dynamic load factor can either be read or
calculated from Fig. 3.4. Because the torsional frequency of 2.21
cps is between 1.5 and 4.0 Hz, the constant DLF of 1.6 is used.
The shear DLF must be calculated using the torsional natural fre
quency from Fig. 3.3. The corresponding shear DLF is 2.2.
4. Amplify Base Forces
Fatigue Design Torque = 1.6(55) = 88.0 in.-kips
Fatigue Design Shear 2.1(0.156) = 0.328 kips
5. Calculate Bolt Forces
The horizontal shear force will be distributed equally
between the bolts (Fig. 4.3).
F s 0.328 ---
8 = 0.04 kips
Because all bolts are the same distance from the bolt group center,
and of the same cross-sectional area, the torsional shear force in
each bolt will be equal.
Torque 8r
88.0 = 0.62 kips 8(17.69)
The maximum vector sum of the torsional and shear forces occurs in
bolt number 7 and equals 0.66 kips. This value represents the
maximum dynamic force in the bolt. The bolt force range is twice
this value.
6. Flexural Moment
The distance' between the steel base plate bottom and the
concrete foundation top is normally infilled with grout. The grout
is assumed to have no shear resistance. Studies have estimated that
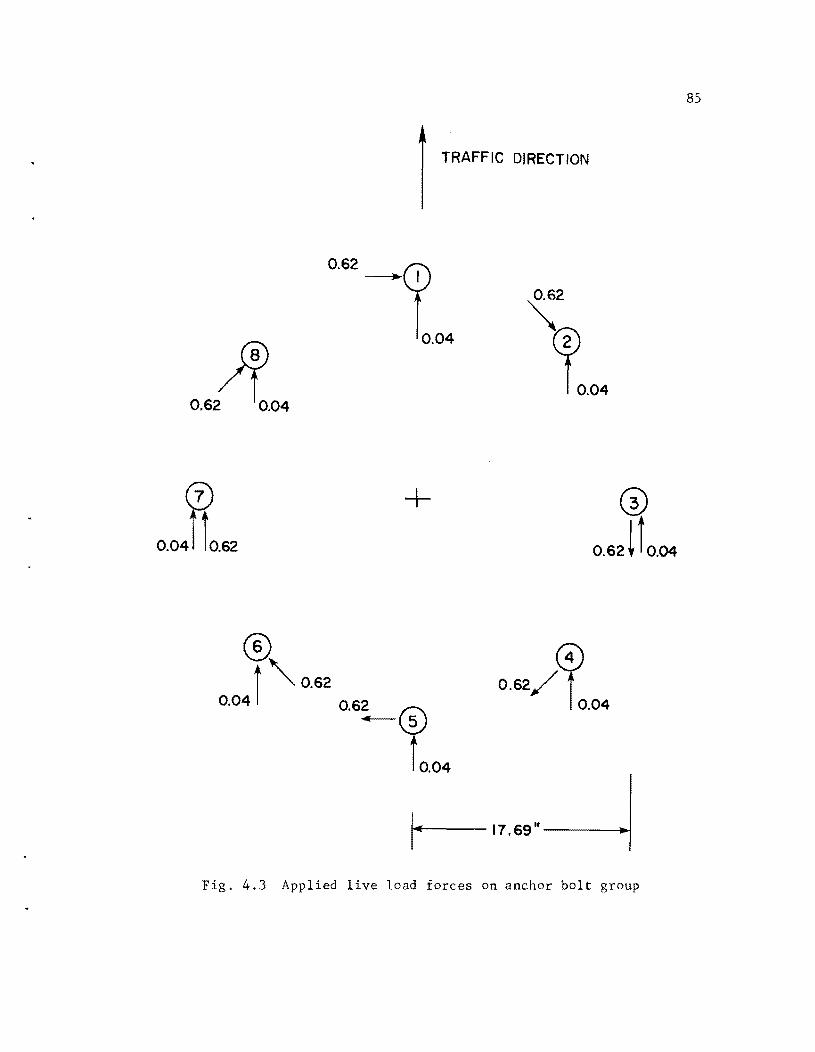
85
TRAFFIC DIRECTION
J[ 0.62 0.04
0.62 cp -- ;~
0.04
~2
~0'04
+
O.62/CV r 0.04
141·---17.69"_--"IIIo-l
Fig. 4.3 Applied live load forces on anchor bolt group

86
the shear forces produce moment equal to the shear times 0.7 of the
grout distance [7]. The actual length through which the shear acts
is a function of the degree of bolt fixity. The seven-tenths value
is an approximation. The estimated moment range in the bolt is:
Moment 2[0.66(0.7)(2.5)] = 3.32 in.-kips
7. Effective Bolt Area
The tensile stress area of a threaded bolt is given by
Eq. (4.2) from the AISC Steel Manual.
n 2 A = 4 (D - 0.9743/n) (4.2)
where A tensile stress area
D basic major diameter
n = number of threads per inch
where the quantity (D - 0.9743/n) can be taken as the effective
diameter, Deff
, in calculating the section modulus of the bolt.
The bolts in the example are 1.75 in. in diameter. The design will
be checked for the standard coarse thread of four threads per inch
and the more efficient constant thread pitch series of eight threads
per inch.
A4 1.78 in. 2
Deff 1.51 in.
S4 3 TIDeff /32 0.34 in. 3
A8 2.08 in. 2
Deff 1.63 in.
S8 0.43 in. 3
=

8. Flexural Fatigue Stresses
The resulting flexural stresses in the bolt are given by
M S
where M represents the moment range.
3.32 0.34
for eight threads per inch
3.32 0.43
6.79 ksi < 10 ksi
5.40 ksi < 10 ksi
87
Since both bolts have stresses less than the allowable fatigue
threshold of 10 ksi, the fatigue capacity is satisfactory. The
difference in the flexural stresses for the two thread series points
out the benefit of using a higher number of threads per inch. The
finer threaded bolts are also easier to install.
The design procedure outlined can be considerably shortened
if the designer uses the maximum DLF factors of 2.1 for shear and
1.6 for torsion. These values are conservative for all signs. If
these values are used, the designer does not have to calculate the
modal frequencies.
The axial fatigue stress range in the bolts in this example
is 1.58 ksi and 1.14 ksi, respectively, for the four and eight
thread series bolts. These stress ranges can easily be calculated
from the base moment which is equal to the fatigue design shear
times the distance from the sign pressure resultant to the base
plate. It has been found that these axial stresses are negligible
for the signs considered. The bolts with maximum axial stresses,
bolts 1 and 5, are also not subjected to the highest shear. Conse
quently, the axial stress range in the bolts can be neglected in
most designs.

C HAP T E R 5
CONCLUSIONS
The dynamic respone of three cantilever highway signs was
measured experimentally. The experimental data were used in the
analytical development of a simulated gust-loading function. A
parametric study using SAP4 and the simulated loading function was
performed on a variety of possible sign configurations. Simplified
models for estimating natural modal frequencies of vibration and
dynamic load factors were developed from the parametric study
information. The models apply to a wide range of sign geometries.
The magnitude of the gust-induced base forces can be estimated. An
anchor bolt design procedure was outlined to check for adequate
fatigue resistance. The study conclusions are outlined below:
(1) Vehicle-induced gusts can produce significant sign response
and a large number of stress fluctuations. Box-type
trailer trucks produced greatest number forces.
(2) The load energy dissipation capacities for the signs, as
measured by damping ratios, were all very low.
(3) A single loading event produces a number of stress cycles
approximately equal to the initial stress magnitude.
(4) Stresses measured in the superstructure members were low
and do not present a fatigue problem.
(5) Good agreement was found between the experimental and
analytical forces in the truss chord members.
(6) The maximum anchor bolt stresses were the result of
torsional shear forces in the tubular upright support.
88
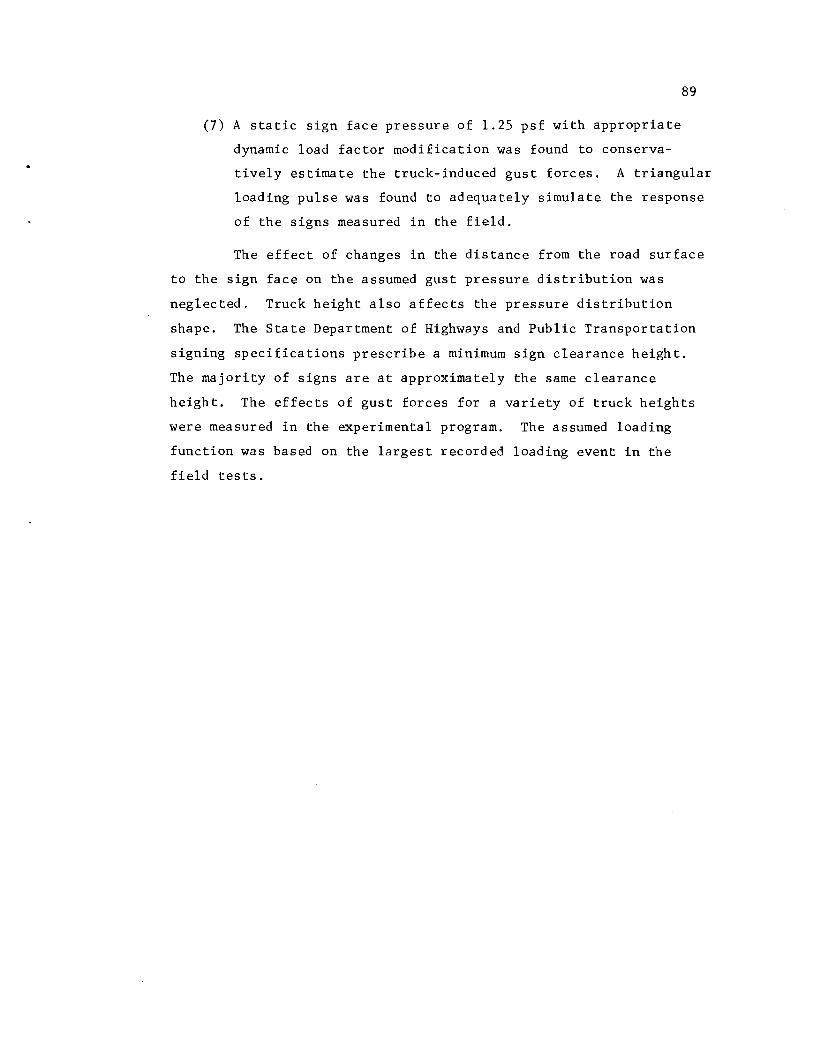
89
(7) A static sign face pressure of 1.25 psf with appropriate
dynamic load factor modification was found to conserva
tively estimate the truck-induced gust forces. A triangular
loading pulse was found to adequately simulate the response
of the signs measured in the field.
The effect of changes in the distance from the road surface
to the sign face on the assumed gust pressure distribution was
neglected. Truck height also affects the pressure distribution
shape. The State Department of Highways and Public Transportation
signing specifications prescribe a minimum sign clearance height.
The majority of signs are at approximately the same clearance
height. The effects of gust forces for a variety of truck heights
were measured in the experimental program. The assumed loading
function was based on the largest recorded loading event in the
field tests.

A P PEN DIe E S
90

APPENDIX A
SIGN GEOMETRIES
91
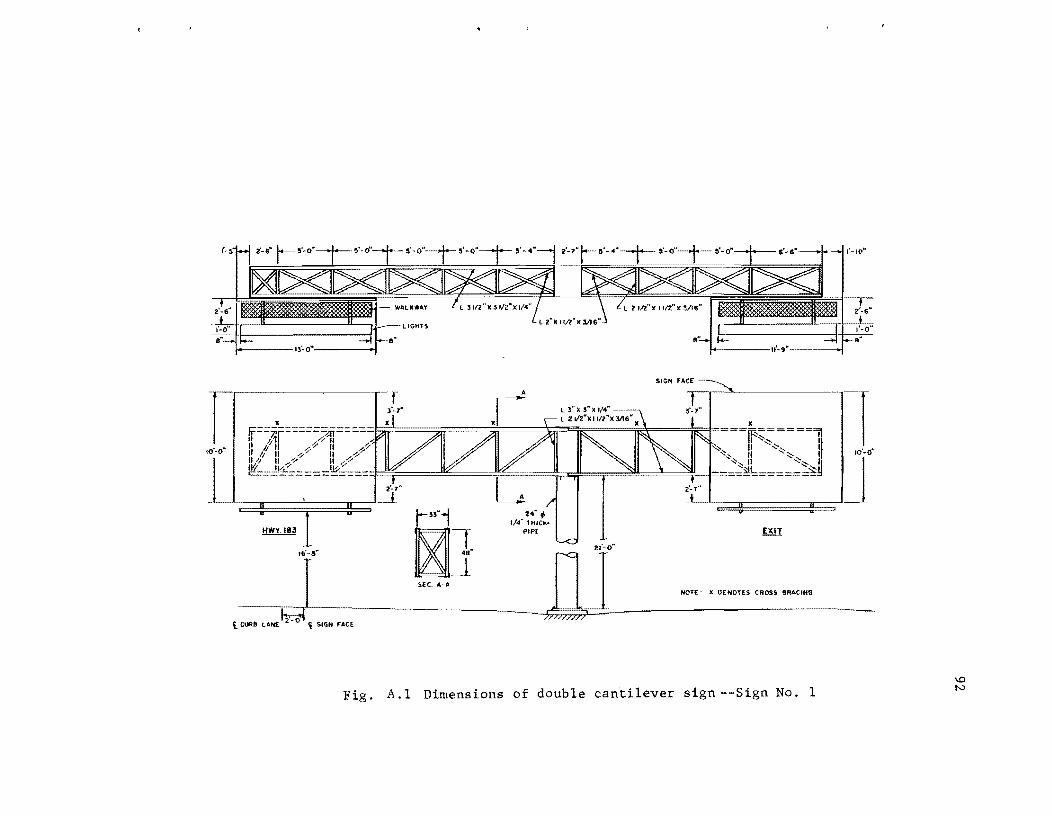
SIGN rACE
f ~
!OL'_o, ===~~=====n r '~, u '-:~ II =:===::I~~~==::l!g~==~~~==~;::>o~==r:~Jl=i::~~J '~II ::::." II 10'-0'
_ ~~;:;:;:::;~~:;~~~ .... =:==;~h====:;~n .1 L ,,".J
g g-
HWY.183 Illi
16'-5;"
SEC. A-A NOTE' x OENOTES CROSS BRACING
~ CURB LANE' 2'-0 ~ SIGN FACE
Fig. A.l Dimensions of double cantilever sign--Sign No.1 \0 N

d-s"
B ..-
WALKWAY B
LIGHTS
., SIGN FACE
SEC. A-A
r At --, 3' "
ij=:=:==:===:=:=l~__ X -2
I: 7~---==-n==1-==T===--X I ,0'4 , /''' ,: /11 #11 -:?" !"1
L II /;7 II // II 1/ II //7 II II fir //" '/ I ~'II II -'77 II // II II ~ 7 II
:v? II -I II // ~~II h//7 II t::=====---.!!f 11/.-7 II ~ 7 II --A':T====~~- 11/' I!" - =----'~ !!;J
2 1/z"x 2 1/2"X 1/4" lei PIPE 2 1/2" X 2" X 1/4"
31/2"X 31/2"X 114" 11 16-B" 123/4" 4>
0.43" THICK PIPE
.0'" , o'.om CROSS "",., I ~4' 6"~ D
1. CURB LANE <t. SIGN FACE
Fig. A.2 Dimensions of single cantilever sign --Sign No. 2
SEC. B-B
1'-0"
\0 W
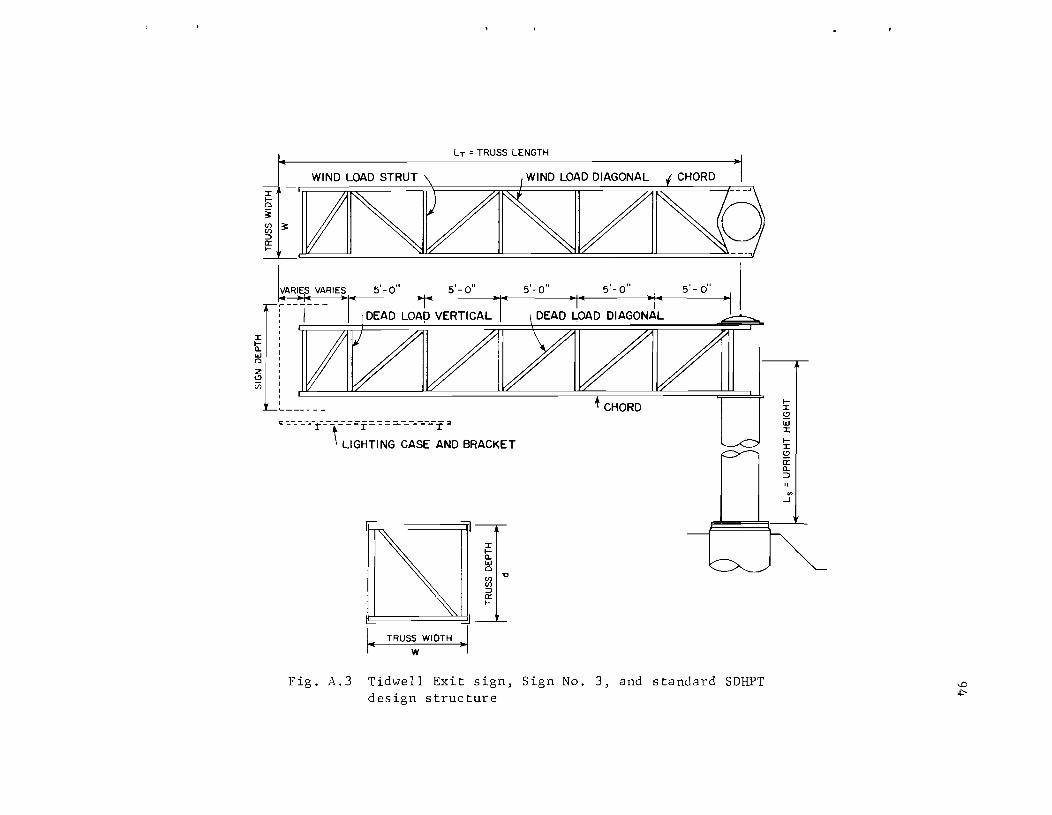
J:
Ii: w o z C)
[f)
J:
b ~
L T = TRUSS LENGTH
~ I~ ::::> a: f-
C -::.-------r-----.:==f=--= = =---------=-f::l
, LIGHTING CASE AND BRACKET
" ~
~ ":J
I... TRUS~ WIDTH .1
J:
Ii: ~ [f)I"O [f) ::::> a: f-
Fig. A.3 Tidwell Exit sign, Sign No.3, and standard SDHPT design structure
fJ: ~ W J: fJ: C)
a: a. ::::>
'" -.J
<D .j>

A P PEN D I X B
DISTRIBUTION OF SIGN PRESSURE TO NODAL POINTS
95
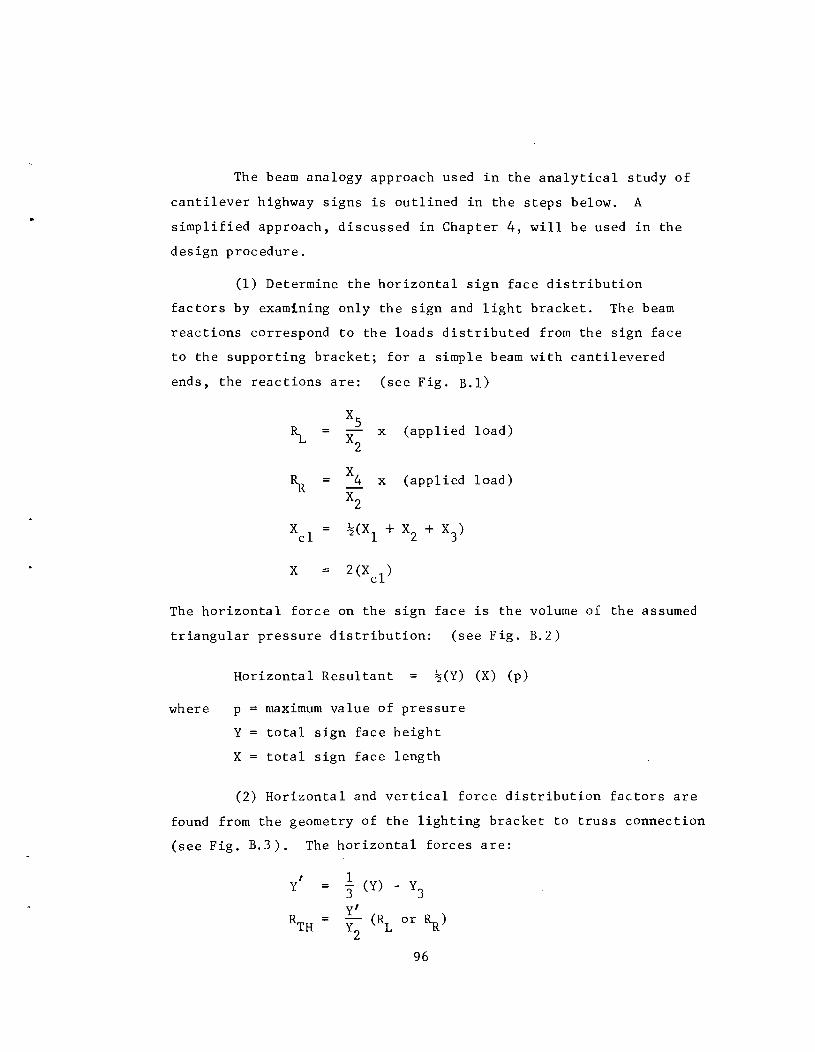
The beam analogy approach used in the analytical study of
cantilever highway signs is outlined in the steps below. A
simplified approach, discussed in Chapter 4, will be used in the
design procedure.
(1) Determine the horizontal sign face distribution
factors by examining only the sign and light bracket. The beam
reactions correspond to the loads distributed from the sign face
to the supporting bracket; for a simple beam with cantilevered
ends, the reactions are: (see Fig. B.1)
~ Xs
(applied load) X2
x
~ X
4 x (applied load) X2
x
The horizontal force on the sign face is the volume of the assumed
triangular pressure distribution: (see Fig. B.2)
where
Horizontal Resultant ~(Y) (X) (p)
p maximum value of pressure
Y total sign face height
X total sign face length
(2) Horizontal and vertical force distribution factors are
found from the geometry of the lighting bracket to truss connection
(see Fig. B.3). The horizontal forces are:
, Y
1 3 (y) - Y3 Y' Y
2 (~ or ~)
96
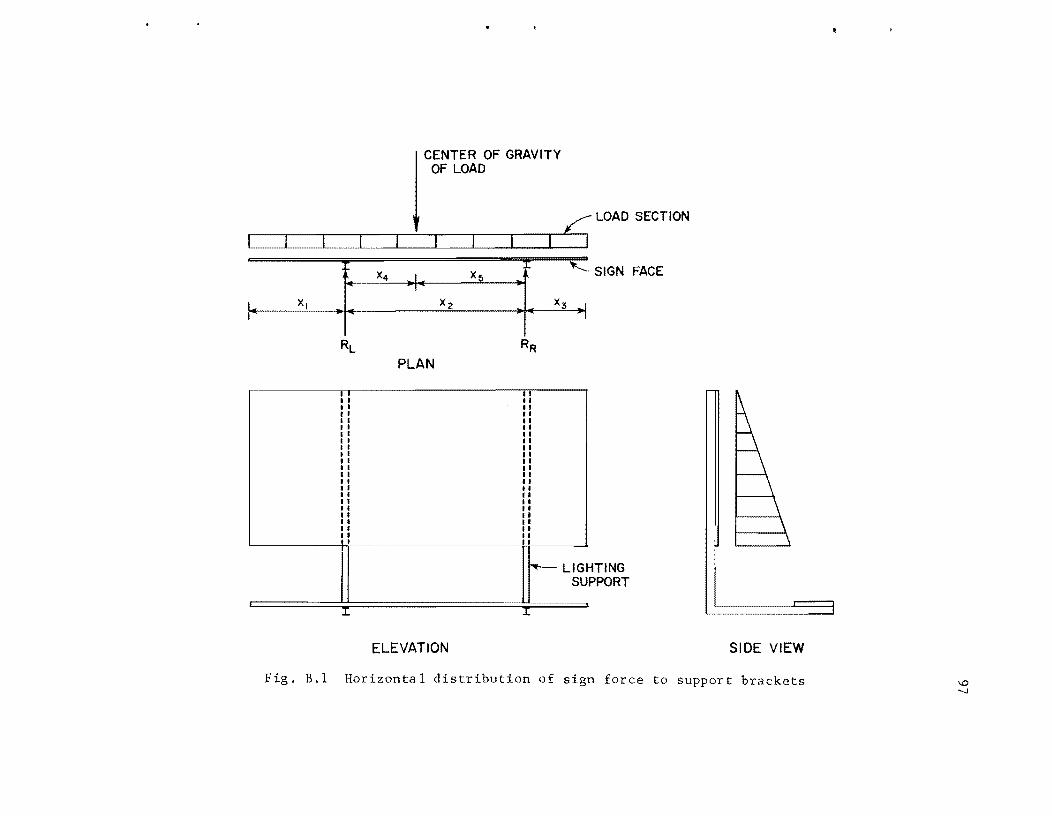
j CENTER OF GRAVITY
OF LOAD
/ LOAD SECTION
~==~===~=======~=~~~==~===~===~I:~~~ t '" -I- x, t ~ SIGN FACE
I.. XI:.- x2 : X3 I .. JI
RL RR PLAN
r-- LlG Sl
ELEVATION
HTING PPORT
SIDE VIEW
Fig. B.l Horizontal distribution of sign force to support brackets '" -..J
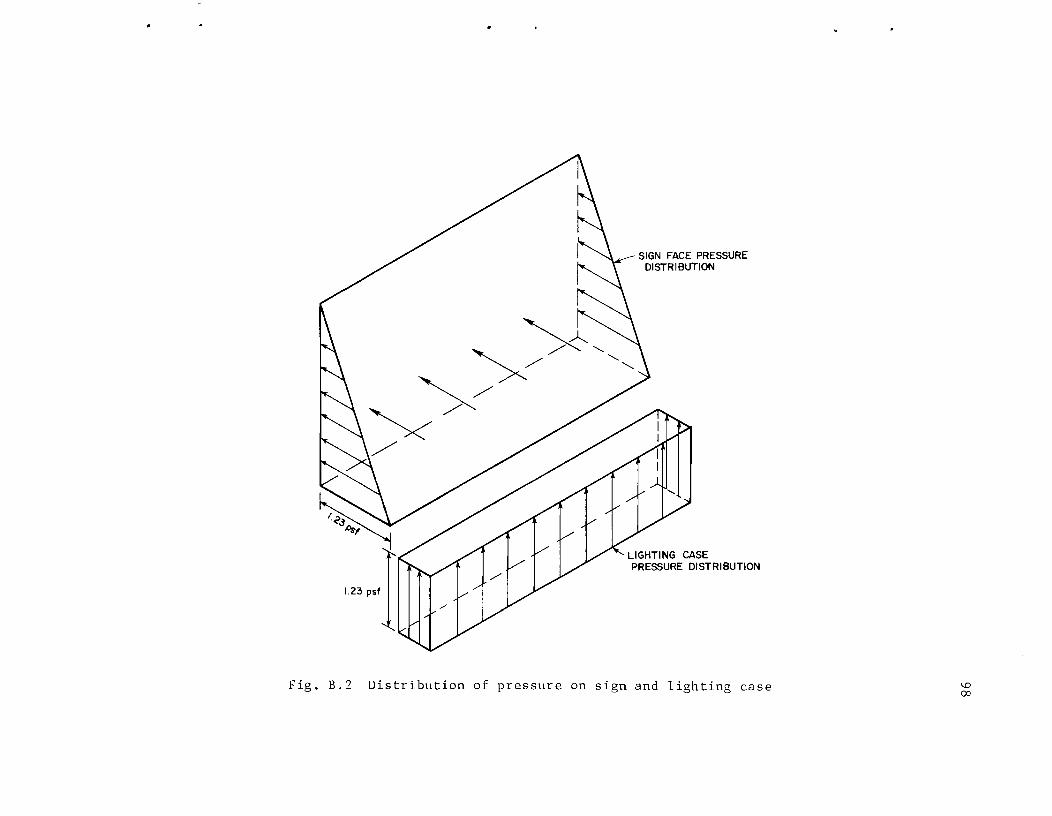
SIGN FACE PRESSURE DISTRI BUTION
" X, ./" '-... ~ X "
~./" /
1.23 psf
LIGHTING CASE PRESSURE DISTRIBUTION
Fig. B.2 Distribution of pressure on sign and lighting case \D et::J
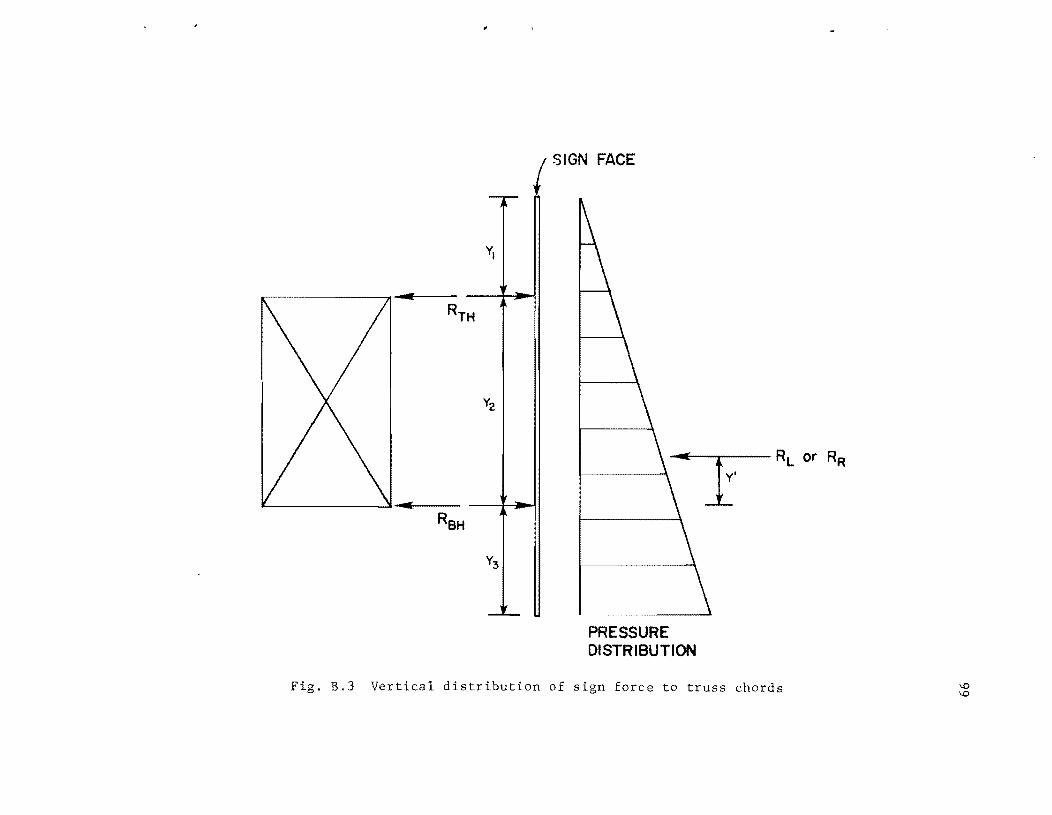
-r--
VI
RTH
V2
---'"'
RBH
V3
~
/ SIGN FACE
PRESSURE DISTRIBUTION
Fig. B.3 Vertical distribution of sign force to truss chords \0 \0
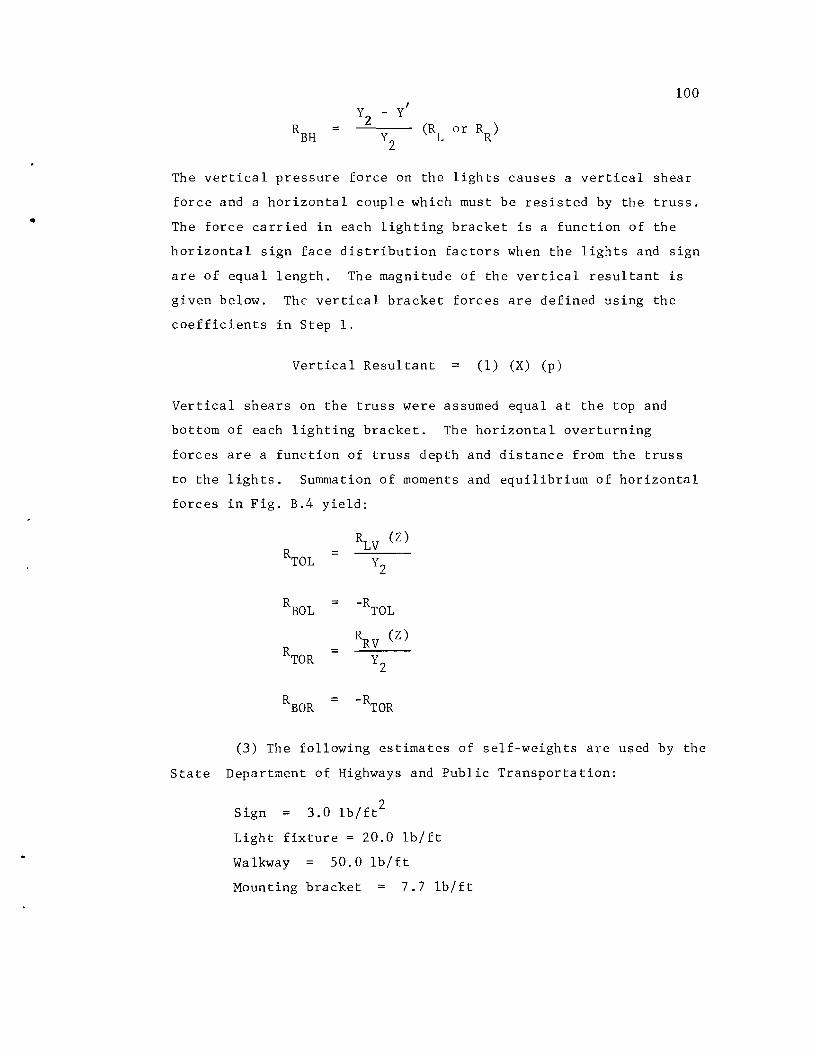
•
100
=
The vertical pressure force on the lights causes a vertical shear
force and a horizontal couple which must be resisted by the truss .
The force carried in each lighting bracket is a function of the
horizontal sign face distribution factors when the lights and sign
are of equal length. The magnitude of the vertical resultant is
given below. The vertical bracket forces are defined using the
coefficients in Step 1.
Vertical Resultant (1) (X) (p)
Vertical shears on the truss were assumed equal at the top and
bottom of each lighting bracket. The horizontal overturning
forces are a function of truss depth and distance from the truss
to the lights. Summation of moments and equilibrium of horizontal
forces in Fig. B.4 yield:
RLV
(z) RTOL Y2
RBOL = -R
TOL
RTOR
~V (z) Y
2
RBOR
-RTOR
(3) The following estimates of self-weights are used by the
State Department of Highways and Public Transportation:
Sign 3.0 lb/ft2
Light fixture = 20.0 lb/ft
Walkway 50.0 lb/ft
Mounting bracket 7.7 lb/ft
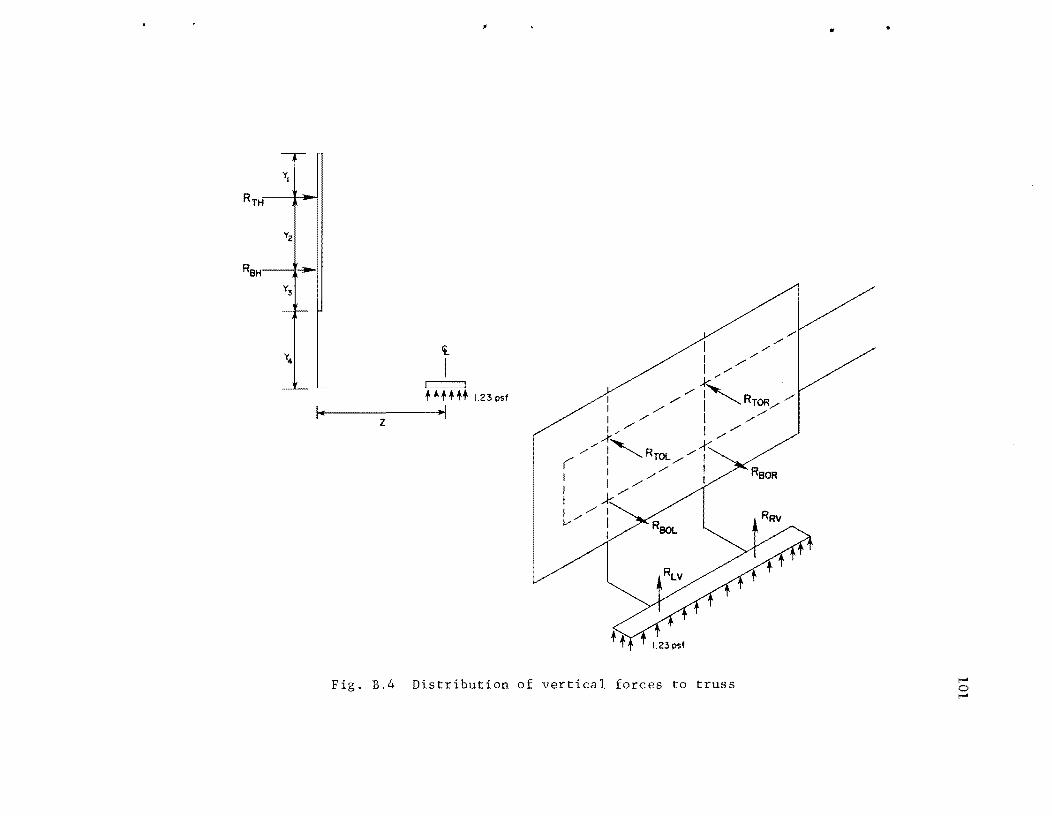
T 'TI
RTH
YZ
RBH
J L~
"
It.
I r:::==:::J HHH 1.23psf
I~ ·1 z
,.. I ,.. /
,.. /'
/'
...k ....
/' I' R / / I --......... TOR/, / I /'/'
/' / 1,,/ I/, A', --k
,../ I "-.....RTOL ,.. I 1 /'/ I
/' I /
ReOR
...k./ 1 / v'" RRV
Fig. B.4 Distribution of vertical forces to truss
"
I-' o I-'
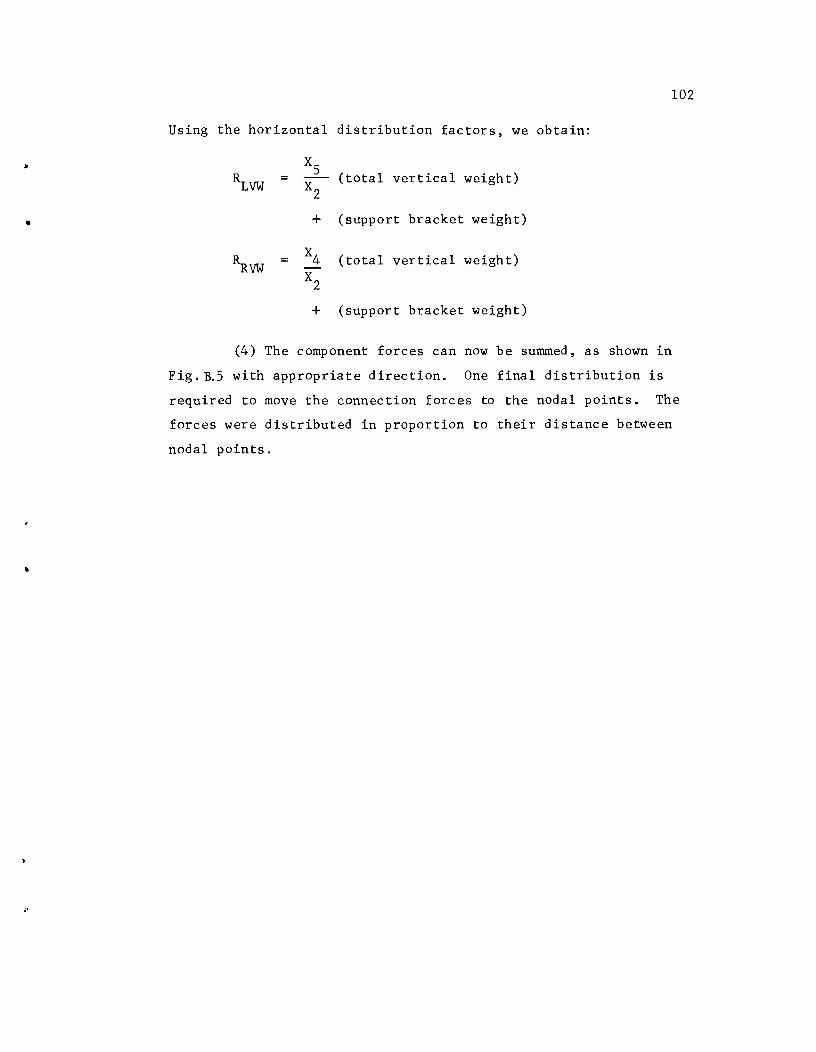
~
•
•
102
Using the horizontal distribution factors, we obtain:
Xs RLVW X2
(total vertical weight)
+ (support bracket weight)
~VW X4 (total vertical weight) X2
+ (support bracket weight)
(4) The component forces can now be summed, as shown in
Fig. B.S with appropriate direction. One final distribution is
required to move the connection forces to the nodal points. The
forces were distributed in proportion to their distance between
nodal points .
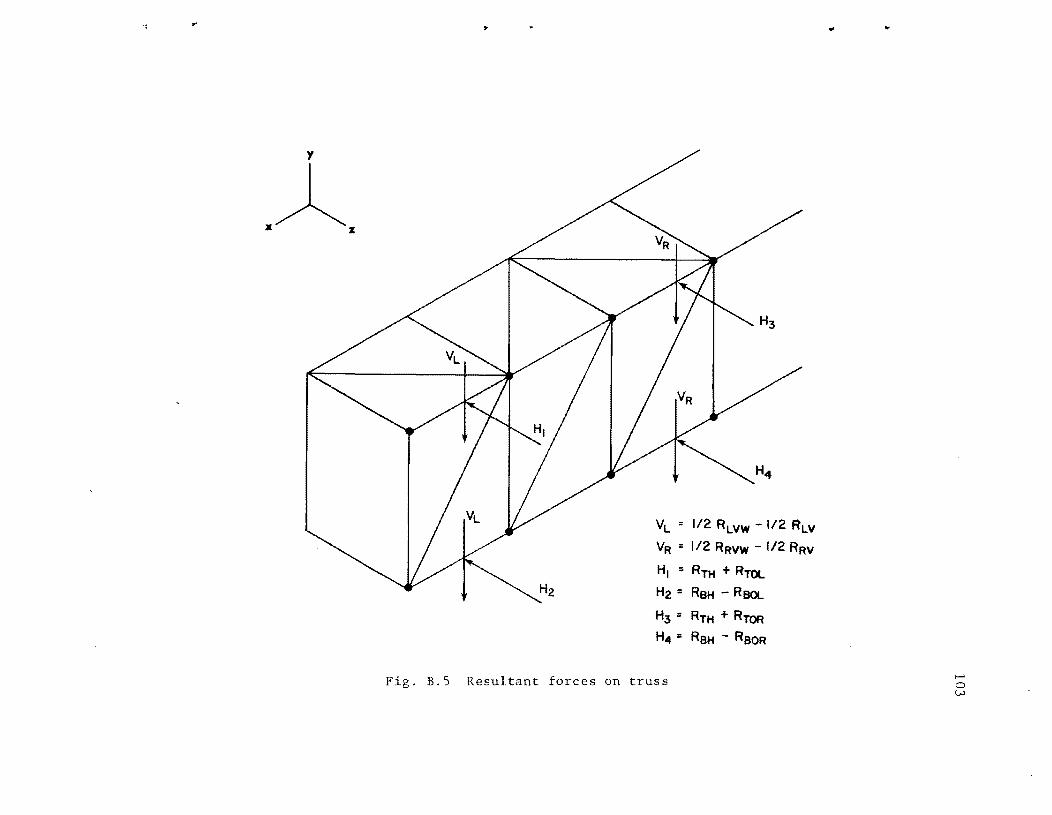
..
y
x~ z:
•
VL = 1/2 R LVW - 1/2 R LV
VR = 112 RRVW - 112 RRV
HI = RTH + RTOL
H2 = RBH - RBOL.
H3 = RTH + RTOR
H4 = RSH - RSOR
Fig. B.S Resultant forces on truss
- ...
t-' o w

t
,
I.
REF ERE N C E S
1. Clough, Ray W., and Penzien, Joseph, Dynamics of Structures, McGraw-Hill Book Company, Inc., New York, 1975.
2. Cocavessis, Nicolas S., "Dynamic Response of Cantilever Highway Sign Structures Subjected to Gust Loadings," unpublished MS thesis, The University of Texas at Austin, May 1978.
3. Bathe, Klaus-Jurgen, Wilson, Edward, and Peterson, Fred, "SAP 4 Structural Analysis Program," University of California at Berkeley, April 1974.
4. Kyropoulos, Peter, "Truck Aerodynamics," SAE Transactions, 1962, p. 307.
5. Texas Department of Highways and Public Transportation, "Interstate Signing Standards," 1978 Revision.
6. Fisher, John W., Bridge Fatigue Guide Design and Details, American Institute of Steel Construction, 1977.
7. James, Billy D., Oral conversation concerning M.S. thesis in progress at The University of Texas at Austin, November 1977.
8. Natrella, M. G., Experimental Statistics, NBS Handbook 91, National Bureau of Standards, U.S. Department of Commerce, August 1963.
9. American Institute of Steel Construction, Manual of Steel Construction, Seventh Edition, 1973.
104


![WELCOME TO IIA notification.pdf · 2019. 5. 14. · [~ I.I-~3(ii)] ,:m:Q "(fiT ~ : 3T{{T'1f{TJT 13 209. ~I~,( ~ ~~ ~~ ~ ~ 20 ~ ~~~i6.1 ~ ~~ cl:ii~~c (1ft t ~ ~~ 210. ~I~q) ~ 211](https://img.pdfslide.us/doc/110x75/614a0f4012c9616cbc692b23/welcome-to-notificationpdf-2019-5-14-ii-3ii-mq-fit-.jpg)


![[XLS] · Web view28 209 70227595 29 209 70775496 30 209 70554395 31 209 70775195 32 209 70559596 33 209 70774296 34 209 70778999 35 209 70773995 36 209 70226095 37 209 70776596 38](https://img.pdfslide.us/doc/110x75/5b0cded17f8b9ab7658b981b/xls-view28-209-70227595-29-209-70775496-30-209-70554395-31-209-70775195-32-209.jpg)