Embed Size (px)
Citation preview


2
Canadian Results
PISA 2012

3
PISA 2012 by the numbers
34 OECD countr ies
65 countr ies and
economies
47 languages
Over 480 ,000 15-year -o ld
s tudents
4
PISA 2012 in Canada
Administered in Engl ish and French
Over 21 ,000 15-year -o ld
s tudents f rom over
900 schools
10 prov inces
Par tnership between
CMEC,ESDC and STC

5
What is in a PISA test?
For all students
Major Domain: Mathematics
Minor Domains: ReadingScience
2-hour paper-based test
For a subset of students
1-hour computer-based test
Additional Domains: Mathematics
Digital readingProblem solving
30-minute Background Questionnaire

6
Canadian students continue to perform well in a global context.
Italics = OECD country

7
Canadian students continue to perform well in a global context.
Italics = OECD country

8
In Canada, there are variations between provinces in mathematics.
Above Canadian average
Quebec
At the Canadian average
British ColumbiaAlbertaOntario
Below the Canadian average
SaskatchewanManitobaNew BrunswickNova ScotiaPrince Edward IslandNewfoundland and
Labrador

9
Canadian students continue to perform well in reading ...
Italics = OECD country

10
Canadian students continue to perform well in reading ...
Italics = OECD country

11
… and in science.
Italics = OECD country

12
… and in science.
Italics = OECD country

13
Nine countries achieved higher results than Canada in mathematics, five in reading, and seven in science.

14
Over 85% of Canadian students reached the baseline Level 2 or above in mathematics…
Distribution of students by proficiency level on the overall mathematics scale, Canada, provinces, and OECD

15
… while over 16% of Canadian students reached the highest levels of performance.
Distribution of students by proficiency level on the overall mathematics scale, Canada, provinces, and OECD

16
In Canada, the proportion of low achievers has increased over time, while the proportion of high achievers has decreased.

17
Over the past nine years, Canadian scores in mathematics have declined in all provinces except Quebec and Saskatchewan…

18
… while Canada’s overall performance in reading has remained stable over time, and performance in science has decreased.
Canadian results over time, 2000–2012 Reading and Science

19
Canadian results in mathematics are characterized by relatively high levels of achievement and equity.

20
Provincial results in mathematics are also characterized by relatively high levels of achievement and equity.

21
Across Canada, mathematics results show some differences by language of the school system.

22
There are large differences in reading and science achievement by language of the school system in most provinces.

23
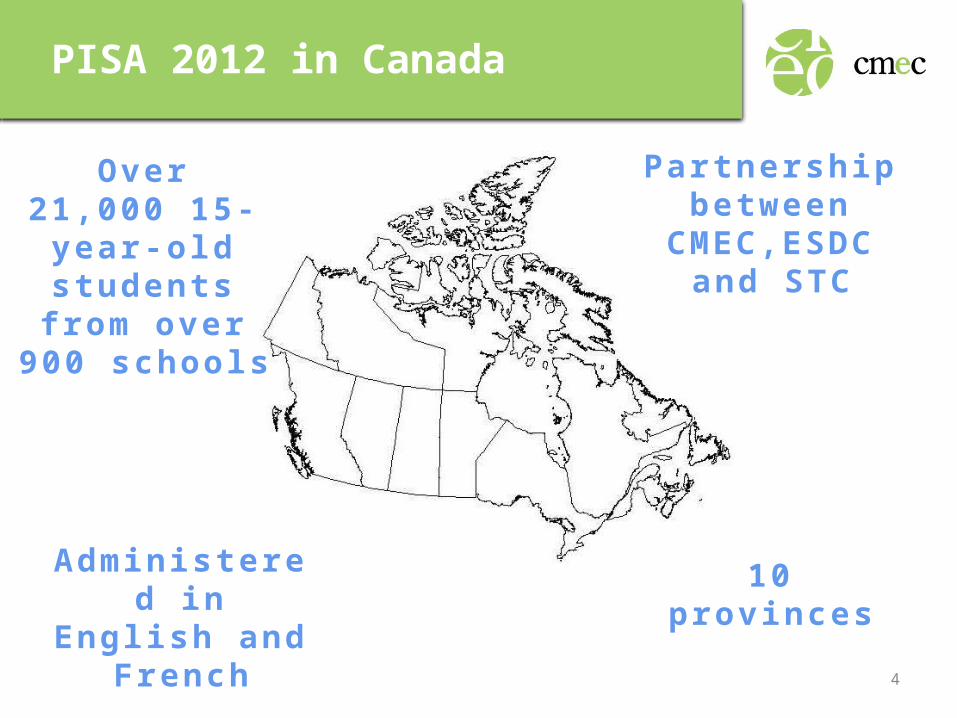
Science
Digital reading
Paper-based reading
Computer-based mathematics
Paper-based mathematics
490 500 510 520 530 540 550
527
522
506
532
523
524
543
541
514
513
PISA 2012 Canadian Results by Gender in Mathematics, Reading, and Science
FemaleMale
Males perform better than females in mathematics …
… but the gender gap in reading in favour of females is larger and persistent, while there is no significant difference in science.
10 points
17 points
35 points
21 points
3 points