Embed Size (px)
Citation preview
1
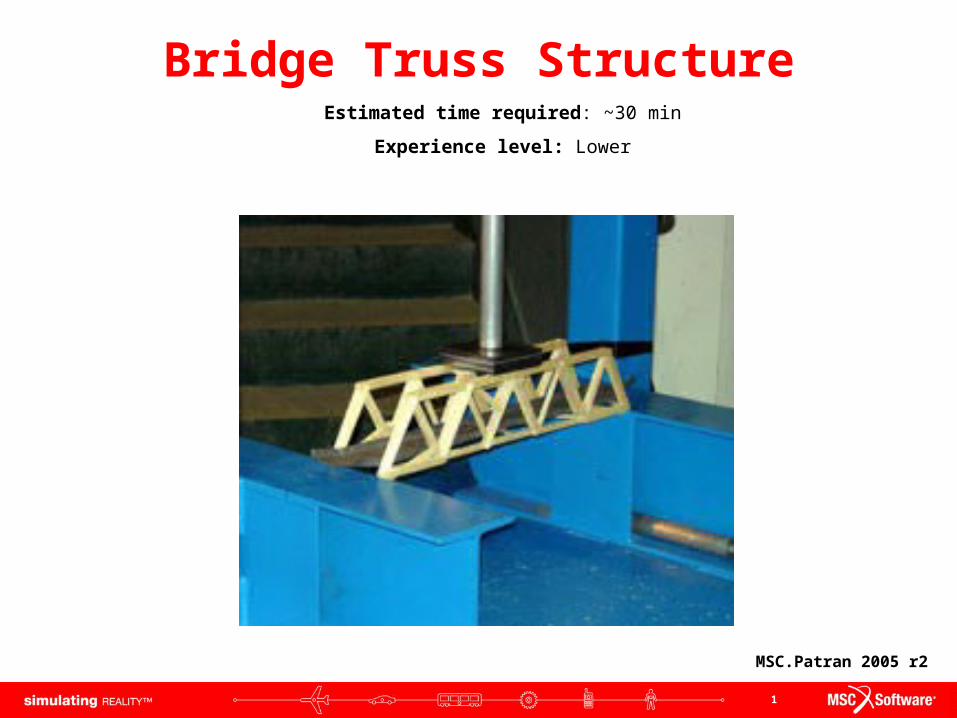
Bridge Truss StructureEstimated time required: ~30 min
Experience level: Lower
MSC.Patran 2005 r2

2
Topics CoveredTopics Covered
• Creating a new database file
• Creating curves with vectors
• Creating mesh seed with vectors
• Creating Bar2 mesh with the mesh seed
• Equivalence model
• Creating point load
• Creating boundary condition constrains for roller support & fixed support
• Displaying results: displacement and stress fringe plots as well as resultant reactive forces at support
• Reading results from *.f06 file

3
Problem DescriptionProblem Description
• The truss structure shown below contains nine members.
• Each of the members is made of aluminum and has the same cross-sectional area.
• Lower right corner is constrained in the Y and Z directions.
• Lower left corner is constrained in the X, Y and Z directions.
• Load of 100 Newtons is applied at the midpoint of the top of the truss.
Truss Members:
Material = Aluminum
Modulus of Elasticity =7e10 Pa
Poisson’s ratio = 0.3
Cross-sectional Area = 9 cm2
1 m
1 m
Y P = 100N
X2 m

4
GoalGoal
• In what direction will the roller support slide?
• Under the given conditions, is the bridge truss system going to yield?
Determine for the truss system previously illustrated:

5
Expected ResultsExpected Results
Deformation Fringe Plot
Max. Displacement = 3.14x10⁻⁷ m
Min. Displacement = 0 m
Stress (x-direction) Fringe Plot
Max. stress (x-direction) = 4.47x10⁴ Pa.
Min. stress (x-direction) = 0 Pa
Reaction Forces of Truss System
Reaction forces for both roller and fixed support are 50 Newtons in the positive y-direction.

6
Animation of Stress DeformationAnimation of Stress Deformation

7
Starting MSC.Patran from WindowsStarting MSC.Patran from Windows
a. Click on start menu
b. Roll mouse over All Programs
c. Roll mouse over MSC.Software
d. Roll mouse over MSC.Patran 2005 r2
e. Click on MSC.Patran 2005 r2
To start MSC.Patran from a windows computer you will have to:

8
a. Click File menu / Select New.
b. In the File name text field enter truss.
c. Click OK.
a
b c
Creating a New DatabaseCreating a New Database
Note: MSC.Patran defaults the working folder to C:/windows/temp. Make sure the folder content is deleted before starting a new database.

9
Database Settings for the ModelDatabase Settings for the Model
a. Select Tolerance radio button: Based on Model.
b. Enter in the Approximate Maximum Model Dimension textfield: 2Note: This is the largest dimension of your model to be analyzed which allocates enough space to create your geometry
c. Select Analysis Code to be MSC.Nastran from the drop down menu
d. Select Analysis Type to be Structural from the drop down menu since the model that you are about to analyze is a truss structural problem.
e. Click OK.
a
c
d
e
b
Remember: MSC.Patran does not handle units of measurement, so it is essential to remember to use one consistent system of measurement. In this example, SI units are used with the following measuring units:
Length meters
Force Newtons
Elastic Modulus Pa
Mass kg
Input Output
Displacement meters
Force Newtons
Stress Pa

10
a. Click on Geometry icon.
b. Select Create / Curve / XYZ from the drop down menus.
c. Uncheck Auto Execute. If checked, the command will execute without clicking the Apply button
d. In Vector Coordinate List text field enter <1 0 0>.
e. In Origin Coordinate List: Enter [0 0 0].
f. Click Apply.
g. Click on Label Control icon
h. Click on Point. This will show the labels for the points of the curve.
a
b
c
d
e
Creating Curve Geometry Using XYZ MethodCreating Curve Geometry Using XYZ Method
Creating a curve for the truss system so that mesh seed can be later created
Note: Vectors are represented with the <x y z> format while coordinates use [x y z]
f
g
hNote: Coordinate frame 0 is set at default which states that the vectors will be in reference to the global coordinate system.

11
Creating the Remaining Curve Geometry Using XYZ MethodCreating the Remaining Curve Geometry Using XYZ Method
Create the remaining curves following steps def from the previous slide.
Y
X(0 0 0) (1 0 0) (2 0 0)
(0 1 0) (1 1 0) (2 1 0)
1
23
4
5
6
7
8
9
Curve # Vector Origin
1 <1 0 0> [0 0 0]
2 <0 1 0> [0 0 0]
3 <0 1 0> [1 0 0]
4 <1 0 0> [0 1 0]
5 <1 1 0> [0 0 0]
6 <1 0 0> [1 0 0]
7 <1 -1 0> [1 1 0]
8 <1 0 0> [1 1 0]
9 <0 1 0> [2 0 0]
Note: The direction in which the curves are created does not have any resultant effect on the curve. (ie. Curve 5 can be created as above or with vector <-1 -1 0> and origin [ 1 1 0 ]
Note: The Curve ID List automatically updates after the successive curve is created.
Remember that curve 1 has already been created
At this moment, it would be a good practice to save this database file. To do so, go to file menu, and select save.

12
Review of all Resulting CurvesReview of all Resulting Curves
a. Click on Label Control icon.
b. Click on Curve to show the curve numbers in the viewport displayed in yellow.
a
b
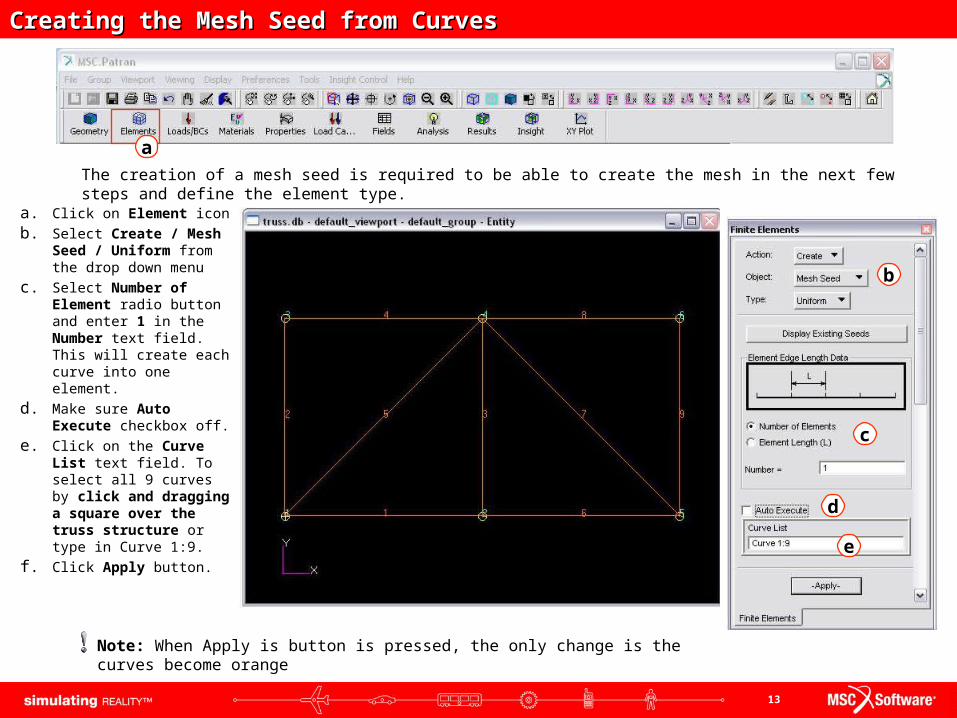
13
a. Click on Element icon
b. Select Create / Mesh Seed / Uniform from the drop down menu
c. Select Number of Element radio button and enter 1 in the Number text field. This will create each curve into one element.
d. Make sure Auto Execute checkbox off.
e. Click on the Curve List text field. To select all 9 curves by click and dragging a square over the truss structure or type in Curve 1:9.
f. Click Apply button.
a
b
c
d
e
Creating the Mesh Seed from CurvesCreating the Mesh Seed from Curves
The creation of a mesh seed is required to be able to create the mesh in the next few steps and define the element type.
Note: When Apply is button is pressed, the only change is the curves become orange
14
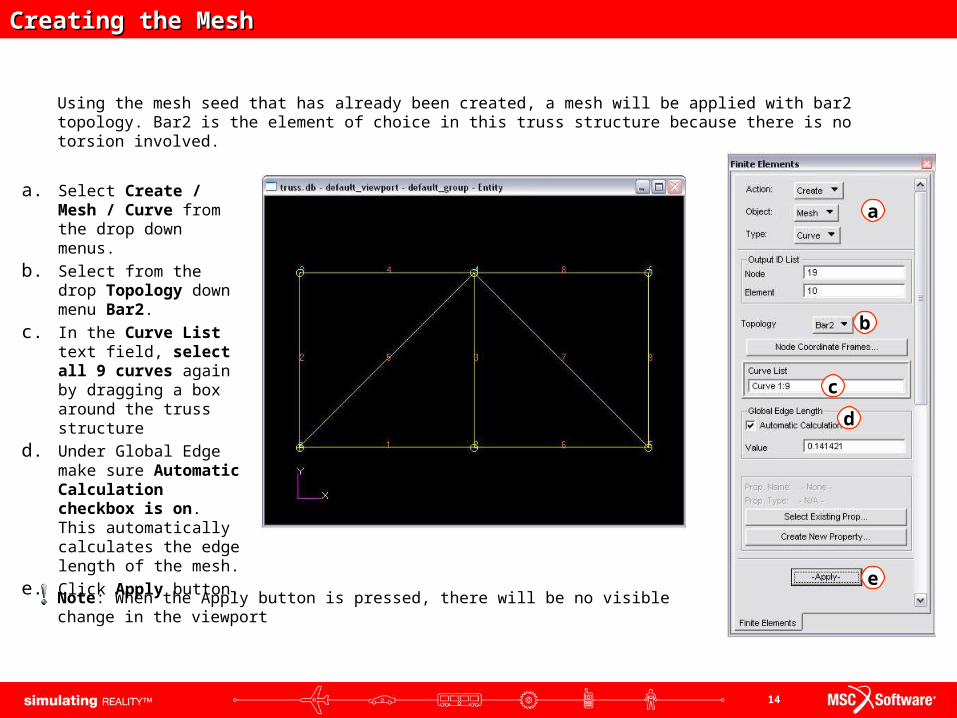
a. Select Create / Mesh / Curve from the drop down menus.
b. Select from the drop Topology down menu Bar2.
c. In the Curve List text field, select all 9 curves again by dragging a box around the truss structure
d. Under Global Edge make sure Automatic Calculation checkbox is on. This automatically calculates the edge length of the mesh.
e. Click Apply button.
a
b
c
d
e
Creating the MeshCreating the Mesh
Using the mesh seed that has already been created, a mesh will be applied with bar2 topology. Bar2 is the element of choice in this truss structure because there is no torsion involved.
Note: When the Apply button is pressed, there will be no visible change in the viewport

15
a. Select Equivalence / All / Tolerance Cube from the drop down menus
b. In the Equivalencing Tolerance textbox enter 0.001
c. Click Apply button.
d. Note in the History Window that 12 nodes have been eliminated. This is because each bar member has two nodes (one at each end). Since the bar elements are connected at the joints only one node is needed, so the overlapping nodes gets removed.
a
b
c
d
Equivalencing the Nodes with Tolerance CubeEquivalencing the Nodes with Tolerance Cube

16
a
a. Click on Load/BCs icon.
b. Select Create / Displacement / Nodal from the drop down menu.
c. Enter New Set Name to be leftfix.
d. Select: Input Data …
e. Set Translation: <0 0 0>. This means that its being constrained in the <x y z> directions.
f. Click OK button.
g. Select: Select Application Region ....
h. Under Geometry Filter select Geometry radio button.
i. In the Select Geometry Entities textbox click on Point 1 (lower left point of the structure in the viewport window).
j. Selection window will appear which Point 1 should be clicked.
k. Click Add button.
l. Click OK button.
m. Click Apply button.
b
cf
e
dg
h
i
k
j
Creating Boundary Condition for Fixed SupportCreating Boundary Condition for Fixed Support
l
m

17
a. Select Create / Displacement / Nodal from the drop down menu.
b. Enter New Set Name to be rightroller.
c. Click on Input Data … button.d. Set Translation: < ,0,0>. This will
allow the constrain to move freely in the x-direction but not on the y nor z direction.
e. Click OK button.f. Click on Select Application
Region .... buttong. Under Geometry Filter select the
Geometry radio button.h. In the Select Geometry Entities
textbox, click on Point 5 (lower right point on the structure).
i. A Selection Window will appear. Click on Point 5.
j. Click Add.k. Click OK.l. Click Apply.
a
b
c
f
e
d
g
h
i
k
j
Creating Boundary Condition for Roller SupportCreating Boundary Condition for Roller Support
l

18
a. Select Create / Force / Nodal from the drop down menus.
b. In the New Set Name textbox enter topload.
c. Click on Input Data … button.d. In the Force text field enter
<0 -100 0>.This means that the force applied is in the <x y z> direction. So in this case, there is only 100N in the negative y-direction.
e. Click OK button.f. Click on Select Application
Region .... button.g. In the Geometry Filter, select the
Geometry radio button. h. In the Select Geometry Entities
text field click on Point 4 (center point on the structure’s top).
i. A Selection Choice window will appear, click on Point 4.
j. Click Add.k. Click OK.l. Click Apply.
a
b
cf
e
dg
h
i
k
j
Creating Nodal Force LoadCreating Nodal Force Load
l

19
a. Constraint of 0.0 at the point in the 1 2 3 directions (x, y, and z translation).
b. Constraint of 0.0 at the point in the 2 3 directions (y and z translation).
c. Force at the point of 100 Newtons in the negative y-direction.
ab
c
Summarizing Load / Boundary ConditionsSummarizing Load / Boundary Conditions

20
a. Click on Materials icon.
b. Select Create / Isotropic / Manual Input from the drop down menus.
c. Enter Aluminum for the Material Name text field.
d. Click on: Input Properties … button.
e. Select Linear Elastic from the Constitutive Model drop down menu.
f. Enter 7e10 in the Elastic Modulus text field.
g. Enter 0.3 in the Poisson Ratio text field.
h. Click OK button.
i. Click Apply button.
a
b
c
f
e
d
g
h
Creating Material PropertiesCreating Material Properties
i

21
a. Click on Properties icon
b. Select Create / 1D / Rod from the drop down menus
c. Enter truss1 in the Property Set Name text field.
d. Click on Input Properties … button
e. Click the Mat Prop Name button.
f. Select “Aluminum” from the select material window..
g. Enter 9e-4for the Area text field.
h. Click OK button.
i. In the Select Members text field, select all members by click and dragging a square over entire truss.
j. Click Add button.
k. Click Apply button.
a
b
c
fe
dh
i
k
d
g
j
Applying Material PropertiesApplying Material Properties
22
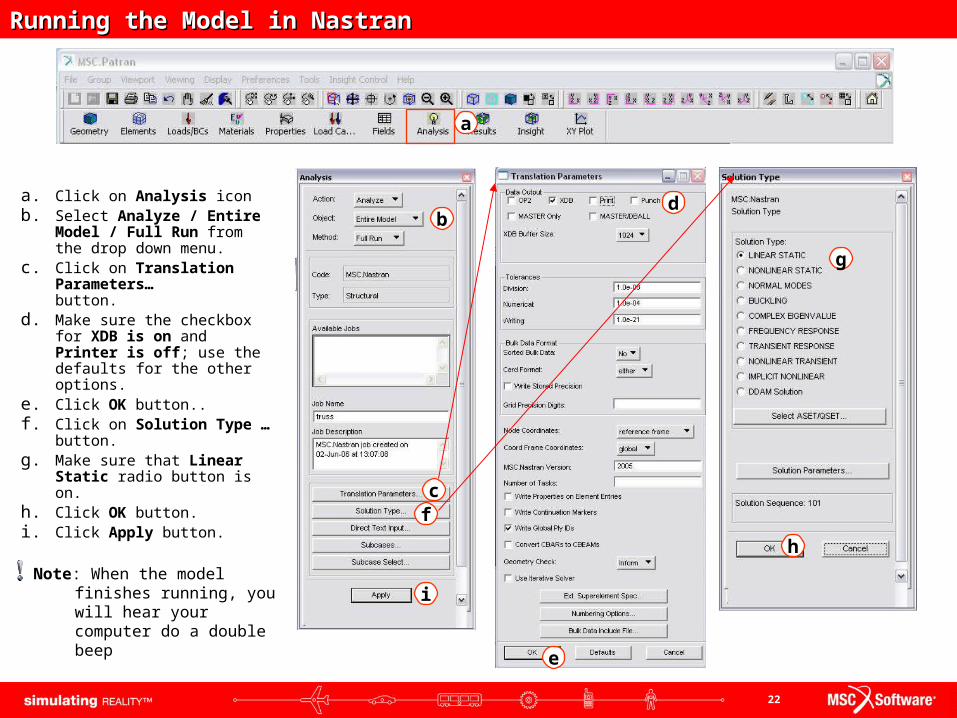
a. Click on Analysis iconb. Select Analyze / Entire Model
/ Full Run from the drop down menu.
c. Click on Translation Parameters… button.
d. Make sure the checkbox for XDB is on and Printer is off; use the defaults for the other options.
e. Click OK button..f. Click on Solution Type …
button.g. Make sure that Linear Static
radio button is on. h. Click OK button.i. Click Apply button.
a
b
g
h
f
e
c
d
Running the Model in NastranRunning the Model in Nastran
iNote: When the model finishes
running, you will hear your computer do a double beep
23
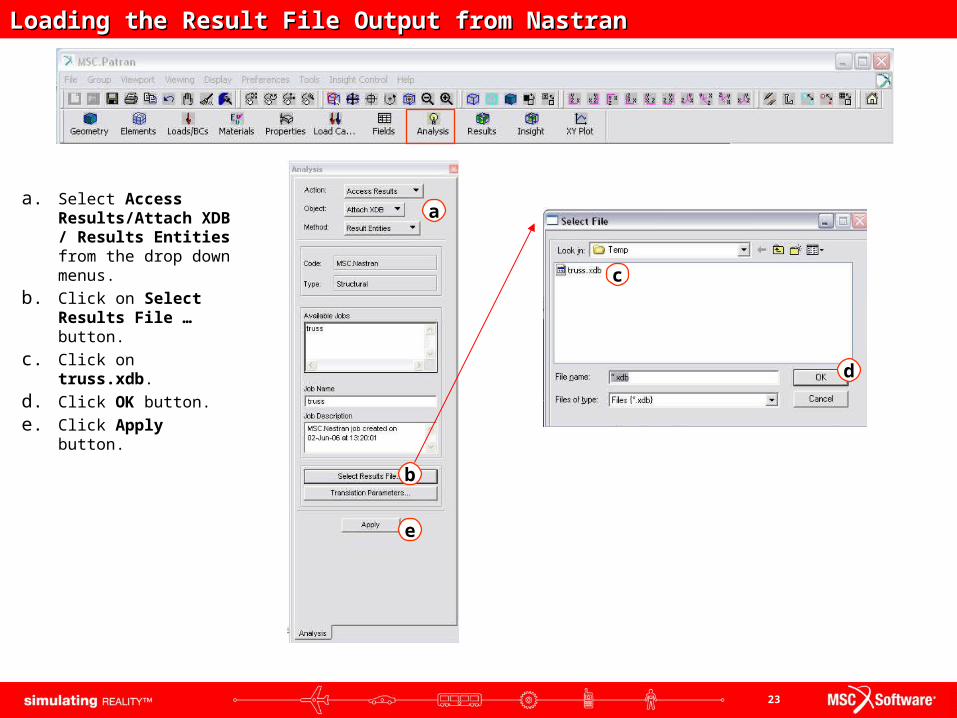
a. Select Access Results/Attach XDB / Results Entities from the drop down menus.
b. Click on Select Results File … button.
c. Click on truss.xdb.
d. Click OK button.
e. Click Apply button.
a
b
c
e
d
Loading the Result File Output from NastranLoading the Result File Output from Nastran

24
a. Click on Results icon
b. Select Create / Quick Plot from drop down menus.
c. Under Select Results Cases click on DEFAULT, A1:Static Subcase.
d. Under Select Fringe Result click on Displacements, Translational.
e. In the Quantity drop down menu select Magnitude.
f. Under Select Deformation Result click on Displacements, Translational.
g. Click Apply button.
a
b
c
f
e
d
Displaying Displacement Fringe PlotDisplaying Displacement Fringe Plot

25
a. Under Select Fringe Result click on Stress Tensor.
b. From the Quantity drop down menu select X Component.
c. Under Select Deformation Result click on Displacements, Translational.
d. Click Apply button.a
b
c
d
Displaying Stress Fringe PlotDisplaying Stress Fringe Plot

26
a. Select Create / Marker / Vector from the drop down menus.
b. Under Results Cases select DEFAULT, A1:Static Subcase.
c. Under Vector Result select Constraint Forces, Translational.
d. In the drop down menu labeled Show As select Resultant.
e. Click Apply button.
a
b
c
e
d
Displaying Reaction Forces in Fringe PlotDisplaying Reaction Forces in Fringe Plot

27
a. Under your default directory where the files were saved, open truss.f06 using a simple text editor (notepad or WordPad) and scroll down to SPCFORCE RESULTANT.
a
Opening *.f06 File for Additional InformationOpening *.f06 File for Additional Information
Note:This shows the value of the resultant, or reaction, forces and moments. This file also contains all the processed results from MSC.Nastran.

28
Summary of Results of FEA on Given Truss ModelSummary of Results of FEA on Given Truss Model
• Maximum stress (x-direction) occurs at node 1 with a value of 4.47x10⁴Pa.
• Minimum stress (x-direction) occurs at node 4 with a value of 0 Pa.
• Maximum displacement occurs at node 2 with a value of 3.14x10⁻⁷m.
• Minimum displacement occurs at node 1 with a value of 0 m.
• Reaction forces for both roller and fixed support are 50 Newtons in the positive y-direction.

29
Important Skills AcquiredImportant Skills Acquired
• Creating a new database file
• Creating curves with vectors
• Creating mesh seed with vectors
• Creating Bar2 mesh with the mesh seed
• Equivalence model
• Creating point load
• Creating boundary condition constrains for roller support & fixed support
• Displaying results: displacement and stress fringe plots as well as resultant reactive forces at support
• Reading results from *.f06 file

30
Further Analysis (Optional)Further Analysis (Optional)
• Are there enough trusses in the frame of the bridge? (or do you think additional members will improve the design?)
• What changes can be made to increase the factor of safety without adding additional trusses? (ie. Cross-sectional

31
Best PracticesBest Practices
• Consistency in unit systems
• Verify the support types and the constrains that are related to such boundary conditions.
• Verify that the results are correct and make sense either through hand calculation or experimental experiments
• do not always take the answer from the computer model to be correct due to discrepancies of conditions that is being analyzed
• If an error appear on the analysis run of the model and is abruptly terminated, DO go back and open the *.f06 file to identify where the error was located to quickly fix it.