Embed Size (px)
Citation preview

1
Brain orchestration of pregnancy and maternal 1
behavior in mice 2
3
David André Barrière1,2#, Arsène Ella1,3, Frédéric Szeremeta4, Hans Adriaensen1, William 4
Même4, Elodie Chaillou1, Martine Migaud1, Sandra Même4, Frédéric Lévy1, 5
Matthieu Keller1,# 6
7
1 Physiologie de la Reproduction et des Comportements, UMR INRAE/CNRS/Université de 8
Tours/IFCE, Nouzilly, France. 9
2 Université Paris-Saclay, CEA, CNRS, BAOBAB, NeuroSpin, 91191, Gif-Sur-Yvette, France. 10
3 MRC Cognition and Brain Sciences Unit, University of Cambridge, UK. 11
4 Complexes Métalliques et IRM, Centre de Biophysique Moléculaire, UPR 44301 CNRS, 12
Orléans, France. 13
14
#Corresponding authors: 15

2
Abstract 17
Reproduction induces changes within brain to prepare for gestation and motherhood. However, 18
the dynamic of these central changes and their relationships with the development of maternal 19
behavior remain poorly understood. Here, we describe a longitudinal morphometric 20
neuroimaging study in female mice between pre-gestation and weaning, using new magnetic 21
resonance imaging (MRI) resources comprising a high-resolution brain template, its associated 22
tissue priors (60-µm isotropic resolution) and a corresponding mouse brain atlas (1320 regions 23
of interest). Using these tools, we observed transient hypertrophies not only within key regions 24
controlling gestation and maternal behavior (medial preoptic area, bed nucleus of the stria 25
terminalis), but also in the amygdala, caudate nucleus and hippocampus. Additionally, unlike 26
females exhibiting lower levels of maternal care, highly maternal females developed transient 27
hypertrophies in somatosensory, entorhinal and retrosplenial cortices among other regions. 28
Therefore, coordinated and transient brain modifications associated with maternal performance 29
occurred during gestation and lactation. 30
31
Key words: Gestation, lactation, maternal brain, MRI, atlas, voxel-based morphometry. 32
3
Abbreviations: 33
AC-PC: anterior commissure-posterior commissure 34
AMBMC: Australian Mouse Brain Mapping Consortium 35
AOB: accessory olfactory bulb 36
BNST: bed nucleus of the stria terminalis 37
CNS: central nervous system 38
CSF: cerebrospinal fluid 39
DARTEL: diffeomorphic anatomical registration using exponentiated lie algebra 40
df: degree of freedom 41
FA: flip angle 42
FLASE: fast large-angle spin-echo 43
FoV: field of view 44
MRI: magnetic resonance imaging 45
MOB: main olfactory bulb 46
mPOA: medial preoptic area 47
GM: gray matter 48
GMC: gray matter concentration 49
PVN: paraventricular nucleus of the hypothalamus 50
RARE: rapid acquisition with relaxation enhancement 51
ROC: receiver operating characteristic 52
ROI: region of interest 53
TE: echo time 54
TR: repetition time 55
VBM: voxel-based morphometry 56
WM: white matter 57
4
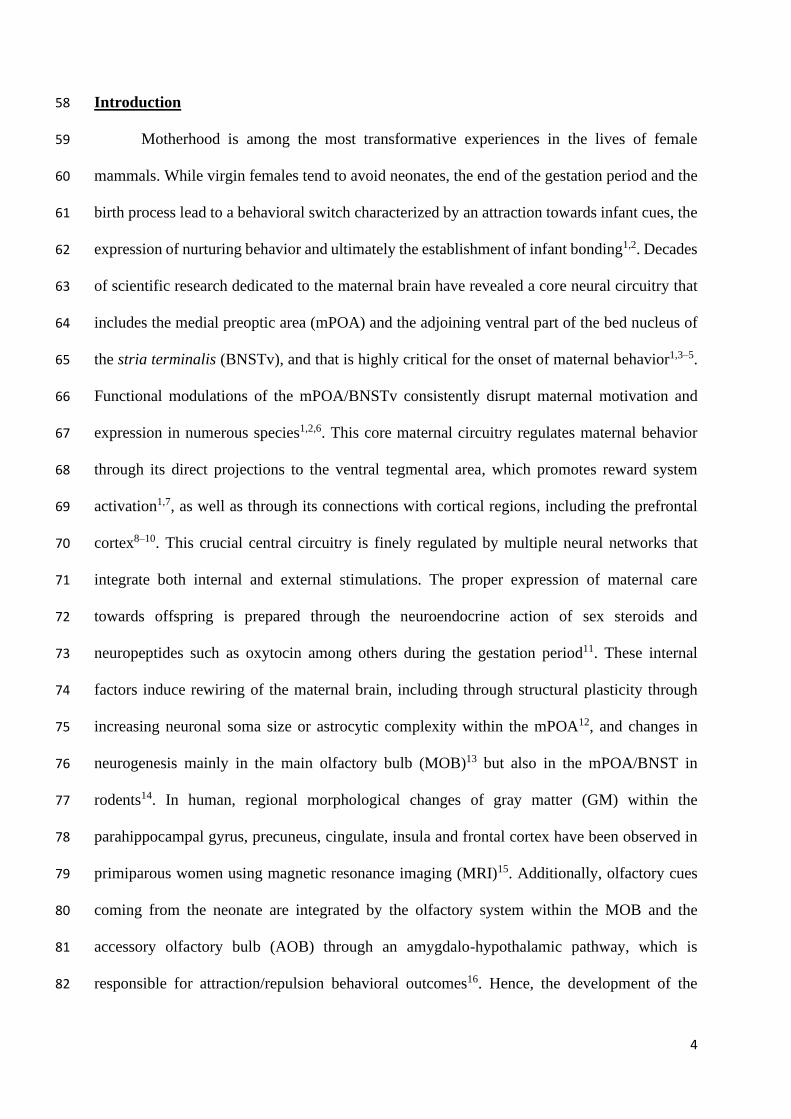
Introduction 58
Motherhood is among the most transformative experiences in the lives of female 59
mammals. While virgin females tend to avoid neonates, the end of the gestation period and the 60
birth process lead to a behavioral switch characterized by an attraction towards infant cues, the 61
expression of nurturing behavior and ultimately the establishment of infant bonding1,2. Decades 62
of scientific research dedicated to the maternal brain have revealed a core neural circuitry that 63
includes the medial preoptic area (mPOA) and the adjoining ventral part of the bed nucleus of 64
the stria terminalis (BNSTv), and that is highly critical for the onset of maternal behavior1,3–5. 65
Functional modulations of the mPOA/BNSTv consistently disrupt maternal motivation and 66
expression in numerous species1,2,6. This core maternal circuitry regulates maternal behavior 67
through its direct projections to the ventral tegmental area, which promotes reward system 68
activation1,7, as well as through its connections with cortical regions, including the prefrontal 69
cortex8–10. This crucial central circuitry is finely regulated by multiple neural networks that 70
integrate both internal and external stimulations. The proper expression of maternal care 71
towards offspring is prepared through the neuroendocrine action of sex steroids and 72
neuropeptides such as oxytocin among others during the gestation period11. These internal 73
factors induce rewiring of the maternal brain, including through structural plasticity through 74
increasing neuronal soma size or astrocytic complexity within the mPOA12, and changes in 75
neurogenesis mainly in the main olfactory bulb (MOB)13 but also in the mPOA/BNST in 76
rodents14. In human, regional morphological changes of gray matter (GM) within the 77
parahippocampal gyrus, precuneus, cingulate, insula and frontal cortex have been observed in 78
primiparous women using magnetic resonance imaging (MRI)15. Additionally, olfactory cues 79
coming from the neonate are integrated by the olfactory system within the MOB and the 80
accessory olfactory bulb (AOB) through an amygdalo-hypothalamic pathway, which is 81
responsible for attraction/repulsion behavioral outcomes16. Hence, the development of the 82

5
maternal brain is dependent of the integration of both external and internal cues acting through 83
multiple brain pathways and regions to prepare the brain to gestation and motherhood. 84
Nevertheless, the relationship between the brain rewiring over the gestation and lactation 85
periods and the establishment of the maternal behaviors are poorly documented. 86
To assess the dynamics of the maternal brain, a longitudinal MRI morphometric study 87
over a complete reproductive experience was performed in mouse to investigate changes in the 88
gray matter concentration (GMC) using voxel-based morphometry (VBM). VBM is a well-89
established and well-validated image analysis technique that provides an unbiased and 90
comprehensive assessment of anatomical differences throughout the brain, and has been 91
successfully used to study GM changes within the mouse brain17–21. However, available mouse 92
brain MRI resources are often partial or provided in different spatial orientations or spatial 93
resolutions (Table 1). As an example, the Australian Mouse Brain Mapping Consortium 94
(AMBMC), offers a high resolutive template and a detailed atlases of the mouse brain including 95
the cerebellum22, hippocampus23, diencephalon24 and cortices25. Unfortunately, segmentation 96
of the olfactory bulb and hindbrain is lacking, and this resource does not provide associated 97
tissues probabilistic maps necessary for VBM. In other hand, the Allen Mouse Brain Common 98
Coordinate Framework, is the most advanced mouse brain atlas26. This new atlas delimitates 99
discrete structures within the thalamus, hindbrain, olfactory system and diencephalon and 100
provides a full segmentation of cortical layers however, MRI template and brain tissues priors 101
are still lacking for VBM investigations. 102
Thus, we combined these resources and we associated probabilistic maps to emulate a 103
complete resource dedicated to the mouse brain. Using these resources and a longitudinal VBM 104
approach, we were able to assess the dynamic morphological changes of the brain during the 105
whole reproductive period and demonstrate how these changes predicts the quality of maternal 106
behavior. 107

6
Results 108
Mouse MRI atlas 109
VBM strategies require a template image and its associated priors of gray matter (GM), 110
white matter (WM) and cerebrospinal fluid (CSF) for brain segmentation and normalization. In 111
addition, a complete atlas of the mouse brain is mandatory for the identification of regions of 112
interest (ROIs) highlighted by the VBM analysis. Given the limitations of available tools to 113
thoroughly study GMC changes during the gestation and lactation periods in mice, we 114
developed first a new set of resources using the AMBMC, an ultra-high-resolution template 115
built from ex vivo brain images finely normalized within the same space25 and the Allen Mouse 116
Brain Common Coordinate Framework26 (Figure 1). Our resources comprise the following four 117
components: 1) a complete mouse brain template with a spatial resolution suitable for mouse 118
brain analysis (60-µm isotropic resolution); 2) the corresponding GM, WM and CSF 119
probabilistic maps for brain normalization together with a VBM analysis built from 138 T2-120
weighted images; 3) a complete mouse brain atlas derived from Paxinos and Franklin’s mouse 121
brain atlas27 and composed of a mosaic of 1320 ROIs (Figure 2A); 4) a brain mesh permitting 122
brain plot generation and data visualization (Figure 2B and Supplemental Video 1). We 123
visually inspected and carefully checked the results of the normalization process against the 124
original coregistered atlas. Then, the labeled structures were reclassified and aggregated 125
according to the brain regions to which they belonged (auditory, insular, temporal cortices, 126
etc.), with respect to their anatomical topography (cortex, basal ganglia, etc.), tissue type (GM, 127
WM and CSF) and hemisphere (left or right). Cortical structures were subdivided into 128
functional (e.g., primary and secondary motor cortices) or structural (agranular, dysgranular, 129
agranular/dysgranular, granular and posterior agranular insular cortices) areas (Figure 2C), as 130
well as into different cortical layers (Figure 2D). Subcortical structures, as for example, the 131

7
hypothalamus (Figure 2E) and the hippocampus (Figure 2F), were fully segmented according 132
to Paxinos and Franklin’s atlas27. 133
134
Morphometric changes occurred during the gestation and lactation periods 135
Next, we used our new resources to study the variations of GMC in mouse brain from 136
the beginning of gestation until weaning. Using MRI T2-weighted anatomical acquisitions, we 137
estimated the GMC maps that offer for each animal a global estimation of the GM. Longitudinal 138
comparison of GMC between the control and parous groups permits to highlight local 139
modifications of GM during the experience. A comparison of baseline and early gestation GMC 140
maps between the control and parous groups did not reveal significant differences. However, at 141
the end of the gestation period, significant increases in GMC were observed within several brain 142
regions in the parous group compared to the control group (Table S1 and Figure 3A). Time 143
course analysis revealed differences in GMC profiles between control and parous groups at the 144
end of the gestation period, early in lactation and at the end of the lactation period. Specifically, 145
GMCs within the mPOA and the BNST were consistently significantly higher in the parous 146
group at that times. In addition, within the agranular insular cortex in the late gestation period 147
and the early lactation period, GMC was significantly higher in parous group compare to control 148
group (Figure 4A). During the early lactation period, we also found specific and significant 149
increases in GMCs of the parous group within numerous brain regions (Table S2 and Figure 150
3B). Among these structures, the hippocampus (CA1 layer), amygdalar area and piriform area 151
showed a transient increase in GMC at the early lactation time point that returned to baseline 152
values at the end of the lactation period in parous group compared to control group (Figure 153
4B). In contrast, the caudate putamen, arcuate nucleus and paraventricular nucleus of the 154
hypothalamus (PVN) showed significantly higher GMCs in the parous mice than in the control 155
mice during the lactation period (Table S3and Figures 3C and 4C). Together, our data 156

8
demonstrate that the late gestation period is associated with a pronounced increase in GMC in 157
the mPOA/BNST, the core neural system of maternal motivation, lasting up to the late lactation 158
period. Furthermore, the early lactation period is associated with increased GMC in other key 159
maternal motivation areas in midbrain regions, including the hypothalamus, caudate putamen 160
and amygdala. These GMC differences between both groups were no longer observed after 161
weaning. 162
163
Morphometric changes during gestation predict the quality of maternal behavior 164
In the last part of this work, we evaluated whether these morphometric changes might 165
reflect differences in maternal performance. Based on 15 min of behavioral observation during 166
the pup retrieval test performed one week after birth, we evaluated the maternal performance 167
of each mother by measuring the first, second and third pup retrieval times, pup-licking 168
duration, crouching time, rearing time, digging time and self-grooming time (Figure 5A). 169
Interestingly, we observed a large distribution of values for both crouching (284.2 s, SD ± 268.7 170
s) and digging (98.22 s, SD ± 159.3 s) durations within the parous group. Whereas crouching 171
duration relates to maternal behavior, digging duration is widely recognized as a discriminative 172
marker of stress-related behavior in rodents28. Hence, we used crouching and digging durations 173
to cluster animals using the k-means clustering procedure, thereby clustering parous animals 174
into a high maternal behavior group (those with a high crouching time and low digging time) 175
and a low maternal behavior group (those with low crouching time and high digging time). 176
A comparison of maternal performance parameters between the two clustered groups 177
revealed significantly lower crouching and pup-licking times and a significantly higher digging 178
time (Figure 5B) in the low maternal behavior group (n=6) than in the high maternal behavior 179
group (n=6). Moreover, a comparison of GMC maps revealed both cortical and subcortical 180
differences between the two clustered groups, mainly in the late gestation period (Table S4 and 181

9
Figure 5C) but also during the early lactation period (Table S5 and Figure 5D). Indeed, 182
transient increases in GMCs within the entorhinal area, lateral part of the orbital area, accessory 183
olfactory bulb (AOB), and medial preoptic nucleus that were observed at the end of pregnancy 184
in the high maternal behavior group were absent in the low maternal behavior group (Figure 185
6A). In addition, the high maternal behavior group showed consistent higher GMCs in the 186
hippocampus, retrosplenial area and barrel field of the primary somatosensory cortex (Figure 187
6B) from the end of the gestation until the end of the lactation period. 188
Interestingly, using a receiver operating characteristic (ROC) analysis, we found that 189
GMCs values within the entorhinal area and AOB at late gestation are reliable predictors for 190
mouse maternal performance after birth. These GMC values significantly distinguished low 191
maternal performance from high maternal performance postpartum (entorhinal area: sensitivity 192
= 100, confidence interval (CI) = 61% to 100%; specificity = 83, CI = 44% to 99%; likelihood 193
ratio = 6; Figure 7A; AOB: sensitivity =100, CI = 61% to 100%; specificity = 83, CI = 44% to 194
99%; likelihood ratio = 6, Figure 7B). The GMC values of both the entorhinal area and AOB 195
observed at late gestation were also significantly correlated with maternal behavior (crouching 196
and digging times). These results reveal that the GMC differences in olfactory (AOB and 197
entorhinal cortex) and mnesic (entorhinal area)-related brain regions occurring during the late 198
gestation period significantly predicted the quality of maternal behavior. 199

10
Discussion 200
Using a new comprehensive neuroimaging resources dedicated to mouse brain, this 201
longitudinal study reveals that pregnancy and lactation coincide with pronounced and transient 202
cerebral changes. Transient increases in GMCs were observed in key regions controlling 203
maternal behavior (mPOA, BNST, and PVN), as well as regions involved in emotions 204
(amygdala), in motivation and reward (caudate nucleus, orbitofrontal cortex) and in mnesic 205
functions (hippocampus). Interestingly, increase in GMC was also revealed in the insular cortex 206
thought to link social and emotional skills. Moreover, we showed that females expressing high 207
levels of maternal behavior had developed specific increases in GMCs in structures involved in 208
olfactory (MOB and AOB) and somatosensory (somatosensory cortex) information processing, 209
in memory (hippocampus, entorhinal cortex, retrosplenial cortex) and in reward and 210
reinforcement (striatum). Interestingly, these hypertrophies were already significant at the end 211
of the gestation period thus being predictive of the quality of maternal care (Supplemental 212
Video 2). 213
214
Implementation of new resources to support the analysis of mouse brain MRI data 215
The use of preclinical MRI is a target of growing interest for the study of the brain 216
structure and function in both healthy and pathological conditions. The use of advanced MRI 217
techniques, coupled with the development of advanced animal models, is a powerful way to 218
push new breakthroughs in the understanding of brain functioning and pathology. Herein, in 219
the first step in our study, from the recent major advances in the development of brain mouse 220
atlas we generated a new set of neuroinformatic tools offering for the first time a complete 221
resource dedicated to MRI studies of the mouse brain, namely, an accurate brain atlas (1320 222
ROIs), a high-resolution brain template and the associated GM, WM and CSF priors (60-µm 223
isotropic resolution). The GM, WM and CSF probabilistic maps built and used in this study 224
11
were calculated from 138 T2-weighted anatomical images, resulting in robust tissue class priors 225
not only for VBM analysis but also for functional MRI and diffusion tensor imaging analysis 226
in mice. 227
This comprehensive set of MRI compatible template and atlas for the mouse brain, 228
allows a unified and standardized analysis of multimodal mouse brain MRI data and paves the 229
way for the development of multicentric preclinical studies. Indeed, in neurosciences, animal 230
models deliver crucial information for the understanding of brain structure and function both in 231
healthy and pathological conditions. Our template and mouse brain atlas were conceived to 232
bridge the gap between basic and clinical neurosciences by providing to the preclinical 233
neuroimaging community specific resources designed to be used in conjunction with the 234
neuroinformatic tools and methodologies commonly used in human MRI studies. We anticipate 235
that these resources will help neuroscientists to conduct their analyses of anatomical and 236
functional datasets in a more standardized way, with the final goal of reaching more 237
reproducible conclusions (https://www.nitrc.org/projects/tmbta_2019). 238
239
Gestation and lactation periods induce strong but transient GMC hypertrophy 240
The establishment of accurate mouse MRI resources permit to study the variations of 241
GMC longitudinally, in vivo and during the gestation and lactation periods in female mice. We 242
observed that several brain regions became transiently hypertrophic during pregnancy or in the 243
lactation period until weaning. A set of structures comprising the core of the maternal circuit – 244
especially the mPOA and BNST – displayed long-lasting hypertrophy that started at the late 245
gestation, culminated during the first week of lactation, and then disappeared at the weaning. 246
The initial GMC increase observed during the gestation period probably reflects changes 247
induced by hormonal priming11. Indeed, both the mPOA and BNST express a high number of 248
steroid hormone and neuropeptide receptors29,30. These factors are well known to trigger 249

12
significant plasticity changes within the core maternal circuitry that are necessary for the 250
preparation and adaptation of the brain to motherhood3,11. From parturition, the GMC 251
differences observed during the whole lactation period highlight that mPOA/BNST receives a 252
variety of sensory inputs from the pups, integrates that information with the females’ endocrine 253
status, and then projects to brain sites involved in socially-relevant motivation, affective state, 254
and cognition2,31. Pup stimulation, electrolytic and neurotoxic lesions and local steroid hormone 255
injections32–35 have been shown to modify the intrinsic activity of these nuclei and consequently 256
responsible for motivation and expression of maternal behavior. The mPOA is engaged 257
throughout the postpartum period but differentially according to the needs of the developing 258
pups. It has been shown that neurons of the mPOA in late postpartum inhibits maternal 259
responses allowing the changing expression and waning of maternal behavior across 260
postpartum10. The sustained increase in GMC reported in late lactation could reflect the 261
involvement of the mPOA to appropriately influence maternal behavior. 262
Our study highlights another set of brain structure that became hypertrophic only during 263
the period from parturition to weaning – specifically, the PVN and arcuate nucleus of the 264
hypothalamus. These changes illustrate the structural plasticity occurring in these regions. For 265
instance, at parturition and during lactation oxytocin neurons of the PVN undergo dramatic 266
neuronal, glial and synaptic changes such as an increase in size of the oxytocin neurons and an 267
amplification of their synaptic input36. Oxytocin release at parturition facilitates the onset of 268
maternal behavior by acting on the mPOA and is also important for maternal memory37. Finally, 269
lesions of the PVN disrupt the onset of maternal behavior38–40. In the arcuate nucleus, 270
dopaminergic cells are responsible for suckling induced prolactin release41. and neurons 271
projecting to the arcuate nucleus are involved in the maintenance of maternal motivation42. 272
Additionally, we report changes in GMCs found in olfactory related structures (main 273
olfactory bulb, piriform cortex), somatosensory areas and auditory areas which reflect the 274

13
multisensory control of maternal behavior. This finding is in accordance with a functional MRI 275
study performed in rats which demonstrates that pup suckling is associated with increased 276
neuronal activity within the midbrain, striatum and cortical sensory areas (somatosensory, 277
olfactory and auditory cortices)9. 278
GMC variations within the hippocampus and entorhinal cortex, highlight the role of two 279
essential structures involved in learning and memory processing during the reproductive period. 280
Our data support evidence that the hippocampus undergoes profound neural changes during 281
lactation. Indeed, lactating females have elevated spine densities in the hippocampus43 and 282
show significant dendritic remodeling in pyramidal neurons44. Changes in hippocampal 283
neurogenesis occurs during lactation and may support the enhancement of spatial memory 284
necessary to foraging behavior in lactating females43,45. 285
Finally, our study also revealed an hypertrophy of the agranular insular cortex, which 286
has never been reported in this context. The agranular insular cortex is a laminar part of the 287
insular cortex and can be considered as a hub structure linking large-scale brain systems46. 288
Indeed, the insula receives direct thalamic and somatosensory afferents carrying sensitive 289
stimulations. In addition to its sensory afferents, the insula displays structural connectivity with 290
the limbic system (basolateral, lateral and central amygdalar nuclei) as well as with the BNST, 291
mediodorsal nucleus of the thalamus, lateral hypothalamus and perirhinal and lateral entorhinal 292
cortices46. The insula also connects brain regions implicated in motivation and reward, such as 293
the nucleus accumbens and caudate putamen46. Hence, our findings and the current literature 294
suggest that before and after birth, the insular cortex may integrate and combine information 295
from both external and internal stimulation and act as a relay between higher cortical and 296
subcortical structures. Together, our results describe the dynamics of neurophysiological 297
adaptation occurring in the brain from the early gestation period to weaning, thereby ensuring 298
efficient maternal behavior and, by extension, the development of the offspring. 299

14
GMC modification in the olfactory system at the end of the gestation predict the level of 300
maternal behavior post-partum 301
All of these transient modifications of the GMC within the brain of parous animals 302
demonstrate that many structures are involved in the behavioral modifications occurring during 303
pregnancy and motherhood. Hence, in the last part of this work, we sought to determine whether 304
inter-individual variations in maternal behavior were associated with similar variations of 305
GMC. Based on their behavioral performance in the pup retrieval test, we used a k-means 306
clustering strategy to divide maternal female mice into two groups displaying high versus low 307
levels of maternal behavior. This analysis revealed that several transient and several long-308
lasting increases in GMCs were observed in the high maternal behavior group that were absent 309
in the low maternal behavior group. Brain regions showing significant differences included the 310
olfactory bulbs, somatosensory system, limbic system, especially the orbitofrontal area, and 311
mnesic system, including the retrosplenial cortex, hippocampus and entorhinal area. Some of 312
these structures are directly responsive to pup stimulation, and the observed dynamics may have 313
been induced by mother-offspring interactions. For example, higher GMC values in the 314
somatosensory cortex and olfactory bulbs in the high maternal behavior group potentially 315
reflected increased suckling duration and proximity between the mother and pups, respectively. 316
Strikingly, differences in GMCs were detected in the entorhinal area, orbitofrontal area, 317
olfactory bulb, hippocampus, retrosplenial area and primary somatosensory area before 318
parturition; these findings suggest that the maturation of these structures, probably through 319
hormone-dependent plasticity mechanisms, is a key determinant of the intensity of maternal 320
behavior expressed during the lactation period. Using a ROC procedure, we found that GMC 321
values of the entorhinal area and accessory olfactory bulb (AOB) at the end of gestation were 322
significantly predictive of maternal mouse behavior postpartum. Interestingly, previous studies 323
reported in mice showed that during gestation an increase in cell proliferation in the 324

15
subventricular zone, the neurogenic niche which provides newly generated neurons within the 325
olfactory bulb (for review see 13). These adult-born olfactory neurons are fully responsive to 326
pup odor exposure47 and are in part involved in some components of maternal behavior48,49. 327
Hence, the correlations observed between GMC values in AOB at the late gestation time 328
point and maternal behavior after birth suggest that impairments of such neurogenesis processes 329
induce maladaptive neuroendocrine processing of the maternal brain at the end of the gestation 330
period impacting directly the maternal behavior performance postpartum. Taken together, our 331
data provide the first potential imaging-based predictive biomarkers of the quality of maternal 332
behavior and suggest the key role of the maturation of the olfactory system at the end of the 333
pregnancy in the development of adaptative maternal behavior in mice. 334
335
Conclusion 336
In conclusion, our study provides a new generation of neuroinformatic tools which will 337
help basic neuroscientists to conduct structural and functional MRI investigations. Using these 338
resources, we found that the development of the maternal brain is associated with substantial 339
mesoscopic changes in critical regions. These modifications can be interpreted as cell size 340
changes, neural or glial cell genesis/apoptosis, spine density or blood flow modifications50–52. 341
As cellular and molecular plasticity events are key for the adaptation of the brain to motherhood; 342
therefore, these changes in GMC must be correlated with molecular, cellular and behavioral 343
investigations to obtain a more precise view of the physiological mechanisms responsible for 344
GMC variations. 345

16
Methods 346
Animals. Twenty-three female RjOrl:SWISS virgin mice (8 weeks old; 20-25 g; Janvier 347
Laboratory, Le Genest-Saint-Isle, France) were maintained on a 12-h light/dark cycle with 348
access to food (standard chow) and water ad libitum. Animals were acclimatized 6 per cage to 349
the housing facility for 7 days prior to manipulation. Females were randomly divided into two 350
groups: a parous group (n = 12), in which each female was exposed to a male (RjOrl:SWISS,8 351
weeks old; 20-25 g; Janvier Laboratory, Le Genest-Saint-Isle, France) for 5 days, became 352
pregnant, and raised their offspring (litter size: 6 to 14 pups) until weaning at 21 days 353
postpartum, and a control group (n = 11), in which virgin females were not exposed to male 354
mice. Each parous female was individually housed after exposure and with its offspring 355
postpartum. Control females were housed together in a separate room from parous females. 356
The MRI protocol was optimized to keep mice anesthetized for 2 h during each of the 357
six acquisitions. During lactation MRI acquisitions, pups were kept under a heat lamp. One 358
week after birth, maternal behavior was assessed as described in the behavioral section. All 359
experiments were conducted in accordance with the local research ethics committee (APAFIS 360
#6626-201002281145814V1) and are reported in accordance with the ARRIVE guidelines. 361
362
MRI acquisition. In vivo 3D MRI of the entire brain was performed three days before male 363
exposure (baseline), at one week of gestation (early gestation), two days before the expected 364
day of birth (late gestation), one week postpartum (early lactation), three weeks postpartum 365
(late lactation) and two weeks after weaning (weaning). One female in the parous group and 366
one female in the control group were scanned under similar conditions on the same day and 367
exposed similarly to anesthesia. 368
Mice were anesthetized using isoflurane (2.5%; induction in O2/air mixture 1:1) (TEM-369
SEGA, F-33600 Pessac, France) and then transferred and placed head first procubitus within 370

17
an MRI-compatible cradle that incorporated a stereotaxic system dedicated for mouse head 371
MRI, connected to a heater with circulating water to maintain body temperature and supplied 372
with 1-2% isoflurane via a fitted mask. Respiration rate was recorded during all the experiments 373
using an MRI-compatible monitoring system (PC-SAM model #1025; SA Instruments Inc., 374
Stony Brook, NY, USA) and used to adjust the isoflurane rate to maintain a rate between 20 375
and 40 respirations per minute. After a recovery period of one hour, mouse returned to her pups. 376
MRI studies were conducted at the Centre de Biophysique Moléculaire d’Orléans and were 377
performed on a 7T/160 mm PharmaScan spectrometer (Bruker Biospin, Wissembourg, France) 378
equipped with an actively shielded B-GA09 gradient set, with 90-mm inner diameter and 300-379
mT/m gradient intensity. A 23-mm inner diameter Bruker birdcage coil with a cradle dedicated 380
to a mouse head was used. Data acquisitions were performed on an Advance III console running 381
ParaVision 5.1 software. T2-weighted images were acquired using a 3D fast large-angle spin-382
echo (FLASE) which allows 3D brain mapping with a high resolution in a suitable time for in 383
vivo acquisition53,54. Thus, sequence with echo time (TE) = 20 ms, 1 repetition, acquisition 384
matrix =160 × 140 × 95, and a field of view (FoV) of 19.2 × 16.8 × 11.4 mm3, resulting in a 385
final resolution of 120 µm isotropic voxels53,54. To obtain the FLASE sequence53, which is a 386
specific sequence that is not included in the sequence package provided with ParaVision, the 387
usual rapid acquisition with relaxation enhancement (RARE) spin-echo sequence was 388
modified; in particular, the RARE-factor was fixed to 1 allowing a flip angle (FA) higher than 389
90° for the excitation pulse, while maintaining a 180° refocusing pulse53. Thus, T2-weighted 390
images were obtained with a repetition time (TR) as short as 300 ms, 10 times lower than that 391
needed for a classical T2-weighted spin-echo sequence. The sequence was optimized for 392
acquisition in 1 h 28 min, with an isotropic resolution of 120 µm, a TR of 300 ms, an TE of 20 393
ms, an excitation pulse (FA) of 115°, with 1 repetition and with a matrix of 160 x 140 x 95 394
corresponding to a FoV of 19.2 x 16.8 x 11.4 mm3 and contained the whole mouse brain. 395
18
Maternal behavioral test. One week after birth, the maternal behavior of each female was 396
evaluated using the pup retrieval test55. Briefly, three pups were removed from the nest and 397
placed at three different corners within the home cage. The latency to retrieve each pup and the 398
time spent licking the pups, crouching in the nest over the pups and performing nonmaternal 399
behaviors such as self-grooming and digging were recorded over 15 min. Retrieval was defined 400
as the animal picking up a pup and transporting it to the nest. Crouching was defined as the 401
animal assuming the nursing posture. Nursing and licking were permitted whether they took 402
place in the nest. All videos were analyzed using BORIS software version 4.1.4. 403
404
K-means clustering. Clustering analysis of the behavioral data was performed using MATLAB 405
Simulink 10b (The Mathworks, Inc., USA). Normality was verified and no outlier subjects were 406
detected. To classify animals according to their maternal performance, a k-means clustering 407
algorithm was used with crouching and digging times as behavioral markers. Digging was 408
chosen because it is indicative of high maternal stress28,56. This algorithm iteratively grouped 409
the animals by creating k initial centroids, assigning each animal to the closest centroid, 410
iteratively re-calculating the centroids from the mean of its assigned animals and re-assigning 411
the animals to each centroid until there were no more changes across iterations57. This clustering 412
divided parous animals into a high maternal behavior group (with high crouching and low 413
digging time) and low maternal behavior group (with low crouching and high digging time). 414
415
Mouse brain template and atlas building. For the MRI protocol, we developed a brain template 416
and an atlas from the AMBMC brain template and the Allen Mouse Brain Common Coordinate 417
Framework, respectively (Figure 1). First, we down-sampled the AMBMC template and its 418
associated atlases and the Allen Mouse Brain Atlas and its associated Nissl images to a suitable 419
resolution for MRI analysis (60-µm isotropic resolution) (Figure 1, step 1). Then, all images 420

19
were manually aligned to the anterior commissure/posterior commissure (AC/PC) axis, and the 421
center of the images was defined relative to the AC (Figure 1, step 2). The resulting template 422
was then segmented into GM, WM and CSF probability maps using the unified segmentation 423
approach58 of Statistical Parametric Mapping 8 (SPM8) and the mouse brain priors provided by 424
the SPMMouse toolbox (Figure 1, step 3). In parallel, our T2-weighted anatomical images were 425
realigned, coregistered, bias-corrected and normalized to our template. Using the SPMMouse 426
toolbox, we also segmented the images as described above, and from these preprocessed 427
images, we obtained a large set of 138 images for each tissue class (Figure 1, steps 4-7). From 428
these images, we built population-specific GM, WM and CSF priors. To build these priors, for 429
each tissue class, we applied a diffeomorphic anatomical registration using an exponentiated lie 430
algebra (DARTEL) approach, which is an automated, unbiased, and nonlinear template-431
building algorithm59 (Figure 1, step 8). This new set of population-specific tissue priors was 432
used for both atlas building and final VBM preprocessing. 433
To normalize the Allen Mouse Brain Atlas to our brain template, we used the associated 434
Nissl-stained images because (1) Nissl staining corresponds to the GM prior in terms of 435
histology, and (2) this image was already coregistered to the atlas (Figure 1, step 4). Therefore, 436
we applied the segmentation function provided by SPM8 using the GM prior previously 437
calculated from the Nissl image to generate the “Nissl2template” normalization matrix. We 438
used this matrix to normalize the atlas to the template, while avoiding interpolation to maintain 439
the label indices as integers (Figure 1, step 7). Then, a visual inspection of each normalized 440
label was carried out to assess whether the normalization process modified the position and 441
volume of the structure too much. When necessary, holes were filled and labels were redrawn 442
according to Paxinos and Franklin’s atlas and using the FreeSurfer package. Finally, the 443
olfactory bulb and hind brain regions were completed, the corpus collosum and ventricles were 444
drawn from the WM and CSF priors, and the cerebellum labels were replaced by the AMBMC 445

20
cerebellum labels, which are more accurate. Finally, the atlas image was symmetrized (left-446
right). Our mouse brain template, priors and atlas were normalized within the same space and 447
with the same final resolution (60-µm isotropic resolution), resulting in our final mouse brain 448
atlas composed of a mosaic of 1320 ROIs covering the entire brain (Supplemental Video 1). 449
450
VBM data preprocessing. Previously preprocessed normalized T2-weighted data were 451
segmented into GM, WM, and CSF within SPM8 using the images of the population-specific 452
priors (Figure 1, step 9). Then, to produce a more accurate registration within each mouse as 453
well as across all mice, a longitudinal VBM analysis was applied using the strategy described 454
by Asami et al60. First, a subject-specific template was created by the DARTEL algorithm using 455
the previous tissue class images (i.e., GM, WM, and CSF maps) obtained from each mouse for 456
the six time points. The DARTEL procedure releases individual-specific flow field maps, 457
permitting the application of diffeomorphic normalization on images of each tissue class to 458
spatially normalize each time point on a subject-specific template space. Each normalized tissue 459
class image was modulated by the Jacobian determinant to account for the expansion and/or 460
contraction of brain regions over time. Then, a population-specific template was created by the 461
DARTEL algorithm using all subject-specific templates of the tissue class images. Here, the 462
DARTEL procedure releases population-specific flow field maps, permitting the application of 463
diffeomorphic normalization of each animal onto the images of each tissue class. Finally, tissue 464
class images were modulated by the Jacobian determinant, and the final modulated GM images 465
were spatially smoothed with an isotropic Gaussian kernel with a 3-mm full-width at half-466
maximum and convolved with GMC images to create GMC maps (Figure 1, steps 10-12). 467
VBM statistics and analysis. SPM8 was used to reveal the temporal and regional changes in 468
the GMC maps. A second-level SPM analysis comprising a flexible factorial model, which is 469
equivalent to a 2×2 mixed-model ANOVA with group as the between-subject factor and time 470

21
point as the within-subject factor, was used to compare the control versus the parous groups 471
and the low versus high maternal behavior groups61. The factors included in the analysis were 472
subjects, group (control versus parous, or low maternal behavior versus high maternal 473
behavior), and time points (baseline, early gestation, late gestation, early lactation, late 474
gestation, and weaning). A brain mask was used to constrain the analysis within the brain. For 475
each cluster, the significance of the peak voxel was set as p < 0.01 (t(126) = 2.356, control versus 476
parous; t(60) = 2.39, low versus high maternal behavior), and the minimum cluster extent was 477
set at 25 voxels. The results are presented on axial brain slice series generated by the Xjview 478
SPM plugin. Corresponding surfacing results were produced with BrainNet viewer 1.662, 479
allowing the generation of both brain meshes and brain plots to visualize and videos. 480
481
Postprocessing statistical analysis. Cluster peaks revealed by the flexible factorial analyses 482
were identified using our atlas and a in situ procedure developed with MATLAB Simulink 10b 483
(The Mathworks, USA). For each comparison, clusters were binarized, and the obtained masks 484
were used to extract GMC values of corresponding regions from the GMC map using the REX 485
plugin. GMC data and behavioral measurements were then compiled and analyzed using 486
GraphPad Prism 6.02 software. GMCs were compared between groups and for each time point 487
using a two-way ANOVA with repeated measures followed by a two-stage setup method of 488
Benjamini, Kriegger and Yekutieli as recommended by the software. Maternal and nonmaternal 489
behaviors of the low maternal and high maternal groups were compared using a 490
multicomparison t-test with a false discovery rate (FDR) approach (Q = 1%). Correlation 491
analyses were performed using a parametric two-tailed Pearson test. Specificity and selectivity 492
analyses were performed using the ROC curve method. Statistical significance was defined as 493
p < 0.05 (*) for these analyses. 494

22
Acknowledgments 495
The authors acknowledge the regional council of Centre Val-de-Loire for funding this research 496
through the IMACERVOREPRO grant (convention 201500104011, 2015-2018) awarded to 497
Matthieu Keller. 498
499
Author Contributions 500
D.A.B. contributed to the atlas and template building, data analysis, drafted and revised the 501
manuscript. A.E. contributed to the imaging sequence troubleshooting, data analysis and 502
contributed to the critical revisions. F.S. contributed to the imaging sequence troubleshooting, 503
data acquisitions and contributed to the analysis and critical revisions. H.A., W.M., E.C., 504
M.M., S.M. and F.L. contributed to the study conception and design and contributed to the 505
critical revisions of the manuscript. M.K., is the principal investigator of the study, raised the 506
funding, coordinated the project and revised and validated the manuscript. 507

23
References 508 1. Numan, M. & Insel, T. R. The neurobiology of parental behavior. (Springer, 2003). 509
2. Lonstein, J. S., Lévy, F. & Fleming, A. S. Common and divergent psychobiological mechanisms underlying 510 maternal behaviors in non-human and human mammals. Horm. Behav. 73, 156–185 (2015). 511
3. Bridges, R. S. Neuroendocrine regulation of maternal behavior. Front. Neuroendocrinol. 36, 178–196 (2015). 512
4. Kohl, J. & Dulac, C. Neural control of parental behaviors. Curr. Opin. Neurobiol. 49, 116–122 (2018). 513
5. Kohl, J., Autry, A. E. & Dulac, C. The neurobiology of parenting: A neural circuit perspective. BioEssays 39, 514 e201600159 (2017). 515
6. Lévy, F. & Keller, M. Olfactory mediation of maternal behavior in selected mammalian species. Behav. Brain 516 Res. 200, 336–345 (2009). 517
7. Numan, M. & Stolzenberg, D. S. Medial preoptic area interactions with dopamine neural systems in the control 518 of the onset and maintenance of maternal behavior in rats. Front. Neuroendocrinol. 30, 46–64 (2009). 519
8. Afonso, V. M., Sison, M., Lovic, V. & Fleming, A. S. Medial prefrontal cortex lesions in the female rat affect 520 sexual and maternal behavior and their sequential organization. Behav. Neurosci. 121, 515–526 (2007). 521
9. Febo, M. A bold view of the lactating brain: functional magnetic resonance imaging studies of suckling in 522 awake dams. J. Neuroendocrinol. 23, 1009–1019 (2011). 523
10. Pereira, M. & Morrell, J. I. Functional Mapping of the Neural Circuitry of Rat Maternal Motivation: Effects of 524 Site-Specific Transient Neural Inactivation: Mapping maternal motivation circuitry. J. Neuroendocrinol. 23, 525 1020–1035 (2011). 526
11. Brunton, P. J. & Russell, J. A. The expectant brain: adapting for motherhood. Nat. Rev. Neurosci. 9, 11–25 527 (2008). 528
12. Kinsley, C. H. & Lambert, K. G. Reproduction-Induced Neuroplasticity: Natural Behavioural and Neuronal 529 Alterations Associated with the Production and Care of Offspring. J. Neuroendocrinol. 20, 515–525 (2008). 530
13. Lévy, F., Gheusi, G. & Keller, M. Plasticity of the Parental Brain: A Case for Neurogenesis: Parental behaviour 531 and neurogenesis. J. Neuroendocrinol. 23, 984–993 (2011). 532
14. Akbari, E. M., Chatterjee, D., Lévy, F. & Fleming, A. S. Experience-dependent cell survival in the maternal 533 rat brain. Behav. Neurosci. 121, 1001–1011 (2007). 534
15. Hoekzema, E. et al. Pregnancy leads to long-lasting changes in human brain structure. Nat. Neurosci. 20, 287 535 (2017). 536
16. Kohl, J. et al. Functional circuit architecture underlying parental behaviour. Nature 556, 326–331 (2018). 537
17. Ashburner, J. & Friston, K. J. Unified segmentation. NeuroImage 26, 839–851 (2005). 538
18. Sawiak, S. J., Wood, N. I., Williams, G. B., Morton, A. J. & Carpenter, T. A. Voxel-based morphometry with 539 templates and validation in a mouse model of Huntington’s disease. Magn. Reson. Imaging 31, 1522–1531 (2013). 540
19. Sawiak, S. J., Picq, J.-L. & Dhenain, M. Voxel-based morphometry analyses of in vivo MRI in the aging mouse 541 lemur primate. Front. Aging Neurosci. 6, (2014). 542
20. Keifer Jr, O. P. et al. Voxel-based morphometry predicts shifts in dendritic spine density and morphology with 543 auditory fear conditioning. Nat. Commun. 6, (2015). 544
21. Lein, E. S. et al. Genome-wide atlas of gene expression in the adult mouse brain. Nature 445, 168–176 (2007). 545
22. Ullmann, J. F. P. et al. Segmentation of the C57BL/6J mouse cerebellum in magnetic resonance images. 546 NeuroImage 62, 1408–1414 (2012). 547
23. Richards, K. et al. Segmentation of the mouse hippocampal formation in magnetic resonance images. 548 NeuroImage 58, 732–740 (2011). 549
24. Watson, C. et al. An ontologically consistent MRI-based atlas of the mouse diencephalon. NeuroImage 157, 550 275–287 (2017). 551
25. Ullmann, J. F. P., Watson, C., Janke, A. L., Kurniawan, N. D. & Reutens, D. C. A segmentation protocol and 552 MRI atlas of the C57BL/6J mouse neocortex. NeuroImage 78, 196–203 (2013). 553
26. Wang, Q. et al. The Allen Mouse Brain Common Coordinate Framework: A 3D Reference Atlas. Cell 181, 554 936-953.e20 (2020). 555
27. Paxinos and Franklin’s the Mouse Brain in Stereotaxic Coordinates, Compact - 5th Edition. 556 https://www.elsevier.com/books/paxinos-and-franklins-the-mouse-brain-in-stereotaxic-coordinates-557 compact/franklin/978-0-12-816159-3. 558
28. Deacon, R. M. J. Digging and marble burying in mice: simple methods for in vivo identification of biological 559 impacts. Nat. Protoc. 1, 122 (2006). 560

24
29. Tsuneoka, Y. et al. Neurotransmitters and neuropeptides in gonadal steroid receptor-expressing cells in medial 561 preoptic area subregions of the male mouse. Sci. Rep. 7, 1–16 (2017). 562
30. McHenry, J. A., Rubinow, D. R. & Stuber, G. D. Maternally responsive neurons in the bed nucleus of the stria 563 terminalis and medial preoptic area: Putative circuits for regulating anxiety and reward. Front. Neuroendocrinol. 564 38, 65–72 (2015). 565
31. Olazábal, D. E. et al. Flexibility and adaptation of the neural substrate that supports maternal behavior in 566 mammals. Neurosci. Biobehav. Rev. 37, 1875–1892 (2013). 567
32. Bridges, R. S. & Hays, L. E. Steroid-induced alterations in mRNA expression of the long form of the prolactin 568 receptor in the medial preoptic area of female rats: Effects of exposure to a pregnancy-like regimen of progesterone 569 and estradiol. Brain Res. Mol. Brain Res. 140, 10–16 (2005). 570
33. Lonstein, J. S. & De Vries, G. J. Maternal behaviour in lactating rats stimulates c-fos in glutamate 571 decarboxylase-synthesizing neurons of the medial preoptic area, ventral bed nucleus of the stria terminalis, and 572 ventrocaudal periaqueductal gray. Neuroscience 100, 557–568 (2000). 573
34. Miceli, M. O., Fleming, A. S. & Malsbury, C. W. Disruption of maternal behaviour in virgin and postparturient 574 rats following sagittal plane knife cuts in the preoptic area-hypothalamus. Behav. Brain Res. 9, 337–360 (1983). 575
35. Lee, A., Clancy, S. & Fleming, A. S. Mother rats bar-press for pups: effects of lesions of the mpoa and limbic 576 sites on maternal behavior and operant responding for pup-reinforcement. Behav. Brain Res. 100, 15–31 (1999). 577
36. El Majdoubi, M., Poulain, D. A. & Theodosis, D. T. Activity-dependent morphological synaptic plasticity in 578 an adult neurosecretory system: magnocellular oxytocin neurons of the hypothalamus. Biochem. Cell Biol. 579 Biochim. Biol. Cell. 78, 317–327 (2000). 580
37. D’Cunha, T. M., King, S. J., Fleming, A. S. & Lévy, F. Oxytocin receptors in the nucleus accumbens shell are 581 involved in the consolidation of maternal memory in postpartum rats. Horm. Behav. 59, 14–21 (2011). 582
38. Insel, T. R. & Harbaugh, C. R. Lesions of the hypothalamic paraventricular nucleus disrupt the initiation of 583 maternal behavior. Physiol. Behav. 45, 1033–1041 (1989). 584
39. Numan, M. & Corodimas, K. P. The effects of paraventricular hypothalamic lesions on maternal behavior in 585 rats. Physiol. Behav. 35, 417–425 (1985). 586
40. Olazábal, D. E., Kalinichev, M., Morrell, J. I. & Rosenblatt, J. S. MPOA cytotoxic lesions and maternal 587 behavior in the rat: effects of midpubertal lesions on maternal behavior and the role of ovarian hormones in 588 maturation of MPOA control of maternal behavior. Horm. Behav. 41, 126–138 (2002). 589
41. Freeman, M. E., Kanyicska, B., Lerant, A. & Nagy, G. Prolactin: structure, function, and regulation of 590 secretion. Physiol. Rev. 80, 1523–1631 (2000). 591
42. Cservenák, M. et al. Thalamic neuropeptide mediating the effects of nursing on lactation and maternal 592 motivation. Psychoneuroendocrinology 38, 3070–3084 (2013). 593
43. Kinsley, C. H. et al. Motherhood and the hormones of pregnancy modify concentrations of hippocampal 594 neuronal dendritic spines. Horm. Behav. 49, 131–142 (2006). 595
44. Pawluski, J. L. & Galea, L. A. M. Hippocampal morphology is differentially affected by reproductive 596 experience in the mother. J. Neurobiol. 66, 71–81 (2006). 597
45. Pawluski, J. L., Walker, S. K. & Galea, L. A. M. Reproductive experience differentially affects spatial reference 598 and working memory performance in the mother. Horm. Behav. 49, 143–149 (2006). 599
46. Gogolla, N. The insular cortex. Curr. Biol. 27, R580–R586 (2017). 600
47. Mak, G. K. & Weiss, S. Paternal recognition of adult offspring mediated by newly generated CNS neurons. 601 Nat. Neurosci. 13, 753–758 (2010). 602
48. Larsen, C. M. & Grattan, D. R. Prolactin-induced mitogenesis in the subventricular zone of the maternal brain 603 during early pregnancy is essential for normal postpartum behavioral responses in the mother. Endocrinology 151, 604 3805–3814 (2010). 605
49. Sakamoto, M. et al. Continuous neurogenesis in the adult forebrain is required for innate olfactory responses. 606 Proc. Natl. Acad. Sci. U. S. A. 108, 8479–8484 (2011). 607
50. Kelly, J. R. et al. Breaking down the barriers: the gut microbiome, intestinal permeability and stress-related 608 psychiatric disorders. Front. Cell. Neurosci. 9, 392 (2015). 609
51. Arentsen, T. et al. The bacterial peptidoglycan-sensing molecule Pglyrp2 modulates brain development and 610 behavior. Mol. Psychiatry 22, 257–266 (2017). 611
52. Barrière, D. A. et al. Structural and functional alterations in the retrosplenial cortex following neuropathic pain. 612 Pain (2019) doi:10.1097/j.pain.0000000000001610. 613

25
53. DiIorio, G., Brown, J. J., Borrello, J. A., Perman, W. H. & Shu, H. H. Large angle spin-echo imaging. Magn. 614 Reson. Imaging 13, 39–44 (1995). 615
54. Ma, Y. et al. In vivo 3D digital atlas database of the adult C57BL/6J mouse brain by magnetic resonance 616 microscopy. Front. Neuroanat. 2, (2008). 617
55. Keller, M., Pawluski, J. L., Brock, O., Douhard, Q. & Bakker, J. The α-fetoprotein knock-out mouse model 618 suggests that parental behavior is sexually differentiated under the influence of prenatal estradiol. Horm. Behav. 619 57, 434–440 (2010). 620
56. van den Brom, C. E. et al. Altered myocardial substrate metabolism is associated with myocardial dysfunction 621 in early diabetic cardiomyopathy in rats: studies using positron emission tomography. Cardiovasc. Diabetol. 8, 39 622 (2009). 623
57. Magalhães, R. et al. The dynamics of stress: a longitudinal MRI study of rat brain structure and connectome. 624 Mol. Psychiatry (2017) doi:10.1038/mp.2017.244. 625
58. Ashburner, J. & Friston, K. J. Voxel-based morphometry--the methods. NeuroImage 11, 805–821 (2000). 626
59. Ashburner, J. A fast diffeomorphic image registration algorithm. NeuroImage 38, 95–113 (2007). 627
60. Asami, T. et al. Longitudinal loss of gray matter volume in patients with first-episode schizophrenia: DARTEL 628 automated analysis and ROI validation. NeuroImage 59, 986–996 (2012). 629
61. Barrière, D. A. et al. In vivo magnetic resonance imaging reveals the effect of gonadal hormones on 630 morphological and functional brain sexual dimorphisms in adult sheep. Psychoneuroendocrinology 109, 104387 631 (2019). 632
62. Xia, M., Wang, J. & He, Y. BrainNet Viewer: a network visualization tool for human brain connectomics. PloS 633 One 8, e68910 (2013). 634

26
Tables 635
636
Table 1. Comparison of mouse brain resources currently available in the literature (NA = not 637
available). 638

27
Figures 639
640
Figure 1. Processing of mouse brain templates and building an atlas from the AMBMC 641
template and Allen Brain Atlas for data analysis and visualization. To create our resources, we 642
used both AMBMC mouse brain template and the mouse Allen Brain Atlas and its associated 643
Nissl images. (1) We down-sampled to a suitable resolution for MRI analysis (60-µm isotropic 644
resolution) and (2) realign in the AC/PC axis. The resulting template was then segmented into 645
GM, WM and CSF probability maps (3). These probability maps were used to segment all the 646
images which have been previously normalized to the template (5,6,7). We obtained a large set 647
of 138 images for each tissue class which have been used to build a population-specific GM, 648
WM and CSF priors. using an exponentiated lie algebra (DARTEL) approach (8). This new set 649
of population-specific tissue priors was used to segment again normalized T2 images (9) for the 650
final VBM preprocessing (10, 11, 12). To normalize the Allen Brain Atlas, we manually realign 651
(13) and normalized the associated Nissl-stain mouse brain using the GM priors generated 652
previously (14, 15). Both linear and nonlinear transformations have been applied to the Allen 653
mouse brain atlas. Then, a visual inspection of each normalized label was carried out and, when 654
necessary, redrawn according to Paxinos and Franklin’s atlas. Finally, the olfactory bulb and 655

28
hind brain regions were completed, the corpus callosum and ventricles were drawn from the 656
WM and CSF priors, and the cerebellum labels were replaced by the AMBMC cerebellum 657
labels. 658
AMBMC = Australian Mouse Brain Mapping Consortium mouse brain template, AC/PC = 659
anterior commissure/posterior commissure, CSF = cerebrospinal fluid, GM = gray matter, WM 660
= white matter. 661

29
662
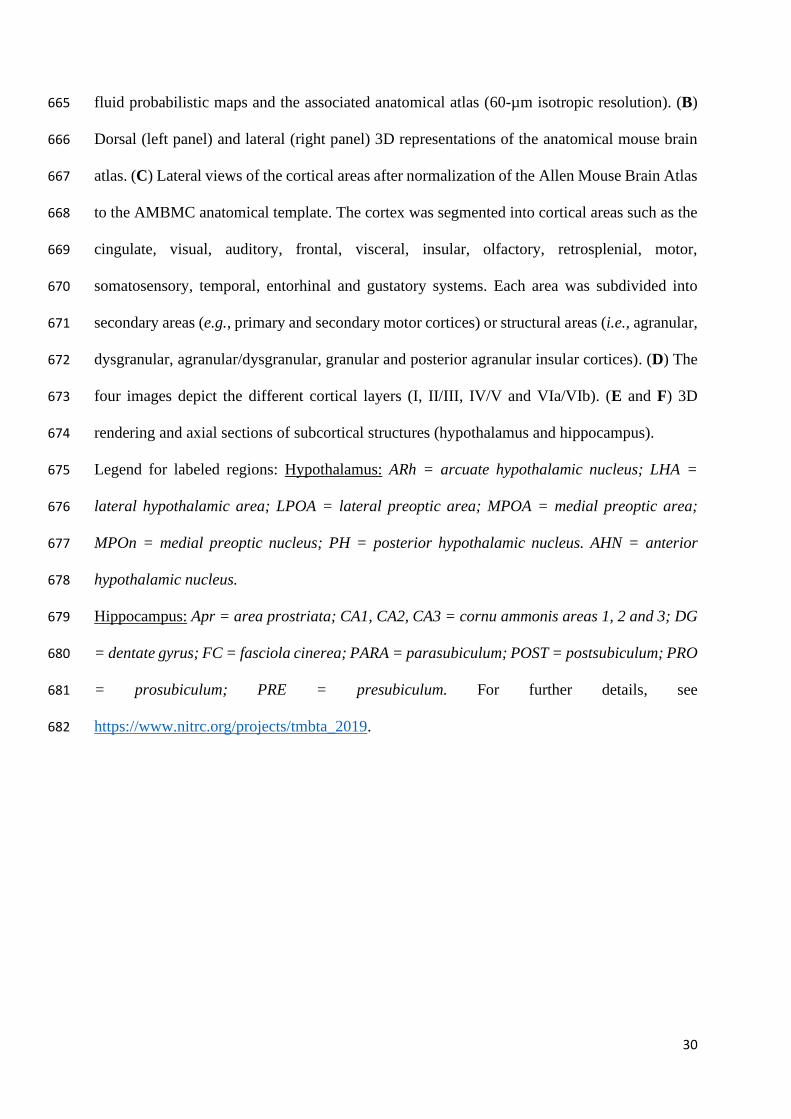
Figure 2. Details of the mouse brain template and atlas. (A) Coronal slices of the anatomical 663
template of the mouse brain and the corresponding gray matter, white matter and cerebrospinal 664
30
fluid probabilistic maps and the associated anatomical atlas (60-µm isotropic resolution). (B) 665
Dorsal (left panel) and lateral (right panel) 3D representations of the anatomical mouse brain 666
atlas. (C) Lateral views of the cortical areas after normalization of the Allen Mouse Brain Atlas 667
to the AMBMC anatomical template. The cortex was segmented into cortical areas such as the 668
cingulate, visual, auditory, frontal, visceral, insular, olfactory, retrosplenial, motor, 669
somatosensory, temporal, entorhinal and gustatory systems. Each area was subdivided into 670
secondary areas (e.g., primary and secondary motor cortices) or structural areas (i.e., agranular, 671
dysgranular, agranular/dysgranular, granular and posterior agranular insular cortices). (D) The 672
four images depict the different cortical layers (I, II/III, IV/V and VIa/VIb). (E and F) 3D 673
rendering and axial sections of subcortical structures (hypothalamus and hippocampus). 674
Legend for labeled regions: Hypothalamus: ARh = arcuate hypothalamic nucleus; LHA = 675
lateral hypothalamic area; LPOA = lateral preoptic area; MPOA = medial preoptic area; 676
MPOn = medial preoptic nucleus; PH = posterior hypothalamic nucleus. AHN = anterior 677
hypothalamic nucleus. 678
Hippocampus: Apr = area prostriata; CA1, CA2, CA3 = cornu ammonis areas 1, 2 and 3; DG 679
= dentate gyrus; FC = fasciola cinerea; PARA = parasubiculum; POST = postsubiculum; PRO 680
= prosubiculum; PRE = presubiculum. For further details, see 681
https://www.nitrc.org/projects/tmbta_2019. 682

31
683
Figure 3. Longitudinal effects of the reproductive cycle on brain morphometry. Coronal slices 684
(at left) and brain plots (at right) showing gray matter concentration (GMC) differences between 685
control and parous animals at the end of gestation (A) and during early lactation (B) and late 686
lactation (C). 687
SPM flexible factorial analysis revealed an interaction between control mice and parous mice 688
in the late gestation period (A), early lactation period (B) and late lactation period (C); voxel-689

32
level threshold p < 0.01, t(126) = 2.356, cluster threshold = 25 voxels. BNST = bed nucleus of 690
the stria terminalis; Hyp = hypothalamus; mPOA = medial preoptic area; dHippo = dorsal 691
hippocampus; ObF/PrL = orbitofrontal/prelimbic area; aOb/Ob = accessory olfactory 692
nucleus/olfactory bulb; Pir = piriform cortex; Amyg/Ent = amygdala/entorhinal cortex. 693

33
694
Figure 4. Longitudinal time course analysis of gray matter concentration (GMC) over the 695
reproductive cycle. Time course comparisons in GMC between the control (black dots and 696
lines) and parous (red dots and lines) groups showing 3 different time profiles. (A) GMC values 697
within the medial preoptic area, the bed nucleus of stria terminalis (BNST) and the agranular 698
insular cortex reveal a significant increase in GMC during the late gestation (LG) period 699
maintained until weaning (W). (B) Specific and transient increases in GMCs are observed in 700
the amygdala, the piriform area and the hippocampus during early lactation (EL). (C) The 701
arcuate nucleus, PVN and caudate putamen display an increase in GMC through both EL and 702
late lactation (LL) periods. 703
Orange and blue areas represent the gestation and lactation periods, respectively. Data are 704
expressed as the mean ± standard error of the mean (SEM); two-way ANOVA followed by 705
Holm-Sidak multiple comparisons test; *p < 0.05, ** p < 0.01 and *** p < 0.001, compared 706
with control mice. 707
Base EG LG EL LL W0.80
0.85
0.90
0.95
Medial preoptic nucleusG
MC
Control
Parous
*** *
Base EG LG EL LL W0.85
0.90
0.95
1.00
Bed nucleus of the stria terminalis
GM
C
Control
Parous
** ***
Base EG LG EL LL W0.62
0.64
0.66
0.68
0.70
Agranular insular cortex
GM
C
Control
Parous** *
Base EG LG EL LL W0.66
0.68
0.70
0.72
0.74
Piriform area
GM
C
Control
Parous**
Base EG LG EL LL W0.90
0.95
1.00
1.05
1.10
Hippocampus
GM
C
Control
Parous
**
Base EG LG EL LL W0.56
0.58
0.60
0.62
0.64
0.66
0.68
Amygdala
GM
C
Control
Parous
***
Base EG LG EL LL W0.80
0.85
0.90
0.95
1.00
Arcuate nucleus
GM
C
Control
Parous
** *
Base EG LG EL LL W0.85
0.90
0.95
1.00
1.05
Paraventricular nucleus of the hypothalamus
GM
C
Control
Parous
** *
Base EG LG EL LL W0.82
0.84
0.86
0.88
0.90
0.92
0.94
Caudate putamen
GM
C
Control
Parous
** *
A
B
C

34
708
Figure 5. Distribution of animals according to the quality of their maternal behavior assessed 709
with the pup retrieval test and brain morphometric. K-means clustering of parous animals to 710
classify mice into low and high maternal behavior groups based on behavior during the pup 711
retrieval test (A). Comparisons between the low and high maternal behavior groups revealed 712
significant differences in crouching, pup-licking and digging times (B). Brain slices (left panel) 713
and brain plots (right panel) comparing gray matter concentration (GMC) modifications and 714

35
surface maps of GMC differences between females exhibiting low and those exhibiting high 715
maternal behavior at the end of the gestation period (C) and early lactation period (D). 716
Low and high maternal behavioral data were compared using a Student’s t-test with post hoc 717
corrections for multiple comparisons using an FDR approach (Q = 1%) and are expressed as 718
the mean ± SEM; ** p < 0.01 and *** p < 0.001. SPM flexible factorial analysis revealed an 719
interaction between low and high maternal behavior parous mice in the late gestation period 720
(A) and early lactation period (B); voxel-level threshold p < 0.01, t(60) = 2.39, cluster threshold 721
= 25 voxels. RS = retrosplenial cortex; vHippo = ventral hippocampus; S1 = primary 722
somatosensory cortex; aOB = accessory olfactory bulb; OB = olfactory bulb; Pir = piriform 723
cortex; Enth = entorhinal cortex; Str= striatum; OrbF = orbitofrontal cortex. 724

36
725
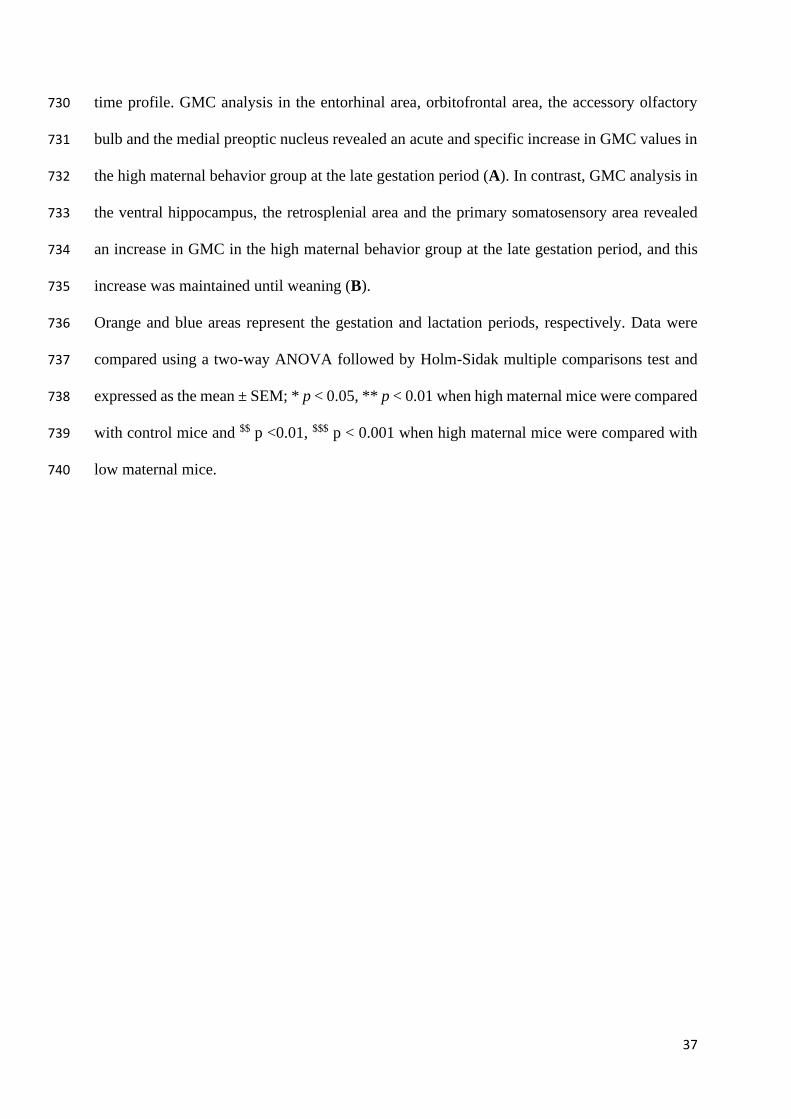
Figure 6. Longitudinal analysis in gray matter concentration (GMC) during the reproductive 726
cycle in control females and females exhibiting low or high maternal behavior. Time-course 727
comparison of GMC between the control (black dots and lines), low maternal behavior (pink 728
dots and lines) and high maternal behavior (red dots and lines) groups revealed two types of 729
37
time profile. GMC analysis in the entorhinal area, orbitofrontal area, the accessory olfactory 730
bulb and the medial preoptic nucleus revealed an acute and specific increase in GMC values in 731
the high maternal behavior group at the late gestation period (A). In contrast, GMC analysis in 732
the ventral hippocampus, the retrosplenial area and the primary somatosensory area revealed 733
an increase in GMC in the high maternal behavior group at the late gestation period, and this 734
increase was maintained until weaning (B). 735
Orange and blue areas represent the gestation and lactation periods, respectively. Data were 736
compared using a two-way ANOVA followed by Holm-Sidak multiple comparisons test and 737
expressed as the mean ± SEM; * p < 0.05, ** p < 0.01 when high maternal mice were compared 738
with control mice and $$ p <0.01, $$$ p < 0.001 when high maternal mice were compared with 739
low maternal mice. 740

38
741
Figure 7. Estimation of the sensitivity and specificity of late-gestation GMC measures in the 742
entorhinal area (A) and accessory olfactory bulb (B) to predict postpartum maternal 743
performance. 744
Receiver operating characteristic (ROC) curves were estimated using a Wilson/Brown test with 745
a 95% confidence interval. Correlations were estimated using a Pearson correlation test. ROC 746
and correlation analyses were considered significant at p < 0.05. 747

39
Supplementary Data 748
749
Table S1. Local variation in gray matter concentration between control and parous mice at the 750
end of the gestation period. SPM flexible factorial analysis revealed an interaction between the 751
control and parous groups at the late gestation time point. 752

40
753
Table S2. Local variation in gray matter concentration between control and parous mice at the 754
beginning of the lactation period. SPM flexible factorial analysis revealed an interaction 755
between the control and parous groups at the early lactation time point. 756

41
757
Table S3. Local variation in gray matter concentration between control and parous mice at the 758
end of the lactation period. SPM flexible factorial analysis revealed an interaction between the 759
control and parous groups at the late lactation time point. 760

42
761
Table S4. Local variation in gray matter concentration between low maternal behavior parous 762
mice and high maternal behavior parous mice at the end of the gestation period. SPM flexible 763
factorial analysis revealed an interaction between the low versus high maternal behavior groups 764
at the late gestation time point. 765

43
766
Table S5. Local variation in gray matter concentration between low maternal behavior parous 767
mice and high maternal behavior parous mice at the beginning of the lactation period. SPM 768
flexible factorial analysis revealed an interaction between the low versus high maternal 769
behavior groups at the early lactation time point. 770