Embed Size (px)
Citation preview

11
Assessing Vulnerability to Natural Hazards: An Assessing Vulnerability to Natural Hazards: An Impact-based Method and Application to Impact-based Method and Application to
Drought in Washington StateDrought in Washington State
Matthew FontaineMatthew FontaineHerrera Environmental Consultants, Inc.Herrera Environmental Consultants, Inc.
Water Resources Engineer Water Resources Engineer (Formerly Masters Candidate,(Formerly Masters Candidate,
University of WashingtonUniversity of WashingtonWater Center)Water Center)
Anne C. SteinemannAnne C. SteinemannUniversity of Washington University of Washington
Professor, Department of Civil & Environmental EngineeringProfessor, Department of Civil & Environmental EngineeringProfessor, Evans School of Public AffairsProfessor, Evans School of Public Affairs
Adjunct Professor, College of Forest ResourcesAdjunct Professor, College of Forest ResourcesPrincipal, Climate Impacts GroupPrincipal, Climate Impacts Group
The Water Center

22
Presentation OutlinePresentation Outline Motivation Motivation
Assess drought impacts in WashingtonAssess drought impacts in Washington Improve vulnerability assessment methodologyImprove vulnerability assessment methodology
ObjectivesObjectives Methods – Process is importantMethods – Process is important ResultsResults
Drought impactsDrought impacts VulnerabilityVulnerability IndicatorsIndicators Adaptation Adaptation
Improve state drought planningImprove state drought planning
Vulnerability Assessment Method

33
MotivationMotivation

44
Drought Study Motivation Drought Study Motivation Agricultural production is $6B per yearAgricultural production is $6B per year Irrigated crops are 70% of harvest valueIrrigated crops are 70% of harvest value Agriculture employs over 183,000 peopleAgriculture employs over 183,000 people ESA fish populationsESA fish populations Municipal water suppliers lose millions Municipal water suppliers lose millions
during droughtduring drought Hydropower generation decreases and Hydropower generation decreases and
power costs increasepower costs increase Some recreation industries affectedSome recreation industries affected
55
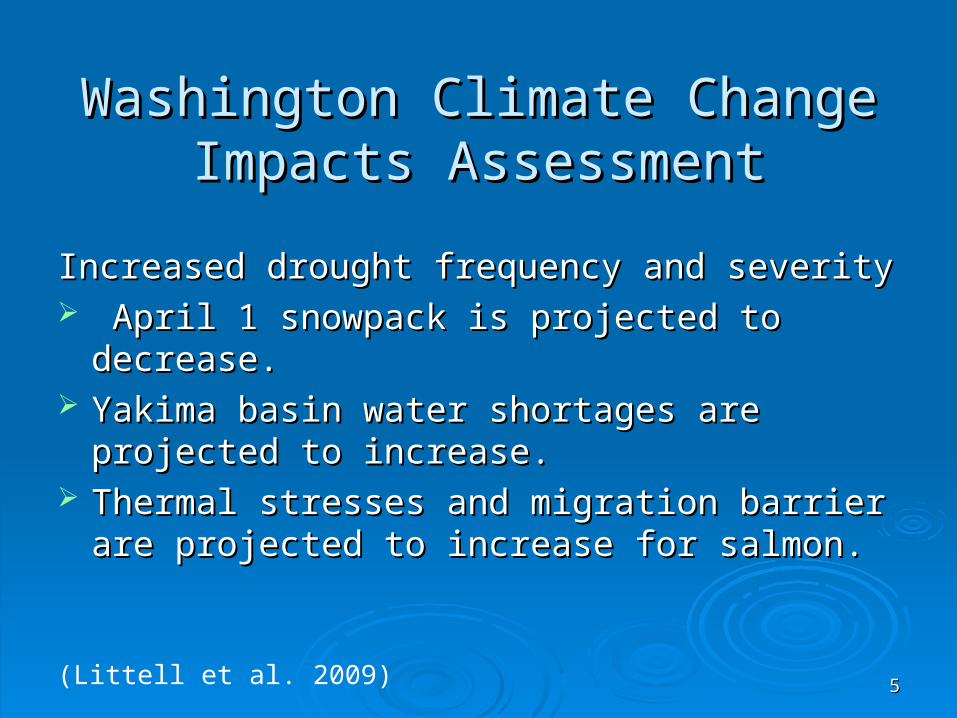
Washington Climate Change Washington Climate Change Impacts AssessmentImpacts Assessment
Increased drought frequency and severityIncreased drought frequency and severity April 1 snowpack is projected to decrease.April 1 snowpack is projected to decrease. Yakima basin water shortages are projected to Yakima basin water shortages are projected to
increase.increase. Thermal stresses and migration barrier are Thermal stresses and migration barrier are
projected to increase for salmon.projected to increase for salmon.
(Littell et al. 2009)

66
Vulnerability Assessment Motivation Vulnerability Assessment Motivation
Many local natural hazardsMany local natural hazards Many sectors vulnerable to each hazardMany sectors vulnerable to each hazard Limited resourcesLimited resources Numeric indicators may not be Numeric indicators may not be
comparable between sectorscomparable between sectors Hazards increase with increasing Hazards increase with increasing
population and changing climatepopulation and changing climate

77
Preparing for Climate Change. A Guidebook Preparing for Climate Change. A Guidebook for Local, Regional, and State Governmentsfor Local, Regional, and State Governments
Milestone 1 – Initiate your climate resiliency effortMilestone 1 – Initiate your climate resiliency effort Milestone 2 – Climate resiliency studyMilestone 2 – Climate resiliency study
Vulnerability assessmentVulnerability assessment Risk assessmentRisk assessment
Milestone 3 – Set goals and develop a planMilestone 3 – Set goals and develop a plan Milestone 4 – Implement your planMilestone 4 – Implement your plan Milestone 5 – Measure progress and update planMilestone 5 – Measure progress and update plan
(Snover et al. 2007)

88
ObjectivesObjectives

99
Study ObjectivesStudy Objectives
Investigate four aspects of drought Investigate four aspects of drought Impacts of past droughtsImpacts of past droughts Vulnerability of different sectors and regionsVulnerability of different sectors and regions Indicators to monitor and forecast droughtIndicators to monitor and forecast drought Adaptations to reduce drought impactsAdaptations to reduce drought impacts
Develop improved vulnerability assessment Develop improved vulnerability assessment methodologymethodology

1010
MethodsMethods

1111
Investigation: Methods and SectorsInvestigation: Methods and Sectors Established project advisory team Established project advisory team Conducted over 60 interviews covering major Conducted over 60 interviews covering major
regions and sectorsregions and sectors
IntervieweesInterviewees: : AgricultureAgriculture Municipal and industrial water suppliersMunicipal and industrial water suppliers FisheryFishery Power Power Recreation Recreation

1212
Interview QuestionsInterview Questions
What do you do and where do you get What do you do and where do you get your water? your water?
How have you been affected by past water How have you been affected by past water shortages ($$$) ? shortages ($$$) ?
What indicators do you monitor?What indicators do you monitor? What do you do to adapt in the face of What do you do to adapt in the face of
drought (decision making process)?drought (decision making process)? What information and resources can What information and resources can
improve your adaptive capacity?improve your adaptive capacity?

1313
Value of This Approach - ExampleValue of This Approach - Example
Yakima Basin Junior Water UsersYakima Basin Junior Water Users Drought decision makingDrought decision making
January 1 through early MarchJanuary 1 through early March Information and indicatorsInformation and indicators
Soil moisture (locally)Soil moisture (locally) Snow pack -- SnotelSnow pack -- Snotel Reservoir levelsReservoir levels Climate forecastsClimate forecasts US Bureau of Reclamation – Proration US Bureau of Reclamation – Proration
Estimate in MarchEstimate in March

1414
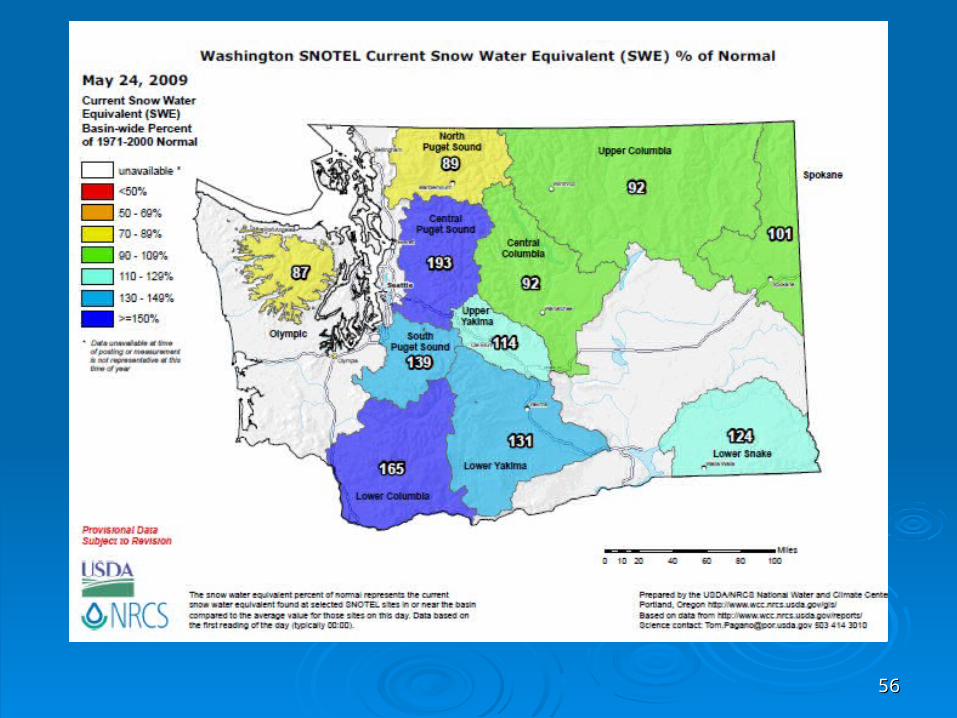
WY 2009 WY 2009 SnowpackSnowpack
USBR Press Release (www.usbr.gov) : March 9, 2009
"The March 2009 forecast indicates a full water supply for all water users." Chuck Garner, Yakima Project River Operations Supervisor
May 7, 2009"The May 2009 forecast indicates a full water supply for all water users."
http://www.wcc.nrcs.usda.govhttp://www.wcc.nrcs.usda.gov
Average Snow Water Equivalent
WY2009 Snow Water Equivalent

1515
Investigation: Regions and Investigation: Regions and interview distribution interview distribution
1616
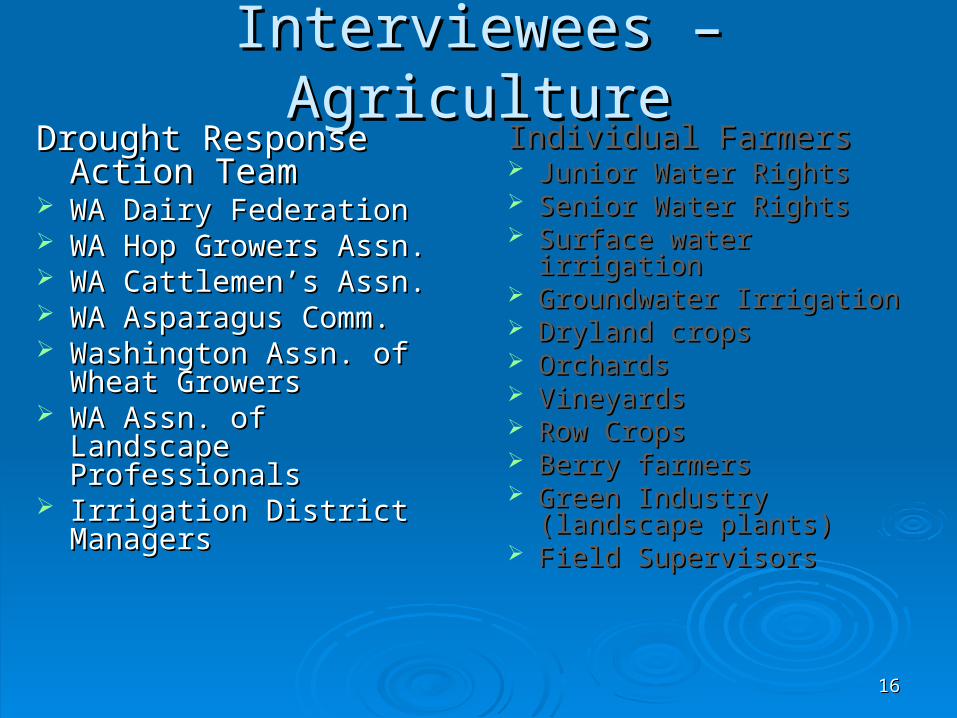
Interviewees – AgricultureInterviewees – AgricultureDrought Response Drought Response
Action Team Action Team WA Dairy FederationWA Dairy Federation WA Hop Growers Assn.WA Hop Growers Assn. WA Cattlemen’s Assn.WA Cattlemen’s Assn. WA Asparagus Comm.WA Asparagus Comm. Washington Assn. of Washington Assn. of
Wheat GrowersWheat Growers WA Assn. of Landscape WA Assn. of Landscape
ProfessionalsProfessionals Irrigation District Irrigation District
ManagersManagers
Individual FarmersIndividual Farmers Junior Water Rights Junior Water Rights Senior Water Rights Senior Water Rights Surface water irrigation Surface water irrigation Groundwater IrrigationGroundwater Irrigation Dryland crops Dryland crops OrchardsOrchards VineyardsVineyards Row CropsRow Crops Berry farmersBerry farmers Green Industry Green Industry
(landscape plants)(landscape plants) Field SupervisorsField Supervisors

1717
Interviewees - FisheriesInterviewees - Fisheries
WA Dept. Fish and Wildlife Fisheries and WA Dept. Fish and Wildlife Fisheries and Habitat BiologistsHabitat Biologists
Ski Area OperatorsSki Area Operators Pacific Northwest Ski Areas Association Pacific Northwest Ski Areas Association W. WA Golf Course AssociationW. WA Golf Course Association
Interviewees - RecreationInterviewees - Recreation

1818
Interviewees - PowerInterviewees - Power
Bonneville Power AdministrationBonneville Power Administration Pacific Northwest Utilities Conference Pacific Northwest Utilities Conference
CommitteeCommittee
Seattle Public UtilitySeattle Public Utility Everett Public WorksEverett Public Works Skagit PUDSkagit PUD
Interviewees – Municipal SupplyInterviewees – Municipal Supply

1919
Interviewees – Multi-sectorInterviewees – Multi-sector
WRIA leadsWRIA leads Watershed Watershed
managersmanagers US Bureau of US Bureau of
ReclamationReclamation Water use Water use
coordinatorscoordinators Washington State Department of Ecology

2020
ImpactsImpacts

2121
Primary findings of impact Primary findings of impact assessment assessment
Agriculture: 2005Agriculture: 2005 Water supply was inadequate to meet crop Water supply was inadequate to meet crop
demandsdemands Junior users received 42% supply in 2005 Junior users received 42% supply in 2005 Entire fruit crops were lostEntire fruit crops were lost Dryland production was reduced by 70% Dryland production was reduced by 70%
in some casesin some cases

2222
Junior Water Users Junior Water Users
Below normal supply Below normal supply in 11 of last 35 yearsin 11 of last 35 years
Below 50% supply in Below 50% supply in 2 of last 7 years2 of last 7 years
Yakima Basin Storage Alliance
Yakima Basin Project - Percent Supply for Junior Water Users (Normal Supply is
Approximately 3 Acre-feet per Acre)
0
10
20
30
40
50
60
70
80
90
100
Year
Perc
ent
of
Entit
lem
ents
2323
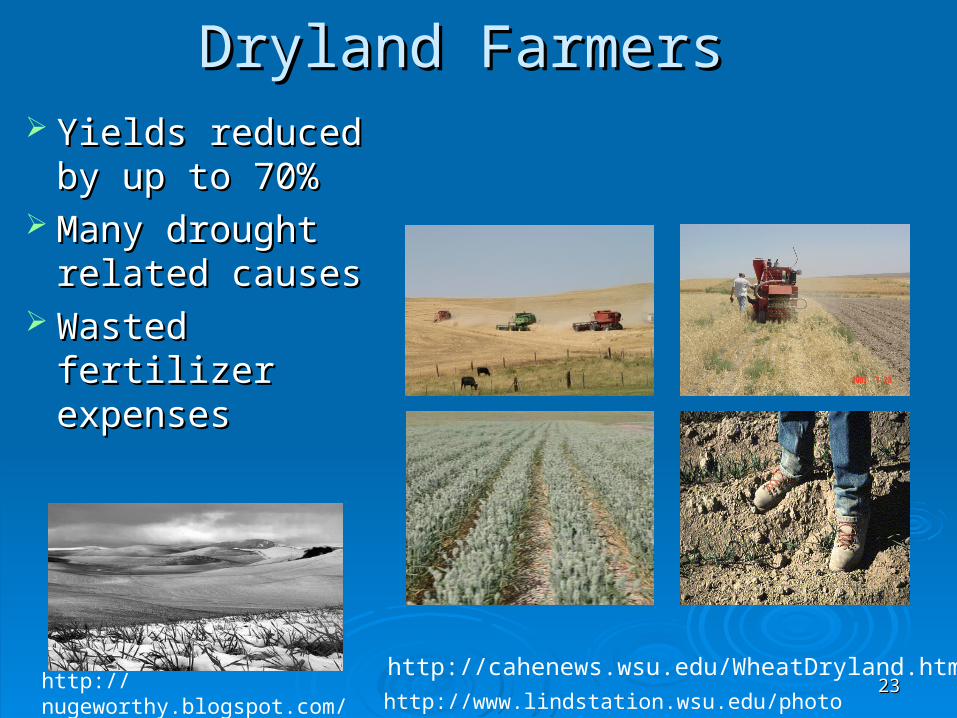
Dryland Farmers Dryland Farmers Yields reduced Yields reduced
by up to 70%by up to 70% Many drought Many drought
related causesrelated causes Wasted fertilizer Wasted fertilizer
expensesexpenses
http://www.lindstation.wsu.edu/photohttp://nugeworthy.blogspot.com/2005/04/spring-snow-on-palouse.html
http://cahenews.wsu.edu/WheatDryland.htm
2424
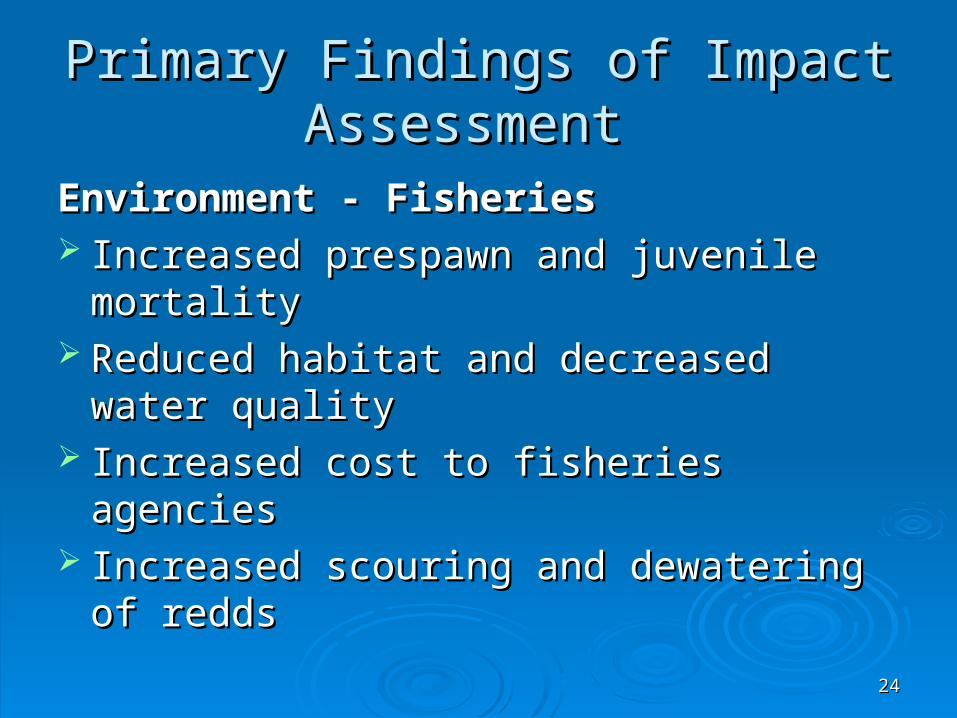
Primary Findings of Impact Primary Findings of Impact Assessment Assessment
Environment - FisheriesEnvironment - Fisheries Increased prespawn and juvenile mortalityIncreased prespawn and juvenile mortality Reduced habitat and decreased water Reduced habitat and decreased water
qualityquality Increased cost to fisheries agenciesIncreased cost to fisheries agencies Increased scouring and dewatering of Increased scouring and dewatering of
reddsredds

2525
The Okanogan RiverThe Okanogan River
Lake OsoyoosSimilkameen River
Okanogan River
Warm reservoir Warm reservoir spill waterspill water
Tributary draw Tributary draw downdown
Prespawn Prespawn mortality of mortality of hundreds of hundreds of Summer Chinook Summer Chinook SalmonSalmon

2626
Primary Findings of Impact Primary Findings of Impact AssessmentAssessment
M&I M&I $3M -$15M in lost revenue/increased costs$3M -$15M in lost revenue/increased costs
Hydropower SectorHydropower Sector Lost generation in 2001 Drought: Several Lost generation in 2001 Drought: Several
Billion Billion
RecreationRecreation 1 million fewer ski area visits in 2005 (60% 1 million fewer ski area visits in 2005 (60%
reduction)reduction)

2727
Higher Higher percentage of percentage of generation lost generation lost to fish flowsto fish flows
Hundreds of Hundreds of millions lost millions lost during droughtduring drought
Impact to the Hydropower Sector in 2001Impact to the Hydropower Sector in 2001
http://www.nww.usace.army.mil/U.S. Army Corps of Engineers

2828
Hydropower ImpactsHydropower Impacts
0
2000
4000
6000
8000
10000
12000
14000
16000
18000
4.0E+07 6.0E+07 8.0E+07 1.0E+08 1.2E+08 1.4E+08 1.6E+08
Volume (acre•ft)
Ge
ne
rati
on
(M
W)
Critical Water Year 2001 Water Year (Interpolated)
Average Water Year Columbia Generation per Volume
10496 MW 11780 MW
15800 MW
Average Water Year
Critical Water Year
2001 Water Year

2929
Hydropower Impacts EstimationHydropower Impacts Estimation 125$/MW hour x Generation Reduction x 125$/MW hour x Generation Reduction x
TimeTime ~$5.8 billion reduced generation in NW~$5.8 billion reduced generation in NW ~$3.5 billion reduced generation in WA~$3.5 billion reduced generation in WA Component CostsComponent Costs
$2.3 billion in replacement power purchased $2.3 billion in replacement power purchased by BPAby BPA
Aluminum plant closuresAluminum plant closures $25 million paying Columbia Basin Project $25 million paying Columbia Basin Project
irrigators not to pumpirrigators not to pump Increased power ratesIncreased power rates

3030
Vulnerability Assessment MethodVulnerability Assessment Method

3131
Assessing Vulnerability to DroughtAssessing Vulnerability to Drought
Conceptual Model of VulnerabilityConceptual Model of Vulnerability
Exposure Sensitivity
Potential Impact
AdaptiveCapacity
Vulnerability
Adapted from D. Schroter et al. 2004

3232
Vulnerability Assessment Method Vulnerability Assessment Method (VAM)(VAM)
Assess each componentAssess each component Based on interview data and heuristics Based on interview data and heuristics Using 1-5 Likert ScaleUsing 1-5 Likert Scale
Determine net vulnerability scores Determine net vulnerability scores Calculate scores within sectors and regionsCalculate scores within sectors and regions
Vulnerability = ( Exposure + Sensitivity ) / Adaptive Capacity

3333
Assessing Vulnerability to Drought Assessing Vulnerability to Drought – fix this slide– fix this slide
Component Interview Data Collected Ranking Score
Exposure
Received less than 50 % of normal water entitlements during two of the past five years. Water shutdown comes at inopportune times for crops.
Extreme 5
Sensitivity
Raises primarily perennial tree fruit that commonly produce low quality fruit under sub-normal supply. Crops are very costly to replace if damaged.
High 4
Adaptive Capacity
No backup/emergency water supplies and less than ten percent of acreage in annual crops (limited ability to spread water).
Low 2
Total Score 4.5
3434
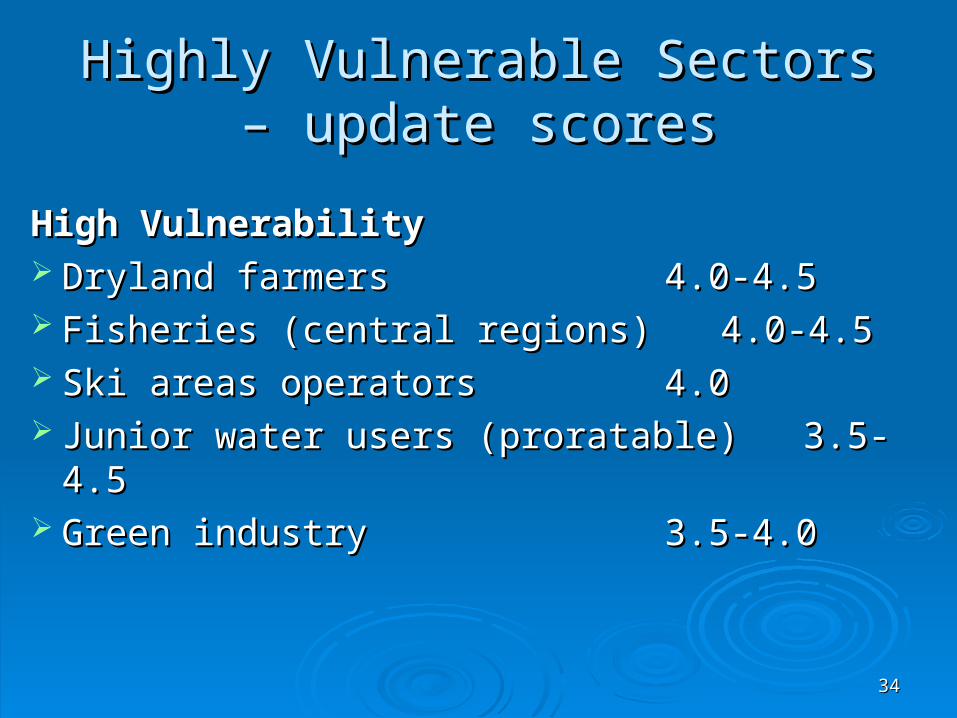
Highly Vulnerable Sectors – update Highly Vulnerable Sectors – update scoresscores
High VulnerabilityHigh Vulnerability Dryland farmers Dryland farmers 4.0-4.54.0-4.5 Fisheries (central regions) Fisheries (central regions) 4.0-4.5 4.0-4.5 Ski areas operators Ski areas operators 4.04.0 Junior water users (proratable) Junior water users (proratable) 3.5-4.53.5-4.5 Green industry Green industry 3.5-4.03.5-4.0
3535
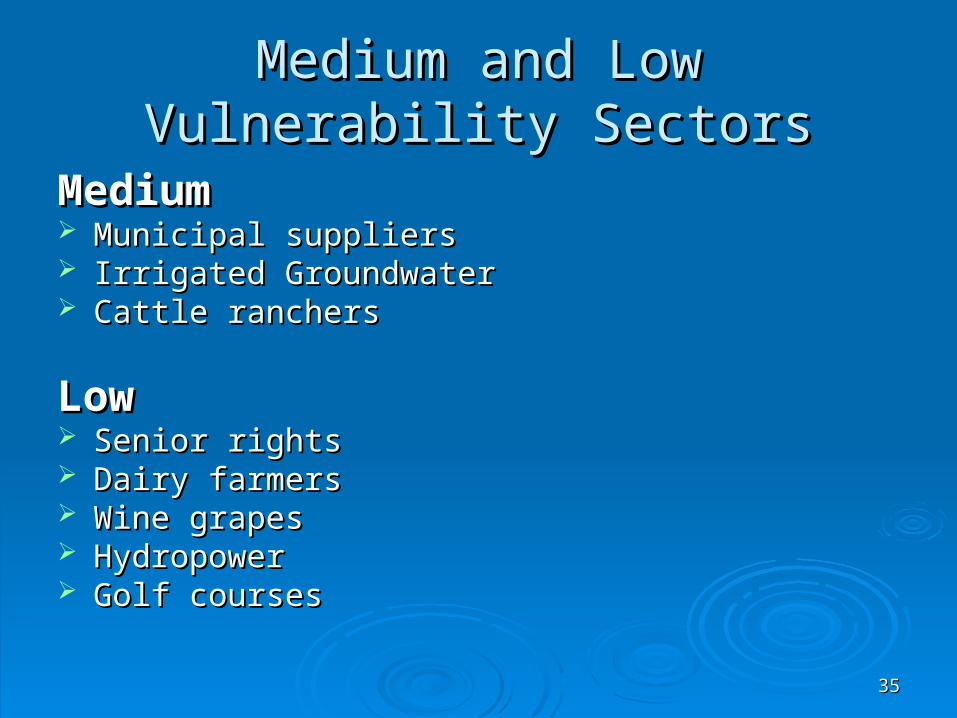
Medium and Low Vulnerability Medium and Low Vulnerability SectorsSectors
MediumMedium Municipal suppliersMunicipal suppliers Irrigated GroundwaterIrrigated Groundwater Cattle ranchersCattle ranchers
LowLow Senior rightsSenior rights Dairy farmersDairy farmers Wine grapesWine grapes Hydropower Hydropower Golf coursesGolf courses

3636
Vulnerability of the Green IndustryVulnerability of the Green Industry
Vulnerability derived from consumer Vulnerability derived from consumer perception of droughtperception of drought
State declaration of drought may State declaration of drought may reduce salesreduce sales
Media can increase impactsMedia can increase impacts

3737
Vulnerability of Fisheries on the East Vulnerability of Fisheries on the East Side of the Cascades Side of the Cascades
Several ESA listed Several ESA listed species species
Vulnerable to low Vulnerable to low flowsflows
Spawning, rearing, Spawning, rearing, and out-migrationand out-migration
High agricultural High agricultural withdrawalwithdrawal
High pollutant loadsHigh pollutant loads Instream Flow Instream Flow
CommissionCommission

3838
IndicatorsIndicators

3939
IndicatorsIndicators
Yakima Basin Junior Water UsersYakima Basin Junior Water Users Proration estimate from USBRProration estimate from USBR SnowpackSnowpack Forecasts Forecasts
Dryland farmersDryland farmers Soil moistureSoil moisture Forecasts – short term in fall, long term in springForecasts – short term in fall, long term in spring
Ski IndustrySki Industry Forecasts – 2-3 month forecasts in Oct. and Nov.Forecasts – 2-3 month forecasts in Oct. and Nov.

4040
IndicatorsIndicators
Other GroupsOther Groups Reservoir levelsReservoir levels Stream flowStream flow Cumulative precipitationCumulative precipitation Long term temp outlook (WA and CA)Long term temp outlook (WA and CA) Subscription forecastsSubscription forecasts ENSOENSO
Non-hydrologic indicatorsNon-hydrologic indicators Fish run sizeFish run size Market forcesMarket forces

4141
Adaptive CapacityAdaptive Capacity

4242
Drought Responses and Drought Responses and AdaptationsAdaptations
Junior water usersJunior water users Water law changes and educationWater law changes and education Conveyance inefficiencies can be reducedConveyance inefficiencies can be reduced Earlier accurate supply estimates Earlier accurate supply estimates Increased storageIncreased storage
Dryland farmersDryland farmers Farming practices can be altered Farming practices can be altered Improved forecasts enable better decision Improved forecasts enable better decision
makingmaking

4343
Adapting to Reduce Drought Adapting to Reduce Drought Impacts: Dungeness River Impacts: Dungeness River
Mean Mean annual annual flow 380 flow 380 cfs cfs (USGS)(USGS)

4444
Adapting to Reduce Drought Adapting to Reduce Drought Impacts: Dungeness River Impacts: Dungeness River
Low stream flows in Low stream flows in 20052005
Cooperation between Cooperation between users minimizes users minimizes impact to agricultureimpact to agriculture
Ditch riders used to Ditch riders used to communicate with communicate with water users water users
Coordinated shutdown Coordinated shutdown allowed fish passageallowed fish passage
UC Davis, Purdue

4545
Drought Responses and Drought Responses and AdaptationsAdaptations
Green IndustryGreen Industry Localized supply forecasts would be Localized supply forecasts would be
beneficialbeneficialMunicipal and IndustrialMunicipal and Industrial Rule curve may be managed dynamicallyRule curve may be managed dynamically System maintenance schedules can be System maintenance schedules can be
alteredaltered Improved forecasts would enable better Improved forecasts would enable better
managementmanagement

4646
Drought Responses and Drought Responses and AdaptationsAdaptations
FisheriesFisheries Fisheries agencies may purchase water rightsFisheries agencies may purchase water rights Monitoring and maintenance can be increasedMonitoring and maintenance can be increased Early drought declaration enables preparationEarly drought declaration enables preparation Smart storage projects supply multiuse waterSmart storage projects supply multiuse water
RecreationRecreation Ski areas may decrease labor forceSki areas may decrease labor force Forecasts inform hiring decisionsForecasts inform hiring decisions

4747
Drought Responses and Drought Responses and AdaptationsAdaptations
PowerPower Farmers may be paid not to irrigate Farmers may be paid not to irrigate Power can be purchased back from major Power can be purchased back from major
usersusers Improved supply and demand forecasts Improved supply and demand forecasts
enable better managementenable better management

4848
Common Themes: Tools for Common Themes: Tools for Reducing Drought Impacts Reducing Drought Impacts
Improved mid and long range forecasts Improved mid and long range forecasts Better current-conditions data for agricultureBetter current-conditions data for agriculture Regionally specific drought monitoring and Regionally specific drought monitoring and
planning toolsplanning tools Education programs for water usersEducation programs for water users Increased supply – multi-benefit storage Increased supply – multi-benefit storage
projectsprojects More streamlined water transfer systemMore streamlined water transfer system

4949
Improving State Drought PlanningImproving State Drought Planning

5050
State Drought PlanningState Drought Planning
Evaluate other state drought plans Evaluate other state drought plans and programsand programs
Investigate lessons learned from Investigate lessons learned from other statesother states
Analyze gaps in drought planning in Analyze gaps in drought planning in Washington StateWashington State
Identify potential improvementsIdentify potential improvements

5151
State Drought Plan ProjectState Drought Plan Project Interviewed drought coordinators in 19 Western Interviewed drought coordinators in 19 Western
Governors’ Association statesGovernors’ Association states Evaluated state drought plans and programsEvaluated state drought plans and programs

5252
State Drought Plan and Program State Drought Plan and Program AssessmentAssessment
Evaluate state drought plan and program Evaluate state drought plan and program componentscomponents
Monitoring – indicators, tools, and proceduresMonitoring – indicators, tools, and procedures Drought communication and declaration Drought communication and declaration
proceduresprocedures Impact and vulnerability assessmentImpact and vulnerability assessment Mitigation programsMitigation programs

5353
Recommendations For Improving Drought Recommendations For Improving Drought Preparedness in Washington StatePreparedness in Washington State
Develop clearly defined and regionally Develop clearly defined and regionally specific sets of indicators and triggersspecific sets of indicators and triggers
Hold monthly drought monitoring meetingsHold monthly drought monitoring meetings Implement a system for declaring drought Implement a system for declaring drought
in stagesin stages Enhance participation of local jurisdictions Enhance participation of local jurisdictions
in drought monitoring and declaration in drought monitoring and declaration Prioritize drought response and mitigation Prioritize drought response and mitigation
activities based on vulnerabilityactivities based on vulnerability
5454
AcknowledgementsAcknowledgements PI and Coauthor – Anne SteinemannPI and Coauthor – Anne Steinemann Project Advisory CommitteeProject Advisory Committee Washington Dept. of Ecology and Washington Washington Dept. of Ecology and Washington
Department of Community, Trade, and Economic Department of Community, Trade, and Economic Development through Contract No. 0511100008.Development through Contract No. 0511100008.
National Oceanic and Atmospheric Administration under National Oceanic and Atmospheric Administration under Grant No. NA06OAR4310075; the Grant No. NA06OAR4310075; the
Joint Institute for the Study of the Atmosphere and Joint Institute for the Study of the Atmosphere and Ocean JISAO under NOAA Cooperative Agreement No. Ocean JISAO under NOAA Cooperative Agreement No. NA17RJ1232, Contribution No. 1626; NA17RJ1232, Contribution No. 1626;
National Science Foundation under Grant No. CMS National Science Foundation under Grant No. CMS 98743919874391
Coauthor for drought plan work – Michael Hayes, NDMCCoauthor for drought plan work – Michael Hayes, NDMC

5555
Questions?Questions?
Matthew FontaineMatthew [email protected]@herrerainc.com
206-441-9080206-441-9080
Anne C. SteinemannAnne C. [email protected]@u.washington.edu
(206) 616-2661 (206) 616-2661
5656