Embed Size (px)
Citation preview

1
Applicationofnanofiltration foracidicwaterscontainingrareearthelements: influenceof1
transitionelements,acidityandmembranestability2
J. Lópeza,b*, M. Reiga,b, O. Giberta,b,c, E. Torresd, C. Ayorad, J. L, Cortinaa,b,c 3 4 a Chemical Engineering Department, UPC‐BarcelonaTECH, C/ Eduard Maristany, 10‐14 (Campus Diagonal‐Besòs), 5
08930 Barcelona, Spain 6 bBarcelona Research Center for Multiscale Science and Engineering, C/ Eduard Maristany, 10‐14 (Campus 7
Diagonal‐Besòs), 08930 Barcelona, Spain 8 c Water Technology Center CETaqua, Carretera d’Esplugues 75, 08940 Cornellà de Llobregat, Spain 9 d Institute of Environmental Assessment and Water Research (IDAEA), Consejo Superior de Investigaciones 10 Científicas (CSIC), Jordi Girona,18, 08034, Barcelona 11 12 *[email protected] 13
Abstract14
Acid mine drainage (AMD) is considered the main environmental problem in mining operation due to its acidity, 15
metal content (Fe, Al, Zn, Cu) and onerous associated treatment cost. However, the presence of relatively high 16
levels of added value elements (rare earth elements (REE)) could make its valorisation economically affordable. 17
Membrane nanofiltration (NF) has been postulated as a potential recovery technology because it allows the 18
recovery of a sulphuric acid rich stream and a metal rich stream in one step. In this study, the performance of a 19
semi‐aromatic polyamide NF membrane (NF270) in filtering model solutions containing common metals (Ca, Al, 20
Zn) in sulphuric solutions (pH 1.5‐3.0) was evaluated. In a second stage, the performance was assessed with the 21
same model solutions but also containing REE. NF270 showed high rejections for metallic ions in solution, 22
allowing acid permeation. Ion rejection data were used to determine membrane permeances to ions using the 23
solution‐diffusion model considering reactive transport. The stability of the membrane was also studied by 24
comparing performances of a virgin membrane with an aged membrane exposed to 1 M sulphuric acid for 4 25
weeks. Physicochemical changes of membrane properties after ageing were also analysed by ATR‐FTIR, AFM and 26
XPS. 27
28
Keywords: NF270, sulphuric acid, rare earths, permeances, XPS, reactive transport modelling 29
1. Introduction30
31
Acid Mine Drainage (AMD) is a by‐product of the mining industry formed when iron sulphide minerals (e.g. pyrite 32
(FeS2), marcasite, (FeS2), and pyrrhotite (FeS)) are oxidised when in contact with water and oxygen. The sulphuric 33
acid generated has the ability to dissolve soil minerals, which leads to a high content of iron, aluminium, zinc and 34
copper, among others, and to the presence of rare earth elements (REEs) [1]. REEs are presented in igneous and 35
sedimentary rocks and are indispensable for the high‐tech industry (e.g. power generation, X‐ray imaging, fibre 36
optics, among others) [2]. Although REEs are found in a minor proportion compared to the above‐mentioned 37
transition metals, their concentration is relatively high (two orders of magnitude higher than the one presented in 38
natural waters) [3,4]. One of the largest sulphide ore deposits in the world is located in the Iberian Pyrite Bell 39
(IPB), which is situated in the Southern Iberian Peninsula. More than 150 types of AMDs have been described in 40
the Odiel and Tinto basins, which are discharged from galleries, open pits and waste dumps. It has recently been 41

2
estimated that the total discharge of AMD in the IPB watersheds is around 1 m3/s in the dry season [5,6] with 1
concentrations of total REEs varying from 0.3 to 11.7 mg/L with an average concentration of 1.0 mg/L [4]. 2
Therefore, the recovery of REEs from AMD can be considered an environmentally and renewable source for their 3
production, especially in Europe, which is lacking primary resources. 4
Traditional solutions to treat AMD for metal recovery are: a) neutralisation to precipitate metals as hydroxides 5
and sulphate as gypsum [7,8]; and b) biological processing using sulphate‐reducing bacteria under anaerobic 6
conditions, leading to the precipitation of metal sulphides [9,10]. Technologies such as adsorption [11,12] and 7
membrane‐based technologies such as electro‐dialysis [13,14] and nanofiltration (NF) [15‐20] have been 8
proposed as emerging solutions. NF is an attractive approach as it makes feasible acid and metal recovery in a 9
single step taking benefit of its ability to discriminate between monovalent and multivalent ions, also allowing 10
high acid permeation. 11
The application of NF membranes to treat AMD has been previously explored. Published studies reported high 12
metal rejection rates (>85%) and high acid permeation through the membrane [15‐20]. Moreover, it has been 13
observed that higher sulphuric acid concentrations (i.e. lower pH) favour the acid passage through the 14
membrane. This is explained by the fact that, at lower pH, a) sulphuric acid is found mainly as a monovalent ion 15
(HSO4‐), which has the ability to permeate more easily than the divalent ion (SO4
2‐), and b) functional groups of 16
the NF membrane (e.g. carboxylic and amine groups of the piperazine) are deprotonated and, hence, single‐17
charged anions HSO4‐ are less repelled by the membrane than double‐charged anions SO4
2‐. However, one of the 18
greatest concerns regarding polyamide‐based membranes is the low chemical resistance of the active sites in very 19
high acidic conditions, as described elsewhere [21–24]. Platt et al. [21] reported that the instability of membranes 20
is a function of time exposure, temperature, type of acid and concentration. The chemical instability of NF45 and 21
Desal DK in nitric (5% w/w) is higher than in sulphuric acid (20% w/w) after ageing for one to three months, and 22
decreases with increasing temperature (20 to 80°C). Manis et al. [22] also reported the instability of Desal DK in 2 23
M sulphuric acid solutions after ageing the membrane for two months with an increase of permeate flux and a 24
decrease of copper retention, while the MPF‐34 membrane kept its properties with little variation. Navarro et al. 25
[23] and Diallo et al. [24] aged Desal 5DL and MPF‐34 membranes, respectively, in phosphoric acid and concluded 26
that adsorbed phosphate could have an impact on selectivity by increasing polarity and modulating charge. 27
However, ageing experiments in 2% sulphuric acid at 60°C by Tanninen et al. [25] for NF270, Desal KH and Desal‐5 28
DK membranes showed marginal changes in pure water flux. After 3 days of immersion, Desal‐5 DK exhibited a 29
three times higher filtration flux and a decrease in copper retention, from 96 to 77%. After 7 days, all of the 30
membranes showed more or less the same copper retention (~ 80%). 31
The main objective of this work was to study the performance of a piperazine‐based polyamide membrane 32
(NF270) in filtering synthetic AMD containing REEs (La, Pr, Nd, Sm, Dy and Yb) under different conditions of acidity 33
(i.e. by varying sulphuric acid concentration), in which a pH range from 2.5 to 1.0 was studied. Experiments of 34
membrane ageing were carried out to quantify the changes in membrane performance after being aged in 1 M 35
sulphuric acid for 1 month. Ions rejection data were modelled with the Solution‐Diffusion Model (SDM) to 36
determine the membrane permeances to ions in solution. Equilibrium reactions at the acidity conditions of AMD 37
(e.g. acid/base or complexing reactions) were considered. NF270 membranes were characterised by ATR‐FTIR, 38
AFM and XPS to quantify changes in membrane properties after the ageing treatment in sulphuric solutions. The 39
novelties of this work are, on the one hand, the efforts to describe the ion transport mechanisms through the NF 40
membrane considering ion speciation and, on the other, the effect of ageing the membrane on its performance in 41
filtering the synthetic AMD. 42

3
2. Experimentalmethodology1
2.1. Membranes,reagentsandsolutions2
Experiments were carried out with samples of commercial NF270 membrane supplied by Dow Chemical. NF270 3
membrane is a thin film composite made up of three different layers: a piperazine semi‐aromatic‐based 4
polyamide layer on the top, a polysulphone microporous support and a polyester non‐woven backing layer 5
[26,27]. Aged membranes were prepared by the immersion of NF270 sheets in a 1 M sulphuric acid solution for 6
one month at room temperature (20°C). After this contact time membranes sheets were withdrawn from the 7
sulphuric solution and cleaned with deionised water until the pH of the equilibrated water was close to neutrality. 8
Synthetic solutions were prepared by adding appropriate amounts of the metal‐sulphate, nitrate, chloride and 9
oxide salts and sulphuric acid. The following solutions and salts were used: H2SO4 (96 wt%, Sigma‐Aldrich); 10
Al2(SO4)3∙18 H2O (55%, Panreac); CaSO4∙2 H2O (100%, Scharlau); ZnSO4∙7 H2O (100%, Panreac); CuSO4 (100%, 11
Panreac); La2(SO4)3∙9 H2O (99.9%, Alfa Aesar); Pr(NO3)3∙6 H2O (100% Fluka AG); NdCl3∙6 H2O (100%, Fluka AG); 12
SmCl3 (100%, Fluka AG); Dy2O3 (99.9%, Fluka AG) and Yb2O3(99.9% Fluka AG). 13
2.2. Membranecross‐flowexperimentalset‐up14
The experimental set‐up has been previously described in [28]. Experiments were carried out with NF270 15
membrane (0.014 m2), which was placed in a test cell (GE SEPATM CF II) with a spacer‐filled feed channel, and with 16
the possibility to vary the cross‐flow velocity (cfv) and trans‐membrane pressure (TMP). The solution was kept at 17
a constant temperature (25 ± 2°C) in a thermostated 30 L tank and it was pumped into the cross‐flow cell with a 18
high pressure diaphragm pump (Hydra‐Cell, USA) at prefixed required flow rates and pressures. A manometer was 19
located at the entrance of the test cell. Both outputs of the cell (retentate and permeate) were recycled back to 20
the tank to keep a constant concentration in the feed solution. The system was provided with a needle and a by‐21
pass valve to vary the cfv, which was fixed, and the TMP. The first was located at the retentate stream, just at the 22
exit from the test cell. The concentrate passed through a manometer and a flow meter. Just before the discharge 23
of the retentate to the tank, a pre‐filter cartridge (100 µm, polypropylene) was placed to avoid erosion products 24
reaching the pump and to eliminate microorganisms. Permeate samples were collected by a three‐way valve. 25
Pipes were made of stainless steel. 26
Membranes were placed in Milli‐Q water overnight to remove conservation products. The membrane was 27
compacted at 22 bar and cfv of 1 m/s with deionised water and with the working solution for 2 h and 1.5 h, 28
respectively. Experiments were carried out at a pre‐fixed cfv (0.7 m/s) and TMP was varied. Conductivity was 29
measured on‐line in the permeate stream and samples were taken when conductivity was stable. Once the 30
experiment was finished, the membrane was cleaned with deionised water at 10 bar for 30 min and at 20 bar for 31
1.5 h. 32
Permeate samples were analysed with a conductivity‐meter and a pH‐meter. A data acquisition system was 33
programmed in LABVIEW® version 8.6 (Laboratory Virtual Instrumentation Engineering Workbench), which 34
collected data from the flow‐meter and the pressure‐meter. 35
2.3. Experimentaldesignformembraneperformanceinsulphuricsolutions36
Experiments were performed over a range of pH (1.0 ‐ 2.5) in order to reproduce different acidities typical of 37
AMD. In the first group of experiments (1 to 4 in Table 1), a virgin sample of NF270 was used and the model 38
solutions included four main components: a strong acid (sulphuric acid), a trivalent transition metal ion (Al), a 39
divalent transition metal ion (Zn) and a rare alkaline metal ion (Ca). By increasing the sulphuric acid concentration, 40
pH was varied from 2.5 to 1.0. 41

4
Synthetic solutions simulating the supernatant of a pre‐treated AMD from La Poderosa Mine at the Iberian Belt 1
(Huelva SW Spain) after being treated by limestone to remove Fe(III) were filtered (experiments 4 and 5). Pre‐2
treatment excluded the removal of Al at pH higher than 4, because REEs are entirely precipitated with the Al‐solid 3
basaluminite (Al4SO4(OH)10∙5H2O). The whole pre‐treatment process is described in detail by Ayora et al. [4]. 4
Typically, the concentrations of REE in AMD range from 0.2 up to 5 mg/L, which are around one to two orders of 5
magnitude lower than the main transition metal ions (20 mg/L Zn to 580 mg/L Al). REEs (La, Pr, Nd, Sm, Dy and 6
Yb) were added to the solution, which was then filtered using a virgin and an aged membrane in 1 M sulphuric 7
acid solution for one month. 8
Table 1. Experimental details on the NF270 assays with virgin and aged membranes 9
Experiment 1 2 3 4 5
pHinitial 2.5 1.9 1.5 1.0 1.0
Membrane Virgin Virgin Virgin Virgin Aged
H2SO4 inl (mM) 18.4 25.1 39.4 84 84
IS (ionic strength, mM) 52 66 96 169 169
[Al] TOT (mM) 12.4 12.7 12.6 20.7 20.7
[SO42‐] TOT (mM) 26.7 33.5 47.9 97.8 97.8
[Zn] TOT (mM) 0.65 0.65 0.65 0.71 0.71
[Ca]TOT (mM) 6.0 6.0 6.7 0.59 0.59
[Cu]TOT (mM) 0.6 0.6
[La] TOT (mM) 0.068 0.068
[Pr] TOT (mM) 0.072 0.072
[Nd] TOT (mM) 0.064 0.064
[Sm] TOT (mM) 0.045 0.045
[Dy] TOT (mM) 0.063 0.063
[Yb] TOT (mM) 0.043 0.043
10
2.4. Membranecharacterisationmethodologies11
The NF270 membrane functional groups were characterised by ATR‐FTIR spectroscopy (JASCO FT/IR‐4100) with 12
sixty‐four scanning times, providing a resolution of 4 cm‐1. The elementary composition of membrane active layer 13
was analysed by an X‐ray photo electron spectroscopy (XPS, SPECS system) using an Al anode XR50 source 14
operating at 150 W and a Phoibos MCD‐9 detector at vacuum lower than 10‐8 mbar. The area of analysis was 0.8 15
mm2 and accuracy of binding energies was 0.1 eV. Membrane samples were completely dried under vacuum at 16
40°C for 4 h before XPS and ATR‐FTIR characterization. 17
Static contact angles were measured by a contact angle goniometer (OCA15EC, Dataphysics, Germany) equipped 18
with a video camera. Water droplet morphologies and contact angles were analysed by the SCA 202 software 19
(Dataphysics). At least five water contact angles at different locations on one membrane surface were averaged 20
to obtain a reliable value. Streaming potential measurements were performed by Anton Paar GmbH (Graz, 21
Austria) with the SurPASS Adjustable Gap Cell in presence of a 1 mM solution of KCl as background electrolyte at 22
pH values from 2.5 to 5, which was adjusted with 0.1 M HCl or 0.1 M NaOH solutions. For each measurement, a 23
pair of membrane pieces (cross section of 20 × 10 mm2) was used. The membrane zeta potential was calculated 24
by the Helmholtz– Smoluchowski equation [29]. 25
Surface roughness analysis was performed by atomic force microscopy (AFM, Multimode Veeco V) using contact 26
mode in air. The scanning area was 1x1 µm. The membrane samples were completely dried under vacuum at 40°C 27
for 24h before the SEM and AFM measurements. Nanoscope software was used to collect and analyse the 28
images. 29

5
Aqueous Solutions Chemical Analyses 1
The pH and electrical conductivity were measured in situ. Filtered samples (0.1 μm nylon) were acidified with 2
HNO3 and diluted appropriately for the analysis of major (Al, Ca, Zn, Cu, S) and REEs by inductively coupled plasma 3
atomic emission spectroscopy (ICP‐AES, Perkin‐Elmer® Optima 3200 RL) and inductively coupled plasma mass 4
spectroscopy (ICP‐MS, Perkin‐Elmer® SciexElan 6000), respectively. 5
3. Ion‐transportmodellingthroughNFmembranesfromsulphuricacidsolutions6
Modelling of ion rejection was carried out using the Solution‐Diffusion Model (SDM) [30–33]. Ion flux was 7
described according to Niewersch et al. [34,35] assuming that there is no coupling between solute and solvent 8
flow inside the membrane and then the reflection coefficient is assumed to be equal to one. Recent studies have 9
shown that in RO and NF membranes, the convective coupling of solvent flux and ions in the membrane phase is 10
very weak [36–38]. Ion flux is described according to the following equation (Eq. 1): 11
(Eq. 1) 12
Where is the flux of component i through the membrane, is the dimensionless position in the membrane, is 13
the membrane permeance to ion i, is the concentration of component i, is the activity coefficient of 14
component i, is the valence charge of component i and is the dimensionless virtual electrostatic potential in 15
the membrane. The activity coefficient was calculated by using the Davies Equation (Eq.2): 16
log ∗ √
√0,3 (Eq.2) 17
The approach uses “virtual concentrations”, which are defined as those which are in thermodynamic equilibrium 18
with an infinitely small fluid volume inside the membrane [32,35]. Membrane permeance to ion is a function of 19
thermodynamic diffusion coefficient inside the membrane, partitioning at the surface membrane‐solution and 20
membrane properties [34,35]. Due to the dependence of the diffusion coefficient on concentration, membrane 21
permeance to ions will also depend on it. Nevertheless, membrane permeances across the membrane, as a 22
preliminary hypothesis, are assumed to be constant. By simplicity, concentration polarisation was not taken into 23
account. 24
Due to the existence of chemical reactions between the different species in solution, mass transport equations 25
are referred to the total concentration of the component in solution. These equations will include all of the 26
species of a given component which are present in the solution. The species are also subjected to the electro‐27
neutrality condition (Eq.3): 28
∑ 0 (Eq.3) 29
From the measured total ion concentrations and equilibrium constants, the concentration of each species was 30
determined. Mass balance equations were solved using Matlab®, in which the membrane permeances to ions 31
were varied by minimising the error between the total rejection of one component obtained experimentally and 32
the one obtained from the model. Total component or individual ion rejection (R) is defined according to (Eq.4): 33
1 (Eq.4) 34
Where Cp and Cf represent the total concentration regardless of its speciation or the individual concentration of 35
one specie in the feed and permeate streams, respectively. 36
6
Mass balance equations were written for each element in solution: H, S, Al, and so on. In Annex I, chemical 1
speciation of the filtered solutions is presented (diagrams were built with the Hydra/Medusa Code [39]). The main 2
equilibrium constants of the metal‐sulphate complexes from the Hydra data base [39] are summarised in Table 2. 3
Table 2. Chemical equilibrium constants for the species in the solution (Hydra database) [39] 4
Chemical reaction pK log K , Chemical reaction pK log K ,
↔ 1.98 ↔ 3.62
↔ 3.50 2 ↔ 4.90
2 ↔ 5.00 ↔ 3.64
↔ 2.30 2 ↔ 5.10
↔ 3.07 ↔ 3.65
↔ 2.31 2 ↔ 5.20
↔ 2.37 ↔ 3.61
2 ↔ 3.28 2 ↔ 5.10
↔ 3.62 ↔ 3.59
2 ↔ 5.10 2 ↔ 5.10
5
In the first set of experiments (experiments 1 to 3 in Table 1), 11 species were presented, while in the second set 6
of experiments (4 and 5 in table 1), 32 species were in solution. The huge number of variables to optimise 7
represented a problem in terms of processing time. For that reason, the system was solved taking only the major 8
components into account. With this approach, previously applied by Yaroshchuk et al. [32], the electric potential 9
gradient is defined only by the major components, which allows the mathematical model to resolve trace ions 10
one by one. This approach would allow the number of variables solved simultaneously to be reduced, and was 11
translated into an improvement of the resolution time. Ion traces were considered those components whose 12
concentration was less than 5% of the major components in solution. 13
4. Resultsanddiscussion14
15
4.1. Recoveryofsulphuricacidandrejectionofdominantmetalspecies16
Figure 1 shows the rejection curves for the dominant electrolyte (H+/SO42‐) in the presence of model metals (Al, Zn 17
and Ca) as a function of transmembrane volume flow. Rejection was referred to the total component in solution 18
regardless of its speciation, taking into account the values measured in solution for S, Al, Ca and Zn. The symbols 19
represent the experimental points and the lines were derived by using the SDM equations (Eq. 1). Calculated 20
membrane permeances to aqueous species are collected in Figure 2. In general, good agreement was obtained 21
between experimental and modelled data for all of the dominant components (S, Al, Ca and Zn), except for the 22
case of hydrogen ions (H+), especially at higher pH values (1.9 and 2.5), resulting on an overestimation of its 23
concentration. Rejection of sulphur at the maximum transmembrane flow decreased from 80% at the highest pH 24
value evaluated (2.5) to 45% rejection at pH 1.0. This decrease was driven by: a) changes in speciation with pH, 25
which resulted in the predominance of HSO4‐ at lower pH (<1.98) and of SO4
2‐ at higher pH (>1.98); and by b) 26
changes in the membrane acid‐base properties, as free carboxylic and amine groups of the piperazine structure 27
were protonated at lower pH, respectively, to R‐COOH and R2NH2+. NF270 isoelectric point (IEP) was determined 28
experimentally, given a result of 3.4 ±0.1, which lies in between most of the published values of 2.8 to 3.5 [40]. 29
30

7
1
2
3
Figure 1. Rejection curves for the 1st set of experiments. Experiments were performed at cfv = 0.7 m/s. Solid lines represent the model 4 prediction and the points the experimental data. (1) pH = 2.5; (2) pH = 1.9; (3) pH = 1.5; (4) pH = 1.0 . The membrane permeances used 5 were those collected in Figure 2. 6
Although this characterisation technique does not provide information in terms of concentration of carboxylic 7
(RCOOH/R‐COO‐) and amine (R‐NH3+/R‐NH2) groups or on the acidity constants of carboxylic groups, it can be 8
assumed that for the experimental conditions used in this study (pH<2.5), the carboxylic groups were fully 9
protonated (R‐COOH). No information on the acid‐base properties of the free membrane amines in the pH range 10
evaluated in the IEP measurement (2 to 5) has been reported. Recently, Fernández et al. [41] have postulated 11
potential piperazine groups and their theoretically calculated pKa values. Accordingly, the acid‐base membrane 12
properties could be defined by eq. 5‐6: 13
For the carboxylic groups: ↔ (Eq. 5) 14
For the piperazine groups: ↔ (Eq.6) 15
Where P represents the polyamide structure, COOH the carboxylic group, NR2 the piperazine groups and B+ 16
represents an alkaline cation, typically K or Na from the solutions used during the polyamide polymerisation 17
stage. 18
Navarro et al [23] evaluated the effect of acidic treatments (e.g. HF, H3PO4) onto polyamide‐based NF membranes 19
(DL) and found that for all of the membranes studied the IEPs corresponded to amphoteric surfaces. Given an 20
‐0,4
‐0,2
0
0,2
0,4
0,6
0,8
1
0 10 20 30 40 50
Rejection, R
Transmembrane flow, Jv (µm/s)
(1) pH = 2.5
‐0,4
‐0,2
0
0,2
0,4
0,6
0,8
1
0 10 20 30 40 50
Rejection, R
Transmembrane flow, Jv (µm/s)
(2) pH = 1.9
‐0,4
‐0,2
0
0,2
0,4
0,6
0,8
1
0 10 20 30 40 50
Rejection, R
Transmembrane flow, Jv (µm/s)
(3) pH = 1.5
‐0,4
‐0,2
0
0,2
0,4
0,6
0,8
1
0 10 20 30
Rejection, R
Transmembrane flow, Jv (µm/s)
(4) pH = 1.0

8
active surface of the PA layer, positive charges could be attributed to the protonation of the amine groups, while 1
the negative zeta potential could be due to the dissociation of the carboxylic groups. The pre‐treatments 2
displaced the IEP towards lower pH values independent of the pre‐treatment times. 3
Then, conditioning the membranes in acidic sulphuric solutions is accompanied by the protonation of the nitrogen 4
atom of the piperazine groups, and the formation of an ionic pair with HSO4‐ major anion in the studied solutions. 5
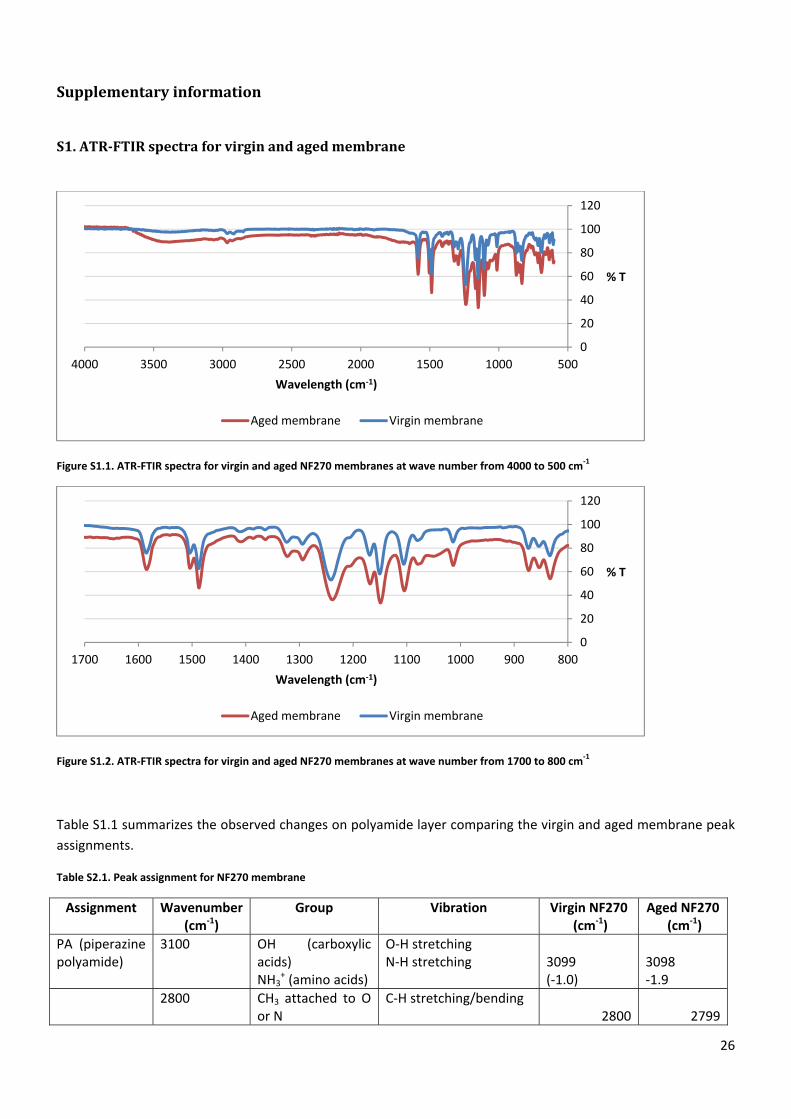
Analysis of FTIR (Figure S1.1 & S1.2 and Table S1.1, supplementary information) and XPS of virgin and aged 6
membranes conditioned with sulphuric acid solutions, confirmed the presence of NH+ (e.g. protonated amines) 7
and OH‐ (e.g. HSO4‐ and carboxylic acid groups) with a large band at 3400 cm‐1 when virgin and aged membranes 8
were compared. The FTIR spectra of the sulphuric aged NF270 membrane sample revealed a new band at 1468 9
cm‐1, which could be assigned to the stretching mode of HSO4‐. The presence of HSO4
‐ ions was also corroborated 10
by the XPS spectra of the sulphuric aged sample with a band at 170 eV for S(2p). This band was not detected on 11
the virgin N270. Table 3 collects the molar percentage of O, C, N and S for virgin and aged membrane. It can be 12
seen that S/N molar ratio approaches to 1, indicating that most of the N atoms of the piperazine groups are 13
protonated to the HSO4‐ form (P‐NR2H
+HSO4‐). It should be remembered that piperazine groups contain two N 14
atoms per molecule and only one terminal could be protonated. 15
Table 3. Atomic ratios and molar percentage of carbon, oxygen, nitrogen and sulphur in the membrane by XPS. 16
% C % O % N % S C/O O/N S/O
Virgin membrane 72.5 16.8 10.7 ‐ 4.3 1.6 ‐
Aged membrane 66.0 23.0 4.9 6.2 2.9 4.7 0.3
17
Under the acidic conditions in which the filtration experiments were conducted, the polyamide layer was 18
equilibrated with sulphuric acid solutions. This favoured the transport of anions through the membrane and, thus, 19
a decrease of the sulphuric rejection. Consequently, ion transport phenomena were controlled by the dominant 20
electrolyte (H+ SO4‐) which drove the transport of other cationic species in solution to accomplish the 21
electroneutrality condition. The membrane permeance to H+ increased when pH was lowered and when sulphuric 22
acid concentration increased, while the permeances for the double charged anions (SO42‐ and Zn(SO4)2
2‐) 23
decreased with both influencing factors. 24
High metal rejections were obtained in accordance with the fact that feed solution pH was below the membrane 25
IEP value, which resulted in a positively charged membrane, leading to higher cation rejections. Rejection values 26
for Al, Ca and Zn increased from values around 75% at pH 2.5 up to values higher than 99% for pH 1. Although all 27
these metals presented an oxidation state of +2 and +3 (Al, Ca and Zn), speciation analysis (Annex I) for the 28
different synthetic solutions studied showed that these elements were mainly complexed, forming species with a 29
single charge (AlSO4+, CaHSO4
+), double charge (Zn(SO4)22‐) and even with no charge (CaSO4(aq) or CuSO4 (aq)). 30
This is of particular importance because ion rejection is mainly determined by Donnan exclusion and dielectric 31
exclusion, which are strongly influenced by the membrane fixed charges and the ion charges [42]. Donnan 32
exclusion is caused by charge interactions between ions in solution and the membrane surface. Dielectric 33
exclusion is caused by the interaction between ions and the bound electric charges induced by ions at the 34
interfaces in media of different dielectric constants (bulk solution/polymeric matrix). It was commonly believed 35
that the main rejection mechanism was Donnan exclusion, which is caused by a fixed electric charge. However, 36
Donnan exclusion could not explain the high rejection of multi‐valent counter‐ions, resulting in an 37
underestimation of their values. Dielectric exclusion was postulated to improve the understanding of these 38
rejections [42]. 39

9
Of all of the ions in solution, and although the ionised membrane groups were expected to be protonated, the 1
lower charged species such as H+, AlSO4+ and CaHSO4
+ were better transported according to the dielectric 2
exclusion mechanism and driven by the need to achieve electroneutrality due to the transport of HSO4‐. Proton 3
(H+) was the most favoured cation to permeate, because of its small size and its high concentration in such acidic 4
stream compared with other cations in solution. Those with the higher absolute charge were more rejected 5
according to the dielectric exclusion mechanism. 6
The reduction of pH led to a decrease in HSO4‐ rejection. This favoured the passage of H+ through the membrane, 7
resulting in negative rejection values, which in turn made the rejection of positively charged metal species higher. 8
9
Figure 2. NF270 membrane permeances to major species, Pi (µm/s), for sulphuric solutions containing transition metallic ions (Ca, Zn 10 and Al) at four different pH values. 11
Figure 2 collects the membrane permeance values obtained from the SDM and considering all the chemical 12
species present in solution. The predicted values followed the expected trends, in which the permeance to an ion 13
decreased as absolute value of the ion charge increased, e.g. single charged species Al(SO4)2‐ showed higher 14
membrane permeances than double charged species (SO42‐, Zn(SO4)2
2‐). Among the different mechanisms used to 15
describe the separation in NF membrane, dielectric exclusion explained the obtained values [42]. 16
From Figure 2 the contribution of each species to the global rejection of the major electrolytes (H2SO4, Al2(SO4)3, 17
CaSO4, ZnSO4) could be analysed. The most reactive species was SO42‐ ion, which presented up to seven different 18
forms in solution (SO42‐, HSO4
‐, AlSO4
+, Al(SO4)2‐, ZnSO4, CaSO4 and CaHSO4
+) followed by Al, Zn and Ca with three 19
species in solution each. In general, permeances for most of the metal and metal‐sulphate complexes had 20
permeance values ranging from 100 to 1000 times lower (e.g, Al3+, Ca2+ and Zn2+) than the fastest ions (H+, HSO4‐). 21
It is worth mentioning that non‐charged complexes such as ZnSO4(aq) and CaSO4(aq) exhibited permeances values 22
around one order of magnitude higher than those of charged species (AlSO4+, Al(SO4)2
‐ and CaHSO4+). 23
It is reported that membrane permeances to both salt and ions are dependent on total electrolyte concentration 24
[43]. In this study, values of permeance to single charge ions showed variations mostly lower than 10% over the 25
ionic strength (IS) range evaluated (from 1.5x10‐1 M at pH = 1 to 5x10‐2 M at pH = 2.5), while permeance values to 26
ions with higher charge decreased with the increase of IS. This strong decrease of permeance with the increase of 27
0,001
0,01
0,1
1
10
100
1000
H+
HSO
4‐
SO42‐
Al3+
AlSO4+
Al(SO
4)2 ‐
Zn2+
ZnSO
4
Zn(SO4)2 2‐
Ca2
+
CaSO4
CaH
SO4 +M
embrane perm
ean
ce to io
n, P
i (µm/s)
1 1.5 1.9 2.5
10
the electrolyte concentration was accompanied by a strong increase of the acidity, which modified the acid‐base 1
properties of the membrane and then affected the transport of cations across the membranes. At pHs lower than 2
IEP, membrane exhibited a positive charge, and an electro‐repulsion was produced between the polymer and the 3
cations in solution, which became larger as the pH decreased. An opposite tendency was observed for the anions 4
in solution. One main open question to be solved is the partitioning of non‐charged species such as CaSO4(aq) or 5
CuSO4 (aq). Such species are not expected to be influenced by electric fields and probably other mechanism 6
should be evaluated. 7
Metal rejection results in sulphuric solutions were compared with published data using different NF membranes. 8
Table S2.1 (supplementary information) sums up feed composition, pH, membrane properties and operation 9
parameters. At low pH, sulphate rejection was found to be relatively low and increased when pH was also 10
increased. For all cases, transition metal rejection was found to be high and independent of pH. Only Niewersch 11
et al. [34] modelled ion rejections from sulphuric solutions originated from the dissolution of domestic sewage 12
sludge incineration bottom ash using NF. Modelled ion rejection (for total P, Al, Mg and H+) as a function of the 13
permeate flux compared relatively well with the measured rejections. The strongest deviation was observed for 14
the rejection of H+ ions at higher permeate flux, for which the modelled rejection was, as in the present study, 15
overestimated. As NF membranes used in their study and the present one had different chemical properties, 16
comparison of membrane permeances to ions was not possible. 17
4.2. Rejection ofREEmetalspecies(La,Sm,Pr,Nd,Dy,Yb) 18
4.2.1 Virgin membrane 19
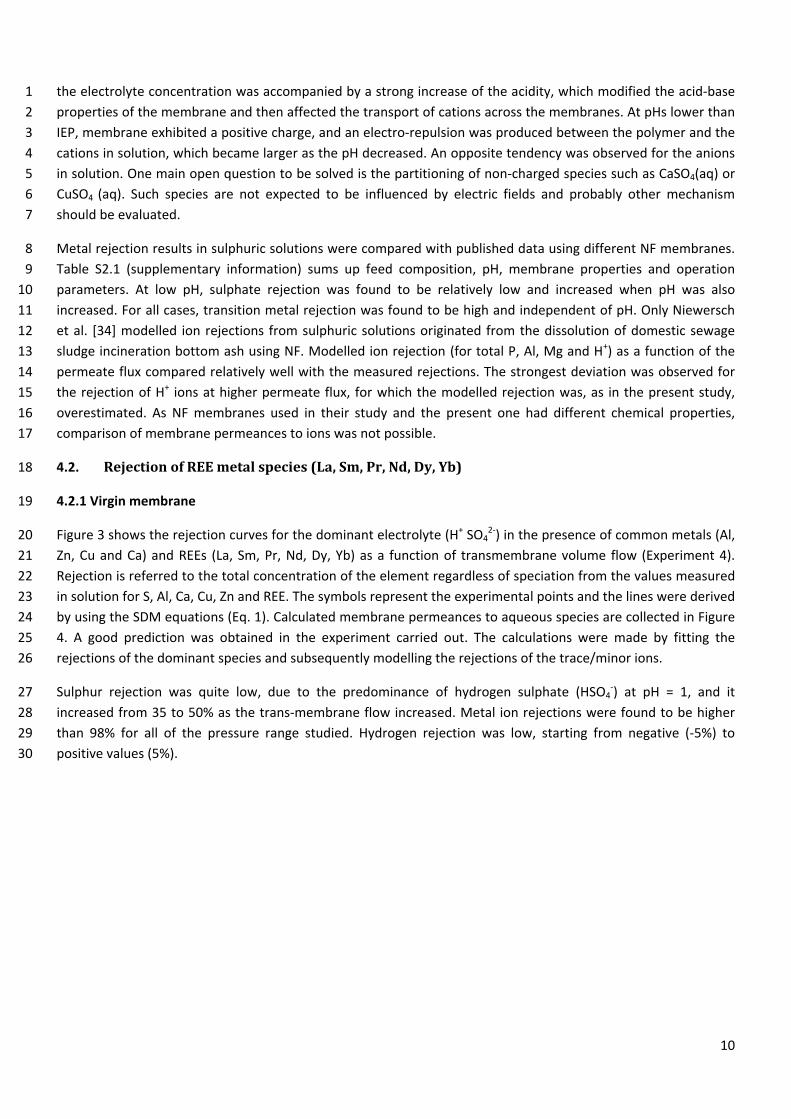
Figure 3 shows the rejection curves for the dominant electrolyte (H+ SO42‐) in the presence of common metals (Al, 20
Zn, Cu and Ca) and REEs (La, Sm, Pr, Nd, Dy, Yb) as a function of transmembrane volume flow (Experiment 4). 21
Rejection is referred to the total concentration of the element regardless of speciation from the values measured 22
in solution for S, Al, Ca, Cu, Zn and REE. The symbols represent the experimental points and the lines were derived 23
by using the SDM equations (Eq. 1). Calculated membrane permeances to aqueous species are collected in Figure 24
4. A good prediction was obtained in the experiment carried out. The calculations were made by fitting the 25
rejections of the dominant species and subsequently modelling the rejections of the trace/minor ions. 26
Sulphur rejection was quite low, due to the predominance of hydrogen sulphate (HSO4‐) at pH = 1, and it 27
increased from 35 to 50% as the trans‐membrane flow increased. Metal ion rejections were found to be higher 28
than 98% for all of the pressure range studied. Hydrogen rejection was low, starting from negative (‐5%) to 29
positive values (5%). 30
11
1
Figure 3. Rejection curves for NF270 in sulphuric solutions containing mixtures of transition metal ions and REEs at pH 1. Experiments 2 were performed at pH = 1 and cfv = 0.7 m/s. Solid lines represent the model prediction using the SDM equations (Eq. 1) and the points 3 the experimental data. 4
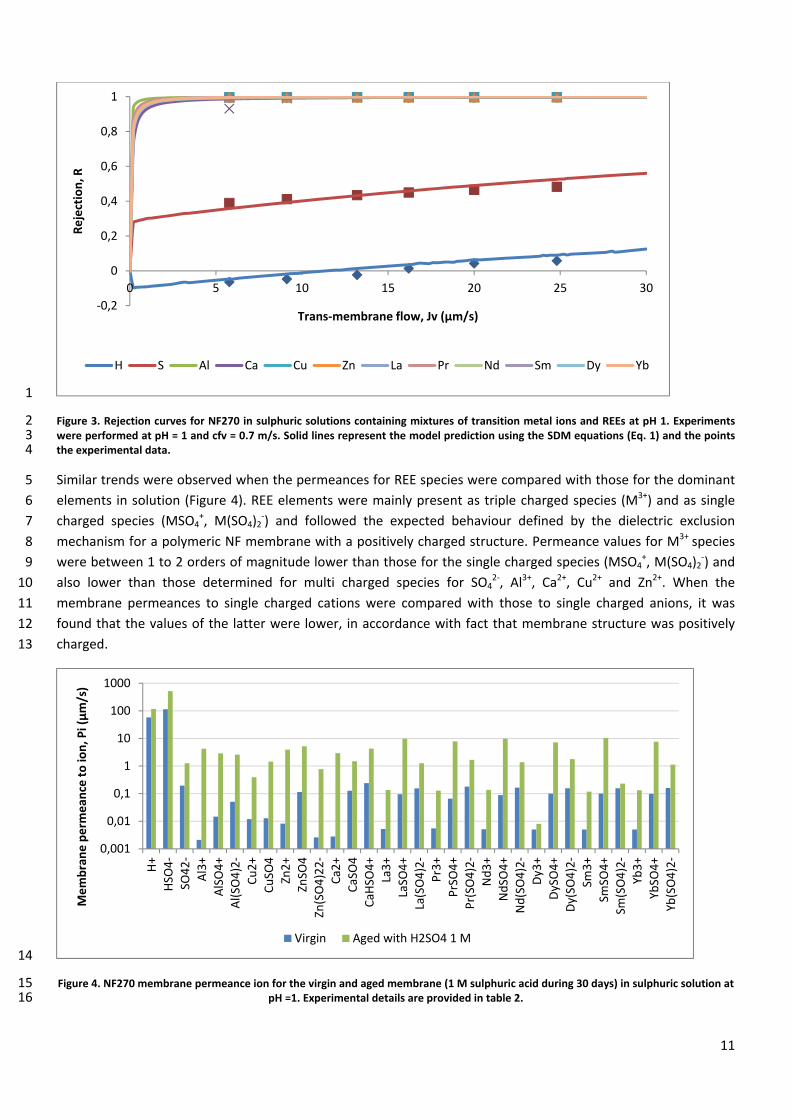
Similar trends were observed when the permeances for REE species were compared with those for the dominant 5
elements in solution (Figure 4). REE elements were mainly present as triple charged species (M3+) and as single 6
charged species (MSO4+, M(SO4)2
‐) and followed the expected behaviour defined by the dielectric exclusion 7
mechanism for a polymeric NF membrane with a positively charged structure. Permeance values for M3+ species 8
were between 1 to 2 orders of magnitude lower than those for the single charged species (MSO4+, M(SO4)2
‐) and 9
also lower than those determined for multi charged species for SO42‐, Al3+, Ca2+, Cu2+ and Zn2+. When the 10
membrane permeances to single charged cations were compared with those to single charged anions, it was 11
found that the values of the latter were lower, in accordance with fact that membrane structure was positively 12
charged. 13
14
Figure 4. NF270 membrane permeance ion for the virgin and aged membrane (1 M sulphuric acid during 30 days) in sulphuric solution at 15 pH =1. Experimental details are provided in table 2. 16
‐0,2
0
0,2
0,4
0,6
0,8
1
0 5 10 15 20 25 30
Rejection, R
Trans‐membrane flow, Jv (µm/s)
H S Al Ca Cu Zn La Pr Nd Sm Dy Yb
0,001
0,01
0,1
1
10
100
1000
H+
HSO
4‐
SO42‐
Al3+
AlSO4+
Al(SO
4)2‐
Cu2+
CuSO
4
Zn2+
ZnSO
4
Zn(SO4)22‐
Ca2
+
CaSO4
CaH
SO4+
La3+
LaSO
4+
La(SO4)2‐
Pr3+
PrSO4+
Pr(SO
4)2‐
Nd3+
NdSO
4+
Nd(SO4)2‐
Dy3+
DySO4+
Dy(SO
4)2‐
Sm3+
SmSO
4+
Sm(SO4)2‐
Yb3+
YbSO
4+
Yb(SO4)2‐
Membrane perm
ean
ce to io
n, P
i (µm/s)
Virgin Aged with H2SO4 1 M

12
1
4.2.2. Aged membrane 2
Figure 5 shows the measured and predicted rejection curves for the NF270 membrane aged in 1 M sulphuric acid 3
for one month. Points represents the experimental data and the solid lines the theoretical prediction. As 4
previously mentioned, the system was solved with major components in solution (H+, SO42‐ and Al). Then, 5
mathematical equations describing ion flux for traces (REE, Ca, Cu and Zn) were solved separately. Membrane 6
permeances to ion are also presented in Figure 4. 7
8
Figure 5. Rejection curves for aged NF270 in sulphuric solutions containing mixtures of transition metal ions and REEs at pH 1. 9 Experiments were performed at pH = 1 and cfv = 0.7 m/s. Solid lines represent the model prediction and the point the experimental 10 data. 11
Rejections of the major elements decreased from 99% to 70–80% for the metal species (Al, Ca, Cu and Zn) and 12
slightly diminished for sulphur from 40 to 30%. These differences could be attributed to the fact that membrane 13
aged in 1 M sulphuric acid suffered both physical and chemical modifications in such strong acidic conditions. 14
Accordingly, these changes led to an equivalent increase in the membrane permeances to ions (Figure 4) for all of 15
the species involved, e.g. between one and three orders of magnitude for multi‐charged species, especially 16
trivalent ions. For example, in the case of HSO4‐, the permeance increased from 114 to 500 µm/s, and the same 17
happened for the double‐charged sulphate (from 0.2 to 1.3 µm/s). Membrane permeances for non‐charged 18
species have increased by a factor of 10 as minimum (e.g. CaSO4). The differences became more significant in the 19
case of trivalent species, e.g. permeance for free ion lanthanum increased from 0.001 to 0.135 µm/s. 20
Hydraulic permeability, at cfv of 1 m/s and a TMP=22 bar, increased from 3.4 ± 0.3 µm/s up to 4.0 ± 0.3 µm/s 21
after ageing in 1 M sulphuric acid. Ricci et al. [44] reported an increase in water permeability of between 100 and 22
300% after four weeks of ageing using more diluted sulphuric acid solutions (e.g. 0.15 and 0.3 M) for a RO 23
membrane based on polyamide and a NF membrane based on polysulphide and polyethersulphone. In contrast, 24
Tanninen et al. [45] reported a decrease in water permeability from 36.4 to 17.5 µm/s (at a cfv of 2.5 m/s and a 25
TMP = 15 bar) for NF270 with mixtures of copper sulphate and sulphuric acid. By assuming a pore flow model, in 26
which a reduction in the values of reflection coefficients were considered after 8 weeks of exposure, it led to an 27
increase of the solute convective flux caused by the increase of membrane pores sizes, resulting from its 28
‐0,2
0
0,2
0,4
0,6
0,8
1
0 5 10 15 20 25 30
Rejection, R
Trans‐membrane flux, Jv (µm/s)
H S Al Ca Cu Zn La Pr Nd Sm Dy Yb

13
degradation. However, no evidence was provided to confirm the effect of the acidity of the polyamide active layer 1
structure. 2
The effect of exposure of the NF270 membrane to acidic conditions on its hydrophilicity was evaluated by 3
determining the contact angle before and after four weeks of exposure. The virgin NF membrane presented a 4
contact angle between 23o‐32o, indicating a hydrophilic character [46–48]. The discrepancy between these angles 5
can be attributed to differences in the operating conditions employed in each of the tests, such as the drop 6
volume, temperature, humidity, and time measurements. After four weeks of immersion in sulphuric acid the 7
contact angle rose to 23.2‐53° (Figure S3.1, supplementary information). Ricci et al. [44], when evaluating the 8
ageing of MPF‐34 NF membrane with sulphuric solutions, reported the same behaviour, which was attributed to 9
the degradation of the selective layer and exposure of the support layer with a greater hydrophobic character. 10
Chemical and physical changes of the piperazine‐amide selective layer of NF270 were evaluated with XPS, FTIR 11
and AFM. AFM surface images of 1x1 µm are shown in Figure 6. The light regions represent the highest points and 12
the dark points are the depressions of the membrane. Contact mode AFM was used to obtain the roughness 13
(RMS) prior and after four weeks to exposure to sulphuric solution. The virgin membrane surface appeared 14
homogenous, while after four weeks of exposure to sulphuric acid, the emergence of scattered areas with 15
changes in the selective layer and an increase in RMS roughness was noticed from 3.4 ± 0.2 nm to 1.9 ± 0.2 nm, 16
indicating degradation of the selective layer and exposing the support layer. The small value of roughness was 17
also reported by Fernández et al. [41], who concluded that the roughness of NF270 in comparison with a fully 18
aromatic NF membrane NF90 was overtly lower as a consequence of the cross‐linking degree of the monolayers 19
that constitutes the membrane surface. 20
21
22

14
1
Figure 6. AFM images for NF‐270 membrane; (a) Virgin, (b) Aged in1 M sulphuric acid 2
The effect of the exposure of the membrane to an acidic sulphuric solution on the chemical composition of the 3
polyamide layer was also analysed by ATR‐FTIR (Figures S1.1 & S1.2, supplementary information). The resulted 4
spectra consisted of a superposition of the active (polyamide) and the intermediate layer (polysulphone), due to 5
the fact that the radiation penetration depth was higher than the thickness of the active layer. Identification of 6
the polymer bands of the active semi‐aromatic polyamide layer is summarised in Table S1.1 (supplementary 7
information) [49–56]. The main changes were associated to the protonation of the piperazine amine groups 8
(NH2+) and OH‐ groups with a wide band at 3400 cm‐1 and to the presence of HSO4‐ due to the appearance of three 9
new bands (1468 cm‐1 stretching band S=O; 1100 cm‐1 OH stretching and 894.1 cm‐1 S‐O stretching) [56]. Navarro 10
et al. [23], when analysing an aromatic polyamide based membrane (DSL) treated with HF and H3PO4, found that 11
the relative relevance of the C=O bands (amide and acid) remained constant when compared with virgin samples. 12
However, with H3PO4 solutions, there was an initial widening of the amide carbonyl band without changes in the 13
relative intensity of C=O bands, and the amide carbonyl band was narrower and decreased when compared to the 14
carboxylic group and different peaks linked to the polyamide also decreased suggesting a potential hydrolysis of 15
the polyamide membrane groups. A potential mechanism was postulated, initiated by the protonation of the C=O 16
group of the amide as described by Eq. 7 17
‐(R‐‐NH‐(C=O)—R)n‐‐ +H+X‐ ↔ ‐(R‐‐NH‐(C=O)H+X‐ ‐‐R)n‐‐ (where X
‐ is the strong electrolyte (HSO4‐)) Eq. 7 18
XPS analysis confirmed the presence of sulphate in the acidic aged samples. Then, in a second step, the hydrolysis 19
of the C=O promoted the formation of free amine and carboxylic groups on the structure. The reduction in cross‐20
linking of the polyamide layer could lead to an increase in the free‐volume size. As dielectric exclusion from the 21
polymer network pores of the membranes with closed geometry is shown to be essentially stronger than that 22
from free volume with relatively open geometry [57], the modification of the PA seemed to weaken the screening 23
mechanism resulting in an increase of permeances to ions for all the species. 24
XPS results showed the presence of carbon, oxygen and nitrogen in both membranes, in addition to the presence 25
of sulphur in the aged membrane, as shown in Table S4.1 (supplementary information). Peaks were centred in 26

15
170 eV for S(2p), 284.9 eV for C(1s), 399 for N(1s) and 531 eV for O(1s). Hydrogen was not included in the list 1
above, due to the unsuitability of XPS for its analysis. Table 3 collects the ratios between the different elements. 2
Oxygen atomic ratio (O/N) lay between 1 and 2. In a fully cross‐linked polyamide, each oxygen is bound to a 3
nitrogen atom in an amide bond (O/N of 1) while in a fully linear polyamide (O/N ratio of 2), as there are 4
additional oxygen atoms in the free carboxylic groups [51]. The higher ratio of O/N and lower of C/O of aged 5
membrane suggested a certain hydrolysis of the polyamide chain due to a higher degree of free carboxylic groups. 6
The appearance of sulphur in the active layer is also noticeable. The presence of sulphate in the membrane could 7
be explained by a partial hydrolysis or protonation of the N atoms of the piperazine groups. Additional 8
information of the structure changes was obtained by analysis by deconvolution of the main element peaks 9
shown in Table S4.1 (supplementary information); while Table S4.2 (supplementary information) summarises the 10
peak assignment and their contribution to the total peak surface area. 11
For the virgin membrane, three peaks were identified for C (1s): at 284.6 eV, which was associated to C‐C, C‐H and 12
C=C chemical bindings; at 285.8 eV which was related to C‐O and C‐N chemical bindings; and at 287.56 eV, 13
associated to C=O‐N, N=C and C=O chemical bindings; [47,51,58]. The aged membrane showed the presence of 14
new peaks at 291.4 and 292.7 eV associated to π ‐ π bonds. For nitrogen, two peaks were found at 399.9 and 15
401.5 eV, which were associated to C‐N, C=N, O=C‐N and to ‐NH3+, ‐NH2R
+ chemical bindings, respectively. In 16
relation to the proportion of these types of nitrogen binding, the contribution for the first one was around 95% 17
and 5% for the other one. Their contribution, however, changed for the aged sample. The component at 399.9 eV 18
for N(1s) decreased down to 52% of total nitrogen peak intensity, which meant a strong increase of the NH3+ 19
groups. Similar results have been reported by Stevens et al. [59] when analysing complex amino acids and by 20
Amaral et al. [60] when chitosan was modified by phosphorylation. The upward shift of the electron bonding 21
energy of the peaks associated to protonated amine groups of the piperazine structure has also been reported by 22
FTIR analysis. 23
For oxygen, O(1s) levels are rather broad in nature (2 eV) and two peaks were identified at 531.2 eV, which was 24
associated to O=C‐N, C=O, C‐O chemical bindings, and at 532.8 eV associated to H∙∙∙O=C‐N, O=C‐O, C‐OH chemical 25
bindings [47]. For the aged membrane, one additional peak was observed at 531.6 eV, which was related to SO42‐ 26
[61]. Amaral et al. [60] associated this peak to a) physio‐sorbed water associated to HSO4‐ or b) HSO4
‐ bonds to 27
protonated amine groups. Additionally, an increase of the contribution of the peak at 532 eV associated to 28
oxygen atom on carboxylic protonated groups was observed from 24 to 64 %. It could be observed that for C (1s) 29
there was a decrease in the area of the peak related to C=O‐N, N=C, C=O chemical bindings; consequently, there 30
was an increase in the two other two. This suggests that the membrane had suffered partial hydrolysis, which led 31
to an increase of carboxylic and amine groups. The same conclusion could be achieved when the percentage of 32
bonds for O (1s) and N (1s) were compared. In the case of oxygen, the percentage of the peak related to O=C‐N 33
decreased while the one related to carboxylic group increased. Finally, for nitrogen a decrease of amide groups 34
was observed. 35
5. Conclusions36
37
The treatment of free iron AMD streams with a semi‐aromatic piperazine amide‐based NF membrane (NF270) 38
provided in an effective way to recover sulphuric and to concentrate metals. The high rejections for metal 39
obtained make NF an attractive technology to be combined with other procedures to recover REE metals such as 40
ion exchange resins. The membrane properties in such acidic media (1 to 2.5) was able to strongly change the 41
performance in neutral solutions as the free carboxylic and piperazine groups were fully protonated and acid‐base 42

16
properties changed. Transport of anionic species was favoured, as the membrane groups ionised were positively 1
charged, and as a consequence the major ion in solution (HSO4‐) was highly transported favouring the recovery of 2
sulphuric acid. Although the complex nature of the treated solutions, in terms of reactivity where metal and non‐3
metals species were forming a large number of complexes, its reactive transport was well described by using the 4
SDM. Membrane permeances to ions for the different species were determined and their values reflected 5
membrane properties. Ion transport seemed to be strongly controlled by the dielectric exclusion mechanisms and 6
ions with the higher charges (positive or negative) were well strongly rejected. In very narrow pores, dielectric 7
exclusion might be very strong, leading to a major screening and, then, to a separation improvement. However, it 8
should be reminded that in fine pores with electric walls, the electrostatic interactions between fixed charges and 9
counter‐ions were essentially stronger than in aqueous solution. Accordingly, the degree of dissociation of ionised 10
groups (e.g. amine and carboxylic) and the effective fixed charge density might be much smaller than those 11
expected from the acid‐base groups dissociation constant values. A finite degree of dissociation of ionized groups 12
made the interference between dielectric and Donnan exclusion a more complex phenomenon. To be able to 13
quantify the relative contributions of dielectric and Donnan exclusion a more detailed and complete 14
characterisation of membrane transport properties need to be performed. 15
Membrane stability in acidic solutions was accelerated by ageing one membrane in 1 M sulphuric acid for 30 days. 16
Chemical changes quantified by XPS and FTIR and contact angle indicated a partial hydrolysis of the amide groups 17
that entailed in a potential increase of permanent ionised groups, increasing the size of the free pore volumes and 18
consequently reducing the sieving mechanism controlled by the dielectric exclusion. Metal ion rejection, even 19
triple charged ions of Al and REE, and also double charged ions decreased from 99% to 70% while the transport of 20
the major electrolyte (H+/SO42‐) was slightly increased. Changes in the membrane have enhanced ion transport 21
and, as a consequence, the membrane permeance to ions. From the point of view of recovering strong acids (e.g. 22
sulphuric acid) the membrane performance was improved by its ageing in an acidic media. However, if the 23
objective is the rejection of metallic species, this target could be damaged by continuous acid exposure. 24
Membrane attack would decrease the rejection of metallic ions, and a portion of REE and transition metals would 25
be lost from the concentrate stream. Therefore, more stable membranes must be employed. In order to improve 26
the membrane performance under continuous operation, it is necessary to perform a stability test of the 27
membrane towards the specific solution to which it will be exposed. Values of membrane permeance to ions 28
would give a measurement of the membrane stability and they could be a solution to control membrane 29
performance. 30
Nomenclature31
a* Debye Hückel parameter
Concentration of component i inside the membrane
Concentration of component i in permeate side
IS Ionic strength
Ion flux
Solvent trans‐membrane flux
K Equilibrium constant
Membrane permeance to ion i
Dimensionless position in the membrane
Ion charge
Dimensionless electric potential in the membrane
Activity coefficient
32

17
Acknowledgments1
2
This research was supported by the CTM2014‐57302‐R, CGL2016‐78783‐C2‐02, CTM2014‐61221‐JIN and ERAMIN‐3 PCIN2015‐242‐256 projects financed by the Spanish Ministerio de Economía y Competitividad (MINECO) and by 4 the Catalan Government (Project Ref. 2014SGR50). The work of Julio López was supported by the Spanish 5 Ministry (MINECO) within the scope of the grant BES‐2015‐075051. The authors wish to thank Dow Chemical for 6 the supply of the membranes, M. Cabañas, R. Bartrolí and J. Bellés (IDAEA‐CSIC) for their analytical assistance and 7 A. Yaroshchuk for his valuable contribution to the work. 8
9
10

18
AnnexI–SpeciationdiagramsHydrogen Sulphate
Aluminium Calcium
Zinc
pH = 2.5

19
Hydrogen Sulphate
Aluminium Calcium
Zinc
pH = 1.9

20
Hydrogen Sulphate
Aluminium Calcium
Zinc
pH = 1.5

21
Hydrogen Sulphate
Aluminium Calcium
Zinc Copper
Lanthanum
pH = 1.0

22
References
[1] G.S. Simate, S. Ndlovu, Acid mine drainage: Challenges and opportunities, J. Environ. Chem. Eng. 2 (2014) 1785–1803. doi:10.1016/j.jece.2014.07.021.
[2] S.M. MacLennan, Rare Earth Elements in sedimentary rocks: Influence of provenance and sedimentary processes., B.R. Lipin G.A. McKay “Geochemistry Mineral. Rare Earth Elem. Rev. Mineral. (1989) 169–200.
[3] C.W. Noack, D.A. Dzombak, A.K. Karamalidis, Rare Earth Element Distributions and Trends in Natural Waters with a Focus on Groundwater, Environ. Sci. Technol. 48 (2014) 4317–4326. doi:10.1021/es4053895.
[4] C. Ayora, F. Macías, E. Torres, A. Lozano, S. Carrero, J.M. Nieto, R. Pérez‐López, A. Fernández‐Martínez, H. Castillo‐Michel, Recovery of Rare Earth Elements and Yttrium from Passive‐Remediation Systems of Acid Mine Drainage, Environ. Sci. Technol. 50 (2016) 8255–8262. doi:10.1021/acs.est.6b02084.
[5] J. Sánchez España, E. López Pamo, E. Santofimia, O. Aduvire, J. Reyes, D. Barettino, Acid mine drainage in the Iberian Pyrite Belt (Odiel river watershed, Huelva, SW Spain): Geochemistry, mineralogy and environmental implications, Appl. Geochemistry. 20 (2005) 1320–1356. doi:10.1016/j.apgeochem.2005.01.011.
[6] M. Olías, C.R. Cánovas, J.M. Nieto, A.M. Sarmiento, Evaluation of the dissolved contaminant load transported by the Tinto and Odiel rivers (South West Spain), Appl. Geochemistry. 21 (2006) 1733–1749. doi:10.1016/j.apgeochem.2006.05.009.
[7] C. Ayora, M.A. Caraballo, F. Macias, T.S. Rötting, J. Carrera, J.‐M. Nieto, Acid mine drainage in the Iberian Pyrite Belt: 2. Lessons learned from recent passive remediation experiences, Environ. Sci. Pollut. Res. 20 (2013) 7837–7853. doi:10.1007/s11356‐013‐1479‐2.
[8] A.L. Mackie, M.E. Walsh, Bench‐scale study of active mine water treatment using cement kiln dust (CKD) as a neutralization agent, Water Res. 46 (2012) 327–334. doi:10.1016/j.watres.2011.10.030.
[9] O. Gibert, J. de Pablo, J.L. Cortina, C. Ayora, Treatment of acid mine drainage by sulphate‐reducing bacteria using permeable reactive barriers: A review from laboratory to full‐scale experiments, Rev. Environ. Sci. Biotechnol. 1 (2002) 327–333. doi:10.1023/A:1023227616422.
[10] C.‐M. Neculita, G.J. Zagury, B. Bussière, Passive Treatment of Acid Mine Drainage in Bioreactors using Sulfate‐Reducing Bacteria: Critical review and research needs, J. Environ. Qual. 36 (2007) 1–16. doi:10.2134/jeq2006.0066.
[11] T. Ogata, H. Narita, M. Tanaka, Adsorption behavior of rare earth elements on silica gel modified with diglycol amic acid, Hydrometallurgy. 152 (2015) 178–182. doi:10.1016/j.hydromet.2015.01.005.
[12] K. Kondo, T. Matsuo, M. Matsumoto, Adsorptive separation of La, Ce and Pr using microcapsules containing 2‐ethylhexylphosphonic acid mono‐2‐ethylhexyl ester, Hydrometallurgy. 152 (2015) 204–213. doi:10.1016/j.hydromet.2015.01.004.
[13] L. Cifuentes, I. García, P. Arriagada, J.M. Casas, The use of electrodialysis for metal separation and water recovery from CuSO4‐H2SO4‐Fe solutions, Sep. Purif. Technol. 68 (2009) 105–108. doi:10.1016/j.seppur.2009.04.017.
[14] L. Cifuentes, M. Grágeda, G. Crisóstomo, Electrowinning of copper in two‐ and three‐compartment reactive electrodialysis cells, Chem. Eng. Sci. 61 (2006) 3623–3631. doi:10.1016/j.ces.2006.01.008.
[15] C.‐M. Zhong, Z.‐L. Xu, X.‐H. Fang, L. Cheng, Treatment of Acid Mine Drainage (AMD) by Ultra‐Low‐Pressure

23
Reverse Osmosis and Nanofiltration, Environ. Eng. Sci. 24 (2007) 1297–1306. doi:10.1089/ees.2006.0245.
[16] H. Al‐Zoubi, A. Rieger, P. Steinberger, W. Pelz, R. Haseneder, G. Härtel, Nanofiltration of Acid Mine Drainage, Desalin. Water Treat. 21 (2010) 148–161. doi:10.5004/dwt.2010.1316.
[17] H. Al‐Zoubi, A. Rieger, P. Steinberger, W. Pelz, R. Haseneder, G. Härtel, Optimization Study for Treatment of Acid Mine Drainage Using Membrane Technology, Sep. Sci. Technol. 45 (2010) 2004–2016. doi:10.1080/01496395.2010.480963.
[18] M. Mullett, R. Fornarelli, D. Ralph, Nanofiltration of mine water: impact of feed pH and membrane charge on resource recovery and water discharge, Membranes (Basel). 4 (2014) 163–180. doi:10.3390/membranes4020163.
[19] R. Fornarelli, M. Mullett, D. Ralph, Factors influencing nanofiltration of acid mine drainage, Reliab. Mine Water Technol. (2013) 563–568.
[20] T.J.K. Visser, S.J. Modise, H.M. Krieg, K. Keizer, The removal of acid sulphate pollution by nanofiltration, Desalination. 140 (2001) 79–86.
[21] S. Platt, M. Nyström, A. Bottino, G. Capannelli, Stability of NF membranes under extreme acidic conditions, J. Memb. Sci. 239 (2004) 91–103. doi:10.1016/j.memsci.2003.09.030.
[22] A. Manis, K. Soldenhoff, E. Jusuf, F. Lucien, Separation of copper from sulfuric acid by nanofiltration, in: Fifth Int. Membr. Sci. Technol. Conf., 2003.
[23] R. Navarro, M.P. González, I. Saucedo, M. Avila, P. Prádanos, F. Martínez, A. Martín, A. Hernández, Effect of an acidic treatment on the chemical and charge properties of a nanofiltration membrane, J. Memb. Sci. 307 (2008) 136–148. doi:10.1016/j.memsci.2007.09.015.
[24] H. Diallo, M. Rabiller‐Baudry, K. Khaless, B. Chaufer, On the electrostatic interactions in the transfer mechanisms of iron during nanofiltration in high concentrated phosphoric acid, J. Memb. Sci. 427 (2013) 37–47. doi:10.1016/j.memsci.2012.08.047.
[25] J. Tanninen, S. Platt, M. Nyström, Nanofiltration of sulphuric acid from metal sulphate solutions, Proc. Imstec 2003, Sydney. (n.d.) 1–6.
[26] E. Idil Mouhoumed, A. Szymczyk, A. Schäfer, L. Paugam, Y.H. La, Physico‐chemical characterization of polyamide NF/RO membranes: Insight from streaming current measurements, J. Memb. Sci. 461 (2014) 130–138. doi:10.1016/j.memsci.2014.03.025.
[27] W.J. Koros, G.K. Fleming, S.M. Jordan, T.H. Kim, H.H. Hoehn, Polymeric membrane materials for solution‐diffusion based permeation separations, Prog. Polym. Sci. 13 (1988) 339–401. doi:10.1016/0079‐6700(88)90002‐0.
[28] N. Pagès, M. Reig, O. Gibert, J.L. Cortina, Trace ions rejection tunning in NF by selecting solution composition: Ion permeances estimation, Chem. Eng. J. 308 (2017) 126–134. doi:10.1016/j.cej.2016.09.037.
[29] A. Yaroshchuk, T. Luxbacher, Interpretation of electrokinetic measurements with porous films: Role of electric conductance and streaming current within porous structure, Langmuir. 26 (2010) 10882–10889. doi:10.1021/la100777z.
[30] A. Yaroshchuk, X. Martínez‐Lladó, L. Llenas, M. Rovira, J. de Pablo, J. Flores, P. Rubio, Mechanisms of transfer of ionic solutes through composite polymer nano‐filtration membranes in view of their high sulfate/chloride selectivities, Desalin. Water Treat. 6 (2009) 48–53.
[31] A. Yaroshchuk, M.L. Bruening, E.E. Licón Bernal, Solution‐Diffusion‐Electro‐Migration model and its uses

24
for analysis of nanofiltration, pressure‐retarded osmosis and forward osmosis in multi‐ionic solutions, J. Memb. Sci. 447 (2013) 463–476. doi:10.1016/j.memsci.2013.07.047.
[32] A. Yaroshchuk, X. Martínez‐Lladó, L. Llenas, M. Rovira, J. de Pablo, Solution‐diffusion‐film model for the description of pressure‐driven trans‐membrane transfer of electrolyte mixtures: One dominant salt and trace ions, J. Memb. Sci. 368 (2011) 192–201. doi:10.1016/j.memsci.2010.11.037.
[33] N. Pages, A. Yaroshchuk, O. Gibert, J.L. Cortina, Rejection of trace ionic solutes in nanofiltration : Influence of aqueous phase composition, Chem. Eng. Sci. 104 (2013) 1107–1115. doi:10.1016/j.ces.2013.09.042.
[34] C. Niewersch, A.L.B. Bloch, S. Yüce, T. Melin, M. Wessling, Nanofiltration for the recovery of phosphorus — Development of a mass transport model, Desalination. 346 (2014) 70–78. doi:10.1016/j.desal.2014.05.011.
[35] C. Niewersch, Nanofiltration for phosphorus recycling from sewage sludge, Verlagshaus Mainz GmbH, 2013.
[36] O. Kedem, V. Freger, Determination of concentration‐dependent transport coefficients in nanofiltration : Defining an optimal set of coefficients, J. Memb. Sci. 310 (2008) 586–593. doi:10.1016/j.memsci.2007.11.045.
[37] S. Bason, O. Kedem, V. Freger, Determination of concentration‐dependent transport coefficients in nanofiltration : Experimental evaluation of coefficients, J. Memb. Sci. 326 (2009) 197–204. doi:10.1016/j.memsci.2008.09.054.
[38] S. Bason, Y. Kaufman, V. Freger, Analysis of Ion Transport in Nanofiltration Using Phenomenological Coefficients and Structural Characteristics, J. Phys. Chem B. 114 (2010) 3510–3517.
[39] I. Puigdomenech, Chemical equilibirum software Hydra/Medusa, (2001). https://sites.google.com/site/chemdiagr/home.
[40] G. Artuğ, I. Roosmasari, K. Richau, J. Hapke, A Comprehensive Characterization of Commercial Nanofiltration Membranes, Sep. Sci. Technol. 42 (2007) 2947–2986. doi:10.1080/01496390701560082.
[41] J.F. Fernández, B. Jastorff, R. Störmann, S. Stolte, J. Thöming, Thinking in terms of structure‐activity‐relationships (T‐SAR): A tool to better understand nanofiltration membranes, Membranes (Basel). 1 (2011) 162–183. doi:10.3390/membranes1030162.
[42] A.E. Yaroshchuk, Dielectric exclusion of ions from membranes, Adv. Colloid Interface Sci. 85 (2000) 193–230. doi:10.1016/S0001‐8686(99)00021‐4.
[43] M. Reig, E. Licon, O. Gibert, A. Yaroshchuk, J.L. Cortina, Rejection of ammonium and nitrate from sodium chloride solutions by nanofiltration: Effect of dominant‐salt concentration on the trace‐ion rejection, Chem. Eng. J. 303 (2016) 401–408. doi:10.1016/j.cej.2016.06.025.
[44] B.C. Ricci, C.D. Ferreira, L.S. Marques, S.S. Martins, B.G. Reis, M.C.S. Amaral, Assessment of the chemical stability of nanofiltration and reverse osmosis membranes employed in treatment of acid gold mining effluent, Sep. Purif. Technol. 174 (2017) 301–311. doi:10.1016/j.seppur.2016.11.007.
[45] J. Tanninen, M. Mänttäri, M. Nyström, Effect of electrolyte strength on acid separation with NF membranes, J. Memb. Sci. 294 (2007) 207–212. doi:10.1016/j.memsci.2007.02.042.
[46] J. Tanninen, S. Platt, A. Weis, M. Nyström, Long‐term acid resistance and selectivity of NF membranes in very acidic conditions, J. Memb. Sci. 240 (2004) 11–18. doi:10.1016/j.memsci.2004.04.006.
[47] V.T. Do, C.Y. Tang, M. Reinhard, J.O. Leckie, Degradation of polyamide nanofiltration and reverse osmosis membranes by hypochlorite, Environ. Sci. Technol. 46 (2012) 852–859. doi:10.1021/es203090y.
25
[48] D.J. Johnson, S.A. Al Malek, B.A.M. Al‐Rashdi, N. Hilal, Atomic force microscopy of nanofiltration membranes: Effect of imaging mode and environment, J. Memb. Sci. 389 (2012) 486–498. doi:10.1016/j.memsci.2011.11.023.
[49] V. Freger, J. Gilron, S. Belfer, TFC polyamide membranes modified by grafting of hydrophilic polymers: An FT‐IR/AFM/TEM study, J. Memb. Sci. 209 (2002) 283–292. doi:10.1016/S0376‐7388(02)00356‐3.
[50] M. Kallioinen, T. Sainio, J. Lahti, A. Pihlajamäki, H. Koivikko, J. Mattila, M. Mänttäri, Effect of extended exposure to alkaline cleaning chemicals on performance of polyamide (PA) nanofiltration membranes, Sep. Purif. Technol. 158 (2016) 115–123. doi:10.1016/j.seppur.2015.12.015.
[51] C.Y. Tang, Y.N. Kwon, J.O. Leckie, Effect of membrane chemistry and coating layer on physiochemical properties of thin film composite polyamide RO and NF membranes. I. FTIR and XPS characterization of polyamide and coating layer chemistry, Desalination. 242 (2009) 149–167. doi:10.1016/j.desal.2008.04.003.
[52] M. Gryta, J. Bastrzyk, D. Lech, Evaluation of fouling potential of nanofi ltration membranes based on the dynamic contact angle measurements, Polish J. Chem. Technol. 14 (2012) 97–104. doi:10.2478/v10026‐012‐0091‐4.
[53] O. Coronell, M.I. González, B.J. Mariñas, D.G. Cahill, Ionization behavior, stoichiometry of association, and accessibility of functional groups in the active layers of reverse osmosis and nanofiltration membranes, Environ. Sci. Technol. 44 (2010) 6808–6814. doi:10.1021/es100891r.
[54] A.P. Rao, S. V. Joshi, J.J. Trivedi, C. V. Devmurari, V.J. Shah, Structure‐performance correlation of polyamide thin film composite membranes: Effect of coating conditions on film formation, J. Memb. Sci. 211 (2003) 13–24. doi:10.1016/S0376‐7388(02)00305‐8.
[55] D. Peak, R.G. Ford, D.L. Sparks, An in Situ ATR‐FTIR Investigation of Sulfate Bonding Mechanisms on Goethite, J. Colloid Interface Sci. 299 (1999) 289–299. doi:10.1006/jcis.1999.6405.
[56] P. Hintze, H. Kjaergaard, V. Vaida, J. Burkholder, Vibrational and electronic spectroscopy of sulfuric acid vapor, J. Phys. Chem. A. 107 (2003) 1112–1118. doi:10.1021/jp0263626.
[57] S.H. Kim, S.‐Y. Kwak, T. Suzuki, Evidence to demonstrate the flux‐enhancement mechanism in morphology‐controlled thin‐film‐composite (TFC)membrane, Environ. Sci. Technol. 39 (2005) 1764–1770.
[58] C. Zhao, C.Y. Tang, P. Li, P. Adrian, G. Hu, Perfluorooctane sulfonate removal by nanofiltration membrane‐the effect and interaction of magnesium ion / humic acid, J. Memb. Sci. 503 (2016) 31–41. doi:10.1016/j.memsci.2015.12.049.
[59] J.S. Stevens, A.C. De Luca, M. Pelendritis, G. Terenghi, S. Downes, S.L.M. Schroeder, Quantitative analysis of complex amino acids and RGD peptides by X‐ray photoelectron spectroscopy (XPS), Surf. Interface Anal. 45 (2013) 1238–1246. doi:10.1002/sia.5261.
[60] I.F. Amaral, P.L. Granja, M. a Barbosa, Chemical modification of chitosan by phosphorylation: an XPS, FT‐IR and SEM study., J. Biomater. Sci. Polym. Ed. 16 (2005) 1575–1593. doi:10.1163/156856205774576736.
[61] B.M. Reddy, P.M. Sreekanth, Y. Yamada, Q. Xu, T. Kobayashi, Surface characterization of sulfate, molybdate, and tungstate promoted TiO2‐ZrO2 solid acid catalysts by XPS and other techniques, Appl. Catal. A Gen. 228 (2002) 269–278. doi:10.1016/S0926‐860X(01)00982‐6.
26
Supplementaryinformation
S1.ATR‐FTIRspectraforvirginandagedmembrane
Figure S1.1. ATR‐FTIR spectra for virgin and aged NF270 membranes at wave number from 4000 to 500 cm‐1
Figure S1.2. ATR‐FTIR spectra for virgin and aged NF270 membranes at wave number from 1700 to 800 cm‐1
Table S1.1 summarizes the observed changes on polyamide layer comparing the virgin and aged membrane peak
assignments.
Table S2.1. Peak assignment for NF270 membrane
Assignment Wavenumber (cm‐1)
Group Vibration Virgin NF270 (cm‐1)
Aged NF270 (cm‐1)
PA (piperazine polyamide)
3100 OH (carboxylic acids) NH3
+ (amino acids)
O‐H stretching N‐H stretching 3099
(‐1.0) 3098 ‐1.9
2800 CH3 attached to O or N
C‐H stretching/bending 2800 2799
0
20
40
60
80
100
120
5001000150020002500300035004000
% T
Wavelength (cm‐1)
Aged membrane Virgin membrane
0
20
40
60
80
100
120
80090010001100120013001400150016001700
% T
Wavelength (cm‐1)
Aged membrane Virgin membrane

27
1450
Carboxylic acid C‐O stretching O‐H bending n.d. n.d.
1541 Amide II N‐H bending N‐C stretching n.d. n.d.
1609 Aromatic amide N‐H deformation C=C ring stretching n.d. n.d.
1663 Amide I band, Second amide groups
C=O stretching C‐N stretching C‐C‐N deformation 1662,3 1661,4 (0.9)
PS (polysulphone)
1152
Sulphone O=S=O symmetric stretching 1150.3 1149(4)(1.1)
1244 Ethers C‐O‐C stretching 1241 n.d.
1586 C=C Phenyl group 1885.2 1584.2(1)
1495 1494.5 (1393.5) (1)
1106 0 1105
Foreign species (H2SO4, HSO4
‐, H+)
1100 H2SO4 O‐H stretching
n.d. 1100
1464.7 S=O stretching n.d. 1464.7
894.1 S‐O stretching n.d 894.1
S2.AMDrejectiondata
Table S2.1. Comparison of rejection data in AMD solutions for different NF membranes
Mem. (IEP)
Feed composition (mg/L) pH Jv or TMP
Rejection (%) Reference
NF270 (3)
Al3+: 340, SO42‐: 4599, Zn2+: 43,
Ca2+: 269 1.5 3.2–46
µm/s Al3+: 64 – 89, SO4
2‐: 35 – 59, Zn2+: 63 – 90, Ca2+: 63 – 90, H+: ‐6.4 – 9.21
This work
Al3+: 343, SO42‐: 3216, Zn2+: 43,
Ca2+: 240 1.9 1.4 – 45
µm/s Al3+: 78 – 97, SO4
2‐: 57 – 77, Zn2+: 77 – 96, Ca2+: 76 – 97, H+: ‐19 / ‐4
This work
Al3+: 335, SO42‐: 2563, Zn2+: 43,
Ca2+:240 2.5 3.4 – 49
µm/s Al3+: 69 – 88, SO4
2‐: 62 – 83, Zn2+: 68 – 89, Ca2+: 68 – 87, H+: ‐38 / ‐2.5
This work
Al3+: 559, SO42‐: 9389, Zn2+: 46,
Ca2+: 24, Cu2+: 38, La3+: 10, Pr3+: 10, Nd3+: 10, Sm3+: 10, Dy3+: 10, Yb3+: 10
1 5.8 – 24.8 µm/s
Al3+: 99, SO42‐: 39 – 48, Zn2+: 99.6,
Ca2+: 98.9 – 99.8, Cu2+: 99.5, La3+: >99.8, Pr3+: >99.8, Nd3+: >99.8, Sm3+: >99.8, Dy3+: >99.8, Yb3+: >99.8, H+: ‐6.4 – 5.8
This work
Ca2+: 480, Cu2+: 410, Mg2+: 770, Mn3+: 440, Na+: 2000, SO4
2‐: 6900
1.5 ‐ 4.6
32 L/m2h 22 bar
Ca2+: 96 – 91, Cu2+: 96 – 89, Mg2+: 97 – 94, Mn3+: 97 – 94, Na+: 38 – 45, S2‐: 89 – 96
[18]
TS80 (3)
1.5 – 5.5
35 L/m2h 19 bar
Ca2+: 98, Cu2+ 97, Mg2+: 98 Mn2+: 98, S2‐: 98, Na+: 97
[18]
Envig D11
SO42‐: 1430, Cl‐: 418, Na+: 344
Ca2+: 354 2 3 – 20
bar SO4
2‐: ‐13, Cl‐: 8, Na+: 8, Ca2+: 75 [20]
Envig SO42‐: ‐65, Cl‐: 12, Na+: 0, Ca2+: 74 [20]

28
D12
NF90 (4.3)
SO42‐: 9, Cl‐: 88, Na+: 92, Ca2+: 96 [20]
NF70 (3‐3.5)
SO42‐: 99, Cl‐: 90, Na+: 95, Ca2+: 97 [20]
Nitto Denko CTC1
SO42‐: 47, Cl‐: 24, Na+: 31, Ca2+: 81 [20]
DK‐4040F
Ni2+: 17, Cu2+: 79, Zn2+: 18, Pb2+: 10, SO4
2‐: 36, NO3‐: 107
Cl‐: 530, Na+: 653
3 0.2 – 1.1 MPa
Ni2+: 93, Cu2+: 93, Zn2+: 94, Pb2+: 95,
[15]
NF99 Cu: 2298, Fe: 628, Mn: 225, Ca: 326, Mg: 630, Na:7, Al: 1139, SO4: 14337
2.7 – 2.5
20 – 30 bar
Cu: 99.9, Fe: 99.9 , Mn: 99.9, Ca: 99.9, Mg: 99.6, Na: 87.7 , Al: 99.9, SO4: 98.6, pH: 2.6
[16]
GE Cu: 99.3, Fe: 99.5, Mn: 99.4, Ca: 99.3, Mg: 99.4, Na: 82,5, Al: 99.5, SO4: 98.6, pH 2.6
[16]
DK Cu: 50– 82, Fe: 84 – 92 Mn: 61 – 82, Ca: 60– 82, Mg: 61 – 92, Na: 34– 56, Al: 80 – 90, SO4: 73 – 87, pH: 2.8 ‐ 2.3
[16]
S3.Contactangle
Figure S3.1. Contact angle data for NF270 before and after acid treatment, with corresponding water droplet images.
S4.HighresolutionXPSspectraforvirginandagedNF270
Table S4.1. XPS spectra for C 1s, O 1s and N 1s for (a) virgin membrane and (b) for the aged membrane
Virgin membrane Aged membrane

29
C (1s)
O (1s)
N (1s)
Table S4.2. Binding energies and relatively amount of functional groups for virgin and aged membrane
Virgin membrane
Aged membrane
EB (eV) % EB (eV) %
C (1s) 72.5 % 66.0 %
C‐C,C‐H, C=C 284.6 60.1 284.6 65.0
C‐O, C‐N 285.8 24.9 285.9 28.2
C=O‐N, N=C, C=O 287.6 15 288.6 5.0
Saturated, π bond 292.7 0.7
Saturated, π bond 291.4 1.2
N (1s) 16.8 % 23.0 %
C‐N, C=N, O=C‐N 399.5 95.3 399.9 51.6
‐NH3+, ‐NH2R
+ 401.3 4.7 401.5 48.4
O (1s) 10.7 % 4.9 %
O=C‐N, C=O, C‐O 531 75.6 531.2 8.7
H∙∙∙O=C‐N, O=C‐O 532.4 24.4 532.8 63.7
SO42‐ 531.6 27.6