Embed Size (px)
Citation preview
1
Analysis of FinancialStatements

Overview of Financial Analysis
• First order of business is to SPECIFY THE OBJECTIVES OF THE ANALYSIS
• Remember -- the identity of the user helps define what information is needed

Potential Financial Statement Users:
• Creditors• Investors• Managers• Employees
• What types of questions do each of these users seek answers to?

Creditors
• Why does the firm want/need to borrow funds?
• What is the firm’s capital structure? How leveraged are they?
• How will they pay it back? What kind of cash flows are being generated by operations?

Investors
• How has the firm performed/what are future expectations?
• How much RISK is inherent in the capital structure?
• What are expected returns from the firm?
• What is firm’s competitive position?
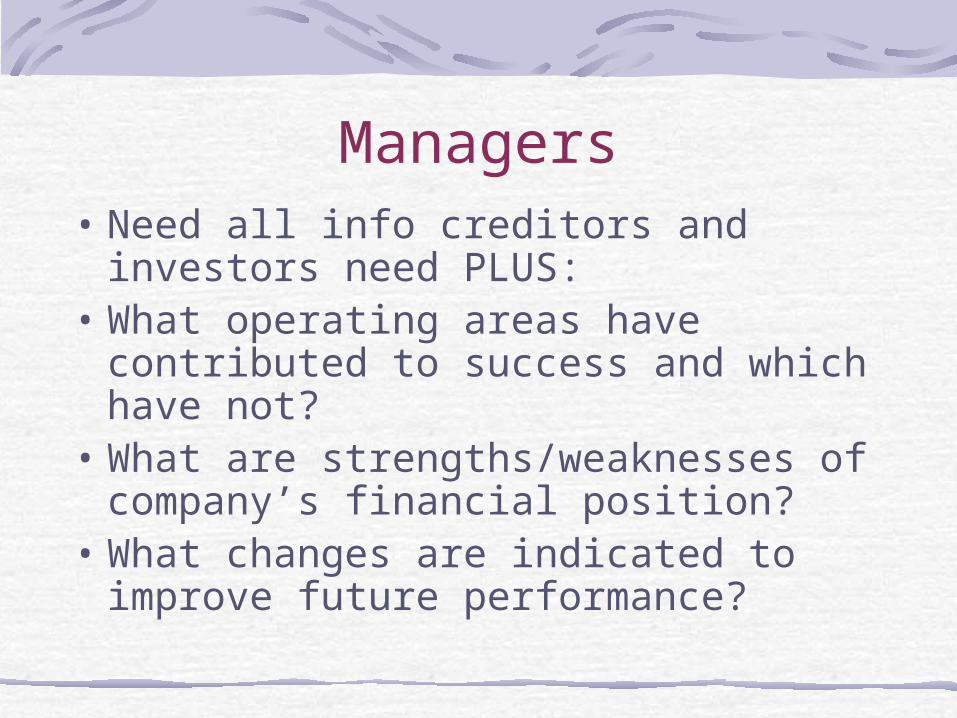
Managers• Need all info creditors and investors
need PLUS:• What operating areas have
contributed to success and which have not?
• What are strengths/weaknesses of company’s financial position?
• What changes are indicated to improve future performance?

Caution!!!
• Keep in mind: management PREPARES financial statements
• Analyst should be alert to potential for management to influence reporting to make data more “appealing”
• May want to supplement analysis with information apart from Annual Report prepared by management
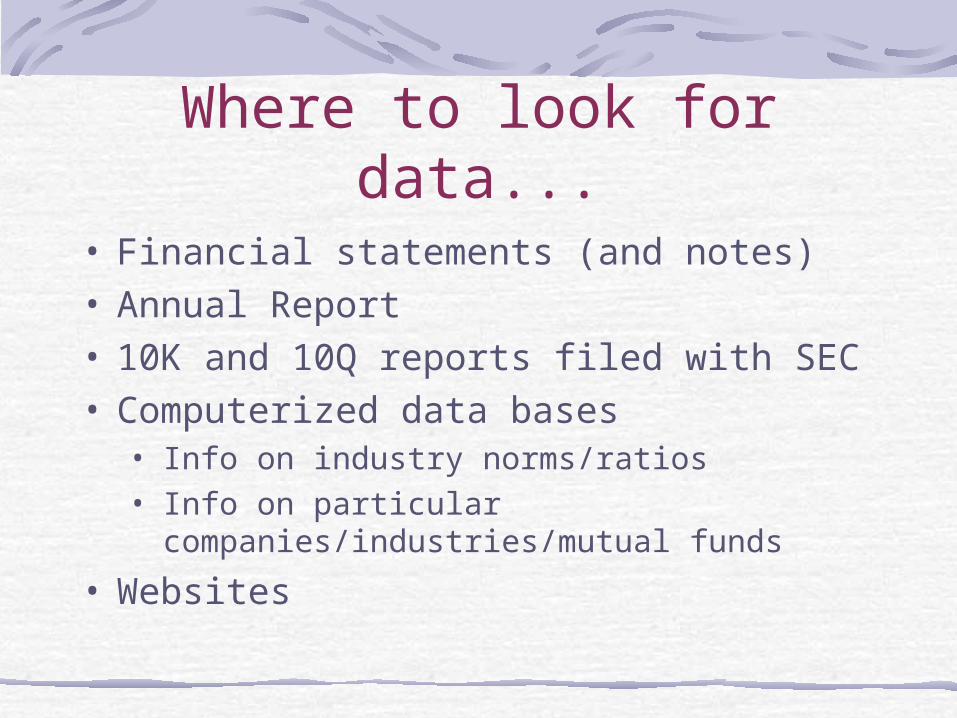
Where to look for data...
• Financial statements (and notes)• Annual Report • 10K and 10Q reports filed with SEC• Computerized data bases
• Info on industry norms/ratios• Info on particular
companies/industries/mutual funds
• Websites
Basic Tools
• Common size financial statements
• Financial ratios• Trend analysis• Industry comparisons

Common Sizing
Firm A Firm B
Sales 2531456.24 4561234.87
COGS 784564.54 1556456.24
Gr. Profit 1746891.70 3004778.63

Common Sizing
Firm A Firm B
Sales 2,531,456 4,561,234
COGS 784,564 1,556,456
Gr. Profit 1,746,891 3,004,778

Common Sizing
Firm A Firm B
Sales 2,531,456 100% 4,561,234 100%
COGS 784,564 31% 1,556,456 34%
Gr. Profit 1,746,891 69% 3,004,778 66%

Common Size Statements
• Common size income statement• expresses each income statement
category as a percentage of sales• Common size balance sheet
• expresses each item on balance sheet as a percentage of total assets or equities

14
Ratio Analysis
• Profitability• Liquidity• Debt Utilization• Asset Utilization ratios
Four Categories of RatiosFour Categories of Ratios

15
Ratio Analysis
Profitability Ratios
• Measure the overall effectiveness of the firm’s management.

16
Gross Profit Margin =Gross Profit Margin =Gross Profit
Sales
How effective is the firm at generating revenue in excess of its cost of goods sold?
Ratio Analysis
Profitability Ratios

17
Cash $175 Accounts Payable $115Accounts Receivable 430 S-T Notes Payable 115Inventories 625 Current Liabilities $230 Current Assets $1,230 Bonds $600Plant & Equipment $2,500 Owner’s Equity Less:Acc. Depr. (1,200) Common Stock $300Net Fixed Assets $1,300 Capital in Excess of Par 600 Total Assets $2,530 Retained Earnings 800
Total Owners’ Equity $1,700Total Liabilities and Owners Equity $2,530
Balance SheetExcalibur Corporation
Income StatementExcalibur Corporation
Sales $1,450Cost of Goods Sold 875Gross Profit $575Operating Expenses 45Depreciation 200Net Operating Income $330Interest Expense 60 Income Before Taxes $270Taxes (40%) 108Net Income $162Common Dividends Paid 100Addition to Retained Earnings $62
$575 $1,450
Gross Profit Margin = = 39.7%
GrossProfit =Margin
Gross ProfitSales

18
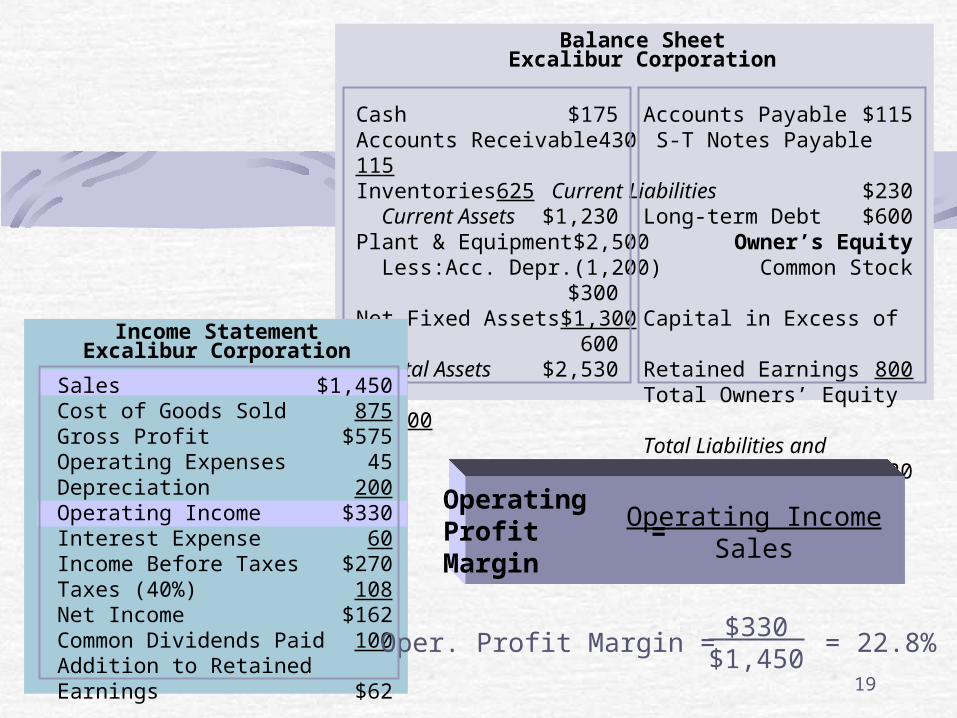
Operating Profit Margin =Operating Profit Margin =Operating Income
Sales
How effective is the firm in keeping costs of production low?
Ratio AnalysisProfitability Ratios
19
Balance SheetExcalibur Corporation
Cash $175 Accounts Payable $115Accounts Receivable 430 S-T Notes Payable 115Inventories625 Current Liabilities $230 Current Assets $1,230 Long-term Debt $600Plant & Equipment $2,500 Owner’s Equity Less:Acc. Depr. (1,200) Common Stock $300Net Fixed Assets $1,300 Capital in Excess of Par 600 Total Assets $2,530 Retained Earnings 800
Total Owners’ Equity $1,700Total Liabilities and Owners Equity $2,530
Sales $1,450Cost of Goods Sold 875Gross Profit $575Operating Expenses 45Depreciation 200Operating Income $330Interest Expense 60Income Before Taxes $270Taxes (40%) 108Net Income $162Common Dividends Paid 100Addition to Retained Earnings $62
Income StatementExcalibur Corporation
$330 $1,450
Oper. Profit Margin = = 22.8%
OperatingProfit =Margin
Operating IncomeSales

20
Profit Margin orProfit Margin orReturn on Sales =Return on Sales =
Net IncomeSales
How much net profit is being generated from each dollar of sales?
Ratio Analysis
Profitability Ratios
Note: Net Income equals Earnings Available to CS
when there is no preferred stock.

21
Cash $175 Accounts Payable $115Accounts Receivable 430 S-T Notes Payable 115Inventories625 Current Liabilities $230 Current Assets $1,230 Long-term Debt $600Plant & Equipment $2,500 Owner’s Equity Less:Acc. Depr. (1,200) Common Stock $300Net Fixed Assets $1,300 Capital in Excess of Par 600 Total Assets $2,530 Retained Earnings 800
Total Owners’ Equity $1,700Total Liabilities and Owners Equity $2,530
Balance SheetExcalibur Corporation
Assets Liabilities
Sales $1,450Cost of Goods Sold 875Gross Profit $575Operating Expenses 45Depreciation 200Operating Income $330Interest Expense 60Income Before Taxes $270Taxes (40%) 108Net Income $162Common Dividends Paid 100Addition to Retained Earnings $62
Income StatementExcalibur Corporation
$162 $1,450
Profit Margin = = 11.2%
NetProfit =Margin
Net IncomeSales

22
Return on Assets = Return on Assets = Net IncomeTotal Assets
How effectively is the firm generating net income from its assets ?
Ratio AnalysisProfitability Ratios

23
Cash $175 Accounts Payable $115Accounts Receivable 430 S-T Notes Payable 115Inventories 625 Current Liabilities $230 Current Assets $1,230 Long-term debt $600Plant & Equipment $2,500 Owner’s Equity Less:Acc. Depr. (1,200) Common Stock $300Net Fixed Assets $1,300 Capital in Excess of Par 600 Total Assets $2,530 Retained Earnings 800
Total Owners’ Equity $1,700Total Liabilities and Owners Equity $2,530
Balance SheetExcalibur Corporation
Assets Liabilities
Sales $1,450Cost of Goods Sold 875Gross Profit $575Operating Expenses 45Depreciation 200Operating Income $330Interest Expense 60Income Before Taxes $270Taxes (40) 108Net Income% $162Common Dividends Paid 100Addition to Retained Earnings $62
Income StatementExcalibur Corporation
$162 $2,530ROA = = 6.4%
Return onAssets
Net IncomeTotal Assets=

24
Return on Common Equity =Return on Common Equity = Net Income Equity
How well is the firm generating return to its equity providers?
Ratio Analysis
Profitability Ratios

25
Balance SheetExcalibur Corporation
Assets Liabilities
Cash $175 Accounts Payable $115Accounts Receivable 430 S-T Notes Payable 115Inventories 625 Current Liabilities $230 Current Assets $1,230 Long-term Debt $600Plant & Equipment $2,500 Owner’s Equity Less:Acc. Depr. (1,200) Common Stock $300Net Fixed Assets $1,300 Capital in Excess of Par 600 Total Assets $2,530 Retained Earnings 800
Total Owners’ Equity $1,700Total Liabilities and Owners Equity $2,530Sales $1,450
Cost of Goods Sold 875Gross Profit $575Operating Expenses 45Depreciation 200Operating Income $330Interest Expense 60Income Before Taxes $270Taxes (40%) 108Net Income $162Common Dividends Paid 100Addition to Retained Earnings $62
Income StatementExcalibur Corporation
$162 $1,700
ROE = = 9.53%
Return on Equity = Net Income Equity

26
Ratio AnalysisLiquidity RatiosLiquidity Ratios
Current Ratio =Current Ratio = Current Assets Current Liabilities
• Measure the ability of the firm to meet its short-term financial obligations.
Are there sufficient current assets to pay off current liabilities? What is the cushion of safety?

27
Balance SheetExcalibur Corporation
Assets Liabilities
Cash $175 Accounts Payable $115Accounts Receivable 430 S-T Notes Payable 115Inventories 625 Current Liabilities $230 Current Assets $1,230 Long-term Debt $600Plant & Equipment $2,500 Owner’s Equity Less:Acc. Depr. (1,200) Common Stock $300Net Fixed Assets $1,300 Capital in Excess of Par 600 Total Assets $2,530 Retained Earnings 800
Total Owners’ Equity $1,700Total Liabilities and Owners Equity $2,530
$1,230$230
Current Ratio = = 5.35x
Current Ratio = Current Assets Current Liabilities

28
Ratio AnalysisLiquidity RatiosLiquidity Ratios• Measure the ability of the firm to meet
its short-term financial obligations.
Quick Ratio =Quick Ratio = Current Assets - InventoryCurrent Liabilities
What happens to the firm’s ability to repay current liabilities after what is usually the least liquid of the current assets is subtracted?

29
Balance SheetExcalibur Corporation
Assets Liabilities
$1,230 -$625$230
Acid-Test Ratio = = 2.63x
Quick Ratio = Current Assets - Inventory Current Liabilities
Cash $175 Accounts Payable $115Accounts Receivable 430 S-T Notes Payable 115Inventories 625 Current Liabilities $230 Current Assets $1,230 Long-term Debt $600Plant & Equipment $2,500 Owner’s Equity Less:Acc. Depr. (1,200) Common Stock $300Net Fixed Assets $1,300 Capital in Excess of Par 600 Total Assets $2,530 Retained Earnings 800
Total Owners’ Equity $1,700Total Liabilities and Owners Equity $2,530

30
Ratio Analysis
Debt Utilization RatiosDebt Utilization Ratios
• Measure the relative size of the firm’s debt load and the firm’s ability to pay off the debt.

31
Debt Ratio =Debt Ratio = Total Debt Total Assets
What proportion of the firm’s assets is financed with debt?
Ratio Analysis
Debt RatiosDebt Ratios

32
Cash $175 Accounts Payable $115Accounts Receivable 430 S-T Notes Payable 115Inventories 625 Current Liabilities $230 Current Assets $1,230 Long-term Debt $600Plant & Equipment $2,500 Owner’s Equity Less:Acc. Depr. (1,200) Common Stock $300Net Fixed Assets $1,300 Capital in Excess of Par 600 Total Assets $2,530 Retained Earnings 800
Total Owners’ Equity $1,700Total Liabilities and Owners Equity $2,530
Balance SheetExcalibur Corporation
Assets Liabilities
Income StatementExcalibur Corporation
Sales $1,450Cost of Goods Sold 875Gross Profit $575Operating Expenses 45Depreciation 200Operating Income $330Interest Expense 60Income Before Taxes $270Taxes (40%) 108Net Income $162Common Dividends Paid 100Addition to Retained Earnings $62
$230 + $600 $2,530
Debt Ratio = = 33%
Debt Ratio = Total Debt Total Assets

33
Times Interest Earned Ratio =Times Interest Earned Ratio = Operating IncomeInterest Expense
What is the firm’s ability to repay interest payments from its operating income?
Ratio Analysis
Debt RatiosDebt Ratios

34
Cash $175 Accounts Payable $115Accounts Receivable 430 S-T Notes Payable 115Inventories 625 Current Liabilities $230 Current Assets $1,230 Long-term Debt $600Plant & Equipment $2,500 Owner’s Equity Less:Acc. Depr. (1,200) Common Stock $300Net Fixed Assets $1,300 Capital in Excess of Par 600 Total Assets $2,530 Retained Earnings 800
Total Owners’ Equity $1,700Total Liabilities and Owners Equity $2,530
Balance SheetExcalibur Corporation
Assets Liabilities
$330 $330 $60$60TIE Ratio =TIE Ratio = = 5.50x= 5.50x
TimesInterest =Earned Ratio
Operating IncomeInterest Expense
Sales $1,450Cost of Goods Sold 875Gross Profit $575Operating Expenses 45Depreciation 200Operating Income $330Interest Expense 60Income Before Taxes $270Taxes (40%) 108Net Income $162Common Dividends Paid 100Addition to Retained Earnings $62
Income StatementExcalibur Corporation
35
Ratio Analysis
Asset Management RatiosAsset Management Ratios
• Help assess how effectively the firm is using assets to generate sales.

36
Ratio Analysis
Asset Utililzation RatiosAsset Utililzation Ratios
How long does it take for the firm on average to collect its credit sales from customers?
Average Collection Period =Average Collection Period = Accounts Receivable Avg. Daily Cr. Sales

37
Cash $175 Accounts Payable $115Accounts Receivable 430 S-T Notes Payable 115Inventories 625 Current Liabilities $230 Current Assets $1,230 Bonds $600Plant & Equipment $2,500 Owner’s Equity Less:Acc. Depr. (1,200) Common Stock $300Net Fixed Assets $1,300 Capital in Excess of Par 600 Total Assets $2,530 Retained Earnings 800
Total Owners’ Equity $1,700Total Liabilities and Owners Equity $2,530
Balance SheetExcalibur Corporation
Assets Liabilities
Sales $1,450Cost of Goods Sold 875Gross Profit $575Operating Expenses 45Depreciation 200Operating Income $330Interest Expense 60Income Before Taxes $270Taxes (40%) 108Net Income $162Common Dividends Paid 100Addition to Retained Earnings $62
Income StatementExcalibur Corporation
AverageCollection = Period
Accounts ReceivableAvg. Daily Sales
$430 $1,450/365 ACP = = 108.24 days
Days in a year
Days in a year
Additional Info:Additional Info:We assume all We assume all sales are creditsales are creditsales.sales.

38
Inventory Turnover Ratio =Inventory Turnover Ratio = Sales Inventory
Is inventory efficiently translating into sales for the firm?
Ratio Analysis
Asset Management RatiosAsset Management Ratios

39
Cash $175 Accounts Payable $115Accounts Receivable 430 S-T Notes Payable 115Inventories 625 Current Liabilities $230 Current Assets $1,230 Long-term Debt $600Plant & Equipment $2,500 Owner’s Equity Less:Acc. Depr. (1,200) Common Stock $300Net Fixed Assets $1,300 Capital in Excess of Par 600 Total Assets $2,530 Retained Earnings 800
Total Owners’ Equity $1,700Total Liabilities and Owners Equity $2,530
Balance SheetExcalibur Corporation
Assets Liabilities
Sales $1,450Cost of Goods Sold 875Gross Profit $575Operating Expenses 45Depreciation 200Operating Income $330Interest Expense 60Income Before Taxes $270Taxes (40%) 108Net Income $162Common Dividends Paid 100Addition to Retained Earnings $62
Income StatementExcalibur Corporation
$1450$625
Inventory Turnover = = 2.3x
InventoryTurnover =Ratio
Sales Inventory

40
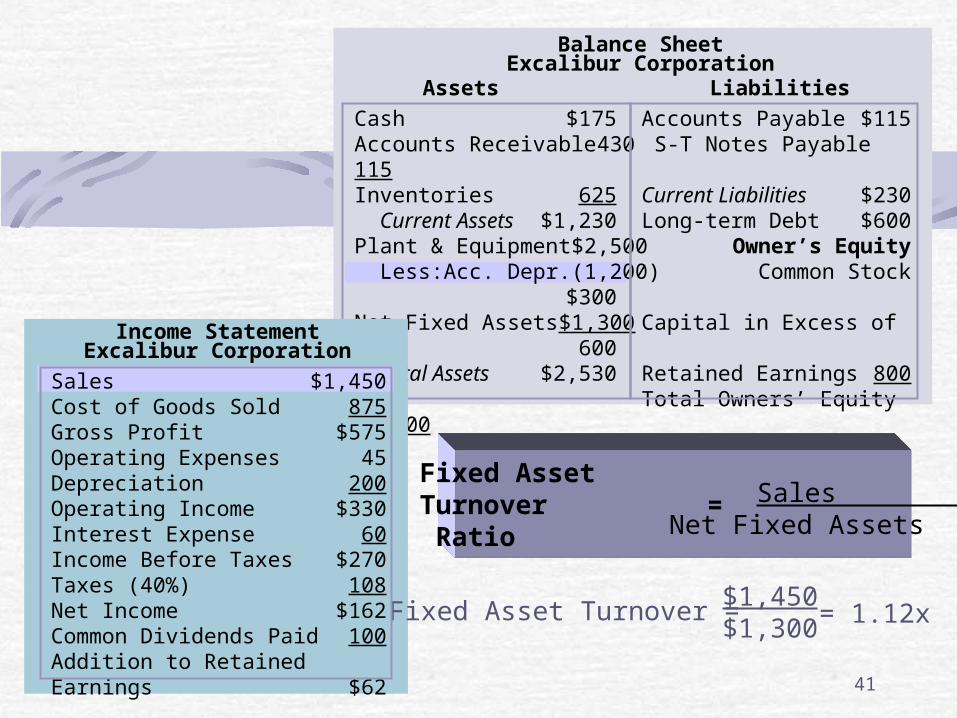
Fixed Asset Turnover Ratio =Fixed Asset Turnover Ratio = Sales
Net Fixed Assets
How effective is the firm in using its fixed assets to help generate sales?
Ratio Analysis
Asset Management RatiosAsset Management Ratios
41
Cash $175 Accounts Payable $115Accounts Receivable 430 S-T Notes Payable 115Inventories 625 Current Liabilities $230 Current Assets $1,230 Long-term Debt $600Plant & Equipment $2,500 Owner’s Equity Less:Acc. Depr. (1,200) Common Stock $300Net Fixed Assets $1,300 Capital in Excess of Par 600 Total Assets $2,530 Retained Earnings 800
Total Owners’ Equity $1,700Total Liabilities and Owners Equity $2,530
Balance SheetExcalibur Corporation
Assets Liabilities
Sales $1,450Cost of Goods Sold 875Gross Profit $575Operating Expenses 45Depreciation 200Operating Income $330Interest Expense 60Income Before Taxes $270Taxes (40%) 108Net Income $162Common Dividends Paid 100Addition to Retained Earnings $62
Income StatementExcalibur Corporation
$1,450$1,300
Fixed Asset Turnover = = 1.12x
Fixed AssetTurnover = Ratio
Sales Net Fixed Assets

42
Total Asset Turnover Ratio =Total Asset Turnover Ratio = Sales Total Assets
How effective is the firm in using its overall assets to generate sales?
Ratio Analysis
Asset Management RatiosAsset Management Ratios

43
Assets Liabilities
Cash $175 Accounts Payable $115Accounts Receivable 430 S-T Notes Payable 115Inventories 625 Current Liabilities $230 Current Assets $1,230 Long-term Debt $600Plant & Equipment $2,500 Owner’s Equity Less:Acc. Depr. (1,200) Common Stock $300Net Fixed Assets $1,300 Capital in Excess of Par 600 Total Assets $2,530 Retained Earnings 800
Total Owners’ Equity $1,700Total Liabilities and Owners Equity $2,530
Balance SheetExcalibur Corporation
$1,450 $2,530
Total Asset Turnover = = 0.57x
Total AssetTurnover = Ratio
Sales Total Assets
Sales $1,450Cost of Goods Sold 875Gross Profit $575Operating Expenses 45Depreciation 200Operating Income $330Interest Expense 60Income Before Taxes $270Taxes (40%) 108Net Income $162Common Dividends Paid 100Addition to Retained Earnings $62
Income StatementExcalibur Corporation

44
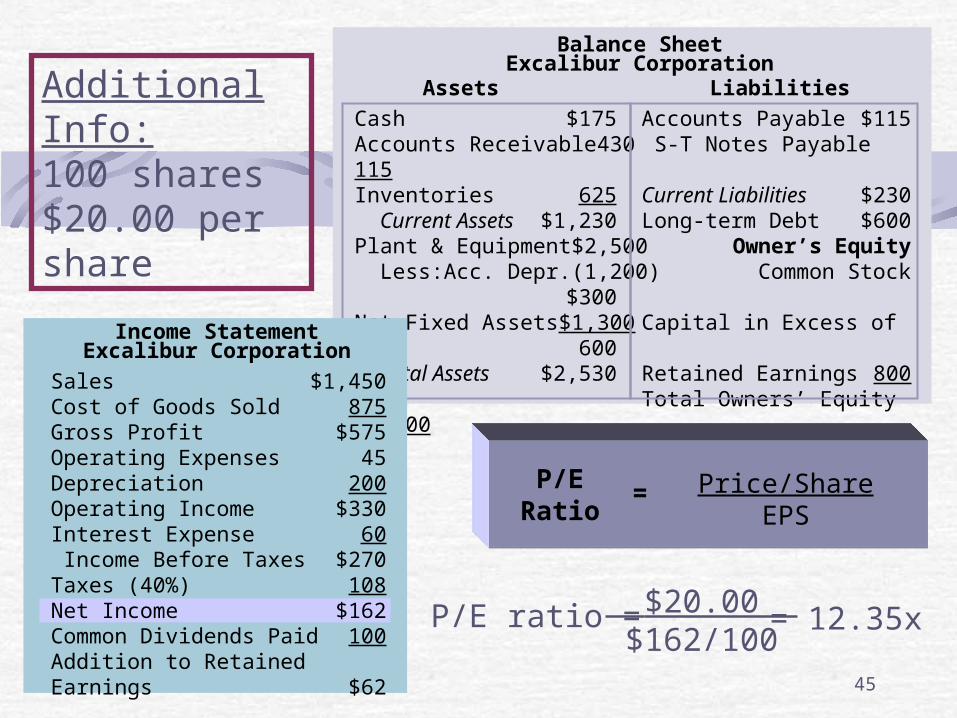
Price to Earnings Ratio =Price to Earnings Ratio = Price per ShareEarnings per Share
How much are investors willing to pay per dollar of earnings of the firm?
(Indicator of investor’s attitudes toward future prospects of the firm and of the firm’s risk.)
Ratio AnalysisMarket Value RatiosMarket Value Ratios
45
Cash $175 Accounts Payable $115Accounts Receivable 430 S-T Notes Payable 115Inventories 625 Current Liabilities $230 Current Assets $1,230 Long-term Debt $600Plant & Equipment $2,500 Owner’s Equity Less:Acc. Depr. (1,200) Common Stock $300Net Fixed Assets $1,300 Capital in Excess of Par 600 Total Assets $2,530 Retained Earnings 800
Total Owners’ Equity $1,700Total Liabilities and Owners Equity $2,530
Assets Liabilities
Balance SheetExcalibur Corporation
Additional Info:100 shares$20.00 per share
$20.00 $162/100
P/E ratio = = 12.35x
P/E Ratio
Price/ShareEPS
=
Sales $1,450Cost of Goods Sold 875Gross Profit $575Operating Expenses 45Depreciation 200Operating Income $330Interest Expense 60 Income Before Taxes $270Taxes (40%) 108Net Income $162Common Dividends Paid 100Addition to Retained Earnings $62
Income StatementExcalibur Corporation

46
RatioRatio Industry Industry Excalibur ExcaliburProfitabilityProfitabilityGross Profit Margin 38% 39.7%Operating Profit Margin 20% 22.8%Net Profit Margin 12% 11.2%Return on Assets 9.0% 6.4%Return on Equity 13.4% 9.5%

47
RatioRatio Industry Industry Excalibur ExcaliburProfitabilityProfitabilityGross Profit Margin 38% 39.7%Operating Profit Margin 20% 22.8%Net Profit Margin 12% 11.2%Return on Assets 9.0% 6.4%Return on Equity 13.4% 9.5%
Excalibur is good at keeping operating costs down, but not as good at total costs. ROA and ROE are low mainly due to productivity problems.

48
RatioRatio Industry Excalibur Industry ExcaliburLiquidityLiquidityCurrent Ratio 5.00x 5.35xQuick Ratio 3.00x 2.63x
Summary of Excalibur Corporation RatiosSummary of Excalibur Corporation Ratios

49
RatioRatio Industry Excalibur Industry ExcaliburLiquidityLiquidityCurrent Ratio 5.00x 5.35xQuick Ratio 3.00x 2.63x
Looking at the current ratio it appears that Excalibur is more liquid than the industry.... however when looking at Acid Test (a better measure) they are not as liquid indicating that inventory levels are probably too high.
Summary of Excalibur Corporation RatiosSummary of Excalibur Corporation Ratios
50
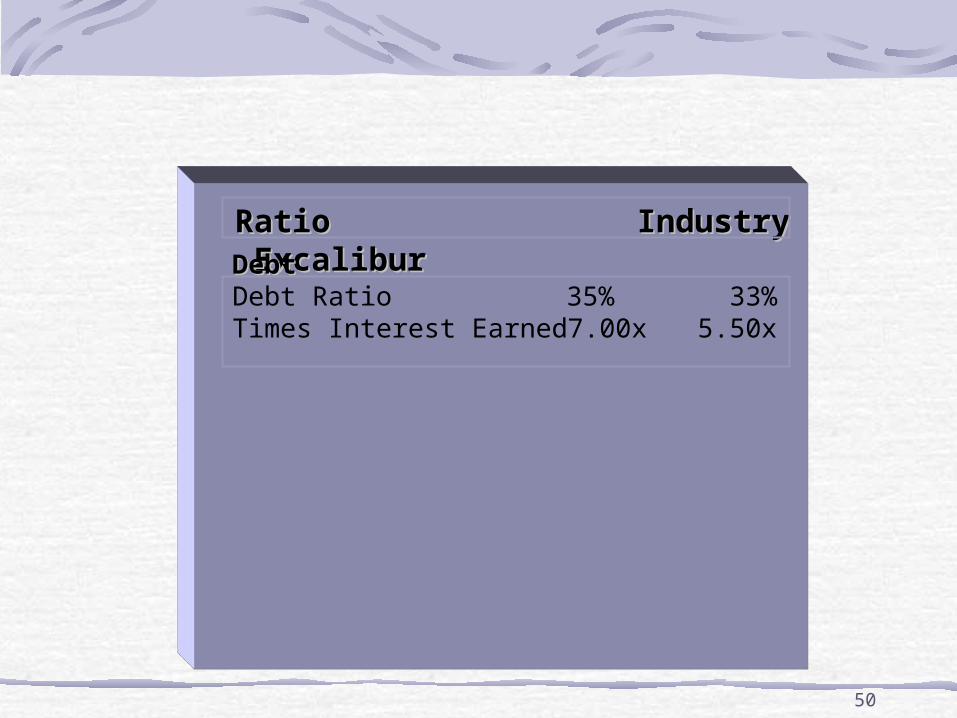
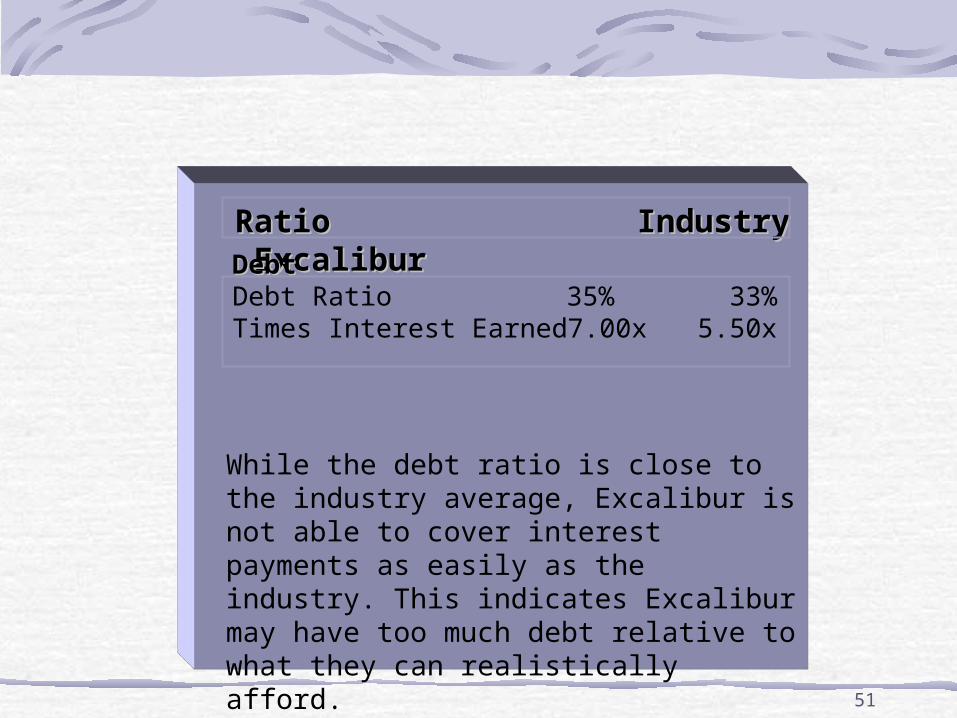
RatioRatio Industry Industry Excalibur ExcaliburDebtDebtDebt Ratio 35% 33%Times Interest Earned 7.00x 5.50x
51
RatioRatio Industry Industry Excalibur ExcaliburDebtDebtDebt Ratio 35% 33%Times Interest Earned 7.00x 5.50x
While the debt ratio is close to the industry average, Excalibur is not able to cover interest payments as easily as the industry. This indicates Excalibur may have too much debt relative to what they can realistically afford.

52
RatioRatio Industry Industry Excalibur ExcaliburAsset ManagementAsset Management Avg. Collection Period 90 days 108 daysInventory Turnover 3.00x 2.32xFixed Asset Turnover 1.00x 1.12xTotal Asset Turnover 0.75x .57x

53
RatioRatio Industry Industry Excalibur ExcaliburAsset ManagementAsset Management Avg. Collection Period 90 days 108 daysInventory Turnover 3.00x 2.32xFixed Asset Turnover 1.00x 1.12xTotal Asset Turnover 0.75x .57x
Collection policies need examining, as Excalibur is slower than average at collecting receivables. Inventories are being sold more slowly than the industry average, again indicating inventories that are too high. Excalibur is very efficient at converting Fixed Assets to Sales (fixed assets are productive). However, overall assets are not productive indicating Current Assets (e.g. inventories) are not as productive as for the industry.

54
RatioRatio Industry Industry Excalibur ExcaliburMarket ValueMarket Value PE Ratio 18.0 12.35

55
RatioRatio Industry Industry Excalibur ExcaliburMarket ValueMarket Value PE Ratio 18.0 12.35
Excalibur’s Investors are not willing to pay as much per dollar of earnings or per dollar of book value as they are for shares in other firms in the industry. This signals that they consider the firm’sprospects to be worse than the average.However, the firm is still selling for more than its accounting book value.
56
Relationships Among Ratios:The Du Pont System
• Ratio Analysis generally involves an examination of related ratios.
• Comparison of these relationships over time helps to identify the company’s strengths and weaknesses.

57
Net Inc. Net Inc. Sales Assets Sales Assets
= x
The Du Pont Equation
Net ProfitMargin
Total AssetTurnover
Return onAssets
= x
Relationships Among Ratios:The Du Pont System

58
Relationships Among Ratios:Relationships Among Ratios:The Du Pont SystemThe Du Pont System
Net Inc. Net Inc. Sales AssetsEquity Sales Assets Equity = x x
Net ProfitMargin
Total AssetTurnover
Return onEquity
EquityMultiplier
= x x

DuPont Equation: TGT vs. Walmart
Net Profit Margin
Asset Turnover
Target 4.0% 1.45
Wal-Mart
3.6% 2.40
Which would you prefer?

DuPont Equation: TGT vs. Walmart
Jan. 2005
Net Profit Margin
Asset Turnover
ROA
Target 4.0% 1.45 5.8%
Wal-Mart
3.6% 2.40 8.6%
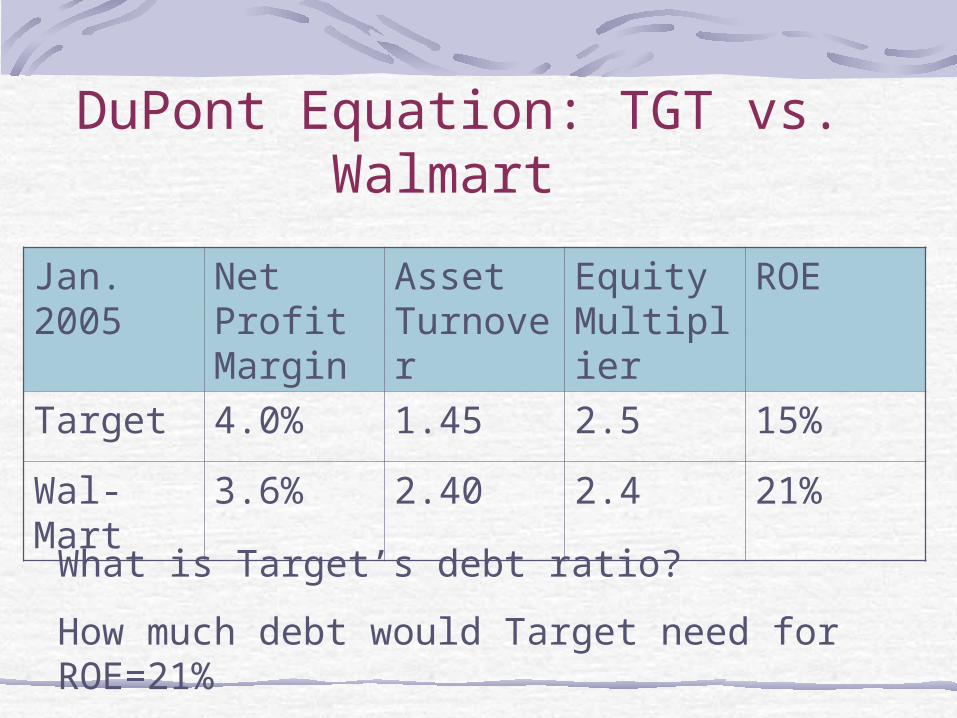
DuPont Equation: TGT vs. Walmart
Jan. 2005
Net Profit Margin
Asset Turnover
Equity Multiplier
ROE
Target 4.0% 1.45 2.5 15%
Wal-Mart
3.6% 2.40 2.4 21%
What is Target’s debt ratio?
How much debt would Target need for ROE=21%

• The DuPont approach is nice because it divides the firm into three tasks•expense management (measured by the
profit margin)•asset management (measured by asset
turnover)•debt management (measured by the
equity multiplier)

DuPont Example
Wal-Mart Sears
Profit M. 4% 6%Ass.Turn. 3 1.5ROA ? ?Eq. Mult. 2 1ROE ? ?

What is the top overall ratio?

Ratio Exercise
Inv turn. 5 Cash ______ Acc Pay _____
Debt to net worth
.50
Acc Rec. 14,795
Inv. ______ Stock 25,000
G. P. Margin
.30
Plant Eq. ______ Ret Earn. 35,000
Acid test
1.2
Total Assets
______
Tot. Liab & Eq.
_______
TA turnover
2
Sales ____ COGS ______