Embed Size (px)
Citation preview
1
Alberta Business BeatVolume 4, February 2014
2
Background and Methodology
3
Business & Agriculture
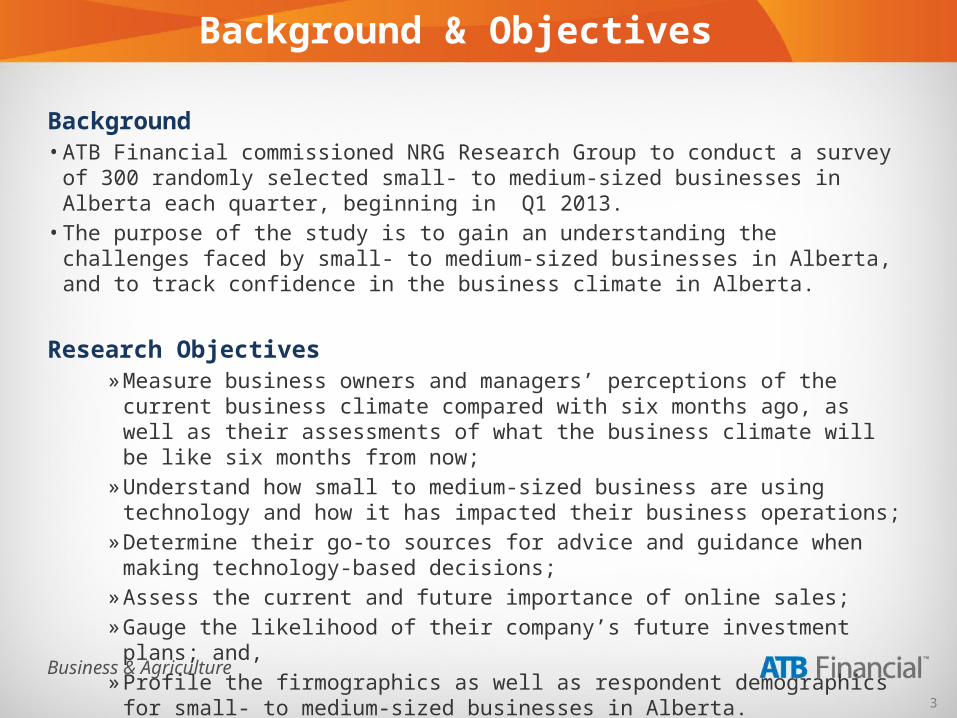
Background & Objectives
Background• ATB Financial commissioned NRG Research Group to conduct a survey of 300
randomly selected small- to medium-sized businesses in Alberta each quarter, beginning in Q1 2013.• The purpose of the study is to gain an understanding the challenges faced by
small- to medium-sized businesses in Alberta, and to track confidence in the business climate in Alberta.
Research Objectives»Measure business owners and managers’ perceptions of the current
business climate compared with six months ago, as well as their assessments of what the business climate will be like six months from now;»Understand how small to medium-sized business are using technology
and how it has impacted their business operations; »Determine their go-to sources for advice and guidance when making
technology-based decisions; »Assess the current and future importance of online sales;»Gauge the likelihood of their company’s future investment plans; and,»Profile the firmographics as well as respondent demographics for small-
to medium-sized businesses in Alberta.
4
Business & Agriculture
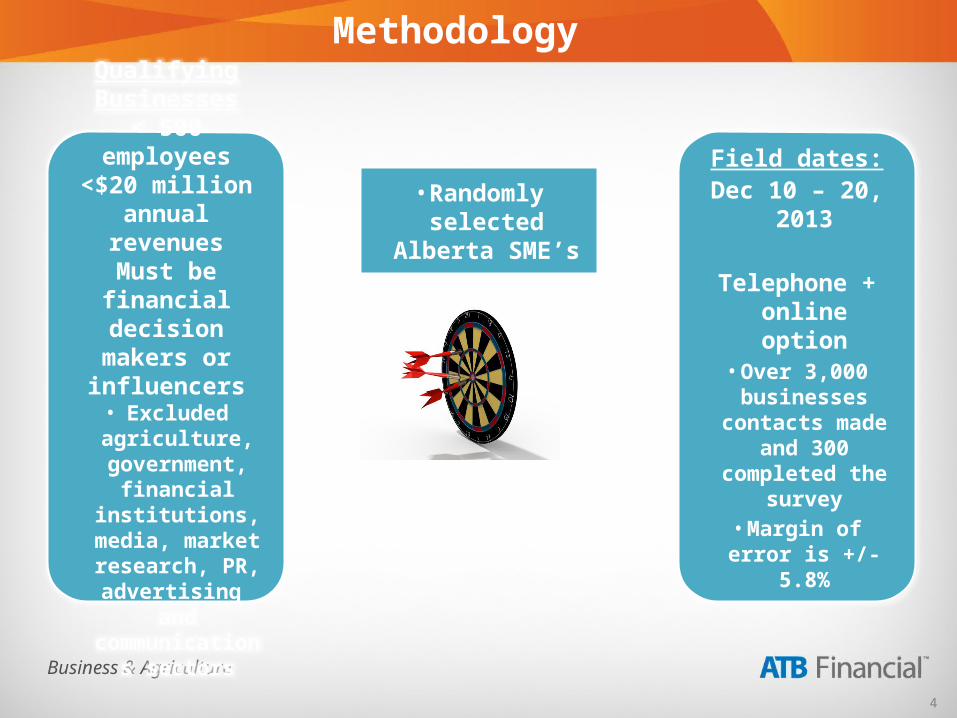
Methodology
• Randomly selected Alberta SME’s
Qualifying Businesses
< 500 employees<$20 million
annual revenuesMust be financial
decision makers or influencers• Excluded
agriculture, government,
financial institutions, media,
market research, PR, advertising
and communications
sectors
Field dates:Dec 10 – 20, 2013
Telephone + online option
• Over 3,000 businesses contacts
made and 300 completed the
survey• Margin of error is
+/- 5.8%
5
Business & Agriculture
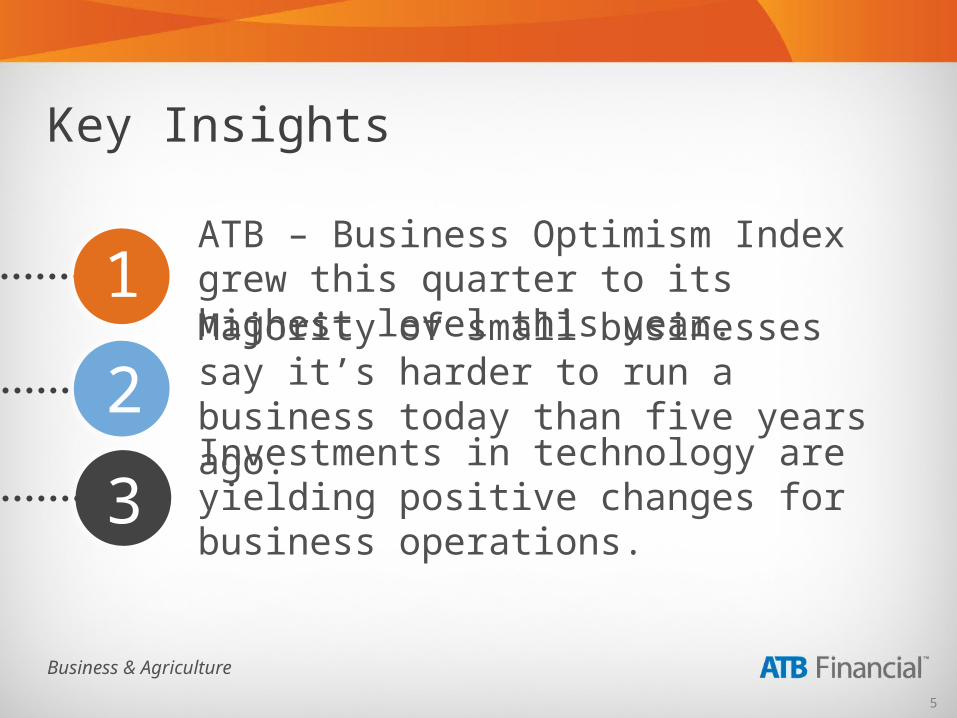
ATB – Business Optimism Index grew this quarter to its highest level this year.Majority of small businesses say it’s harder to run a business today than five years ago.Investments in technology are yielding positive changes for business operations.
1
2
3
Key Insights
6
Business Confidence
7
Business & Agriculture
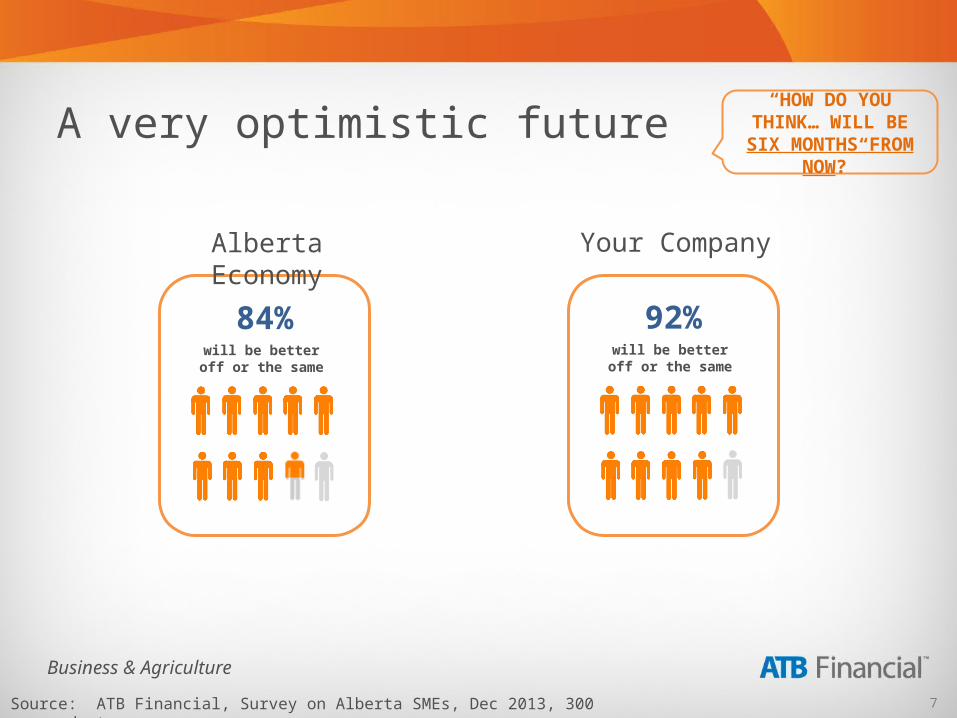
A very optimistic future
Alberta Economy
84%will be better off or the
same
Your Company
92%will be better off or the
same
“HOW DO YOU THINK… WILL BE SIX MONTHS
FROM NOW?”
Source: ATB Financial, Survey on Alberta SMEs, Dec 2013, 300 respondents.
8
Business & Agriculture
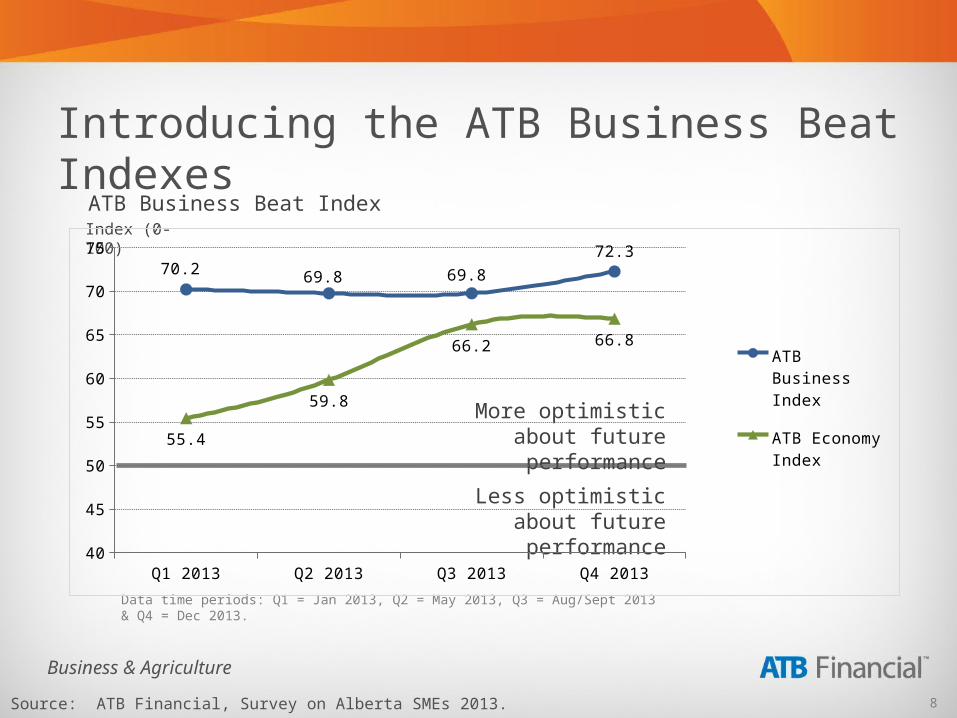
Introducing the ATB Business Beat Indexes
Data time periods: Q1 = Jan 2013, Q2 = May 2013, Q3 = Aug/Sept 2013 & Q4 = Dec 2013.
Source: ATB Financial, Survey on Alberta SMEs 2013.
More optimistic about future performance
Less optimistic about future performance
Index (0-100)
ATB Business Beat Index
Q1 2013 Q2 2013 Q3 2013 Q4 201340
45
50
55
60
65
70
7570.2 69.8 69.8
72.3
55.4
59.8
66.2 66.8
ATB Business Index
ATB Economy Index
9
Business & Agriculture
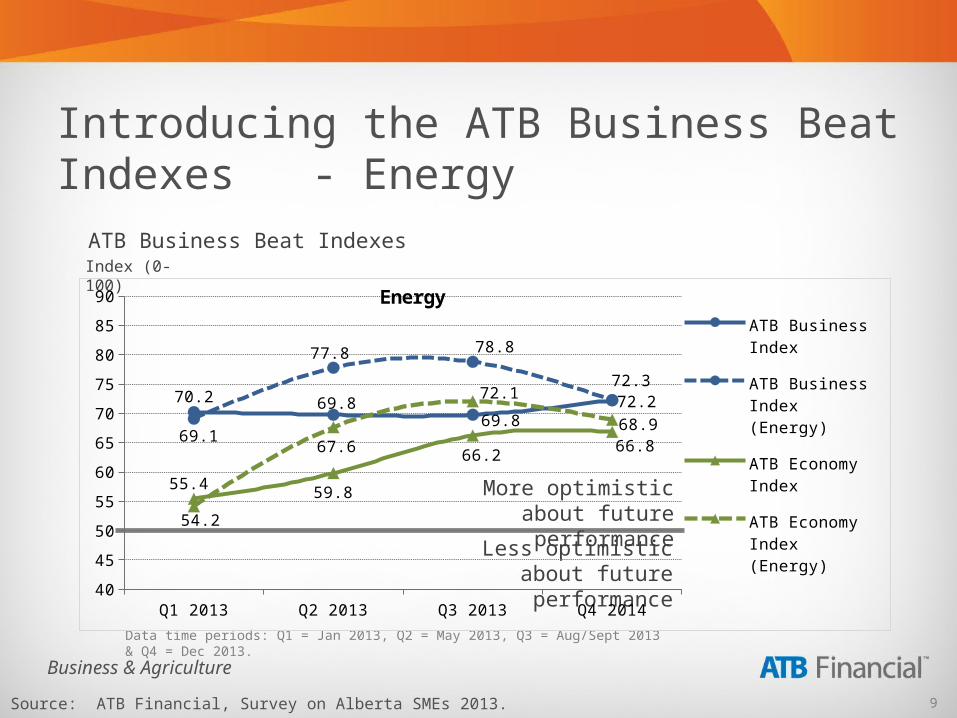
Introducing the ATB Business Beat Indexes - Energy
Data time periods: Q1 = Jan 2013, Q2 = May 2013, Q3 = Aug/Sept 2013 & Q4 = Dec 2013.
Source: ATB Financial, Survey on Alberta SMEs 2013.
More optimistic about future performance
Less optimistic about future performance
Index (0-100)
ATB Business Beat Indexes
Q1 2013 Q2 2013 Q3 2013 Q4 201440
45
50
55
60
65
70
75
80
85
90
70.2 69.869.8
72.3
69.1
77.8 78.8
72.2
55.4 59.8
66.266.8
54.2
67.6
72.1
68.9
Energy
ATB Business Index
ATB Business Index (Energy)
ATB Economy Index
ATB Economy Index (Energy)
10
Business & Agriculture
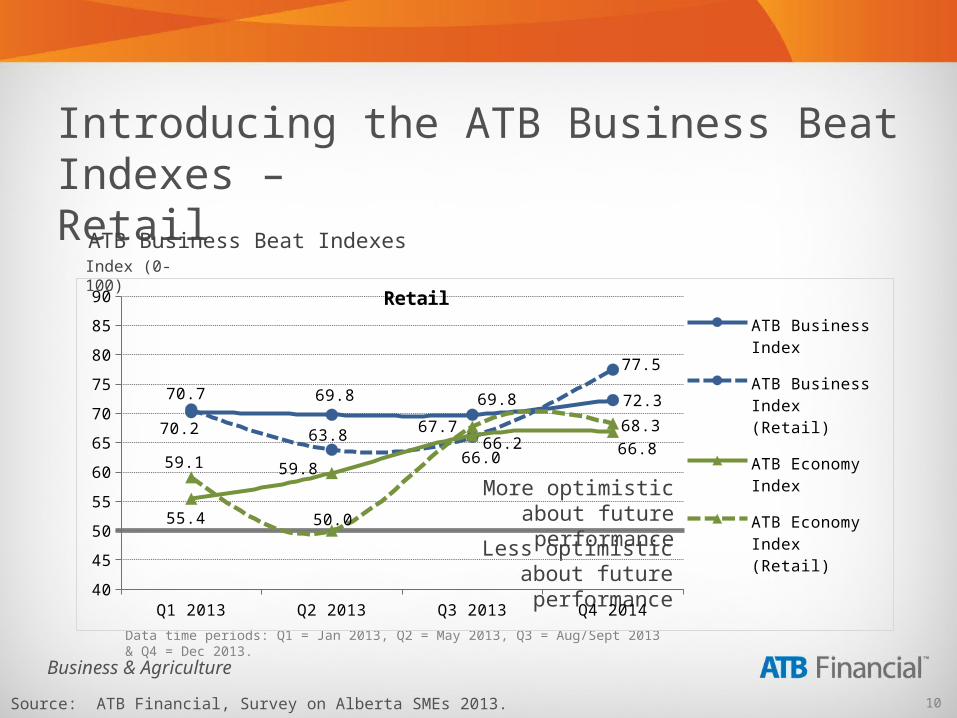
Introducing the ATB Business Beat Indexes – Retail
Data time periods: Q1 = Jan 2013, Q2 = May 2013, Q3 = Aug/Sept 2013 & Q4 = Dec 2013.
Source: ATB Financial, Survey on Alberta SMEs 2013.
More optimistic about future performance
Less optimistic about future performance
Index (0-100)
ATB Business Beat Indexes
Q1 2013 Q2 2013 Q3 2013 Q4 201440
45
50
55
60
65
70
75
80
85
90
70.2
69.8 69.8 72.370.7
63.866.0
77.5
55.4
59.8
66.2 66.859.1
50.0
67.7 68.3
Retail
ATB Business Index
ATB Business Index (Retail)
ATB Economy Index
ATB Economy Index (Retail)
11
Business & Agriculture
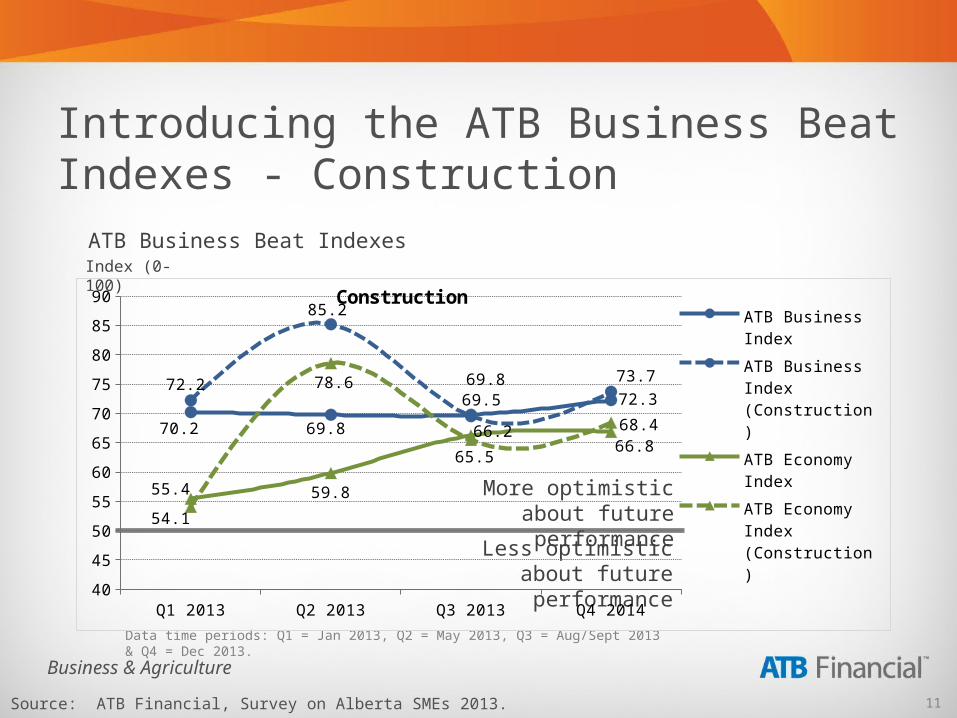
Introducing the ATB Business Beat Indexes - Construction
Data time periods: Q1 = Jan 2013, Q2 = May 2013, Q3 = Aug/Sept 2013 & Q4 = Dec 2013.
Source: ATB Financial, Survey on Alberta SMEs 2013.
More optimistic about future performance
Less optimistic about future performance
Index (0-100)
ATB Business Beat Indexes
Q1 2013 Q2 2013 Q3 2013 Q4 201440
45
50
55
60
65
70
75
80
85
90
70.2 69.8
69.872.3
72.2
85.2
69.5
73.7
55.4 59.8
66.266.8
54.1
78.6
65.5
68.4
Construction
ATB Business Index
ATB Business Index (Con-struction)
ATB Economy Index
ATB Economy Index (Con-struction)
12
Business Growth
13
Business & Agriculture
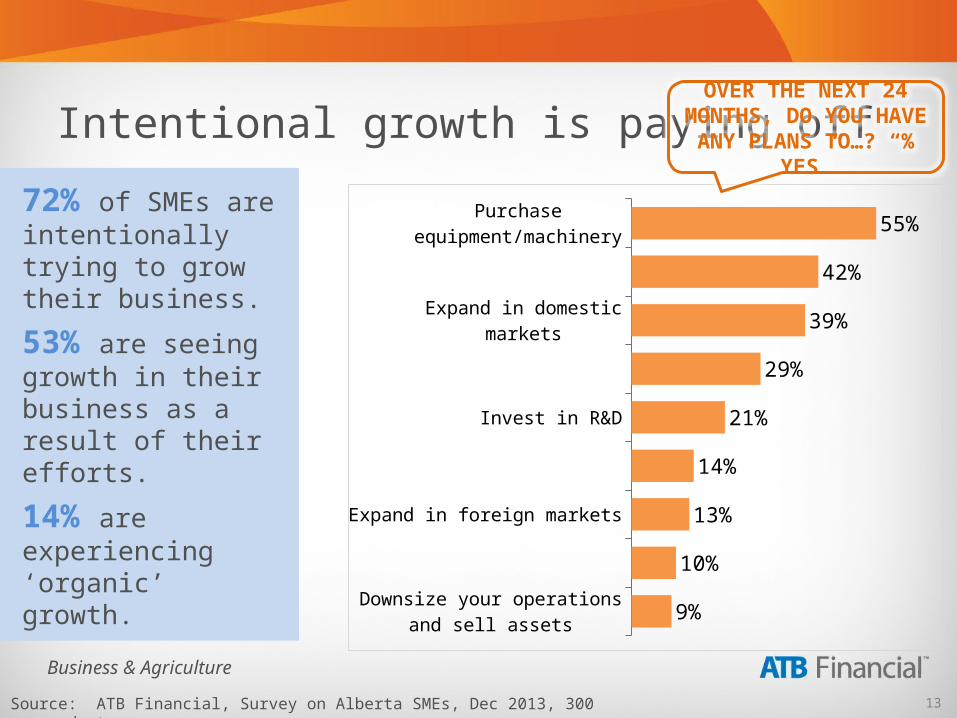
Intentional growth is paying off
72% of SMEs are intentionally trying to grow their business.
53% are seeing growth in their business as a result of their efforts.
14% are experiencing ‘organic’ growth.
Downsize your operations and sell assets
Purchase another company
Expand in foreign markets
Purchase/build commercial real estate
Invest in R&D
Commercialize new products or services
Expand in domestic markets
Invest in new IT
Purchase equipment/machinery
9%
10%
13%
14%
21%
29%
39%
42%
55%
OVER THE NEXT 24 MONTHS, DO YOU HAVE ANY
PLANS TO…? “% YES”
Source: ATB Financial, Survey on Alberta SMEs, Dec 2013, 300 respondents.
14
How Running a Small Business Has Changed in the last Five Years
15
Business & Agriculture
Running a SME hasn’t gotten any easier! “DO YOU FEEL IT IS EASIER OR
MORE DIFFICULT TO RUN A SMALL BUSINESS TODAY THAN
IT WAS FIVE YEARS AGO?”TODAY5 YEARS AGO
Source: ATB Financial, Survey on Alberta SMEs, Dec 2013, 300 respondents.
70% say it is more difficult to run a business TODAY
16% say it’s about the same
10% say it was harder 5 YEARS AGO
Don't know
Easier
About the same
More difficult
4%
10%
16%
70%
16
Business & Agriculture
“JUST TO TRY TO GET PEOPLE, FOR STAFF. NOBODY WANTS TO
BE A TRUCK DRIVER THESE DAYS. THE WOES OF RURAL ALBERTA,
WE JUST DON'T HAVE THE PEOPLE. EVERYBODY WANTS TO BE IN THE CITY. WE HAVE TO COMPETE WITH
ALL THOSE LARGE PLANTS UP AT THE TAR SANDS.
”
Small businesses who report it’s harder point to:
Increased environmental regulations
More competition from foreign suppliers
Margins are smaller/ greater volume needed for same profit
Less people care about supporting local businesses
Harder to keep pace with new technology
More competition from big business domestically
Harder to retain existing customers
Technology advances making it more difficult/ less efficient
Economy is worse today
More taxes
Lack of or no access to capital/ capital constrained
Higher costs
More direct competitors
Increased governmental regulations
Harder to attract and retain good employees
3%
3%
3%
3%
3%
4%
4%
5%
6%
7%
7%
11%
13%
27%
28%
Owner, Construction business, 50 years in operation,5 to 19 employees,$3M-$5M in revenues.
Source: ATB Financial, Survey on Alberta SMEs, Dec 2013; among those who report it’s MORE DIFFICULT to run a business today (n= 211 ); responses mentioned by 3% or more are shown.
“WHY DO YOU THINK ITS MORE DIFFICULT TO RUN
A BUSINESS TODAY?”
17
Business & Agriculture
Small businesses who believe it’s easier mention:
It's easier to market your business
Easier to retain existing customers
Easier access to capital
More people care about supporting local businesses
Economy is better today
Technology advances are making it easier/ more efficient
7%
7%
10%
13%
20%
33%
“THE EASE OF COMMUNICATING AND
TECHNOLOGY HAS MADE IT EASIER TO RUN. WE CAN
COMMUNICATE BETTER WITH OUR CUSTOMERS VIA
THE WEB AND OTHER SOURCES AND THE
OPERATIONS OF THE COMPANY ARE MORE
STREAMLINED BECAUSE THEY ARE MORE COMPUTERIZED.
”
General Manager, Energy or Oil and Gas, 38 years in business,5 to 19 employees,$3M-$5M in revenues.
Source: ATB Financial, Survey on Alberta SMEs, Dec 2013; among those who report it’s EASIER to run a business today (n= 30 ); responses mentioned by 7% or more are shown.
“WHY DO YOU THINK ITS EASIER TO RUN A BUSINESS TODAY?”

18
Technology investments made
19
Business & Agriculture
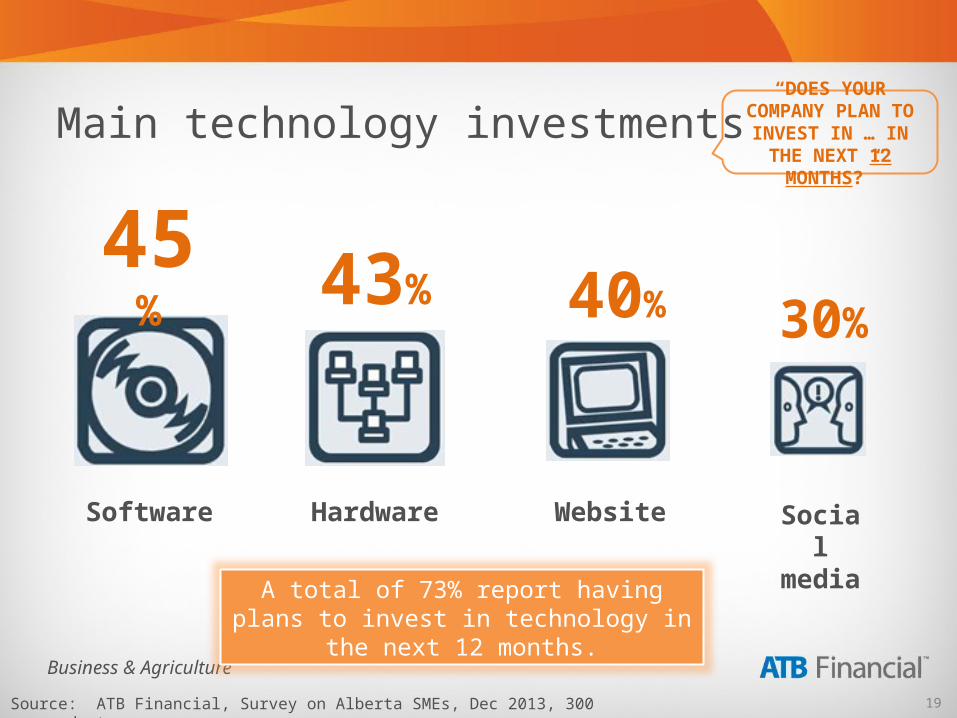
Main technology investments “DOES YOUR COMPANY PLAN TO INVEST IN … IN THE NEXT 12 MONTHS?”
Source: ATB Financial, Survey on Alberta SMEs, Dec 2013, 300 respondents.
Software
Hardware
Website Social
media
45% 43% 40% 30%
A total of 73% report having plans to invest in technology in the next 12
months.
20
Business & Agriculture
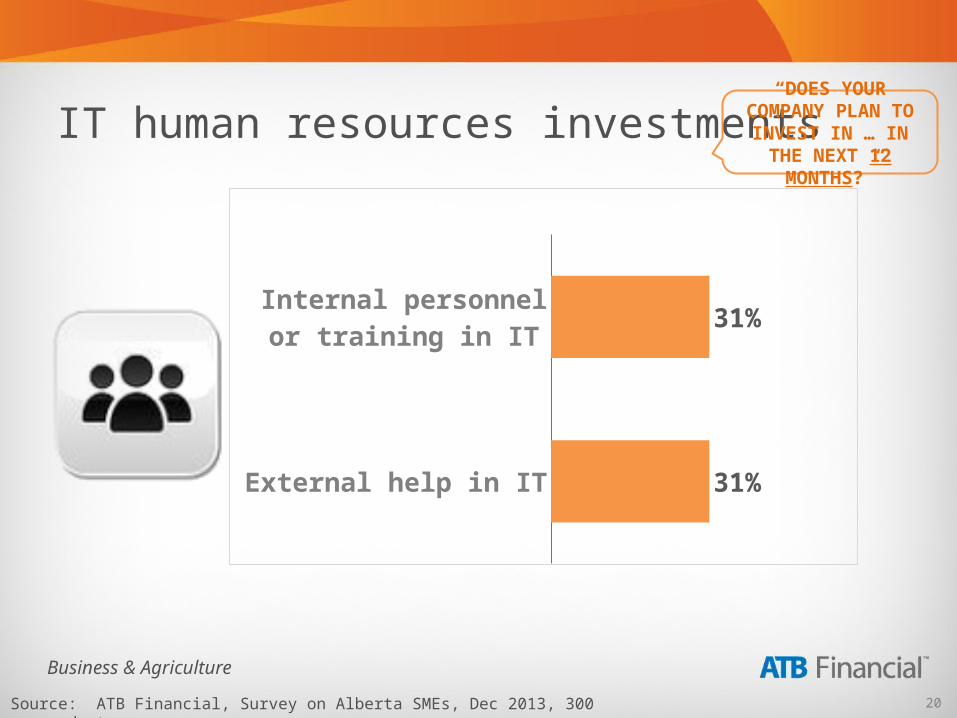
IT human resources investments“DOES YOUR COMPANY PLAN TO INVEST IN … IN THE NEXT 12 MONTHS?”
Source: ATB Financial, Survey on Alberta SMEs, Dec 2013, 300 respondents.
Internal personnel or training in IT
External help in IT
31%
31%
21
Business & Agriculture
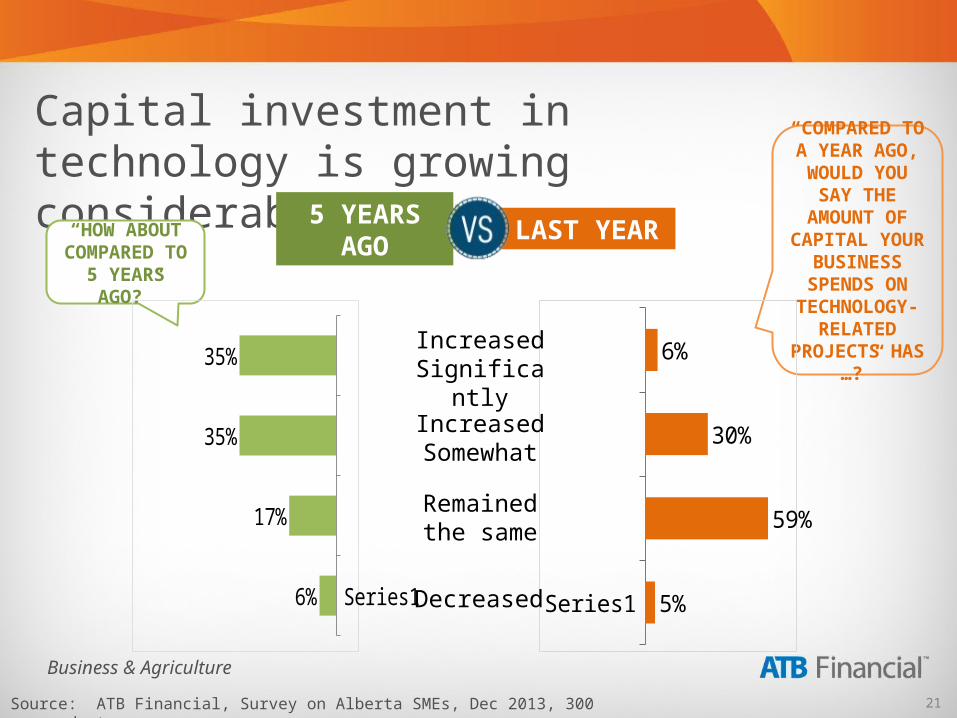
Capital investment in technology is growing considerably
“COMPARED TO A YEAR AGO,
WOULD YOU SAY THE AMOUNT OF CAPITAL YOUR
BUSINESS SPENDS ON
TECHNOLOGY-RELATED
PROJECTS HAS …?”
“HOW ABOUT COMPARED TO 5
YEARS AGO?”
Series1 5%
59%
30%
6%
Series16%
17%
35%
35%
LAST YEAR5 YEARS AGO
Source: ATB Financial, Survey on Alberta SMEs, Dec 2013, 300 respondents.
Increased Significantl
yIncreased Somewhat
Remained the same
Decreased
22
Business & Agriculture
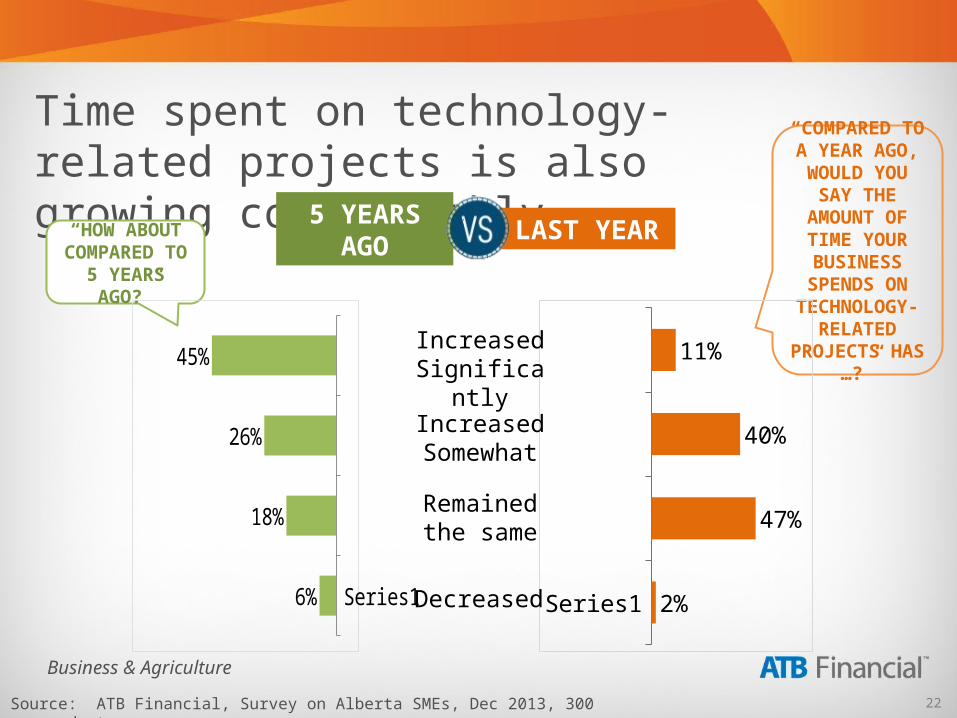
Time spent on technology-related projects is also growing considerably
“COMPARED TO A YEAR AGO,
WOULD YOU SAY THE AMOUNT OF
TIME YOUR BUSINESS
SPENDS ON TECHNOLOGY-
RELATED PROJECTS HAS
…?”
“HOW ABOUT COMPARED TO 5
YEARS AGO?”
Series1 2%
47%
40%
11%
Series16%
18%
26%
45%
LAST YEAR5 YEARS AGO
Source: ATB Financial, Survey on Alberta SMEs, Dec 2013, 300 respondents.
Increased Significantl
yIncreased Somewhat
Remained the same
Decreased
23
Technology’s impact on Small Businesses
24
Business & Agriculture
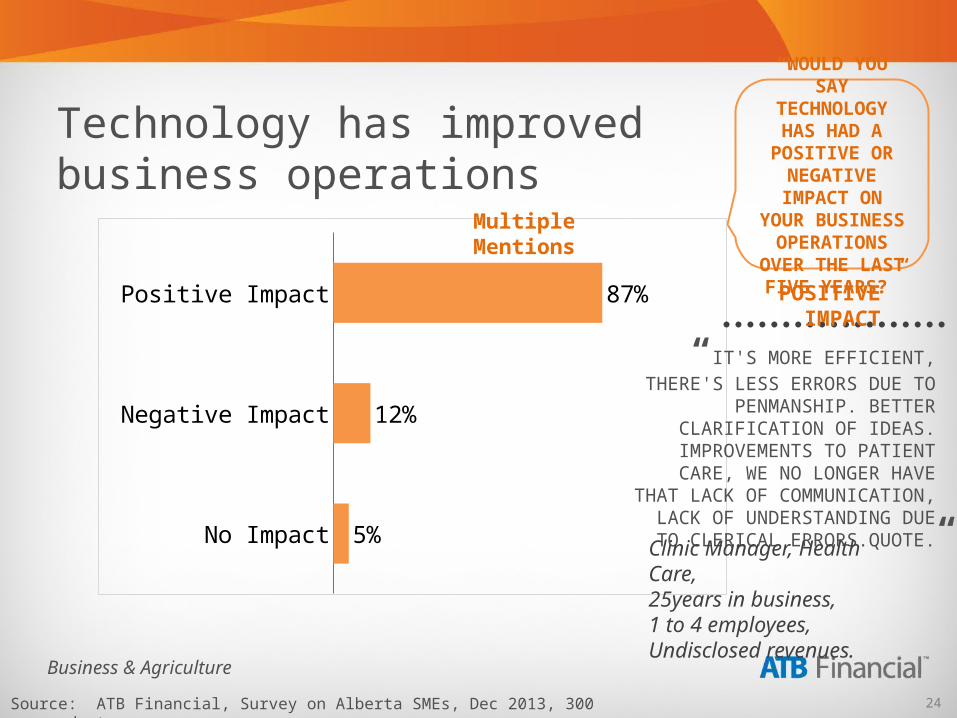
Technology has improved business operations
“WOULD YOU SAY TECHNOLOGY HAS HAD A POSITIVE OR NEGATIVE IMPACT
ON YOUR BUSINESS OPERATIONS OVER
THE LAST FIVE YEARS?”
Source: ATB Financial, Survey on Alberta SMEs, Dec 2013, 300 respondents.
Positive Impact
Negative Impact
No Impact
87%
12%
5%
Multiple Mentions
“IT'S MORE EFFICIENT, THERE'S LESS ERRORS DUE TO
PENMANSHIP. BETTER CLARIFICATION OF IDEAS.
IMPROVEMENTS TO PATIENT CARE, WE NO LONGER HAVE
THAT LACK OF COMMUNICATION, LACK OF
UNDERSTANDING DUE TO CLERICAL ERRORS.QUOTE.
”Clinic Manager, Health Care, 25years in business,1 to 4 employees,Undisclosed revenues.
POSITIVE IMPACT
25
Business & Agriculture
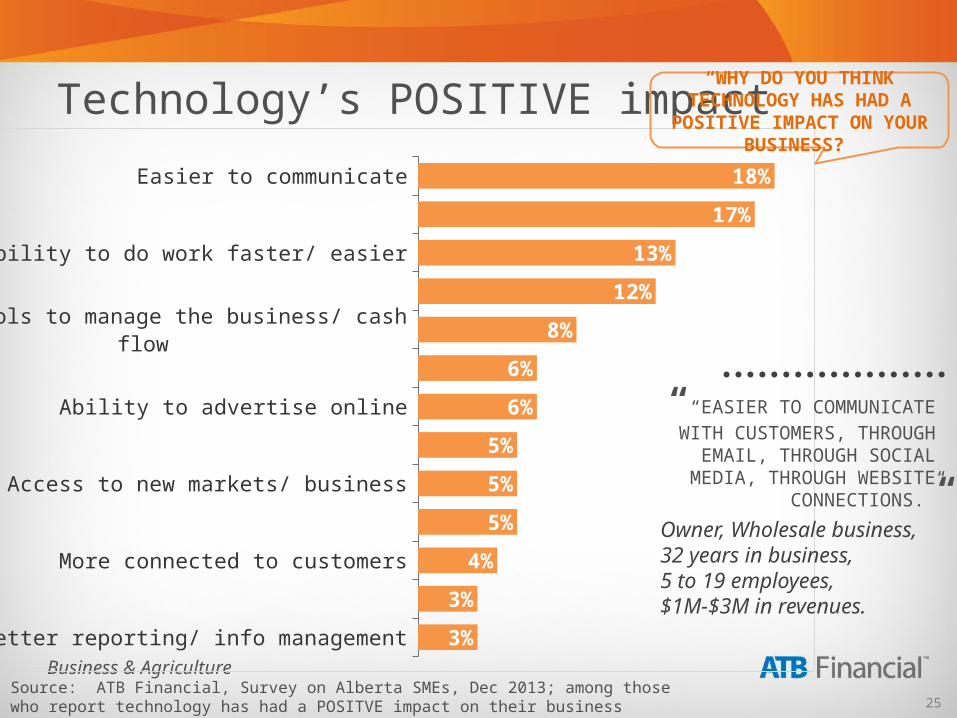
Technology’s POSITIVE impact
Better reporting/ info management
File management/ document storage
More connected to customers
Remote access to information - mobile workforce
Access to new markets/ business
Increase productivity/ efficiency
Ability to advertise online
Greater market presence
Better tools to manage the business/ cash flow
Easier access to information
Ability to do work faster/ easier
Ability to streamline business processes
Easier to communicate
3%
3%
4%
5%
5%
5%
6%
6%
8%
12%
13%
17%
18%
““EASIER TO COMMUNICATE WITH CUSTOMERS, THROUGH
EMAIL, THROUGH SOCIAL MEDIA, THROUGH WEBSITE
CONNECTIONS.”
”Owner, Wholesale business, 32 years in business,5 to 19 employees,$1M-$3M in revenues.
Source: ATB Financial, Survey on Alberta SMEs, Dec 2013; among those who report technology has had a POSITVE impact on their business (n=259); responses mentioned by 3% or more are shown.
“WHY DO YOU THINK TECHNOLOGY HAS HAD A POSITIVE IMPACT ON
YOUR BUSINESS?”
26
Business & Agriculture
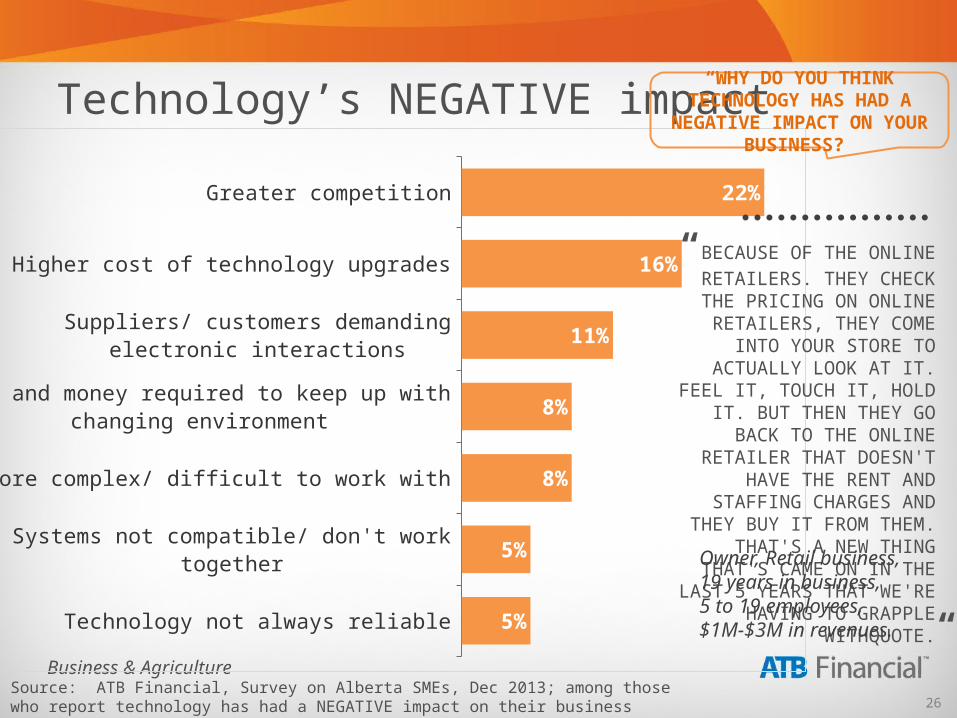
Technology’s NEGATIVE impact
Technology not always reliable
Systems not compatible/ don't work together
More complex/ difficult to work with
Time and money required to keep up with changing environment
Suppliers/ customers demanding electronic interactions
Higher cost of technology upgrades
Greater competition
5%
5%
8%
8%
11%
16%
22%
“BECAUSE OF THE ONLINE RETAILERS. THEY CHECK THE
PRICING ON ONLINE RETAILERS, THEY COME INTO
YOUR STORE TO ACTUALLY LOOK AT IT. FEEL IT, TOUCH IT, HOLD IT. BUT THEN THEY
GO BACK TO THE ONLINE RETAILER THAT DOESN'T
HAVE THE RENT AND STAFFING CHARGES AND
THEY BUY IT FROM THEM. THAT'S A NEW THING THAT'S
CAME ON IN THE LAST 5 YEARS THAT WE'RE HAVING
TO GRAPPLE WITHQUOTE.
”
Owner, Retail business, 19 years in business,5 to 19 employees,$1M-$3M in revenues.
Source: ATB Financial, Survey on Alberta SMEs, Dec 2013; among those who report technology has had a NEGATIVE impact on their business (n=37); responses mentioned by 5% or more are shown.
“WHY DO YOU THINK TECHNOLOGY HAS HAD A NEGATIVE IMPACT ON
YOUR BUSINESS?”
27
Technology solutions being used
28
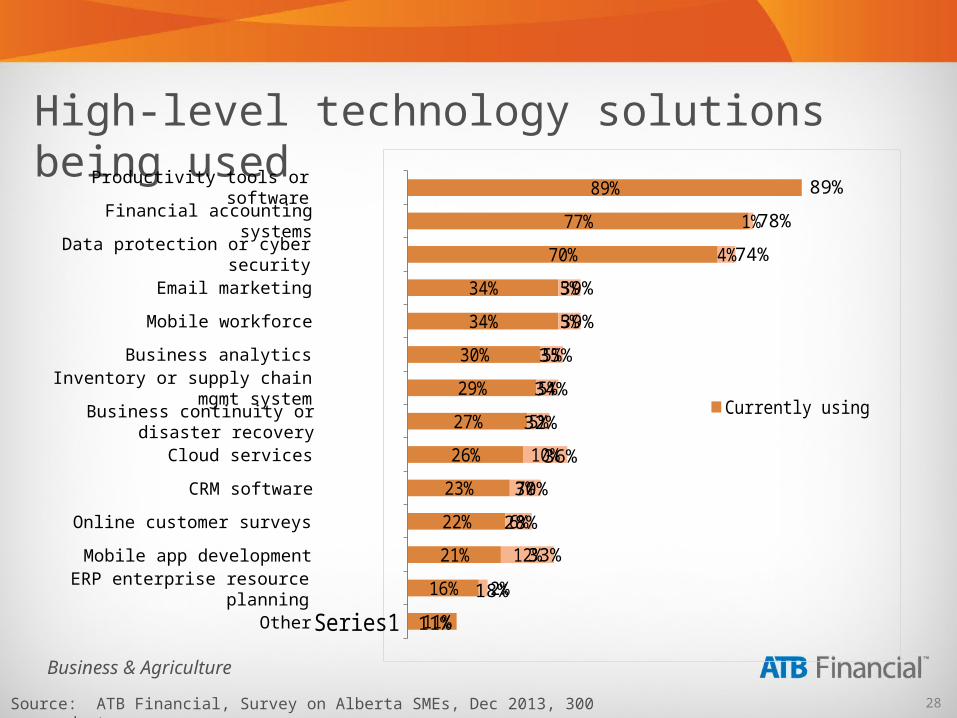
Business & Agriculture
High-level technology solutions being used
Source: ATB Financial, Survey on Alberta SMEs, Dec 2013, 300 respondents.
Productivity tools or software
Series1
11%
16%
21%
22%
23%
26%
27%
29%
30%
34%
34%
70%
77%
89%
2%
12%
6%
7%
10%
5%
5%
5%
5%
5%
4%
1%
Currently usingThinking about us-ing
Other
Financial accounting systems
Data protection or cyber security
Email marketing
Mobile workforce
Business analyticsInventory or supply chain mgmt
systemBusiness continuity or disaster
recoveryCloud services
CRM software
Online customer surveys
Mobile app developmentERP enterprise resource
planning
89%
78%
74%
39%
39%
35%
34%
32%
36%
30%
28%
33%
18%
11%
29
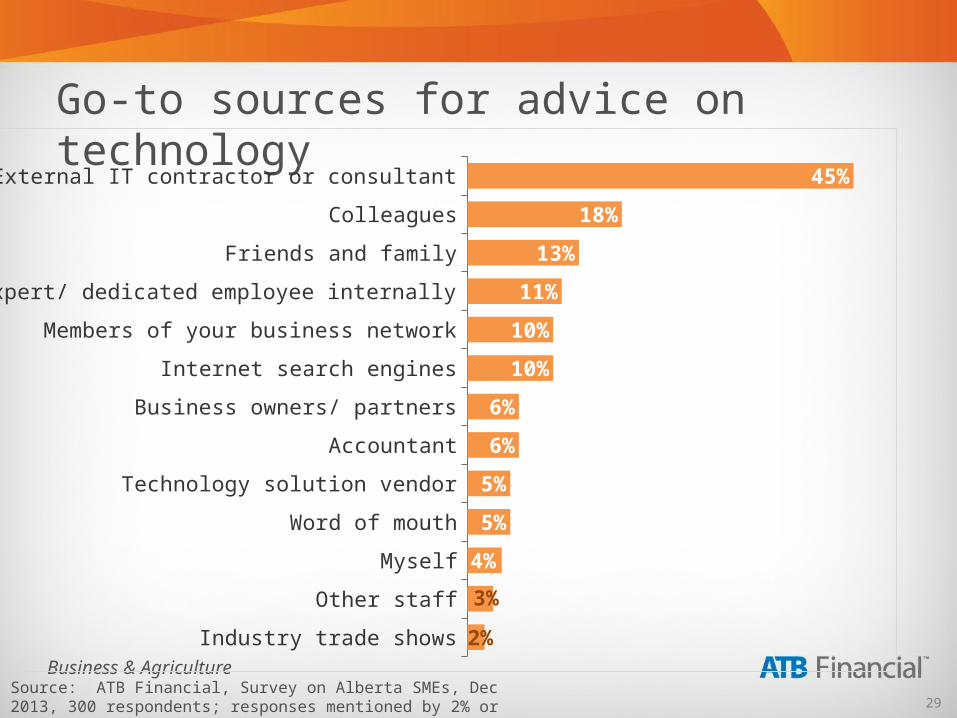
Business & Agriculture
Go-to sources for advice on technology
Industry trade shows
Other staff
Myself
Word of mouth
Technology solution vendor
Accountant
Business owners/ partners
Internet search engines
Members of your business network
Technical expert/ dedicated employee internally
Friends and family
Colleagues
External IT contractor or consultant
2%
3%
4%
5%
5%
6%
6%
10%
10%
11%
13%
18%
45%
Source: ATB Financial, Survey on Alberta SMEs, Dec 2013, 300 respondents; responses mentioned by 2% or more are shown.
30
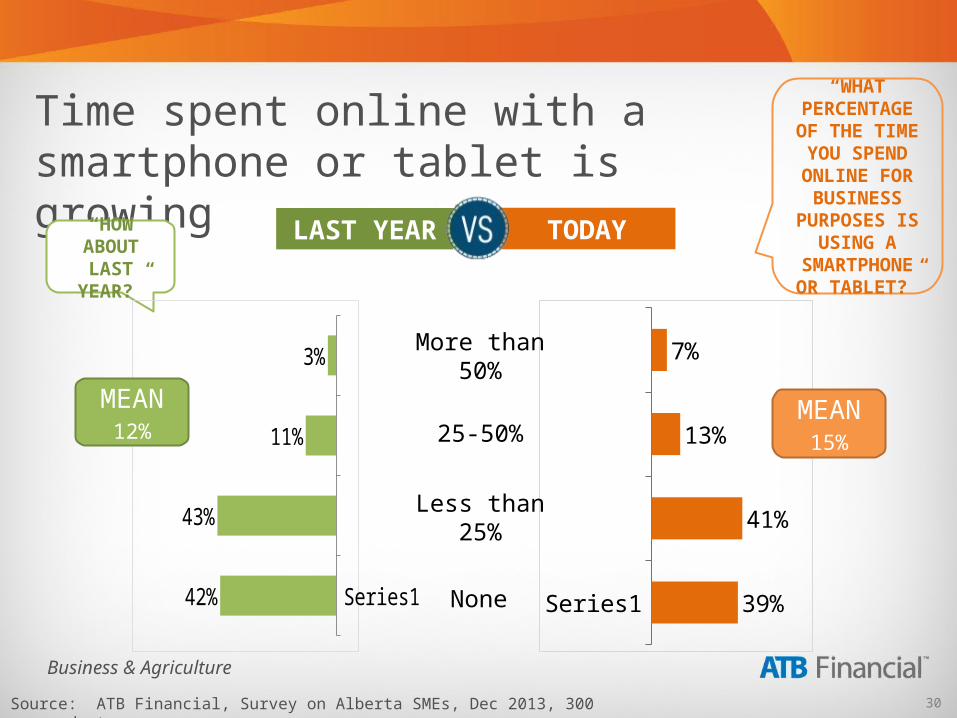
Business & Agriculture
Time spent online with a smartphone or tablet is growing
“WHAT PERCENTAGE OF
THE TIME YOU SPEND ONLINE FOR BUSINESS PURPOSES IS
USING A SMARTPHONE OR TABLET?”
“HOW ABOUT LAST
YEAR?”
Series1 39%
41%
13%
7%
Series142%
43%
11%
3%
TODAYLAST YEAR
Source: ATB Financial, Survey on Alberta SMEs, Dec 2013, 300 respondents.
More than 50%
25-50%
Less than 25%
None
MEAN15%
MEAN12%
31
Corporate website usage
32
Business & Agriculture
Corporate website usage and purpose
75% of SMEs have a corporate website.
E-commerce
Online business brochure or catalog
Informational purposes
17%
49%
92%
“WHAT IS THE MAIN PURPOSE OF YOUR BUSINESS’ WEBSITE?”
Source: ATB Financial, Survey on Alberta SMEs, Dec 2013; among those who report having a business website (n=225).
33
Business & Agriculture
Capital spent on the website has grown considerably
“COMPARED TO A YEAR AGO,
WOULD YOU SAY THE AMOUNT OF CAPITAL YOUR
BUSINESS SPENDS ON ITS WEBSITE HAS
…?”
“HOW ABOUT COMPARED TO 5
YEARS AGO?”
Series1 5%
61%
21%
12%
Series16%
22%
29%
37%
LAST YEAR5 YEARS AGO
Source: ATB Financial, Survey on Alberta SMEs, Dec 2013; among those who report having a business website (n=225).
Increased Significantl
yIncreased Somewhat
Remained the same
Decreased
34
Business & Agriculture
Developing an online sales channel
Don't know
More than 5 years
In the next 2 to 5 years
In the next year
It currently is
6%
38%
32%
14%
9%
Source: ATB Financial, Survey on Alberta SMEs, Dec 2013; among those who report having an e-commerce website (n=34).
“IF YOU THOUGHT OF YOUR ONLINE
SALES AS COMING FROM A SINGLE
LOCATION, AT WHAT POINT WOULD YOU SEE IT BECOMING
YOUR BEST LOCATION?”
35
Business & Agriculture
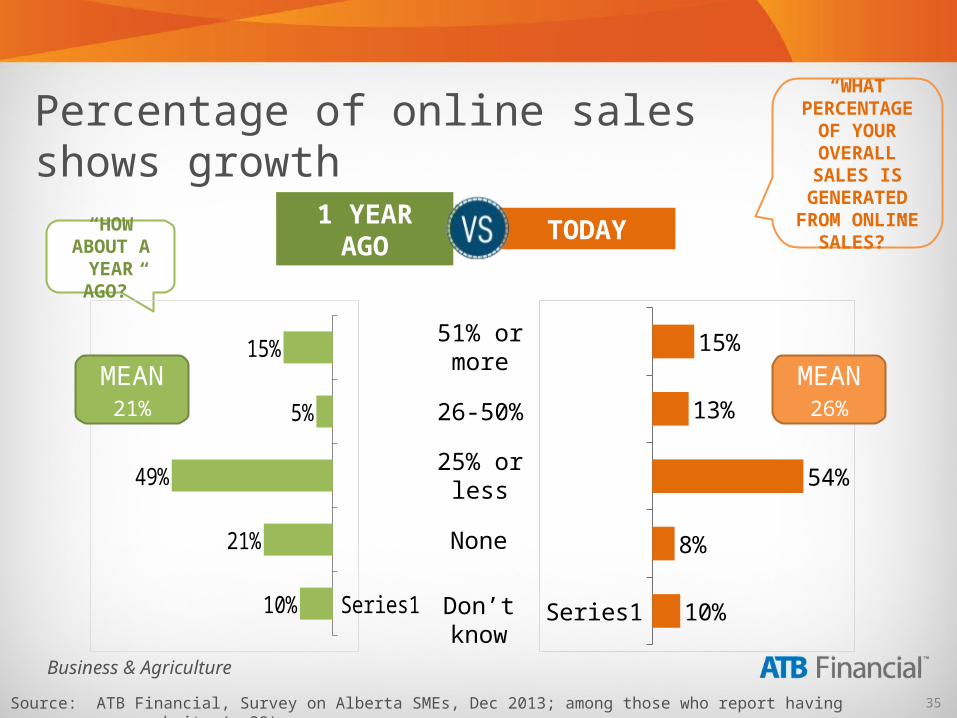
Percentage of online sales shows growth
“WHAT PERCENTAGE OF YOUR OVERALL
SALES IS GENERATED
FROM ONLINE SALES?”“HOW
ABOUT A YEAR AGO?”
Series1 10%
8%
54%
13%
15%
Series110%
21%
49%
5%
15%
TODAY1 YEAR AGO
51% or more
26-50%
25% or less
Don’t know
MEAN26%
MEAN21%
Source: ATB Financial, Survey on Alberta SMEs, Dec 2013; among those who report having an e-commerce website (n=39).
None
36
Social media usage
37
Business & Agriculture
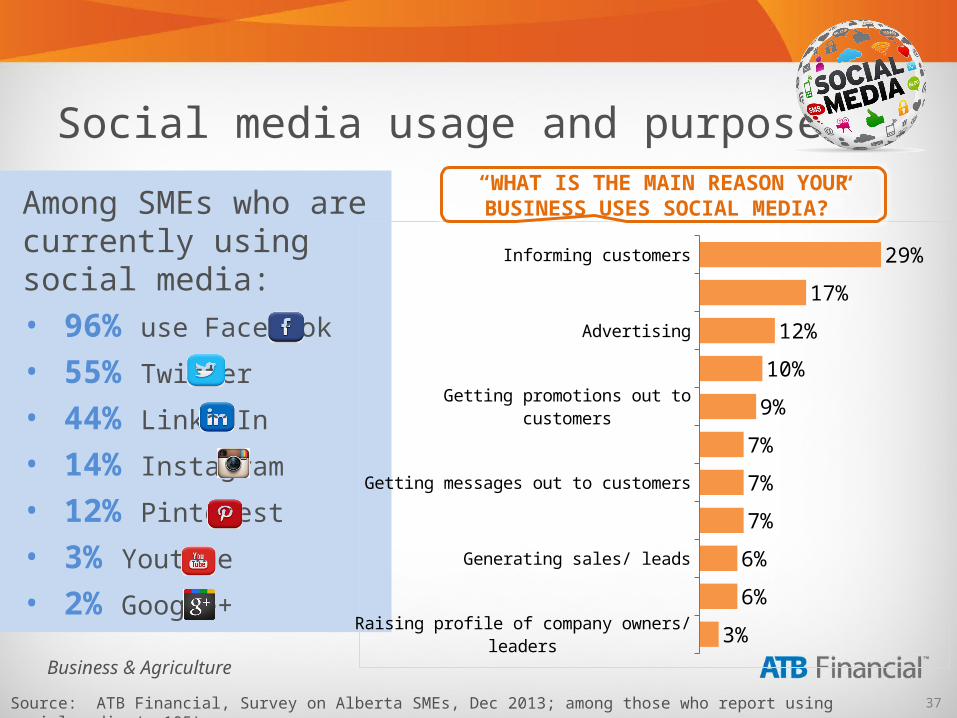
Social media usage and purpose
Among SMEs who are currently using social media:• 96% use Facebook
• 55% Twitter
• 44% LinkedIn
• 14% Instagram • 12% Pinterest
• 3% Youtube
• 2% Google+Raising profile of company owners/ leaders
Connecting/ understanding your customers
Generating sales/ leads
To keep up with everyone else
Getting messages out to customers
Engaging in conversations with customers
Getting promotions out to customers
Generating new clients
Advertising
Raising profile of the company
Informing customers
3%
6%
6%
7%
7%
7%
9%
10%
12%
17%
29%
“WHAT IS THE MAIN REASON YOUR BUSINESS USES SOCIAL MEDIA?”
Source: ATB Financial, Survey on Alberta SMEs, Dec 2013; among those who report using social media (n=105).
38
Business & Agriculture
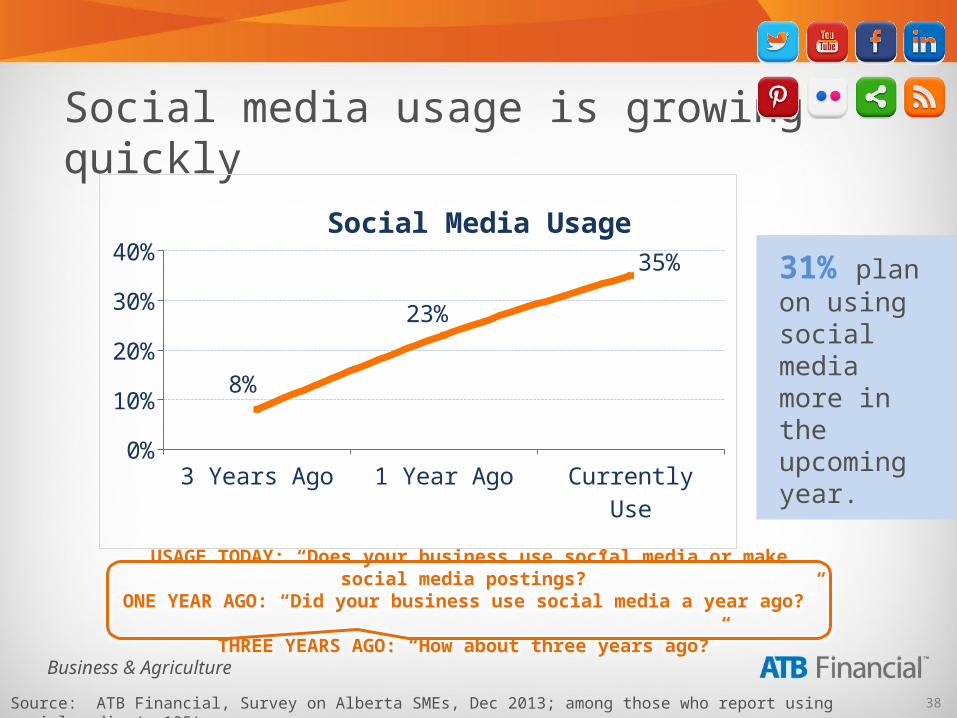
Social media usage is growing quickly
USAGE TODAY: “Does your business use social media or make social media postings?”ONE YEAR AGO: “Did your business use social media a year ago?”
THREE YEARS AGO: “How about three years ago?”
Source: ATB Financial, Survey on Alberta SMEs, Dec 2013; among those who report using social media (n=105).
31% plan on using social media more in the upcoming year.
3 Years Ago 1 Year Ago Currently Use0%
10%
20%
30%
40%
8%
23%
35%
Social Media Usage
39
Business & Agriculture
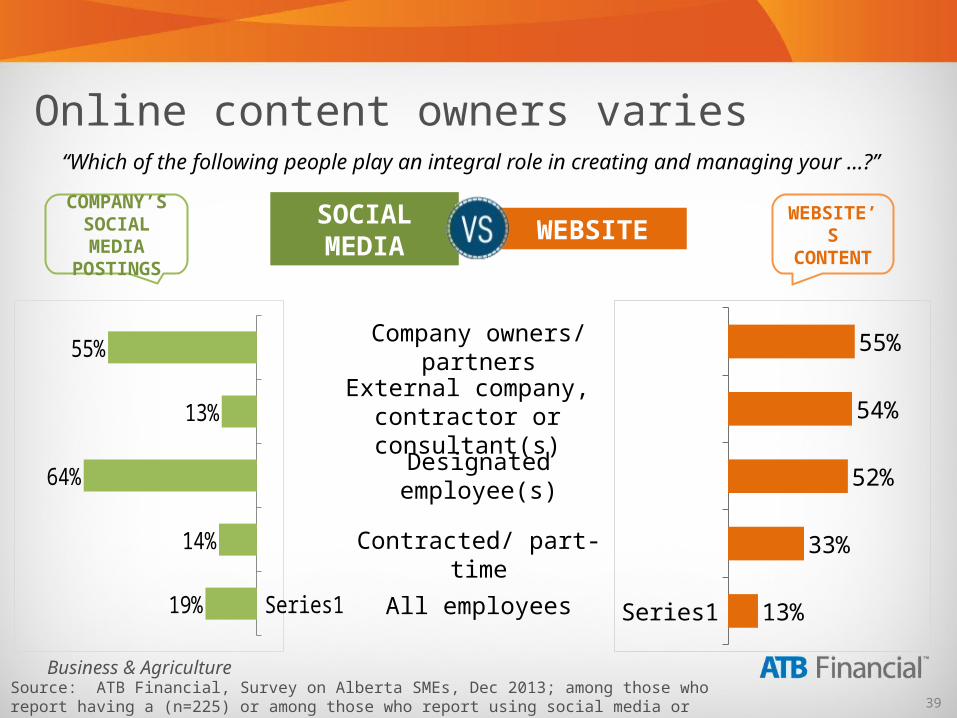
Online content owners varies
WEBSITE’S CONTENT
COMPANY’S SOCIAL MEDIA
POSTINGS
Series1 13%
33%
52%
54%
55%
Series119%
14%
64%
13%
55%
WEBSITESOCIAL MEDIA
Company owners/ partners
Designated employee(s)
All employees
Source: ATB Financial, Survey on Alberta SMEs, Dec 2013; among those who report having a (n=225) or among those who report using social media or make social media postings (n=105).
Contracted/ part-time
External company, contractor or consultant(s)
“Which of the following people play an integral role in creating and managing your …?”
40
APPENDIX: Firmographics & Respondent Demographics
41
Business & Agriculture
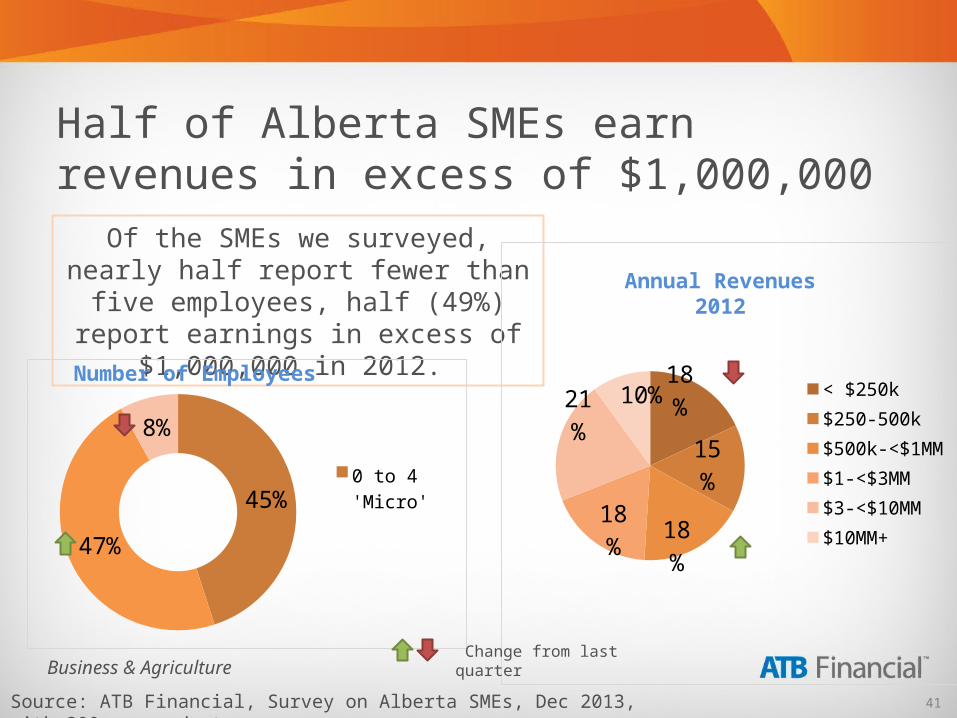
Half of Alberta SMEs earn revenues in excess of $1,000,000
Source: ATB Financial, Survey on Alberta SMEs, Dec 2013, with 300 respondents.
Of the SMEs we surveyed, nearly half report fewer than five employees, half
(49%) report earnings in excess of $1,000,000 in 2012.
45%
47%
8%0 to 4 'Micro'5 to 49 'Small'50 to 499 'Med'
18%
15%
18%
18%
21%
10% < $250k$250-500k$500k-<$1MM$1-<$3MM$3-<$10MM$10MM+
Number of Employees
Annual Revenues 2012
Change from last quarter
42
Business & Agriculture
Source: ATB Financial, Survey on Alberta SMEs, Dec 2013, with 300 respondents.
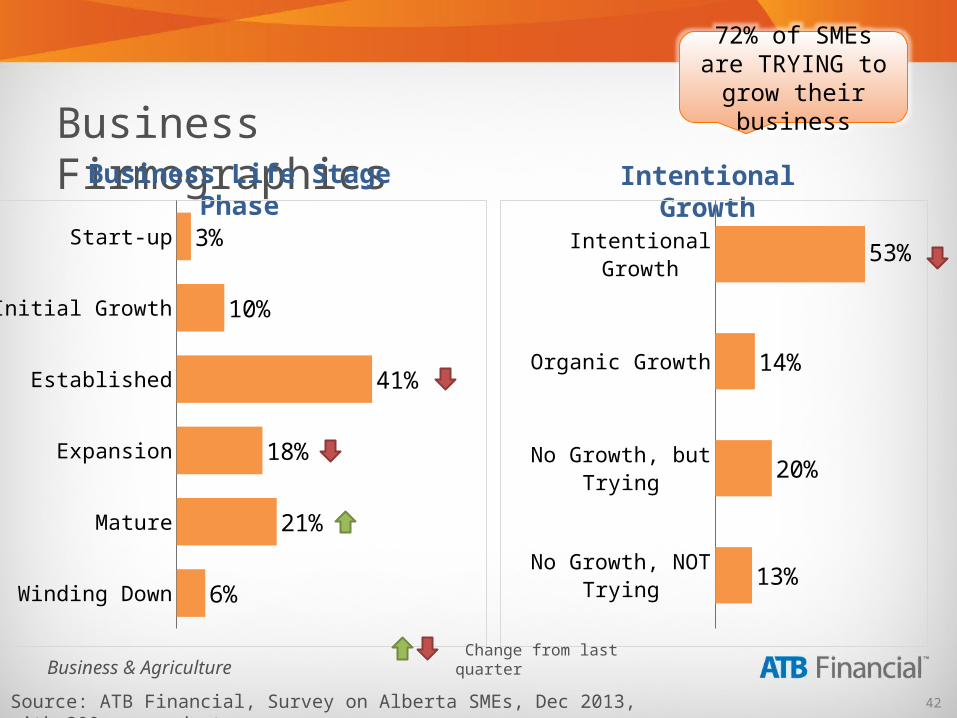
Business FirmographicsBusiness Life Stage
PhaseIntentional
GrowthStart-up
Initial Growth
Established
Expansion
Mature
Winding Down
3%
10%
41%
18%
21%
6%
Intentional Growth
Organic Growth
No Growth, but Trying
No Growth, NOT Trying
53%
14%
20%
13%
72% of SMEs are TRYING to
grow their business
Change from last quarter
43
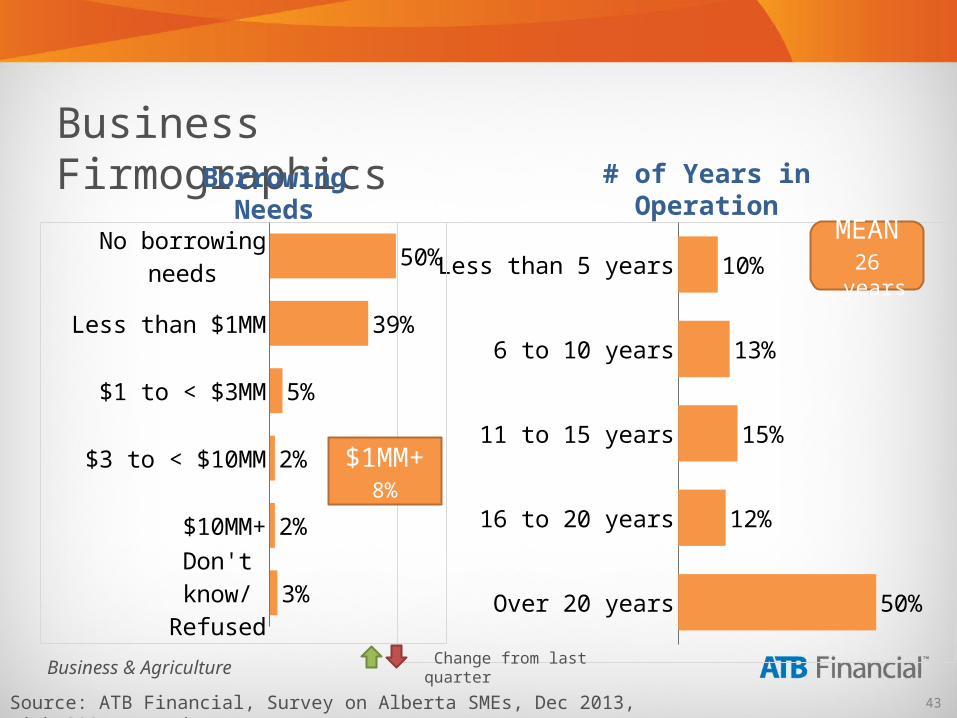
Business & Agriculture
Less than 5 years
6 to 10 years
11 to 15 years
16 to 20 years
Over 20 years
10%
13%
15%
12%
50%
No borrowing needs
Less than $1MM
$1 to < $3MM
$3 to < $10MM
$10MM+
Don't know/Refused
50%
39%
5%
2%
2%
3%
Business Firmographics
Source: ATB Financial, Survey on Alberta SMEs, Dec 2013, with 300 respondents.
$1MM+
8%
Borrowing Needs
# of Years in Operation
MEAN26
years
Change from last quarter
44
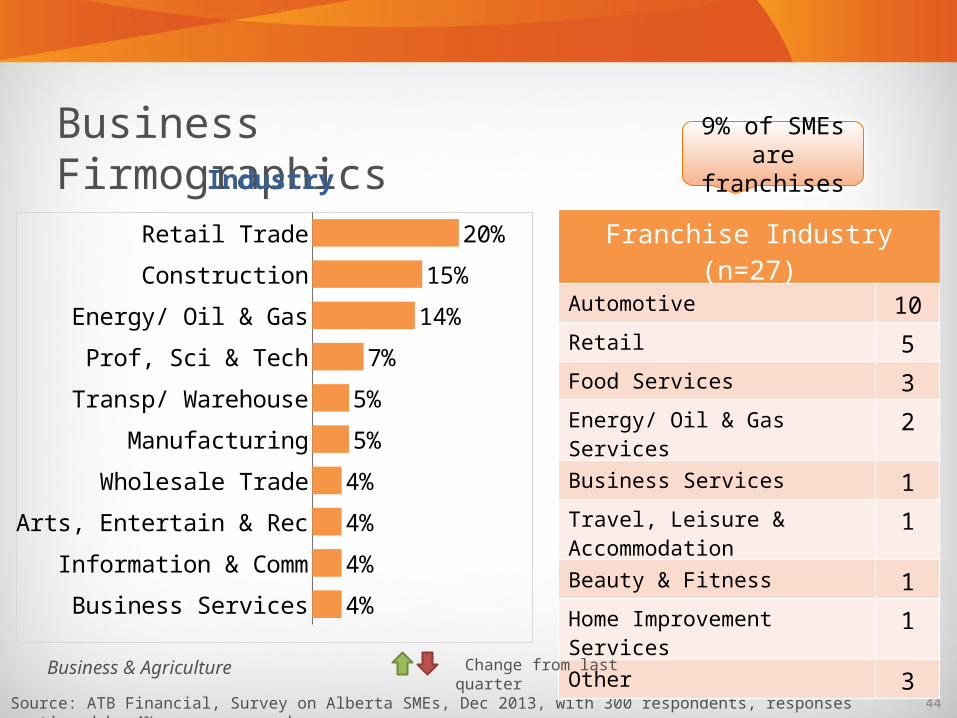
Business & Agriculture
Business Firmographics
Source: ATB Financial, Survey on Alberta SMEs, Dec 2013, with 300 respondents, responses mentioned by 4% or more are shown.
Industry
Retail Trade
Construction
Energy/ Oil & Gas
Prof, Sci & Tech
Transp/ Warehouse
Manufacturing
Wholesale Trade
Arts, Entertain & Rec
Information & Comm
Business Services
20%
15%
14%
7%
5%
5%
4%
4%
4%
4%
Franchise Industry (n=27)Automotive 10
Retail 5
Food Services 3
Energy/ Oil & Gas Services 2
Business Services 1
Travel, Leisure & Accommodation
1
Beauty & Fitness 1
Home Improvement Services
1
Other 3
9% of SMEs are
franchises
Change from last quarter
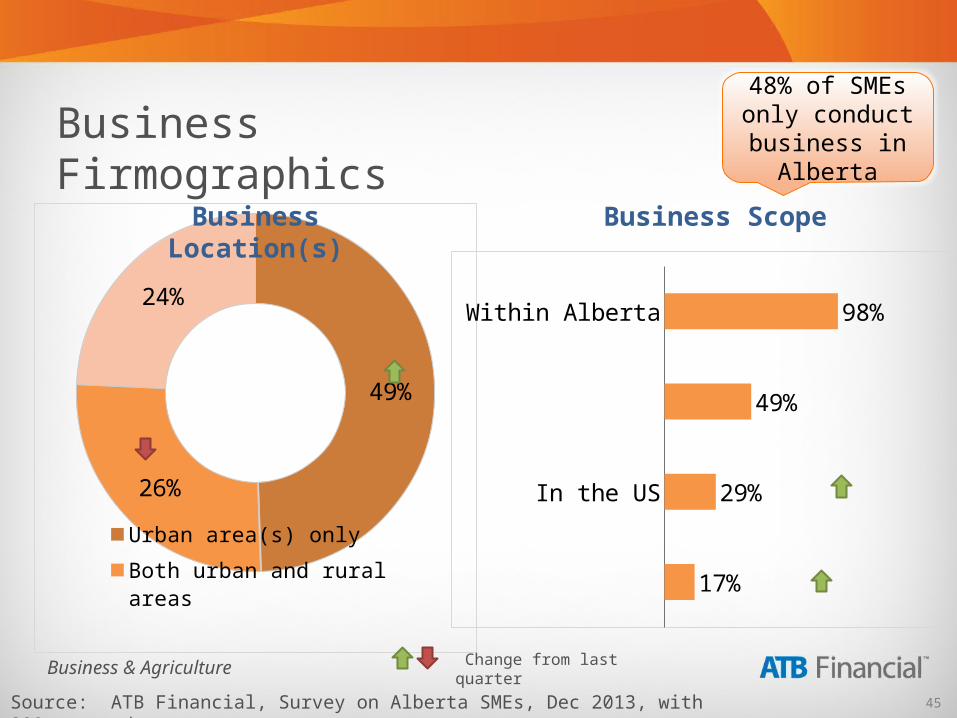
45
Business & Agriculture
49%
26%
24%
Urban area(s) onlyBoth urban and rural areasRural area(s) only
Business Firmographics
Source: ATB Financial, Survey on Alberta SMEs, Dec 2013, with 300 respondents.
Business Location(s)
48% of SMEs only conduct business in
Alberta
Within Alberta
In other parts of Canada
In the US
In international markets outside of Canada or the
US
98%
49%
29%
17%
Business Scope
Change from last quarter
46
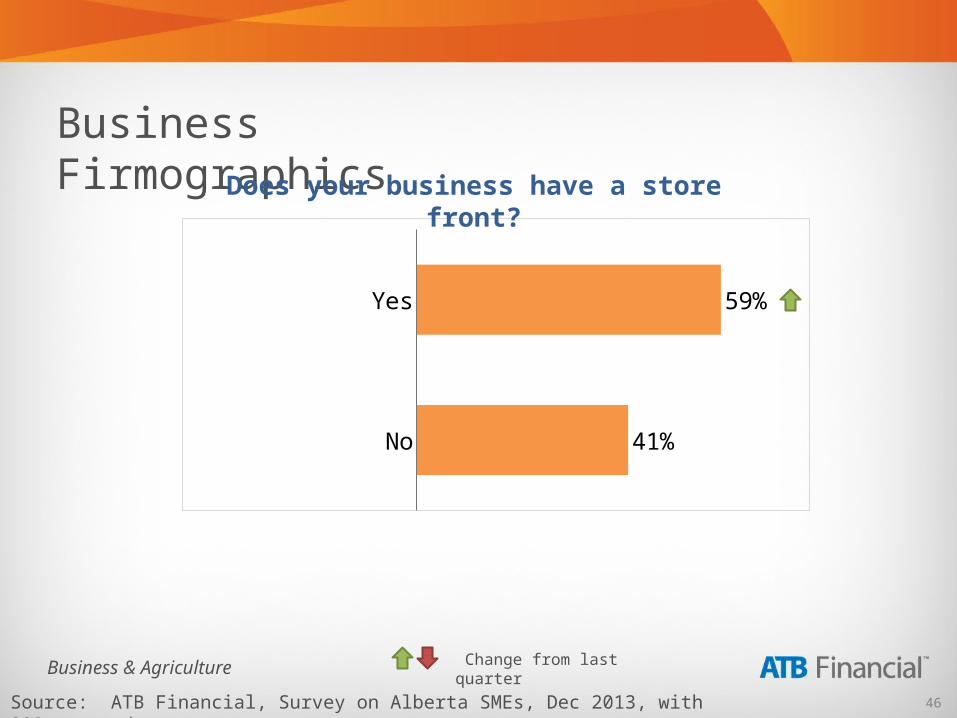
Business & Agriculture
Business Firmographics
Source: ATB Financial, Survey on Alberta SMEs, Dec 2013, with 300 respondents.
Yes
No
59%
41%
Does your business have a store front?
Change from last quarter
47
Business & Agriculture
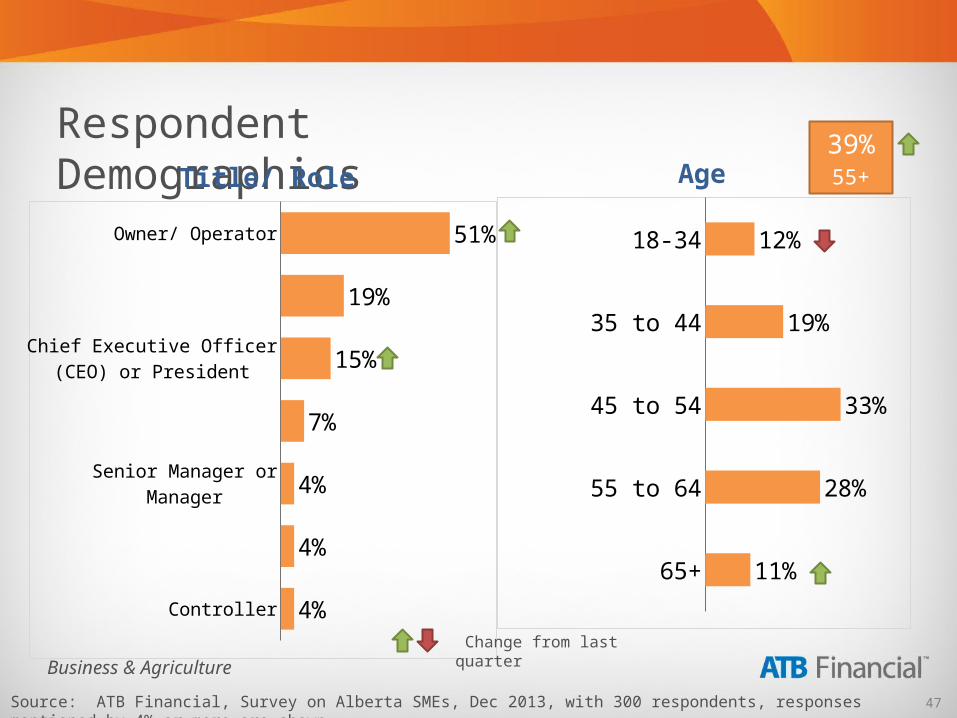
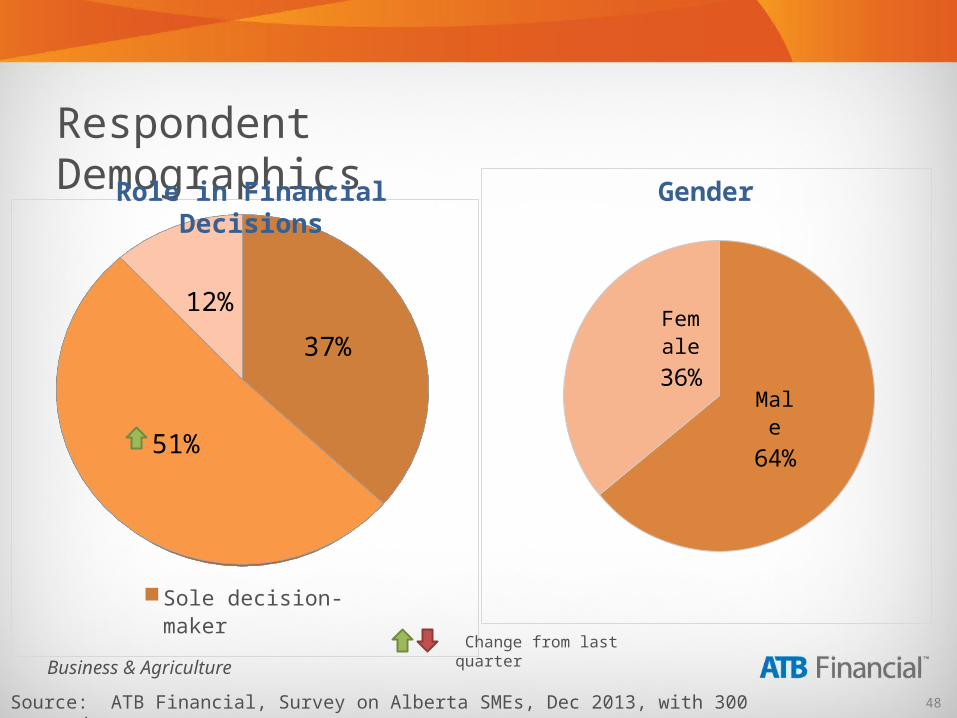
Respondent Demographics
Source: ATB Financial, Survey on Alberta SMEs, Dec 2013, with 300 respondents, responses mentioned by 4% or more are shown.
Owner/ Operator
General Manager (GM) or Office Manager
Chief Executive Officer (CEO) or President
Managing Director, Senior Director or Director
Senior Manager or Manager
Chief Financial Officer (CFO)
Controller
51%
19%
15%
7%
4%
4%
4%
18-34
35 to 44
45 to 54
55 to 64
65+
12%
19%
33%
28%
11%
39%55+Title/ Role Age
Change from last quarter
48
Business & Agriculture
Male64%
Female
36%
37%
51%
12%
Sole decision-makerShares responsibilityInfluences decisions
Respondent Demographics
Source: ATB Financial, Survey on Alberta SMEs, Dec 2013, with 300 respondents.
Role in Financial Decisions
Gender
Change from last quarter
49
Business & Agriculture