Embed Size (px)
Citation preview
1
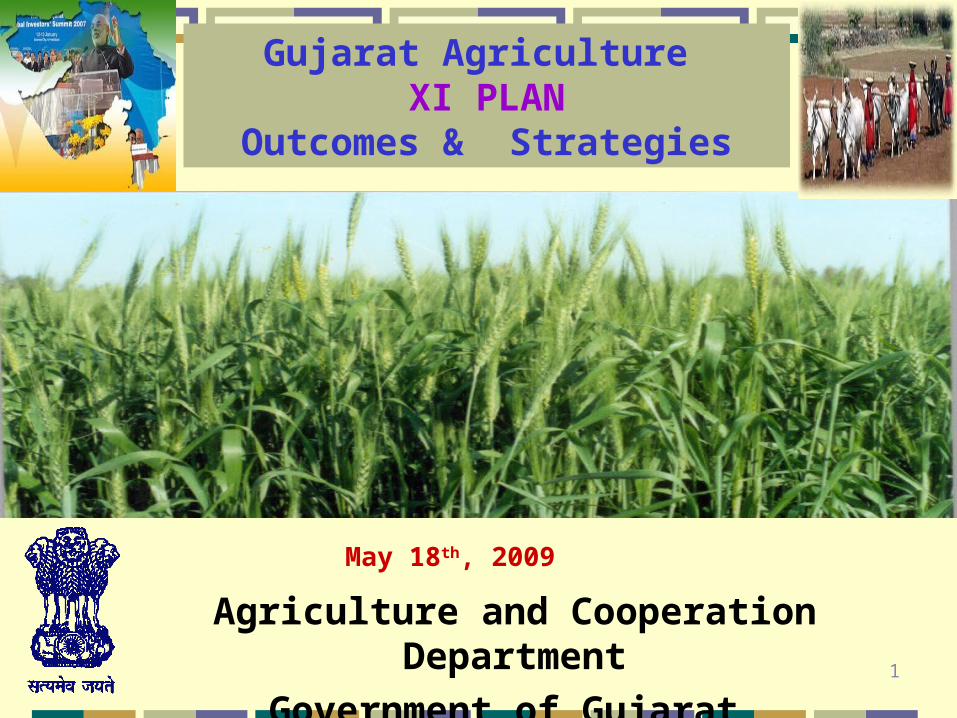
Agriculture and Cooperation Department
Government of Gujarat
Gujarat Agriculture XI PLAN
Outcomes & Strategies
May 18th, 2009

“One's destination is never a place but rather
a new way of looking at things.”
- Henry Miller
3
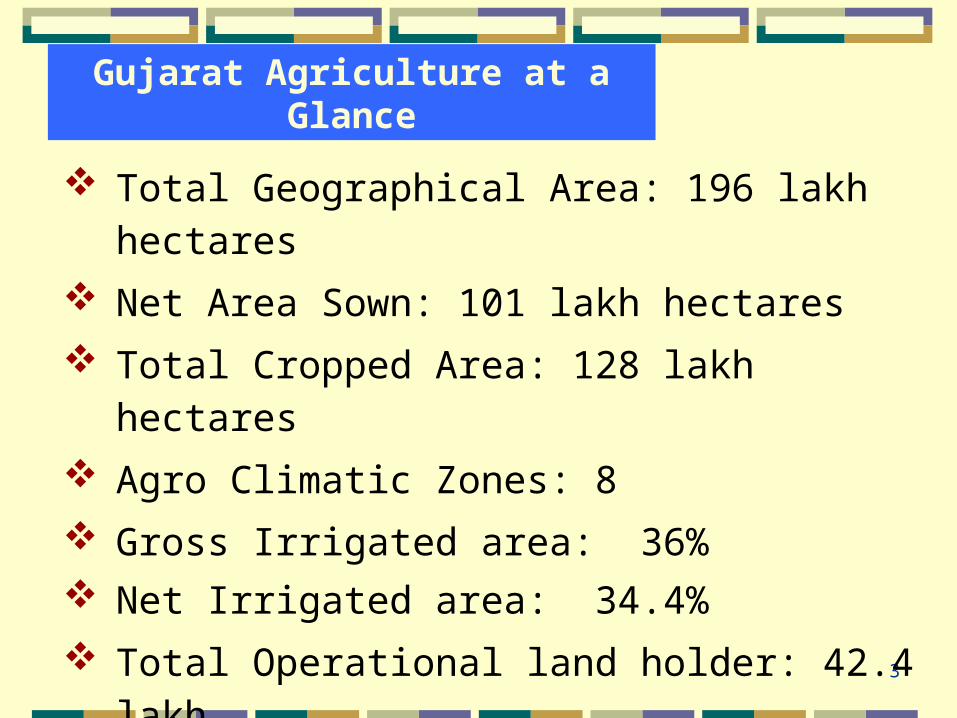
Total Geographical Area: 196 lakh hectares
Net Area Sown: 101 lakh hectares
Total Cropped Area: 128 lakh hectares
Agro Climatic Zones: 8
Gross Irrigated area: 36% Net Irrigated area: 34.4%
Total Operational land holder: 42.4 lakh
Average land holding: 2.33 ha
Gujarat Agriculture at a Glance
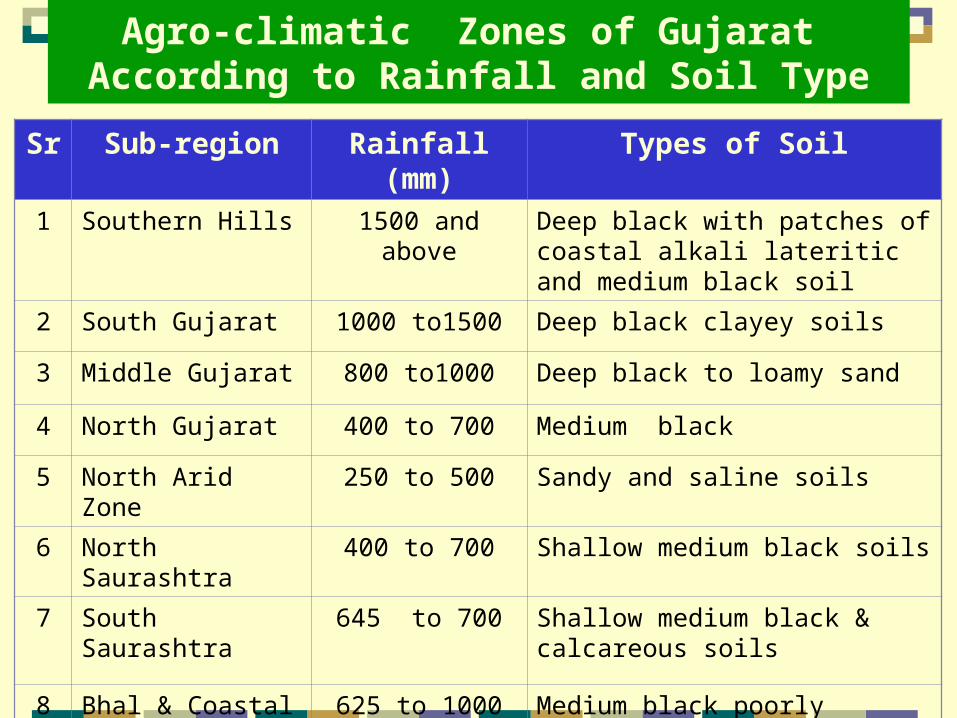
Agro-climatic Zones of Gujarat According to Rainfall and Soil Type
Sr Sub-region Rainfall (mm) Types of Soil
1 Southern Hills 1500 and above Deep black with patches of coastal alkali lateritic and medium black soil
2 South Gujarat 1000 to1500 Deep black clayey soils
3 Middle Gujarat 800 to1000 Deep black to loamy sand
4 North Gujarat 400 to 700 Medium black
5 North Arid Zone 250 to 500 Sandy and saline soils
6 North Saurashtra 400 to 700 Shallow medium black soils
7 South Saurashtra 645 to 700 Shallow medium black & calcareous soils
8 Bhal & Coastal Area 625 to 1000 Medium black poorly drained and saline soils
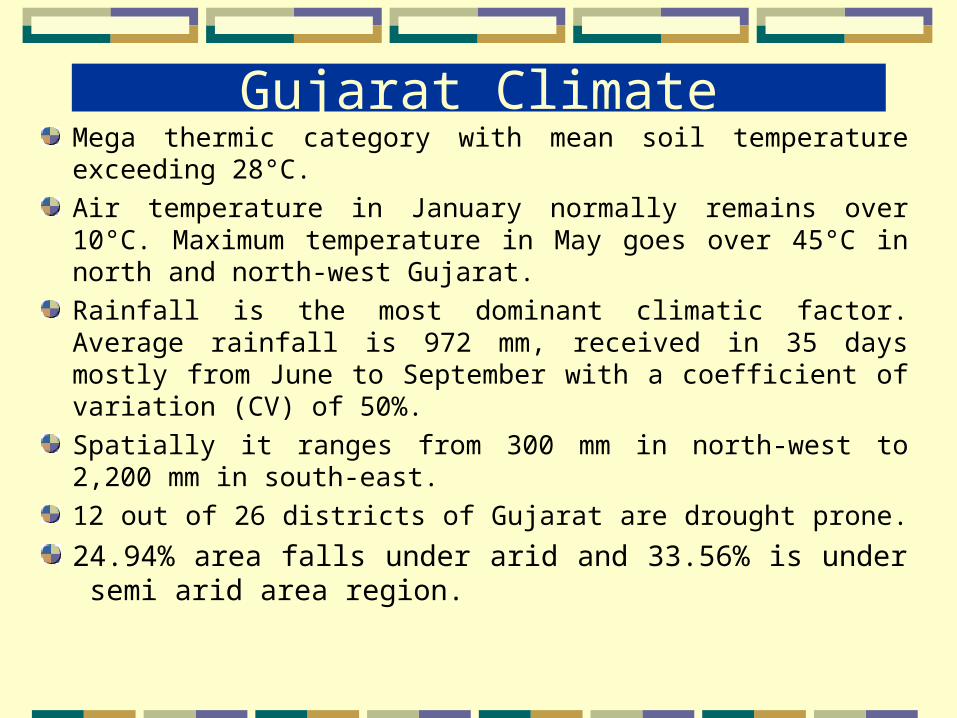
Gujarat ClimateMega thermic category with mean soil temperature exceeding 28°C.
Air temperature in January normally remains over 10°C. Maximum temperature in May goes over 45°C in north and north-west Gujarat.
Rainfall is the most dominant climatic factor. Average rainfall is 972 mm, received in 35 days mostly from June to September with a coefficient of variation (CV) of 50%.
Spatially it ranges from 300 mm in north-west to 2,200 mm in south-east.
12 out of 26 districts of Gujarat are drought prone.
24.94% area falls under arid and 33.56% is under semi arid area region.
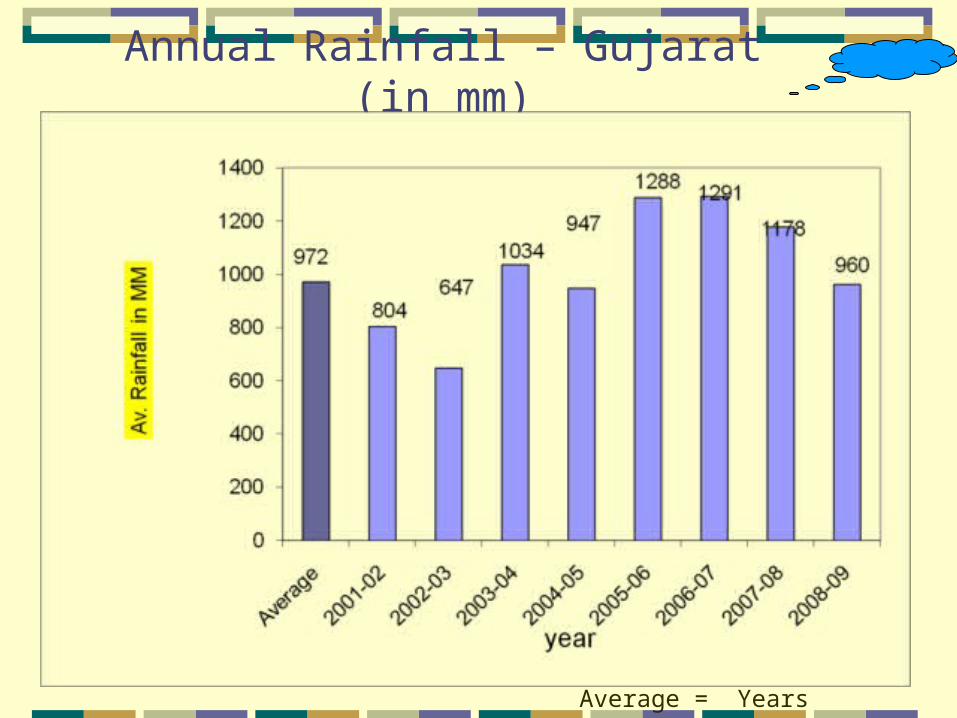
Annual Rainfall – Gujarat (in mm)
Average = Years 1998 to 2007
GUJARAT
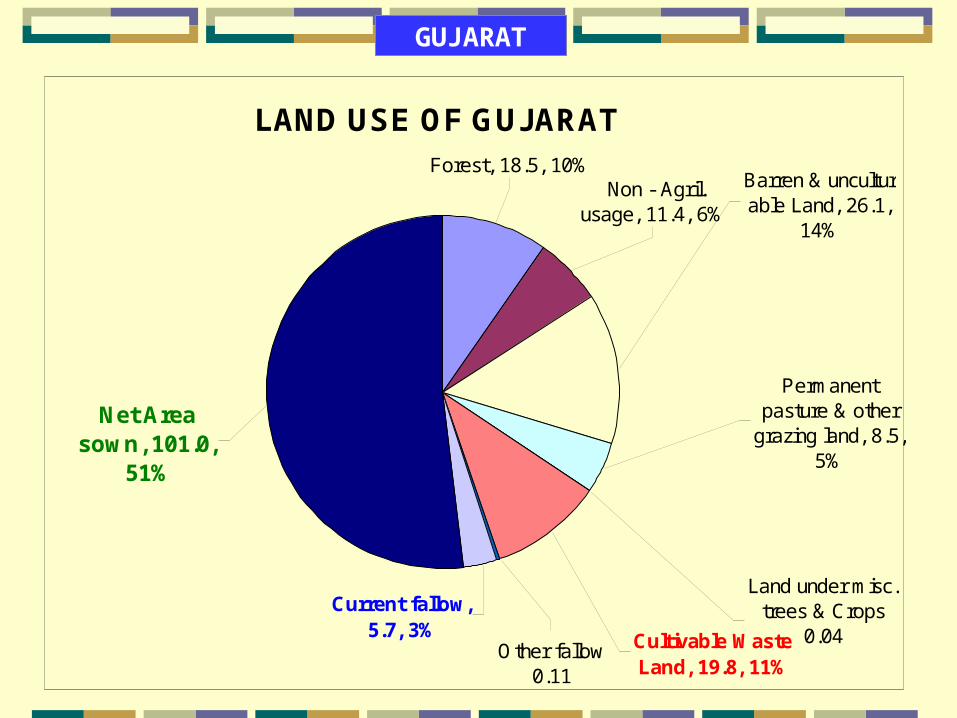
Area in lakh ha. LAND USE OF GUJARAT
Forest, 18.5, 10% Non - Agril.
usage, 11.4, 6%
Barren & uncultur able Land, 26.1,
14%
Permanent pasture & other
grazing land, 8.5, 5%
Land under misc. trees & Crops
0.04Cultivable Waste Land, 19.8, 11%
Other fallow0.11
Current fallow, 5.7, 3%
Net Area sown, 101.0,
51%
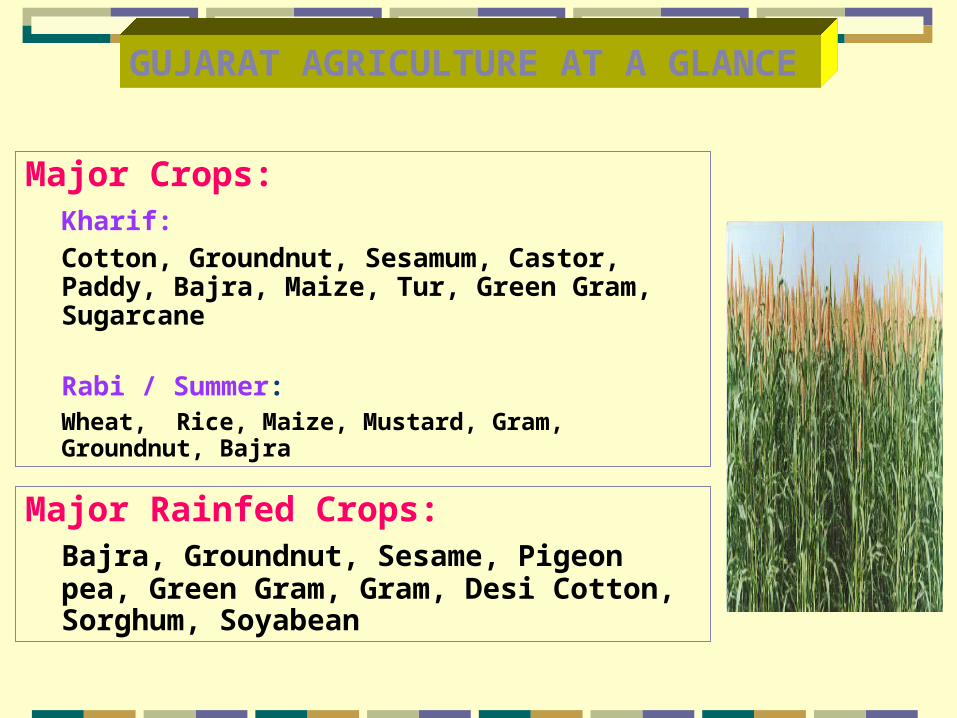
GUJARAT AGRICULTURE AT A GLANCE
Major Crops: Kharif:
Cotton, Groundnut, Sesamum, Castor, Paddy, Bajra, Maize, Tur, Green Gram, Sugarcane
Rabi / Summer: Wheat, Rice, Maize, Mustard, Gram, Groundnut, Bajra
Major Rainfed Crops: Bajra, Groundnut, Sesame, Pigeon pea, Green Gram, Gram, Desi Cotton, Sorghum, Soyabean
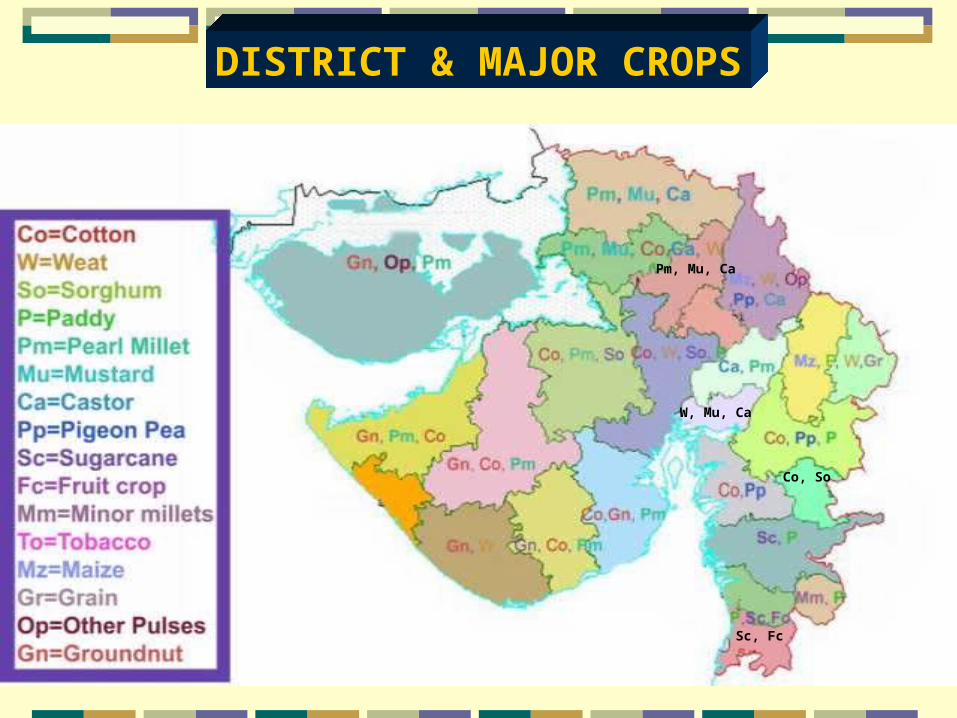
DISTRICT & MAJOR CROPS
Pm, Mu, Ca
W, Mu, Ca
Sc, Fc
Co, So
10
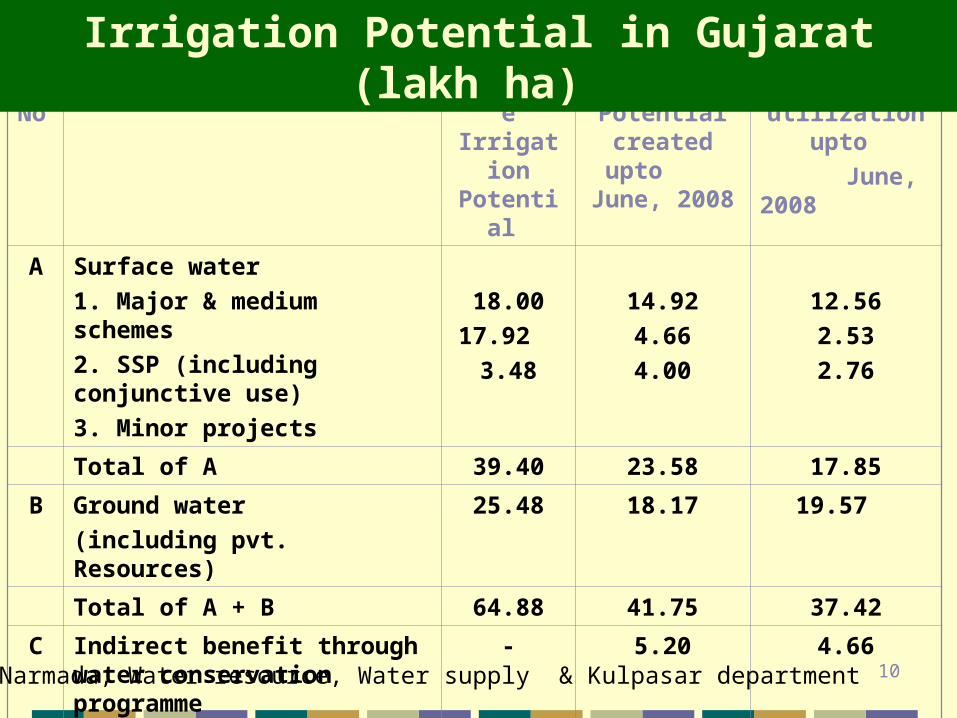
SrNo
Sources Ultimate Irrigation Potential
Irrigation Potential
created upto June, 2008
Maximum utilization upto
June, 2008
A Surface water
1. Major & medium schemes
2. SSP (including conjunctive use)
3. Minor projects
18.00
17.92
3.48
14.92
4.66
4.00
12.56
2.53
2.76
Total of A 39.40 23.58 17.85
B Ground water
(including pvt. Resources)
25.48 18.17 19.57
Total of A + B 64.88 41.75 37.42
C Indirect benefit through water conservation programme
- 5.20 4.66
TOTAL 64.88 46.95 42.08
Irrigation Potential in Gujarat (lakh ha)
Source: Narmada, Water resource, Water supply & Kulpasar department
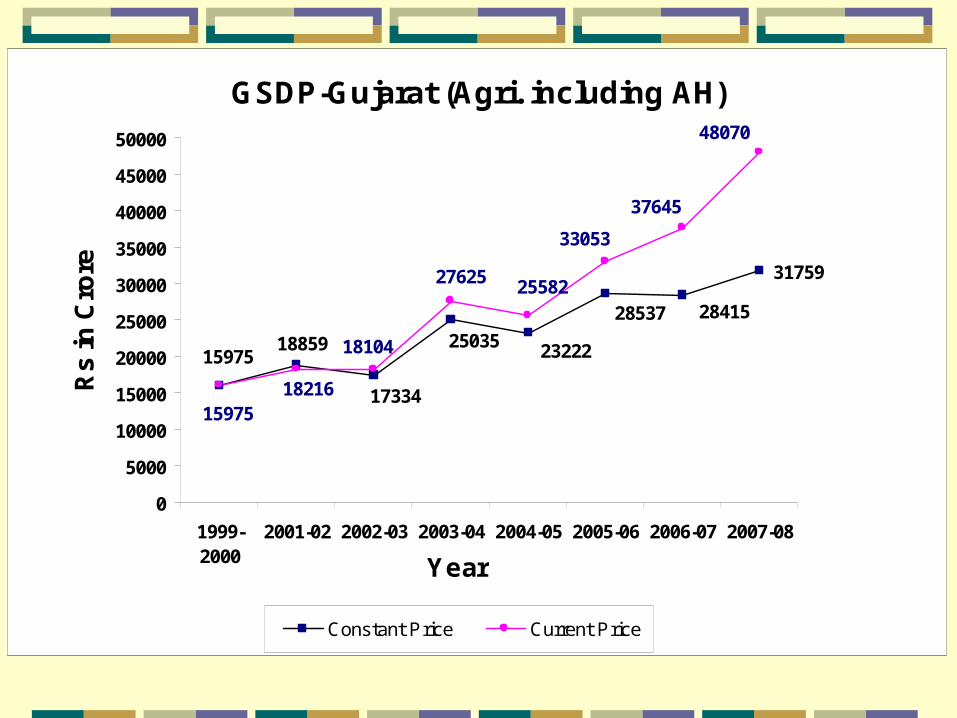
GSDP-Gujarat (Agri. including AH)
31759
18859
17334
15975
2841528537
25035 23222
18216
18104
15975
48070
37645
33053
2558227625
0
5000
10000
15000
20000
25000
30000
35000
40000
45000
50000
1999-2000
2001-02 2002-03 2003-04 2004-05 2005-06 2006-07 2007-08
Year
Rs
in C
rore
Constant Price Current Price
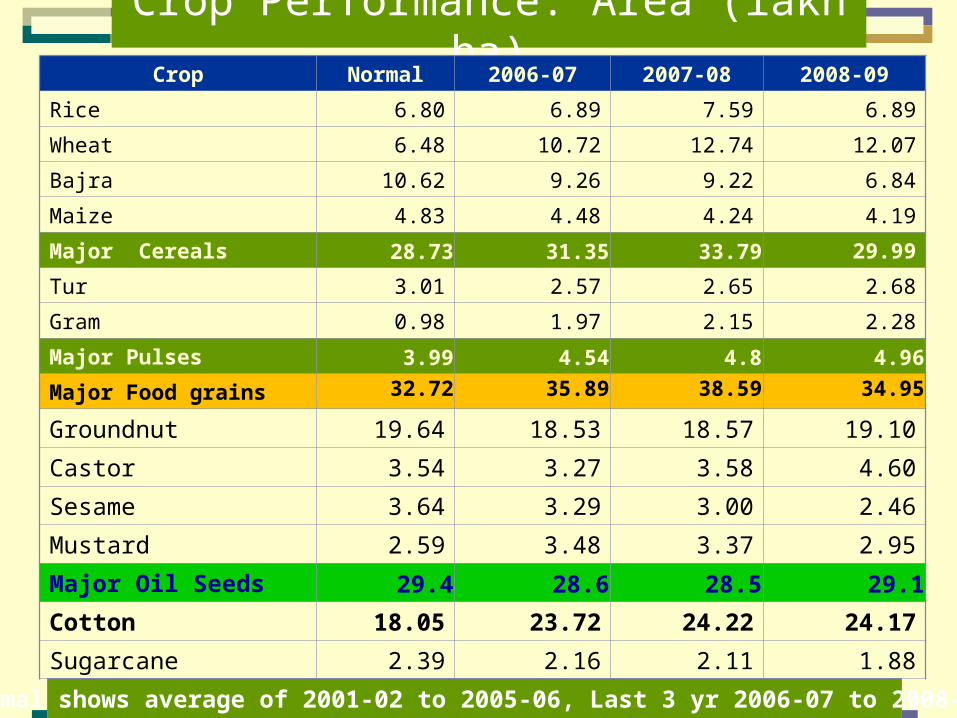
Crop Performance: Area (lakh ha)Crop Normal 2006-07 2007-08 2008-09
Rice 6.80 6.89 7.59 6.89
Wheat 6.48 10.72 12.74 12.07
Bajra 10.62 9.26 9.22 6.84
Maize 4.83 4.48 4.24 4.19
Major Cereals 28.73 31.35 33.79 29.99
Tur 3.01 2.57 2.65 2.68
Gram 0.98 1.97 2.15 2.28
Major Pulses 3.99 4.54 4.8 4.96
Major Food grains 32.72 35.89 38.59 34.95
Groundnut 19.64 18.53 18.57 19.10
Castor 3.54 3.27 3.58 4.60
Sesame 3.64 3.29 3.00 2.46
Mustard 2.59 3.48 3.37 2.95
Major Oil Seeds 29.4 28.6 28.5 29.1
Cotton 18.05 23.72 24.22 24.17
Sugarcane 2.39 2.16 2.11 1.88
Normal shows average of 2001-02 to 2005-06, Last 3 yr 2006-07 to 2008-09
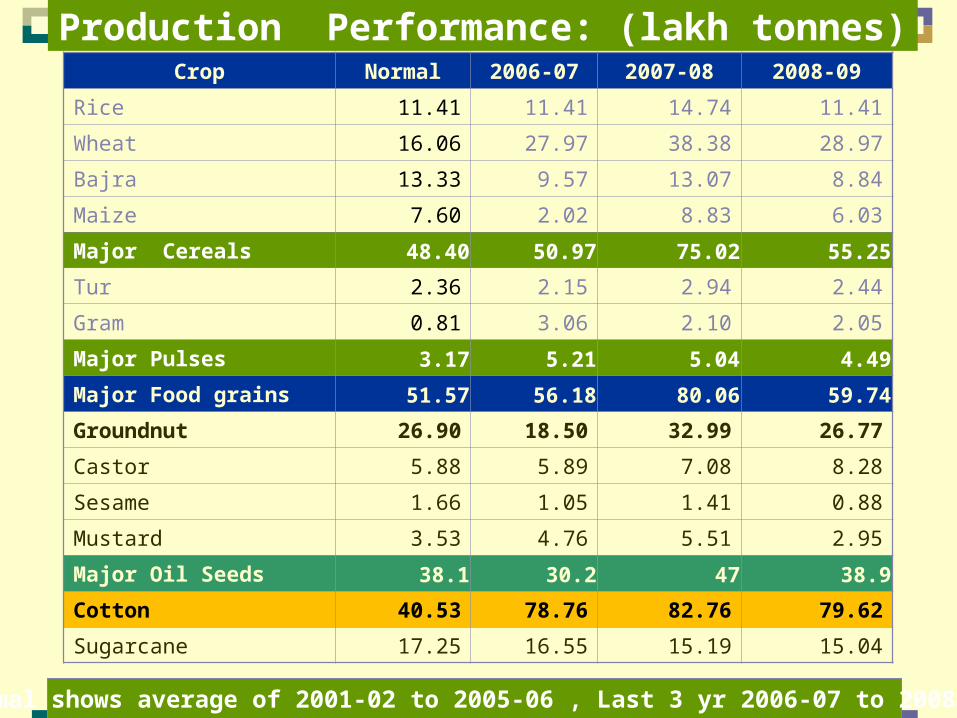
Production Performance: (lakh tonnes)Crop Normal 2006-07 2007-08 2008-09
Rice 11.41 11.41 14.74 11.41
Wheat 16.06 27.97 38.38 28.97
Bajra 13.33 9.57 13.07 8.84
Maize 7.60 2.02 8.83 6.03
Major Cereals 48.40 50.97 75.02 55.25
Tur 2.36 2.15 2.94 2.44
Gram 0.81 3.06 2.10 2.05
Major Pulses 3.17 5.21 5.04 4.49
Major Food grains 51.57 56.18 80.06 59.74
Groundnut 26.90 18.50 32.99 26.77
Castor 5.88 5.89 7.08 8.28
Sesame 1.66 1.05 1.41 0.88
Mustard 3.53 4.76 5.51 2.95
Major Oil Seeds 38.1 30.2 47 38.9
Cotton 40.53 78.76 82.76 79.62
Sugarcane 17.25 16.55 15.19 15.04
Normal shows average of 2001-02 to 2005-06 , Last 3 yr 2006-07 to 2008-09
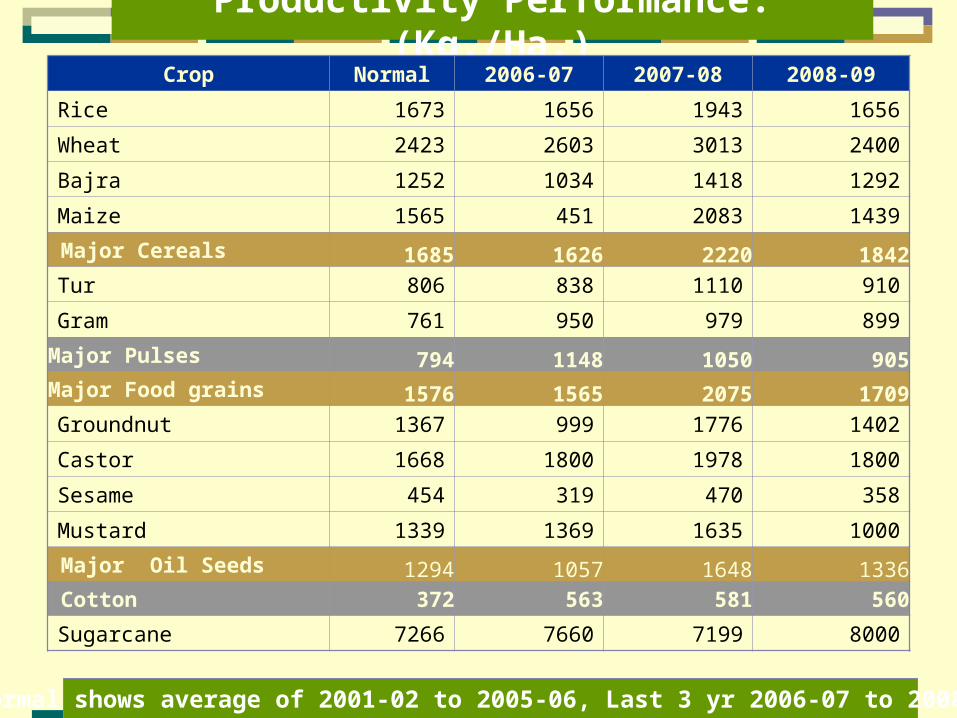
Productivity Performance: (Kg./Ha.)Crop Normal 2006-07 2007-08 2008-09
Rice 1673 1656 1943 1656
Wheat 2423 2603 3013 2400
Bajra 1252 1034 1418 1292
Maize 1565 451 2083 1439
Major Cereals 1685 1626 2220 1842
Tur 806 838 1110 910
Gram 761 950 979 899
Major Pulses 794 1148 1050 905Major Food grains 1576 1565 2075 1709
Groundnut 1367 999 1776 1402
Castor 1668 1800 1978 1800
Sesame 454 319 470 358
Mustard 1339 1369 1635 1000
Major Oil Seeds 1294 1057 1648 1336 Cotton 372 563 581 560
Sugarcane 7266 7660 7199 8000
Normal shows average of 2001-02 to 2005-06, Last 3 yr 2006-07 to 2008-09
Yield Gap Management
Yield Gap ManagementCrops Kg./
HaGraphical
View
Strategies
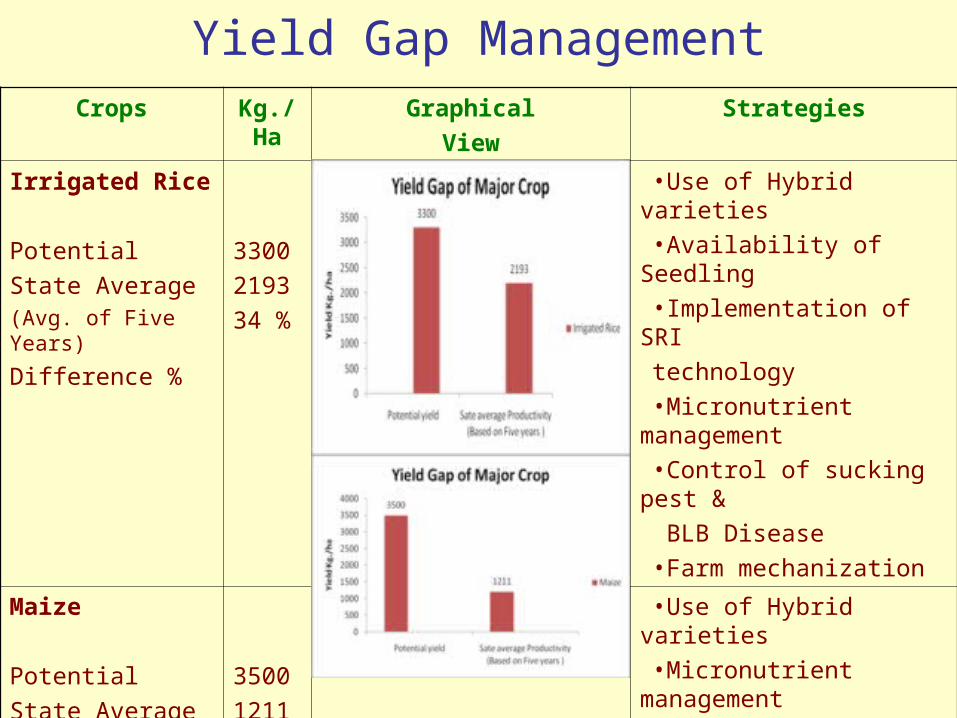
Irrigated Rice
Potential
State Average (Avg. of Five Years)
Difference %
3300
2193
34 %
•Use of Hybrid varieties
•Availability of Seedling
•Implementation of SRI
technology
•Micronutrient management
•Control of sucking pest &
BLB Disease
•Farm mechanization
Maize
Potential
State Average (Avg. of Five Years)
Difference %
3500
1211
65 %
•Use of Hybrid varieties
•Micronutrient management
•Dissemination of package
of practices in tribal pockets
Yield Gap ManagementCrops Kg./
HaGraphical
View
Strategies
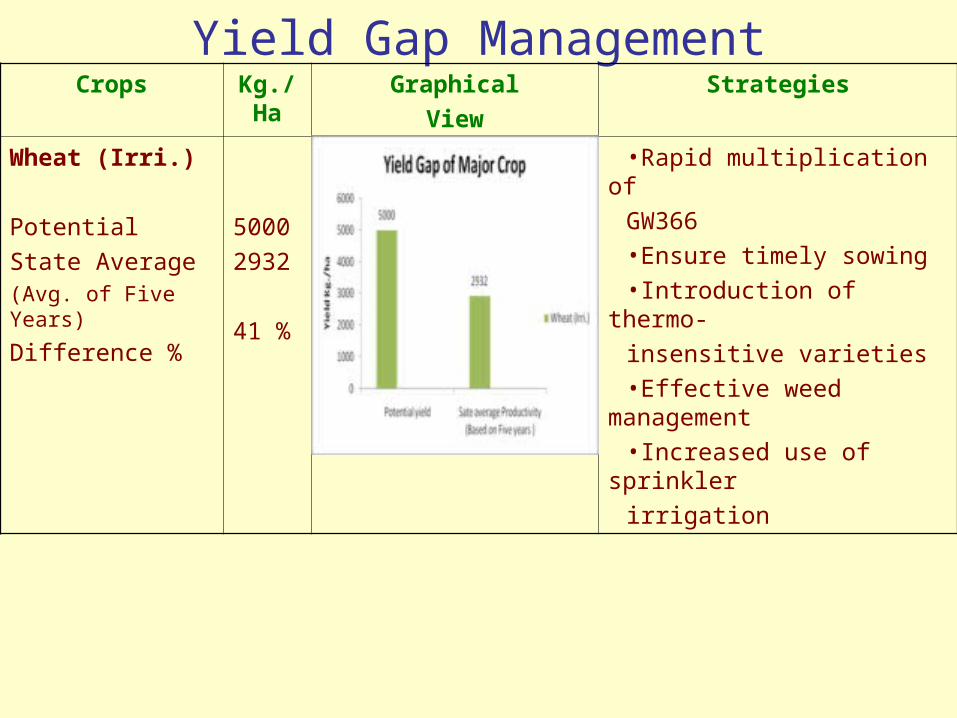
Wheat (Irri.)
Potential
State Average (Avg. of Five Years)
Difference %
5000
2932
41 %
•Rapid multiplication of
GW366
•Ensure timely sowing
•Introduction of thermo-
insensitive varieties
•Effective weed management
•Increased use of sprinkler
irrigation
Yield Gap ManagementCrops Kg./
HaGraphical
View
Strategies
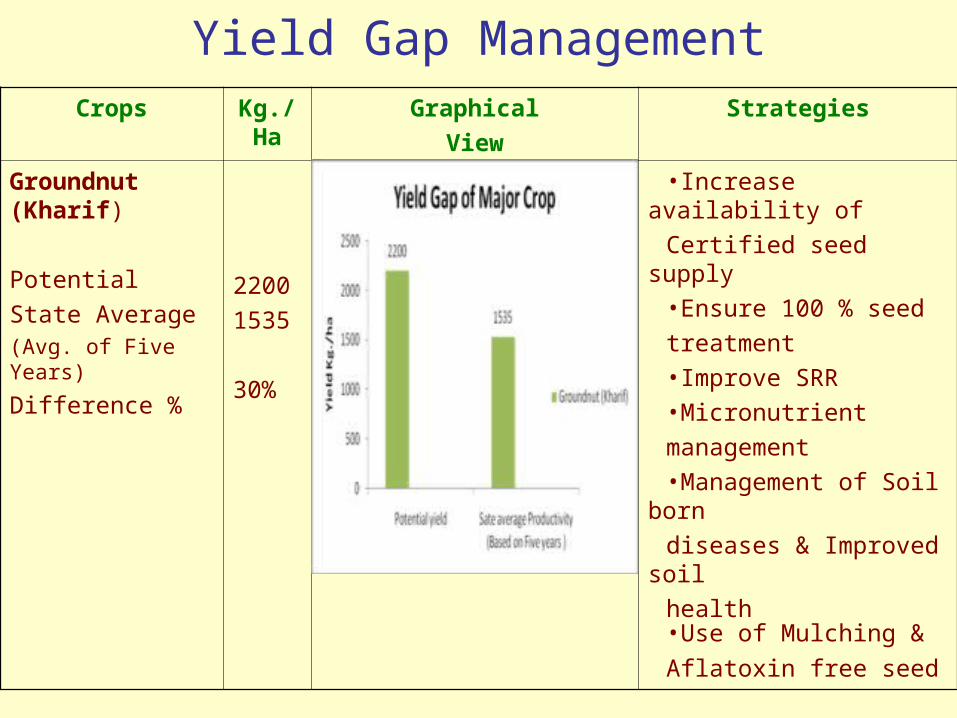
Groundnut (Kharif)
Potential
State Average (Avg. of Five Years)
Difference %
2200
1535
30%
•Increase availability of
Certified seed supply
•Ensure 100 % seed
treatment
•Improve SRR
•Micronutrient
management
•Management of Soil born
diseases & Improved soil
health •Use of Mulching &
Aflatoxin free seed
Yield Gap ManagementCrops Kg./
HaGraphical
View
Strategies
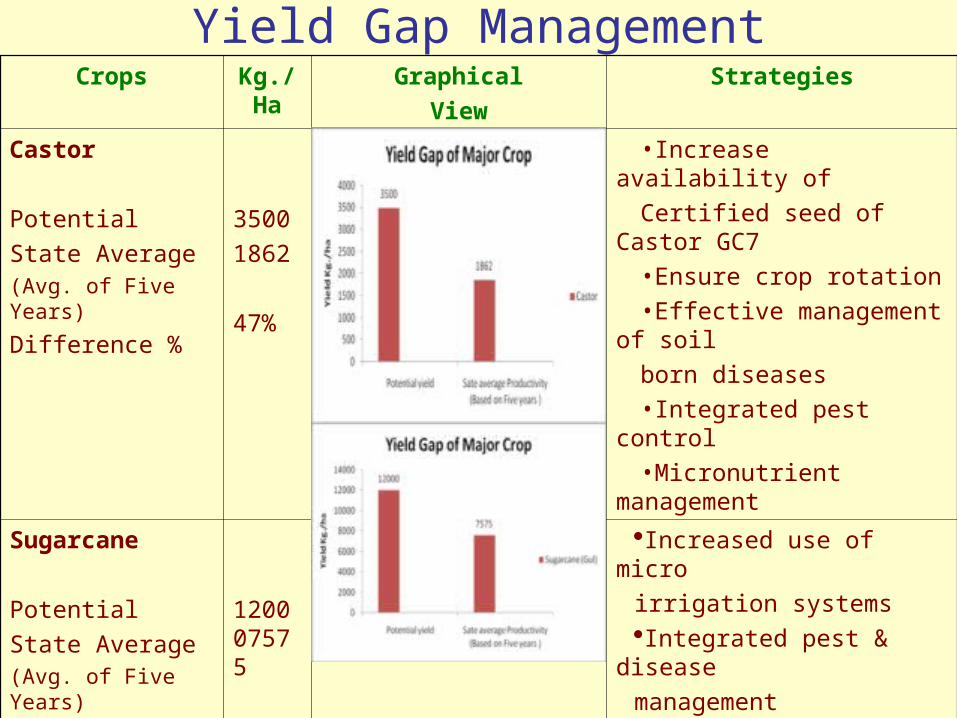
Castor
Potential
State Average (Avg. of Five Years)
Difference %
3500
1862
47%
•Increase availability of
Certified seed of Castor GC7
•Ensure crop rotation
•Effective management of soil
born diseases
•Integrated pest control
•Micronutrient management
Sugarcane
Potential
State Average (Avg. of Five Years)
Difference %
120007575
37%
Increased use of micro
irrigation systemsIntegrated pest & disease
management Improved soil healthMicronutrient management
Yield Gap ManagementCrops Kg./
HaGraphical
View
Strategies
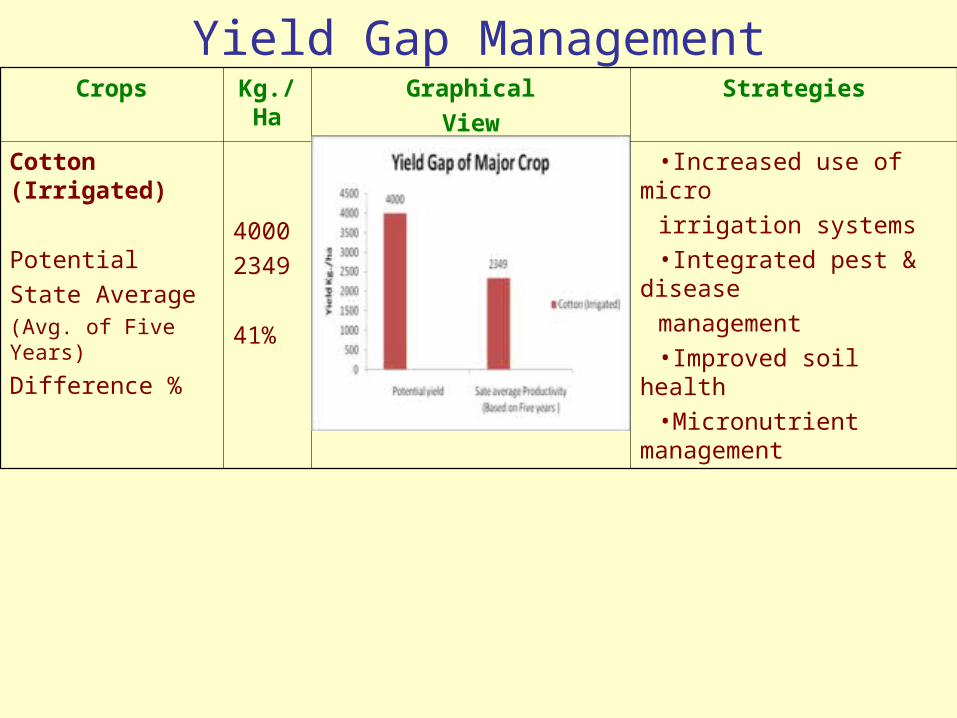
Cotton (Irrigated)
Potential
State Average (Avg. of Five Years)
Difference %
4000
2349
41%
•Increased use of micro
irrigation systems
•Integrated pest & disease
management
•Improved soil health
•Micronutrient management
Yield Gap ManagementCrops Kg./
HaGraphical
View
Strategies
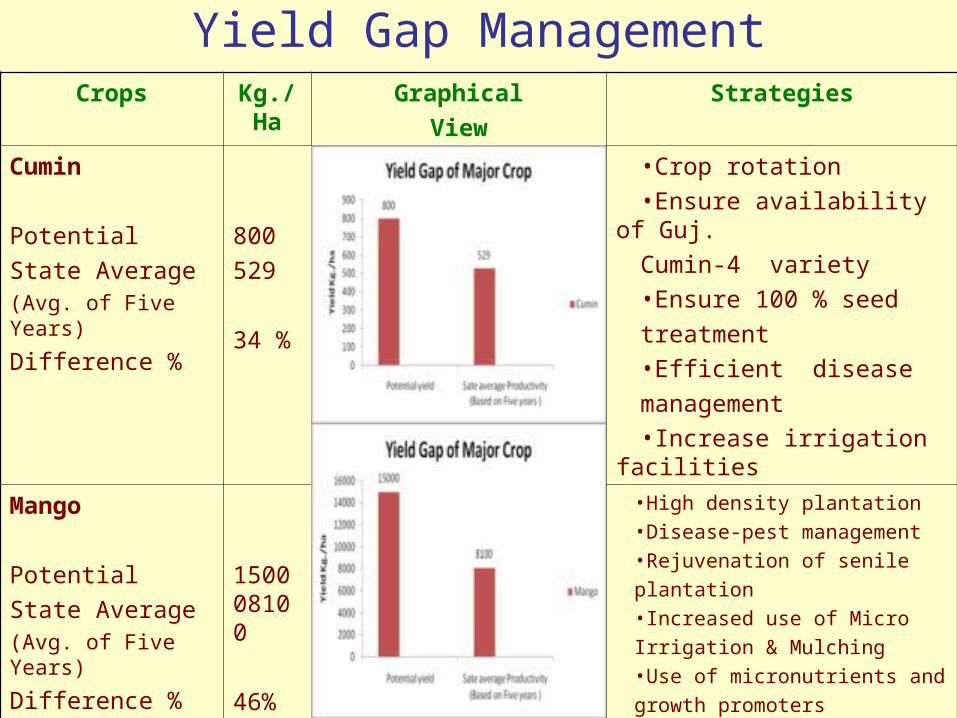
Cumin
Potential
State Average (Avg. of Five Years)
Difference %
800
529
34 %
•Crop rotation
•Ensure availability of Guj.
Cumin-4 variety
•Ensure 100 % seed
treatment
•Efficient disease
management
•Increase irrigation facilities
Mango
Potential
State Average (Avg. of Five Years)
Difference %
150008100
46%
•High density plantation•Disease-pest management•Rejuvenation of senile
plantation•Increased use of Micro
Irrigation & Mulching •Use of micronutrients and
growth promoters •Better post harvest
Management
Yield Gap ManagementCrops Kg./ Ha Graphical
View
Strategies
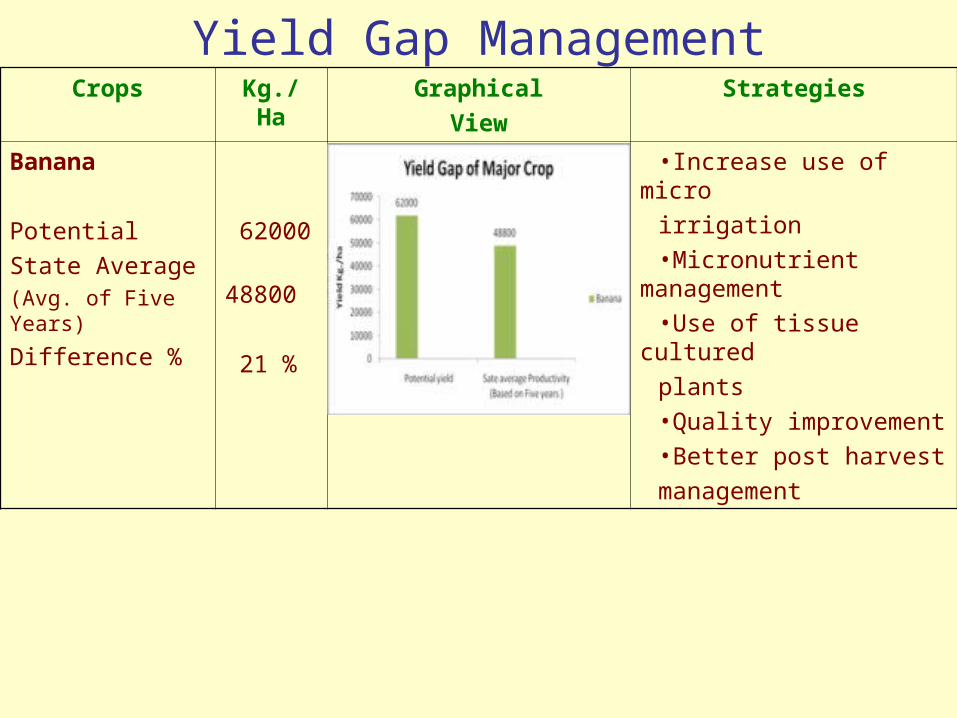
Banana
Potential
State Average (Avg. of Five Years)
Difference %
62000
48800
21 %
•Increase use of micro
irrigation
•Micronutrient management
•Use of tissue cultured
plants
•Quality improvement
•Better post harvest
management
Production increase @ 6 %Area increase @ 3 %
Productivity increase @ 7 %
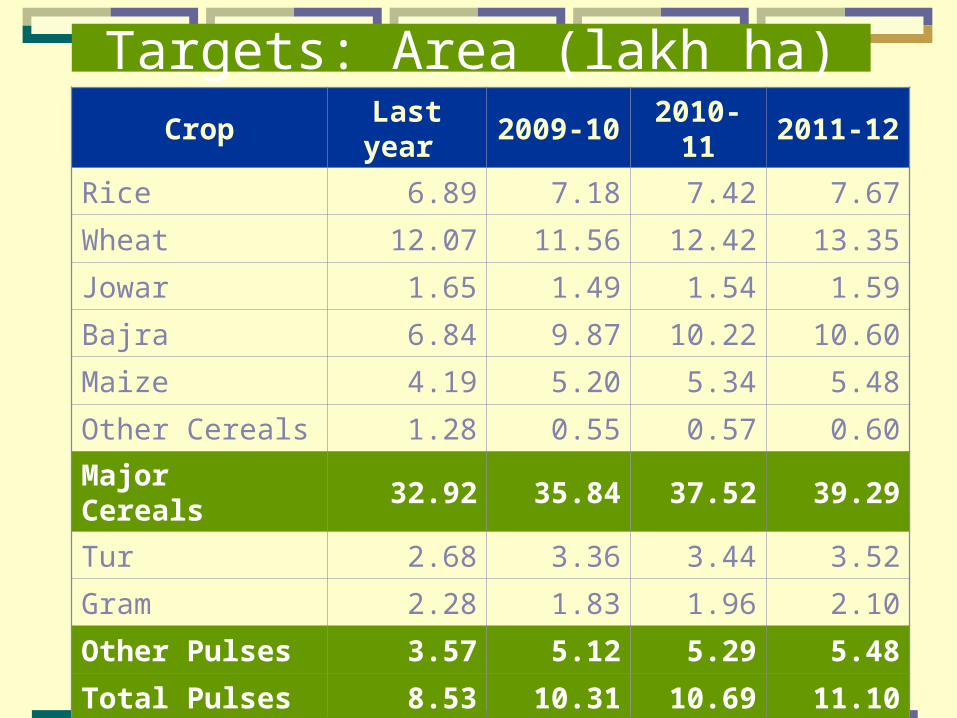
Targets: Area (lakh ha)Crop Last year 2009-10 2010-11 2011-12
Rice 6.89 7.18 7.42 7.67
Wheat 12.07 11.56 12.42 13.35
Jowar 1.65 1.49 1.54 1.59
Bajra 6.84 9.87 10.22 10.60
Maize 4.19 5.20 5.34 5.48
Other Cereals 1.28 0.55 0.57 0.60
Major Cereals 32.92 35.84 37.52 39.29
Tur 2.68 3.36 3.44 3.52
Gram 2.28 1.83 1.96 2.10
Other Pulses 3.57 5.12 5.29 5.48
Total Pulses 8.53 10.31 10.69 11.10
Total Food grains 41.45 46.15 48.21 50.39
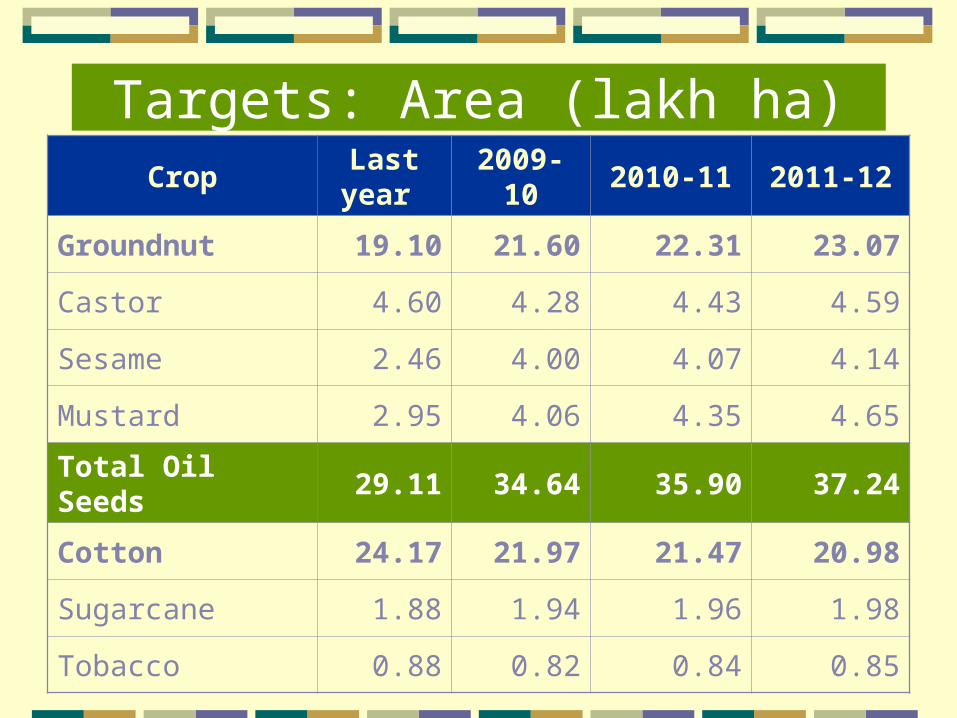
Targets: Area (lakh ha)Crop
Last year
2009-10 2010-11 2011-12
Groundnut 19.10 21.60 22.31 23.07
Castor 4.60 4.28 4.43 4.59
Sesame 2.46 4.00 4.07 4.14
Mustard 2.95 4.06 4.35 4.65
Total Oil Seeds 29.11 34.64 35.90 37.24
Cotton 24.17 21.97 21.47 20.98
Sugarcane 1.88 1.94 1.96 1.98
Tobacco 0.88 0.82 0.84 0.85
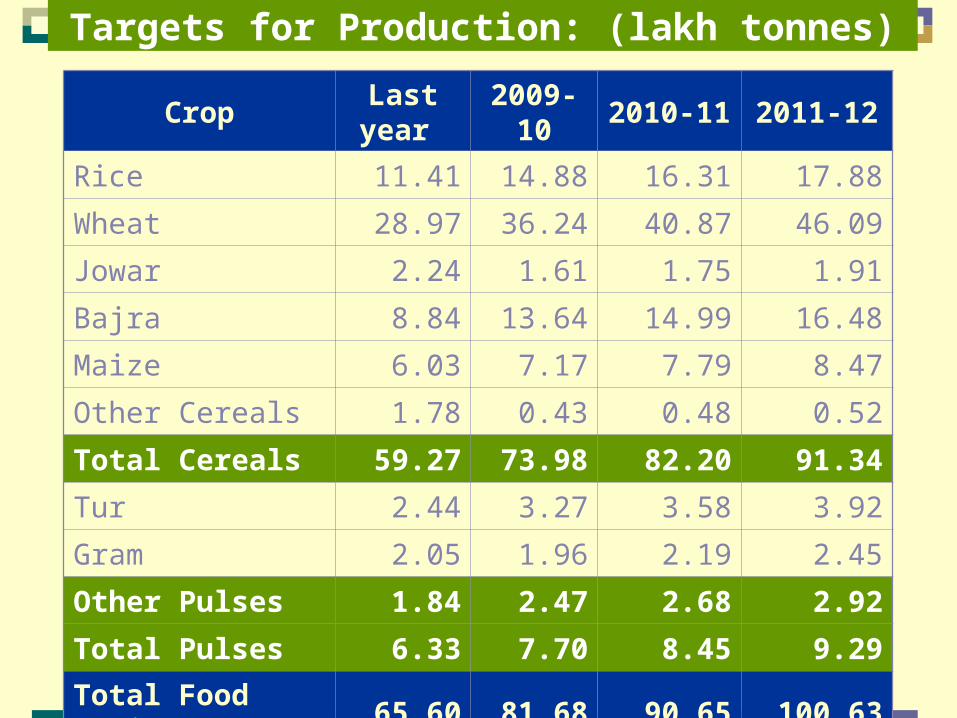
Targets for Production: (lakh tonnes)
CropLast year
2009-10 2010-11 2011-12
Rice 11.41 14.88 16.31 17.88
Wheat 28.97 36.24 40.87 46.09
Jowar 2.24 1.61 1.75 1.91
Bajra 8.84 13.64 14.99 16.48
Maize 6.03 7.17 7.79 8.47
Other Cereals 1.78 0.43 0.48 0.52
Total Cereals 59.27 73.98 82.20 91.34
Tur 2.44 3.27 3.58 3.92
Gram 2.05 1.96 2.19 2.45
Other Pulses 1.84 2.47 2.68 2.92
Total Pulses 6.33 7.70 8.45 9.29
Total Food grains 65.60 81.68 90.65 100.63
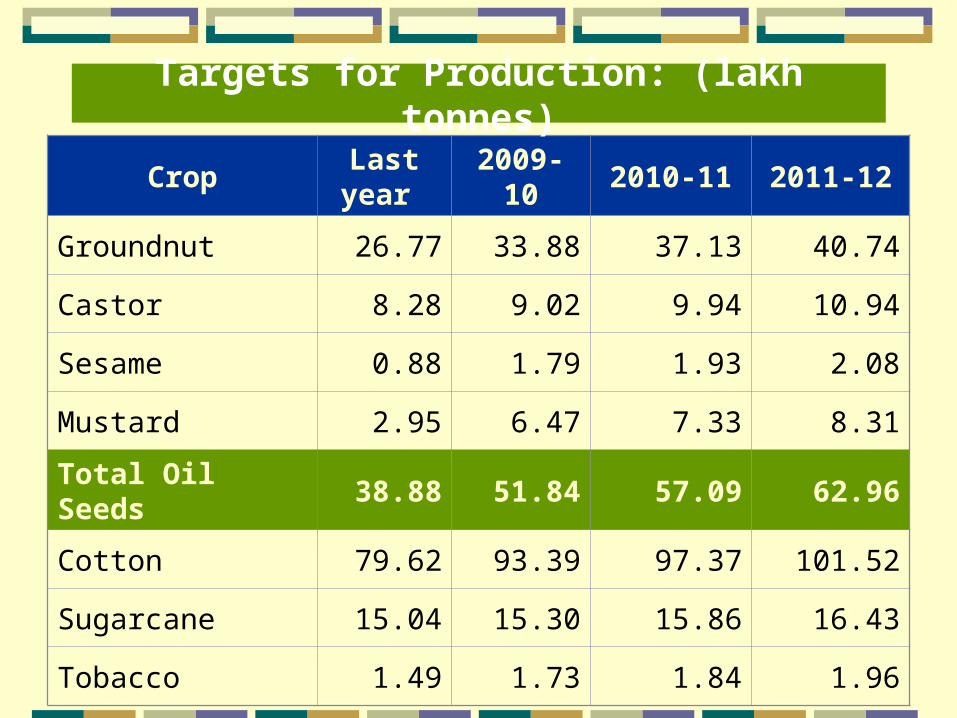
CropLast year
2009-10 2010-11 2011-12
Groundnut 26.77 33.88 37.13 40.74
Castor 8.28 9.02 9.94 10.94
Sesame 0.88 1.79 1.93 2.08
Mustard 2.95 6.47 7.33 8.31
Total Oil Seeds 38.88 51.84 57.09 62.96
Cotton 79.62 93.39 97.37 101.52
Sugarcane 15.04 15.30 15.86 16.43
Tobacco 1.49 1.73 1.84 1.96
Targets for Production: (lakh tonnes)
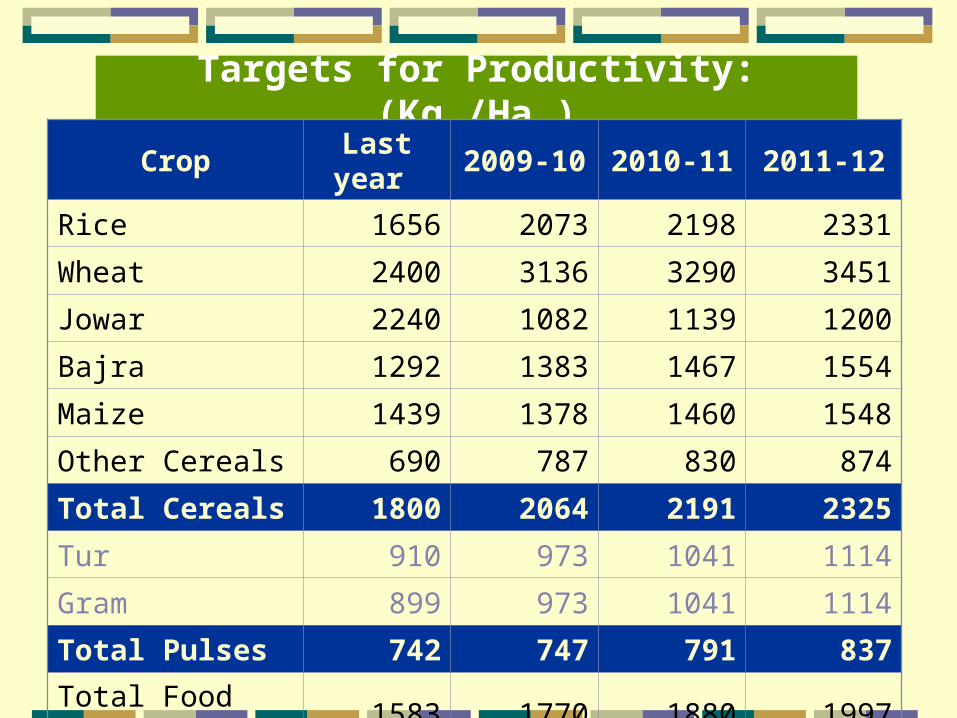
Targets for Productivity: (Kg./Ha.)Crop Last year 2009-10 2010-11 2011-12
Rice 1656 2073 2198 2331
Wheat 2400 3136 3290 3451
Jowar 2240 1082 1139 1200
Bajra 1292 1383 1467 1554
Maize 1439 1378 1460 1548
Other Cereals 690 787 830 874
Total Cereals 1800 2064 2191 2325
Tur 910 973 1041 1114
Gram 899 973 1041 1114
Total Pulses 742 747 791 837
Total Food grains 1583 1770 1880 1997
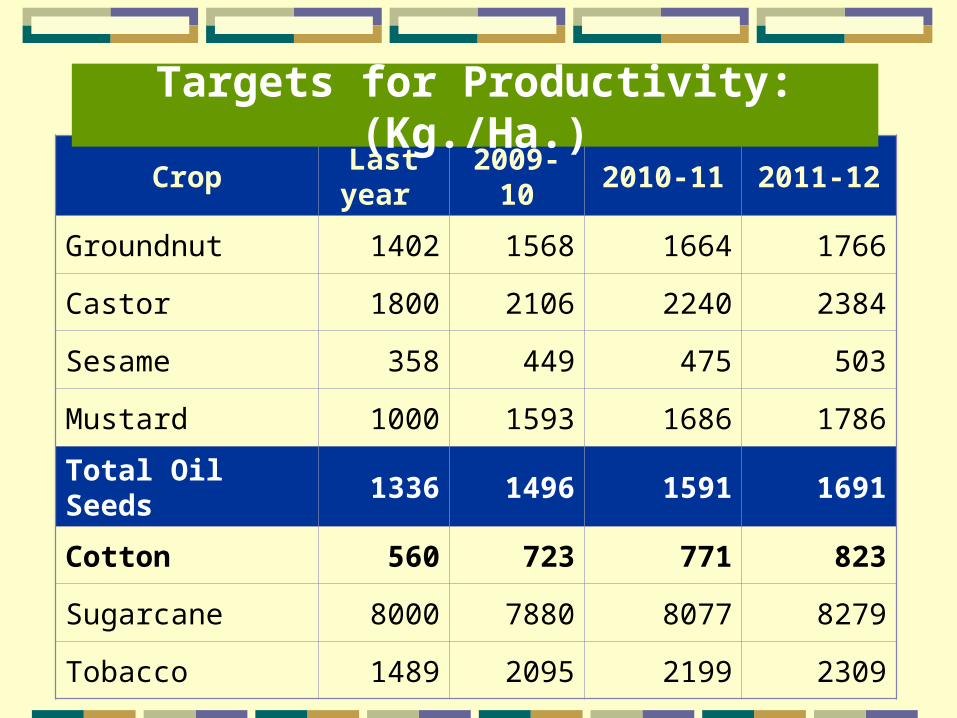
CropLast year
2009-10 2010-11 2011-12
Groundnut 1402 1568 1664 1766
Castor 1800 2106 2240 2384
Sesame 358 449 475 503
Mustard 1000 1593 1686 1786
Total Oil Seeds 1336 1496 1591 1691
Cotton 560 723 771 823
Sugarcane 8000 7880 8077 8279
Tobacco 1489 2095 2199 2309
Targets for Productivity: (Kg./Ha.)
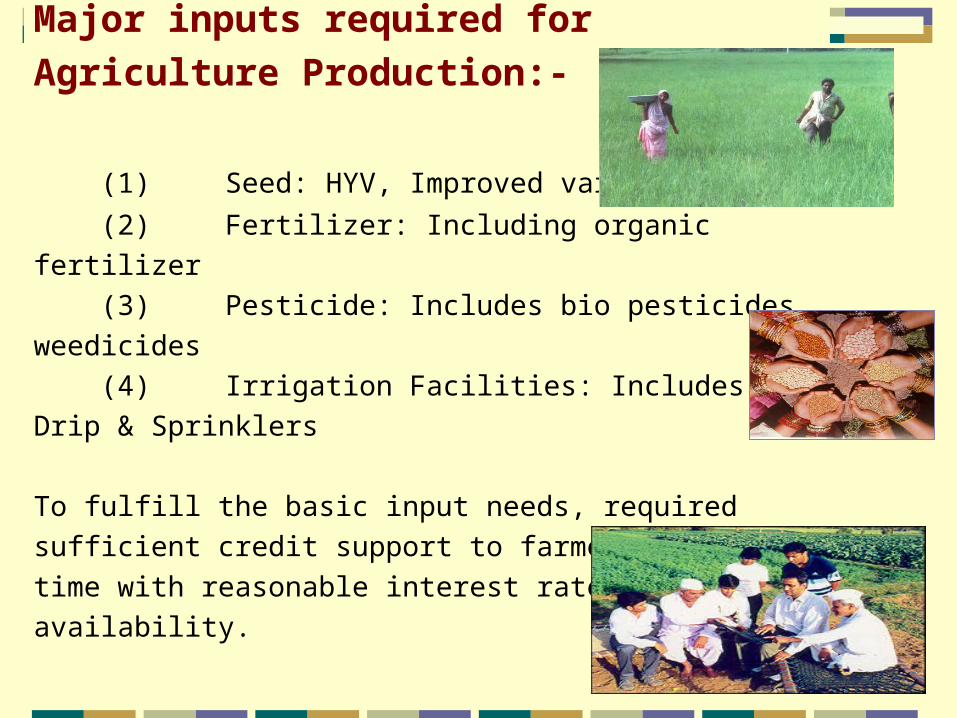
Major inputs required for
Agriculture Production:-
(1) Seed: HYV, Improved variety
(2) Fertilizer: Including organic fertilizer
(3) Pesticide: Includes bio pesticides, weedicides
(4) Irrigation Facilities: Includes Drip & Sprinklers
To fulfill the basic input needs, required sufficient credit support to
farmers at proper time with reasonable interest rate and easy
availability.
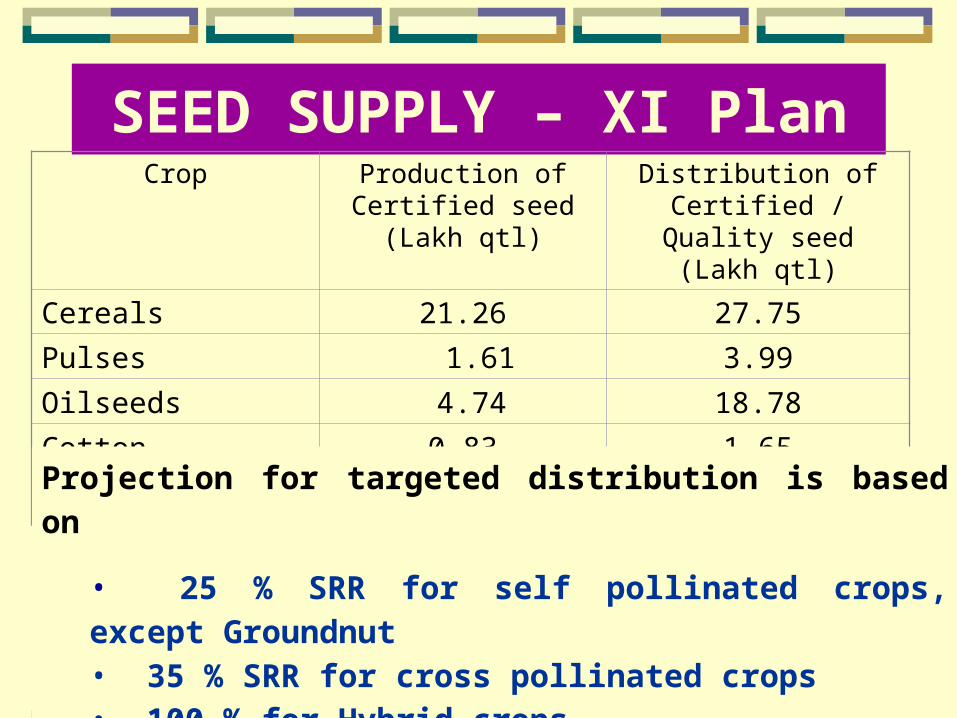
SEED SUPPLY – XI PlanCrop Production of Certified
seed (Lakh qtl)Distribution of Certified / Quality seed (Lakh qtl)
Cereals 21.26 27.75
Pulses 1.61 3.99
Oilseeds 4.74 18.78
Cotton 0.83 1.65
Total 28.44 52.17
Projection for targeted distribution is based on
• 25 % SRR for self pollinated crops, except Groundnut• 35 % SRR for cross pollinated crops • 100 % for Hybrid crops
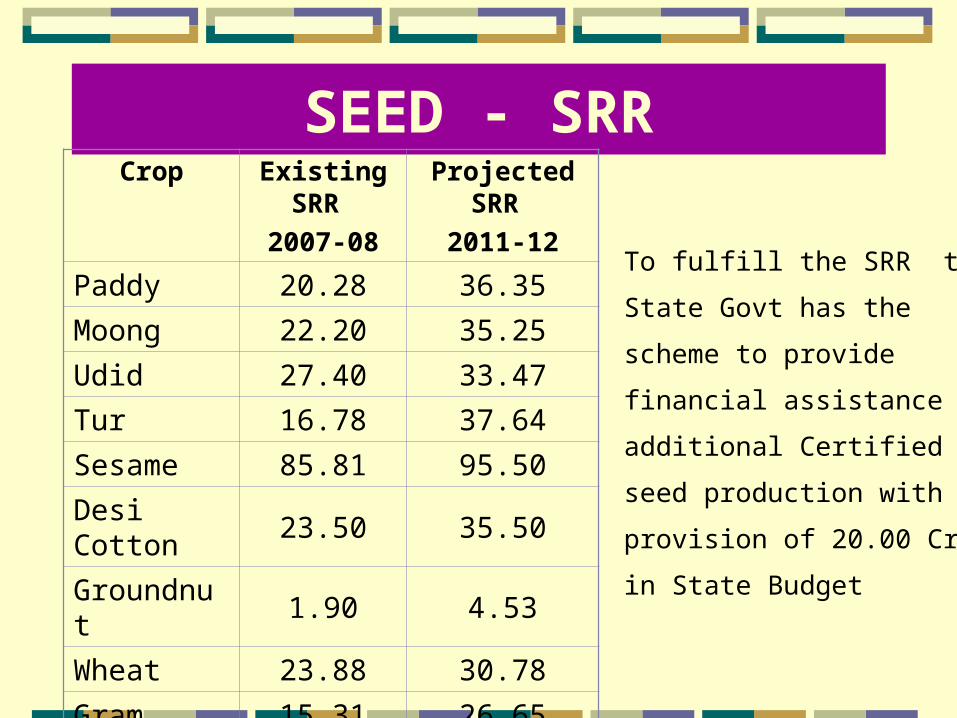
SEED - SRRCrop Existing
SRR
2007-08
Projected SRR
2011-12
Paddy 20.28 36.35
Moong 22.20 35.25
Udid 27.40 33.47
Tur 16.78 37.64
Sesame 85.81 95.50
Desi Cotton 23.50 35.50
Groundnut 1.90 4.53
Wheat 23.88 30.78
Gram 15.31 26.65
Mustard 70.38 90.00
To fulfill the SRR target,
State Govt has the
scheme to provide
financial assistance on
additional Certified
seed production with
provision of 20.00 Crores
in State Budget
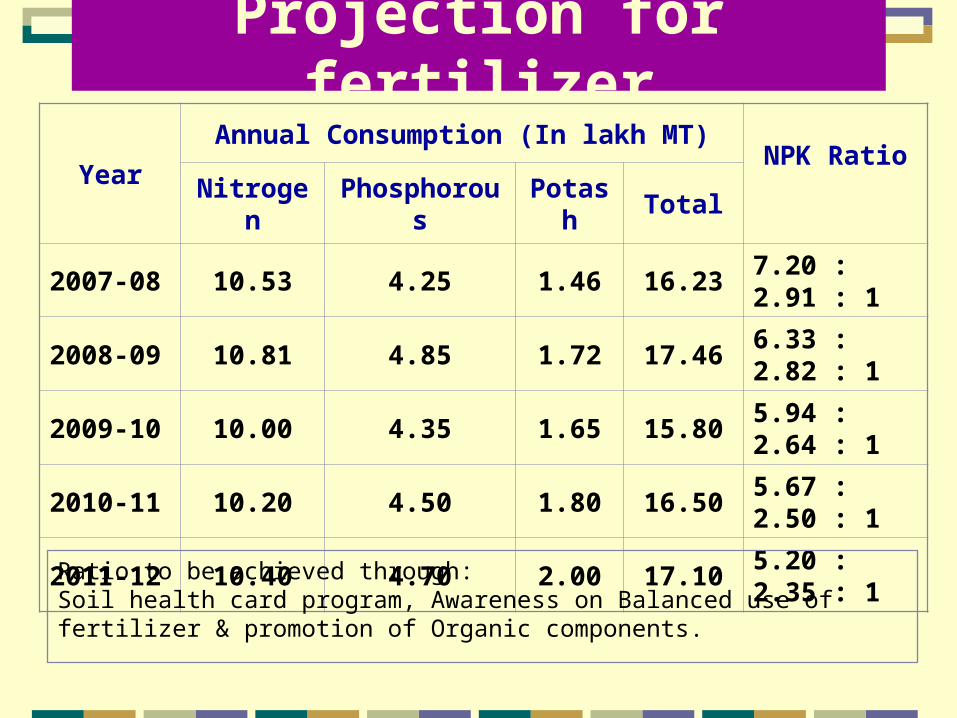
Projection for fertilizer
Year
Annual Consumption (In lakh MT)NPK Ratio
Nitrogen Phosphorous Potash Total
2007-08 10.53 4.25 1.46 16.23 7.20 : 2.91 : 1
2008-09 10.81 4.85 1.72 17.46 6.33 : 2.82 : 1
2009-10 10.00 4.35 1.65 15.80 5.94 : 2.64 : 1
2010-11 10.20 4.50 1.80 16.50 5.67 : 2.50 : 1
2011-12 10.40 4.70 2.00 17.10 5.20 : 2.35 : 1
Ratio to be achieved through:Soil health card program, Awareness on Balanced use of fertilizer & promotion of Organic components.
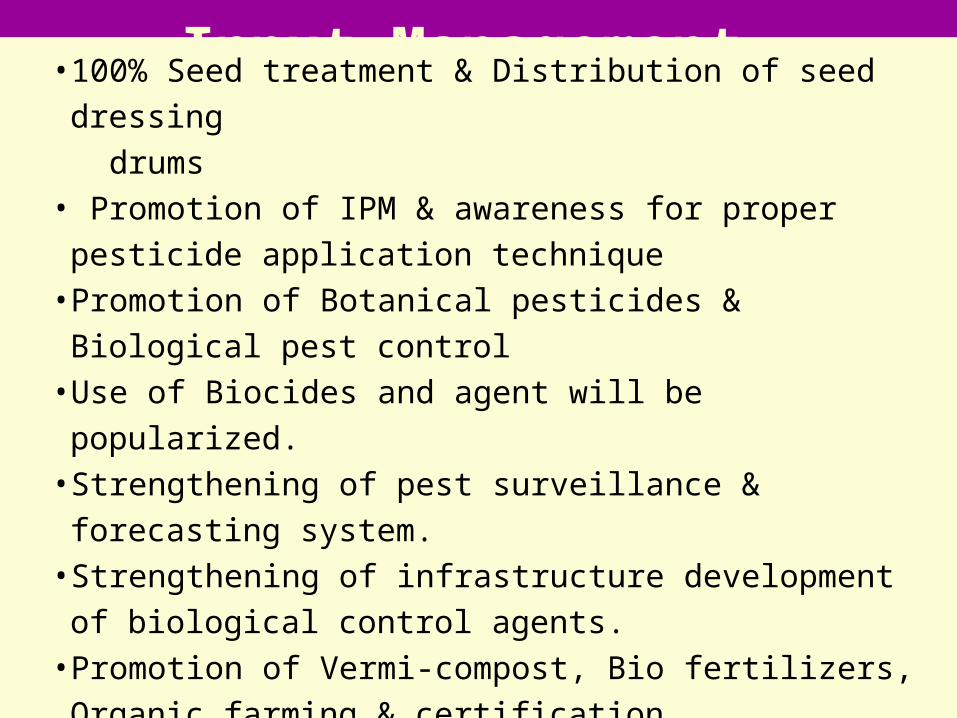
Input Management
• 100% Seed treatment & Distribution of seed dressing
drums • Promotion of IPM & awareness for proper pesticide
application technique • Promotion of Botanical pesticides & Biological pest control • Use of Biocides and agent will be popularized.• Strengthening of pest surveillance & forecasting system.• Strengthening of infrastructure development of biological
control agents.• Promotion of Vermi-compost, Bio fertilizers, Organic farming
& certification• Strengthening of Quality control laboratories
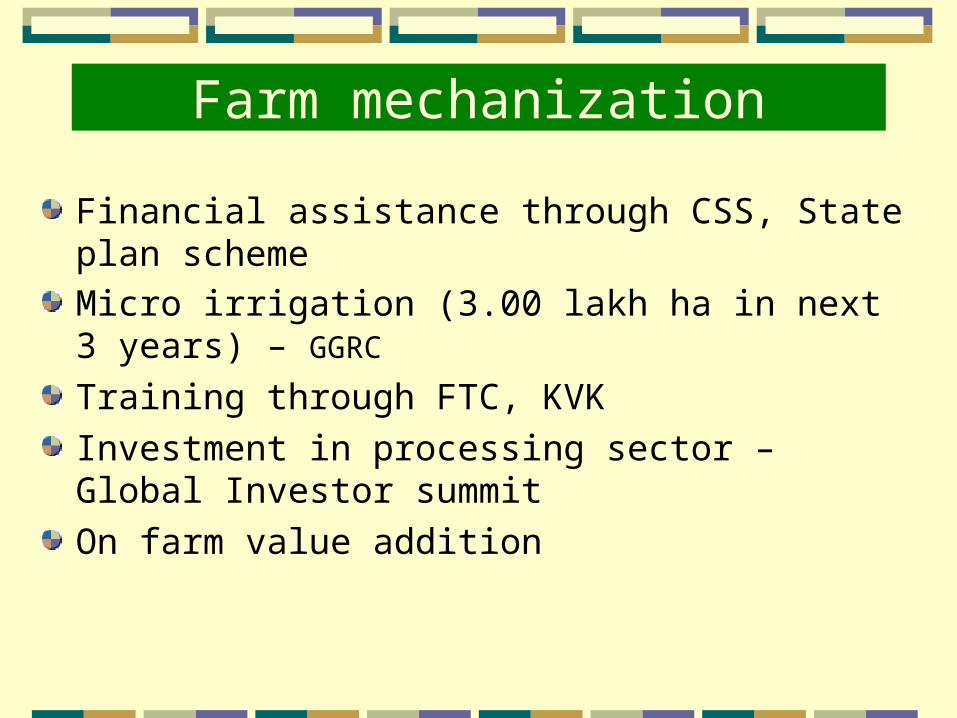
Farm mechanization
Financial assistance through CSS, State plan scheme
Micro irrigation (3.00 lakh ha in next 3 years) – GGRC
Training through FTC, KVK
Investment in processing sector – Global Investor summit
On farm value addition
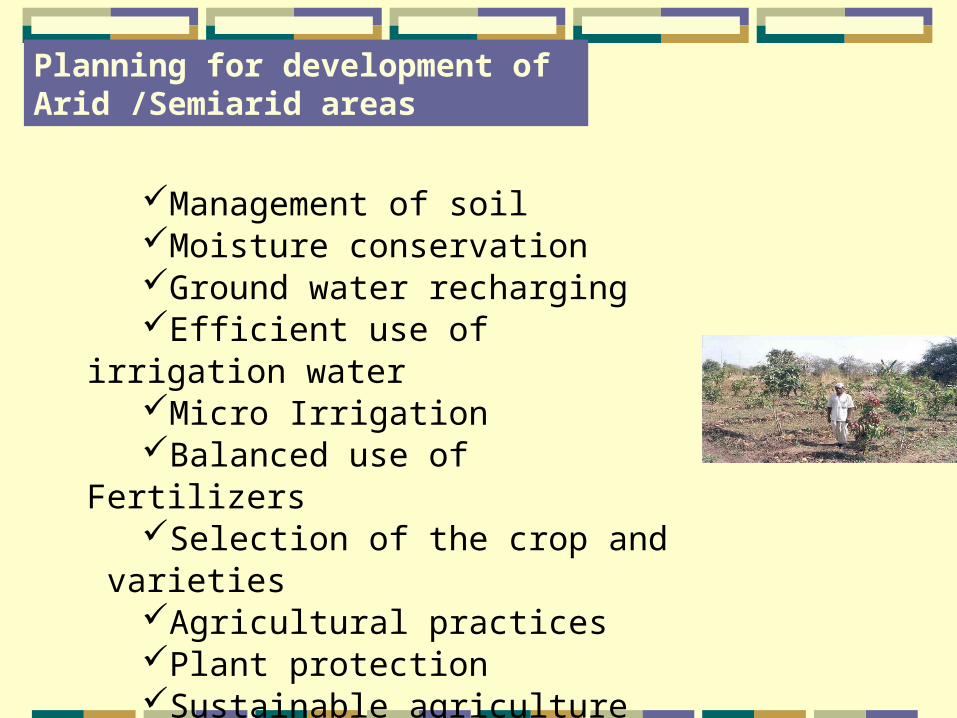
Planning for development of Arid /Semiarid areas
Management of soilMoisture conservation Ground water recharging Efficient use of irrigation waterMicro Irrigation Balanced use of FertilizersSelection of the crop and varietiesAgricultural practices Plant protection Sustainable agriculture practices
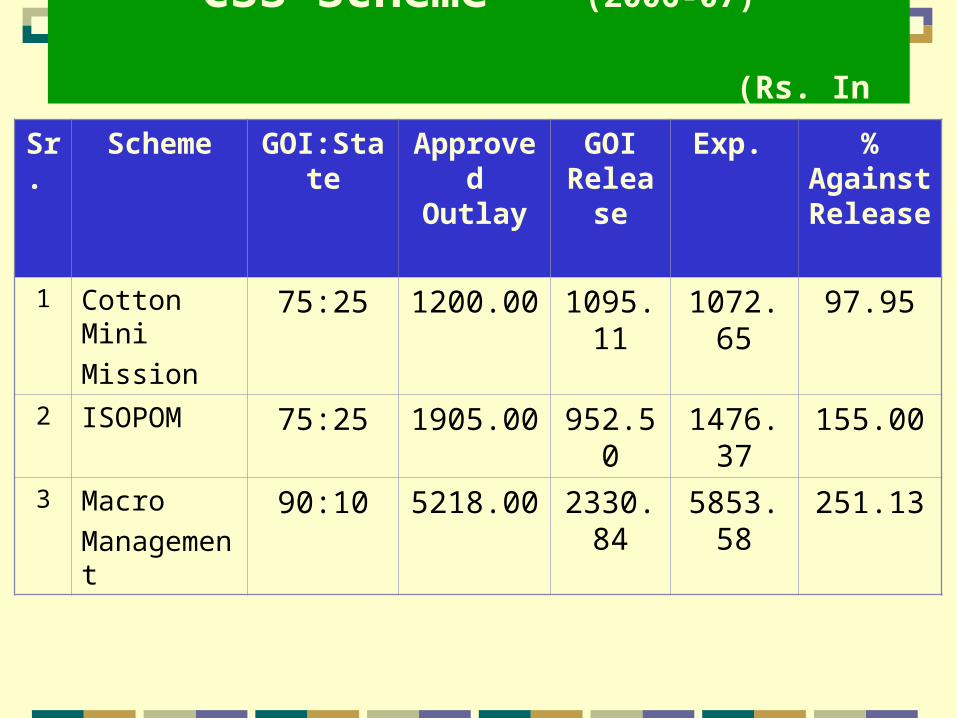
CSS Scheme (2006-07)
(Rs. In Lakh)
Sr. Scheme GOI:State Approved Outlay
GOI Release
Exp. % Against Release
1 Cotton Mini
Mission75:25 1200.00 1095.11 1072.65 97.95
2 ISOPOM 75:25 1905.00 952.50 1476.37 155.00
3 Macro
Management90:10 5218.00 2330.84 5853.58 251.13
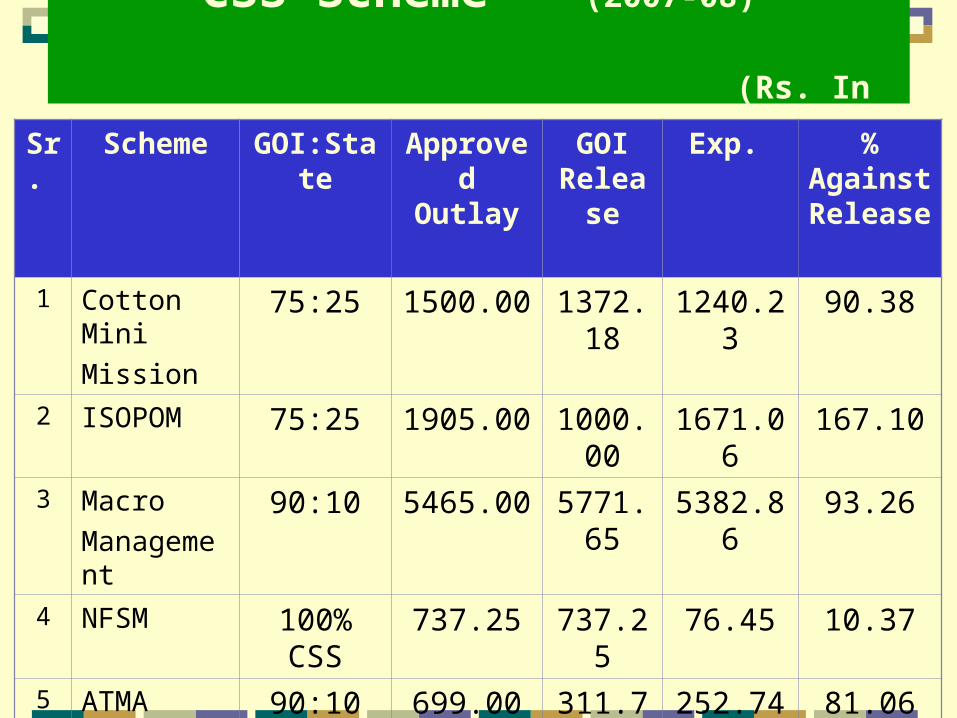
CSS Scheme (2007-08)
(Rs. In Lakh)
Sr. Scheme GOI:State Approved Outlay
GOI Release
Exp. % Against Release
1 Cotton Mini
Mission75:25 1500.00 1372.18 1240.23 90.38
2 ISOPOM 75:25 1905.00 1000.00 1671.06 167.10
3 Macro
Management90:10 5465.00 5771.65 5382.86 93.26
4 NFSM 100% CSS
737.25 737.25 76.45 10.37
5 ATMA 90:10 699.00 311.78 252.74 81.06
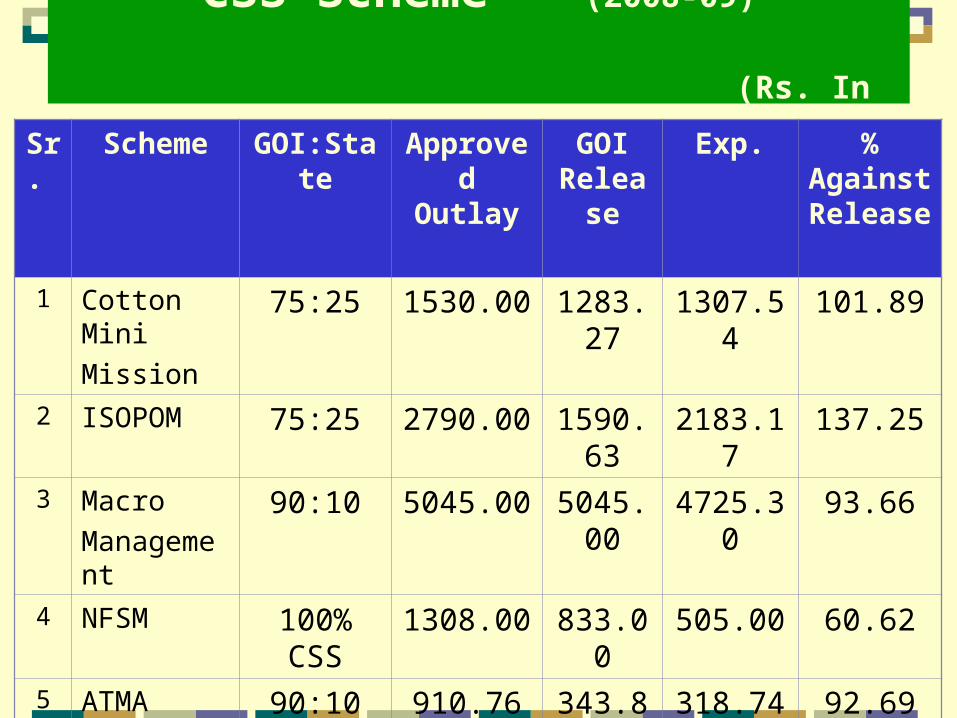
CSS Scheme (2008-09)
(Rs. In Lakh)
Sr. Scheme GOI:State Approved Outlay
GOI Release
Exp.
% Against Release
1 Cotton Mini
Mission75:25 1530.00 1283.27 1307.54 101.89
2 ISOPOM 75:25 2790.00 1590.63 2183.17 137.25
3 Macro
Management90:10 5045.00 5045.00 4725.30 93.66
4 NFSM 100% CSS
1308.00 833.00 505.00 60.62
5 ATMA 90:10 910.76 343.85 318.74 92.69
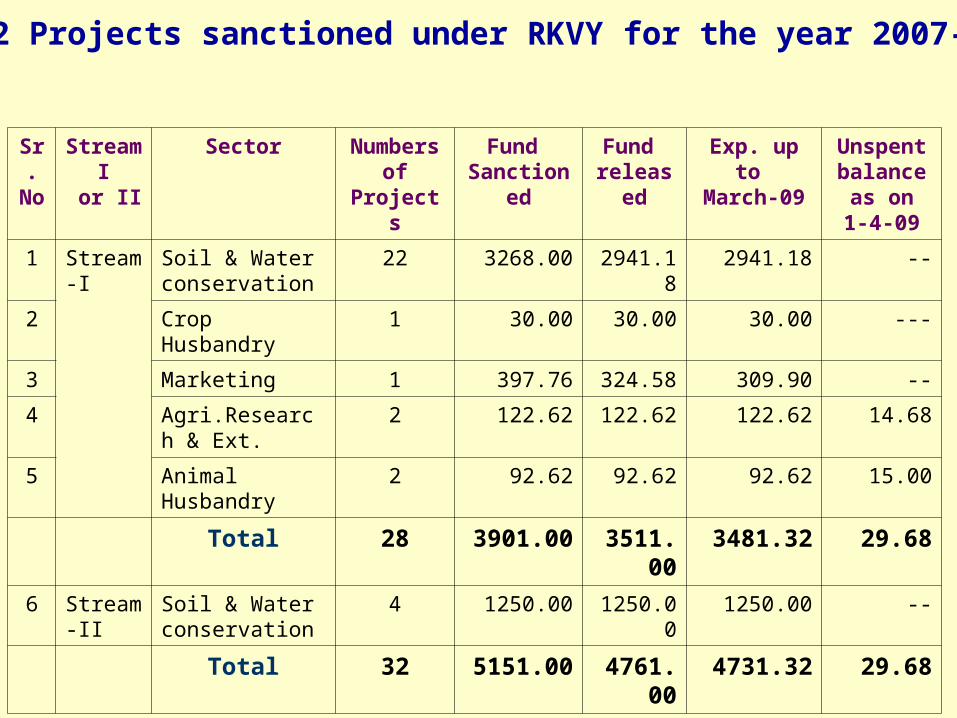
32 Projects sanctioned under RKVY for the year 2007-08 (Rs.in lakhs)
Sr.No
Stream I
or II
Sector Numbers of Projects
Fund Sanctioned
Fund released
Exp. up to March-09
Unspent balance as on 1-4-09
1 Stream-I Soil & Water conservation
22 3268.00 2941.18 2941.18 --
2 Crop Husbandry 1 30.00 30.00 30.00 ---
3 Marketing 1 397.76 324.58 309.90 --
4 Agri.Research & Ext.
2 122.62 122.62 122.62 14.68
5 Animal Husbandry 2 92.62 92.62 92.62 15.00
Total 28 3901.00 3511.00 3481.32 29.68
6 Stream-II
Soil & Water conservation
4 1250.00 1250.00 1250.00 --
Total 32 5151.00 4761.00 4731.32 29.68
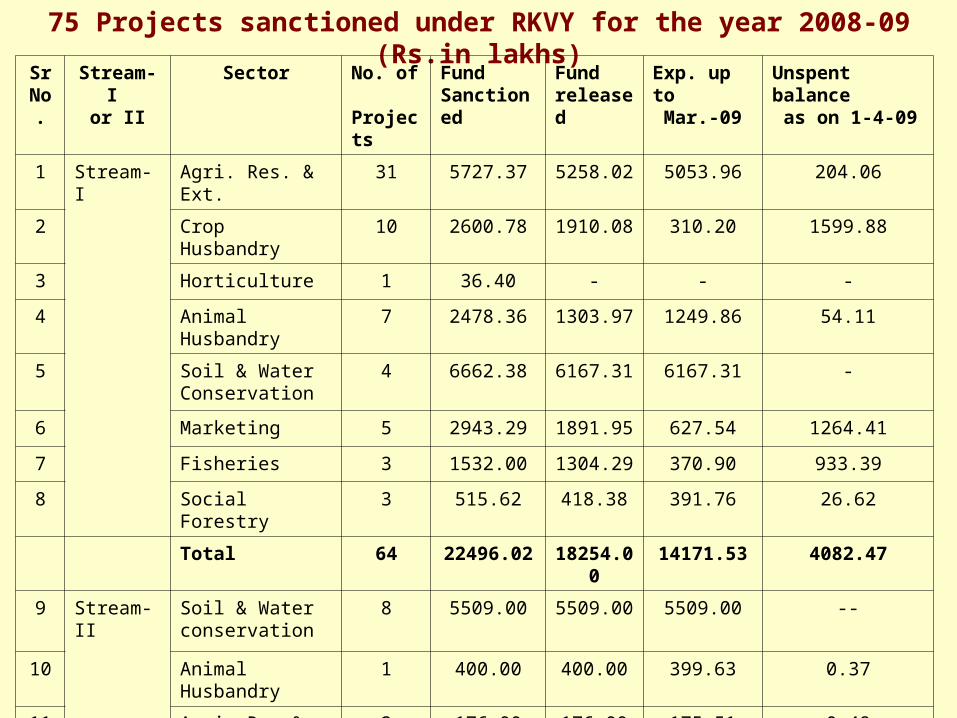
75 Projects sanctioned under RKVY for the year 2008-09 (Rs.in lakhs)
SrNo.
Stream-I or II
Sector No. of Projects
Fund Sanctioned
Fund released
Exp. up to Mar.-09
Unspent balance as on 1-4-09
1 Stream-I Agri. Res. & Ext. 31 5727.37 5258.02 5053.96 204.06
2 Crop Husbandry 10 2600.78 1910.08 310.20 1599.88
3 Horticulture 1 36.40 - - -
4 Animal Husbandry 7 2478.36 1303.97 1249.86 54.11
5 Soil & Water Conservation
4 6662.38 6167.31 6167.31 -
6 Marketing 5 2943.29 1891.95 627.54 1264.41
7 Fisheries 3 1532.00 1304.29 370.90 933.39
8 Social Forestry 3 515.62 418.38 391.76 26.62
Total 64 22496.02 18254.00 14171.53 4082.47
9 Stream-II Soil & Water conservation
8 5509.00 5509.00 5509.00 --
10 Animal Husbandry 1 400.00 400.00 399.63 0.37
11 Agri. Res.& Ext. 2 176.00 176.00 175.51 0.49
Total 11 6085.00 6085.00 6084.14 0.86
Grand Total 75 28581.02 24339.00 20255.67 4083.33
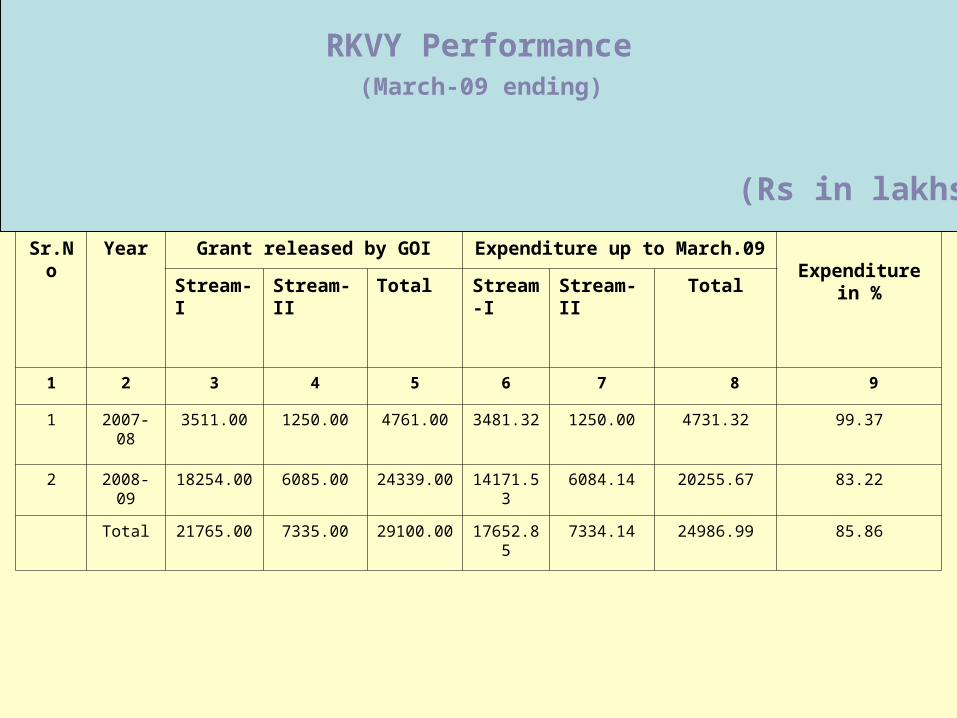
Sr.No Year Grant released by GOI Expenditure up to March.09 Expenditure in %
Stream-I Stream-II Total Stream
-IStream-II Total
1 2 3 4 5 6 7 8 9
1 2007-08 3511.00 1250.00 4761.00 3481.32 1250.00 4731.32 99.37
2 2008-09 18254.00 6085.00 24339.00 14171.53 6084.14 20255.67 83.22
Total 21765.00 7335.00 29100.00 17652.85 7334.14 24986.99 85.86
RKVY Performance (March-09 ending)
(Rs in lakhs)
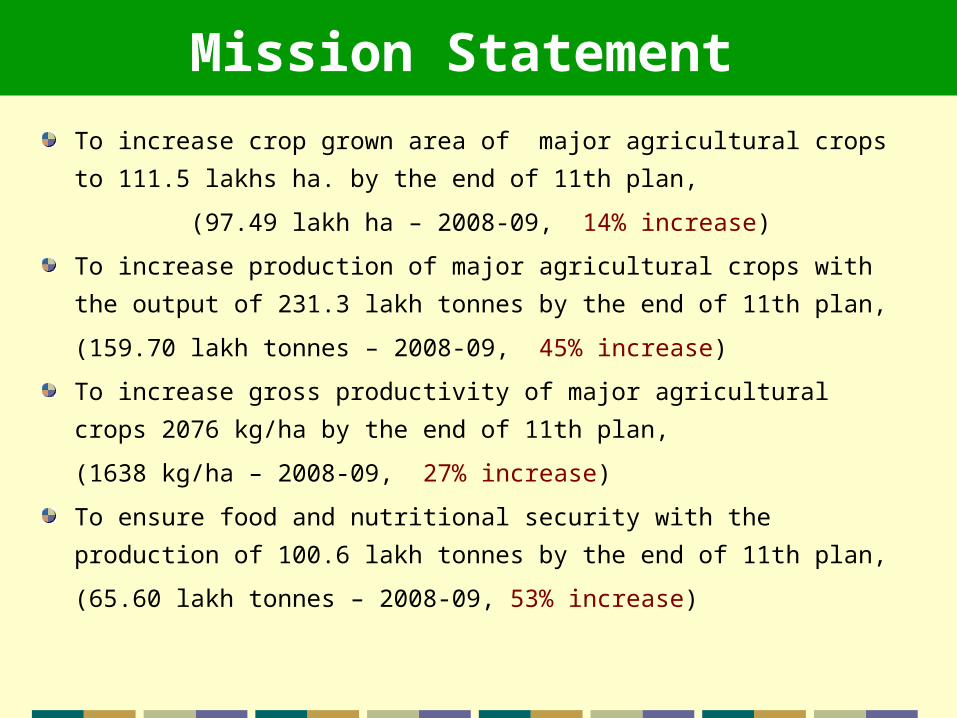
Mission Statement
To increase crop grown area of major agricultural crops to 111.5 lakhs ha. by
the end of 11th plan,
(97.49 lakh ha – 2008-09, 14% increase)
To increase production of major agricultural crops with the output of 231.3
lakh tonnes by the end of 11th plan,
(159.70 lakh tonnes – 2008-09, 45% increase)
To increase gross productivity of major agricultural crops 2076 kg/ha by the
end of 11th plan,
(1638 kg/ha – 2008-09, 27% increase)
To ensure food and nutritional security with the production of 100.6 lakh
tonnes by the end of 11th plan,
(65.60 lakh tonnes – 2008-09, 53% increase)
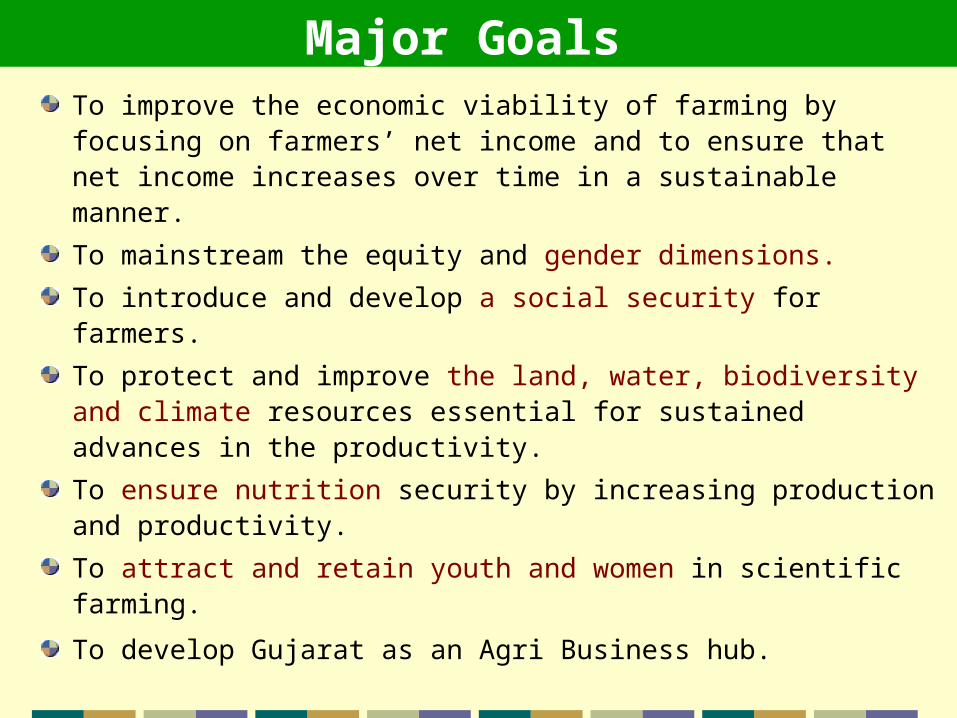
Major Goals To improve the economic viability of farming by focusing on farmers’ net income and to ensure that net income increases over time in a sustainable manner.
To mainstream the equity and gender dimensions.
To introduce and develop a social security for farmers.
To protect and improve the land, water, biodiversity and climate resources essential for sustained advances in the productivity.
To ensure nutrition security by increasing production and productivity.
To attract and retain youth and women in scientific farming.
To develop Gujarat as an Agri Business hub.
46
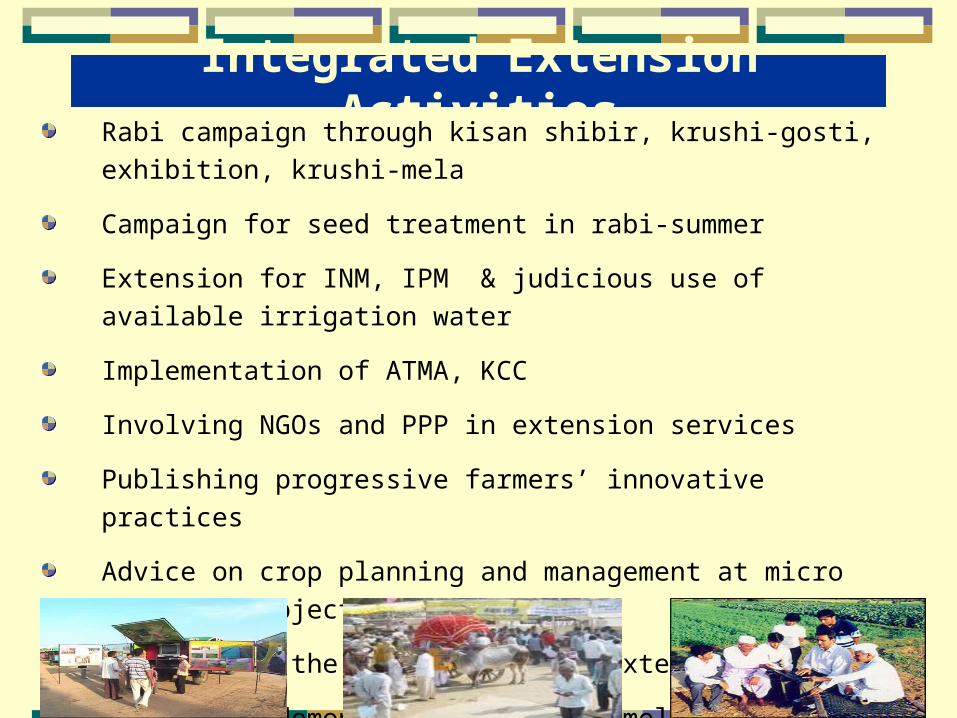
Integrated Extension ActivitiesRabi campaign through kisan shibir, krushi-gosti, exhibition, krushi-mela
Campaign for seed treatment in rabi-summer
Extension for INM, IPM & judicious use of available irrigation water
Implementation of ATMA, KCC
Involving NGOs and PPP in extension services
Publishing progressive farmers’ innovative practices
Advice on crop planning and management at micro level by subject experts
Training to the trainers (field extension staff)
FFS, Block demonstration, Krishi mela, Prerana Pravas

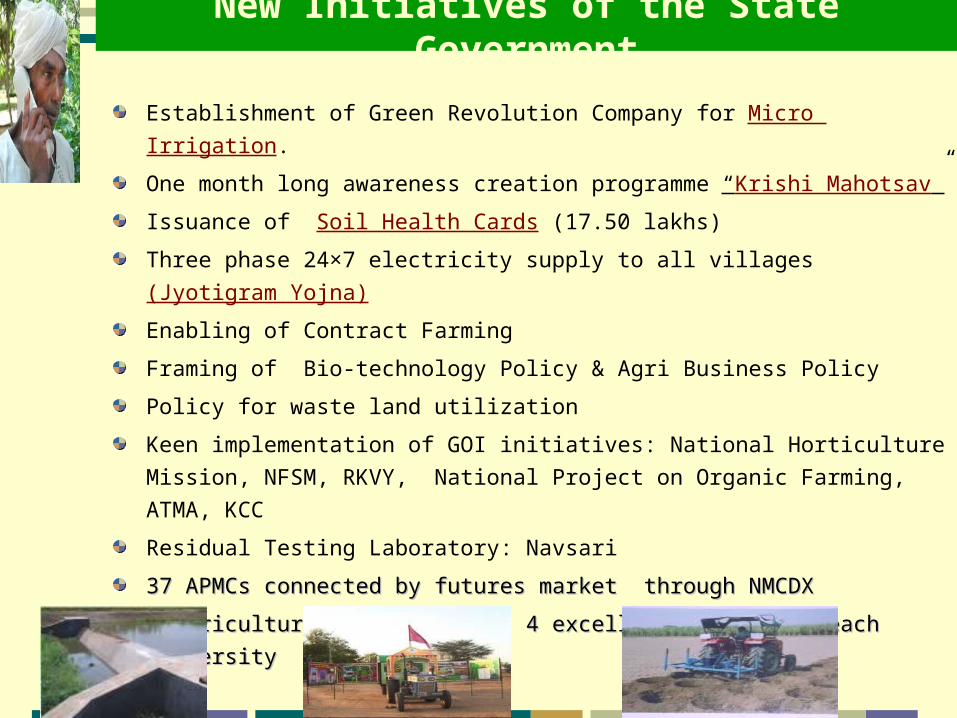
New Initiatives of the State Government
Establishment of Green Revolution Company for Micro Irrigation.
One month long awareness creation programme “Krishi Mahotsav”
Issuance of Soil Health Cards (17.50 lakhs)
Three phase 24×7 electricity supply to all villages (Jyotigram Yojna)
Enabling of Contract Farming
Framing of Bio-technology Policy & Agri Business Policy
Policy for waste land utilization
Keen implementation of GOI initiatives: National Horticulture Mission, NFSM,
RKVY, National Project on Organic Farming, ATMA, KCC
Residual Testing Laboratory: Navsari
37 APMCs connected by futures market through NMCDX37 APMCs connected by futures market through NMCDX
4 Agricultural Universities, 4 excellence center in each university4 Agricultural Universities, 4 excellence center in each university
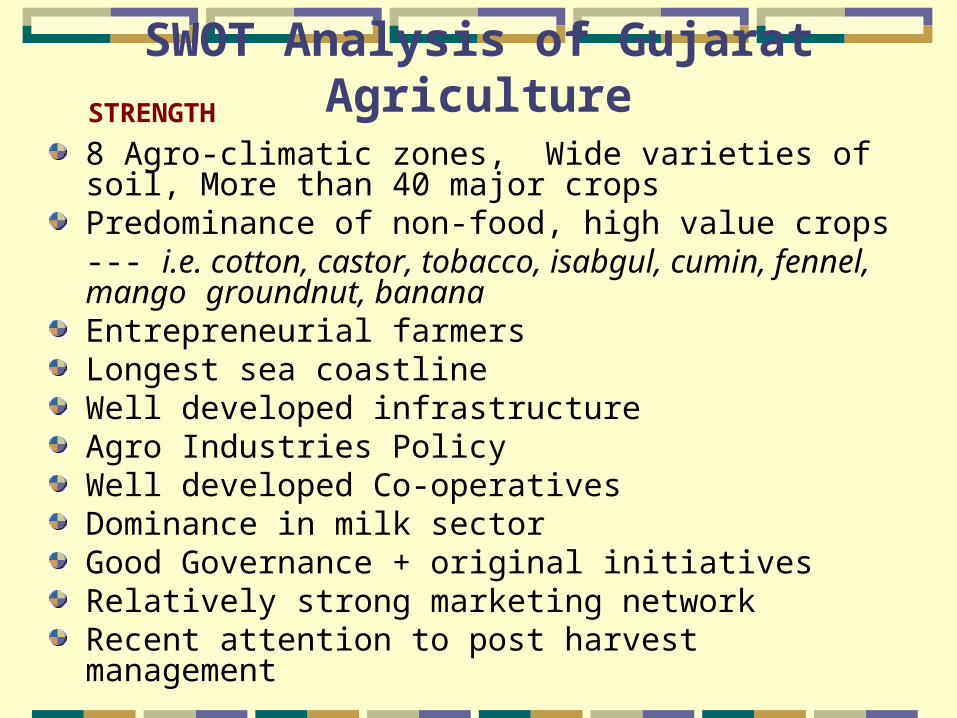
SWOT Analysis of Gujarat Agriculture
8 Agro-climatic zones, Wide varieties of soil, More than 40 major cropsPredominance of non-food, high value crops--- i.e. cotton, castor, tobacco, isabgul, cumin, fennel, mango groundnut, bananaEntrepreneurial farmersLongest sea coastlineWell developed infrastructureAgro Industries PolicyWell developed Co-operatives Dominance in milk sectorGood Governance + original initiativesRelatively strong marketing networkRecent attention to post harvest management
STRENGTH
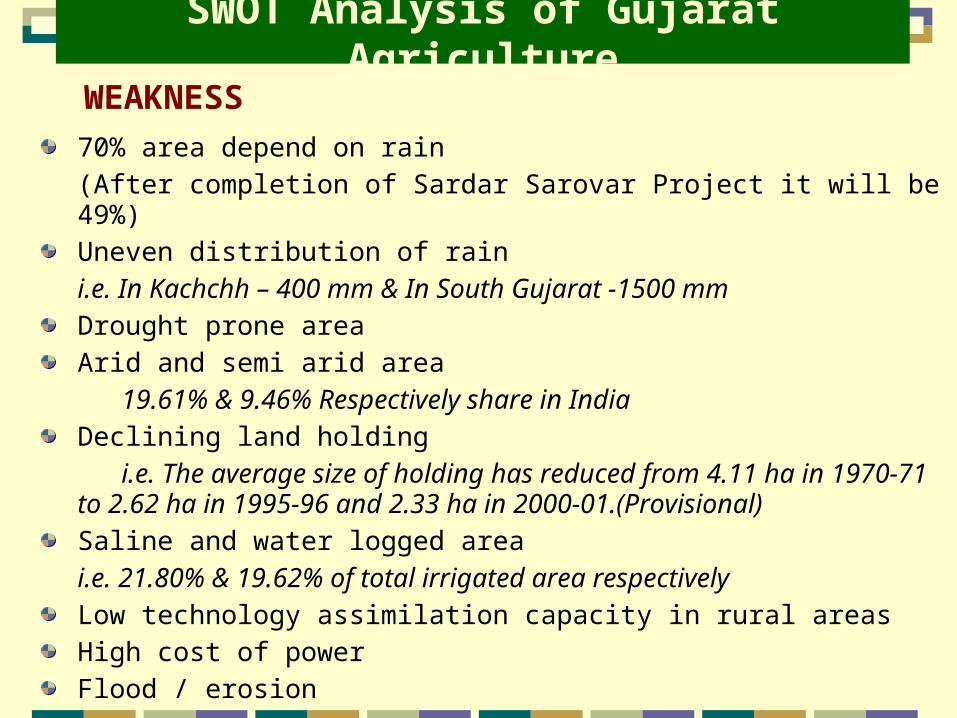
SWOT Analysis of Gujarat Agriculture
70% area depend on rain
(After completion of Sardar Sarovar Project it will be 49%)
Uneven distribution of rain
i.e. In Kachchh – 400 mm & In South Gujarat -1500 mm
Drought prone area
Arid and semi arid area
19.61% & 9.46% Respectively share in India
Declining land holding
i.e. The average size of holding has reduced from 4.11 ha in 1970-71 to 2.62 ha in 1995-96 and 2.33 ha in 2000-01.(Provisional)
Saline and water logged area
i.e. 21.80% & 19.62% of total irrigated area respectively
Low technology assimilation capacity in rural areas
High cost of power
Flood / erosion
WEAKNESS
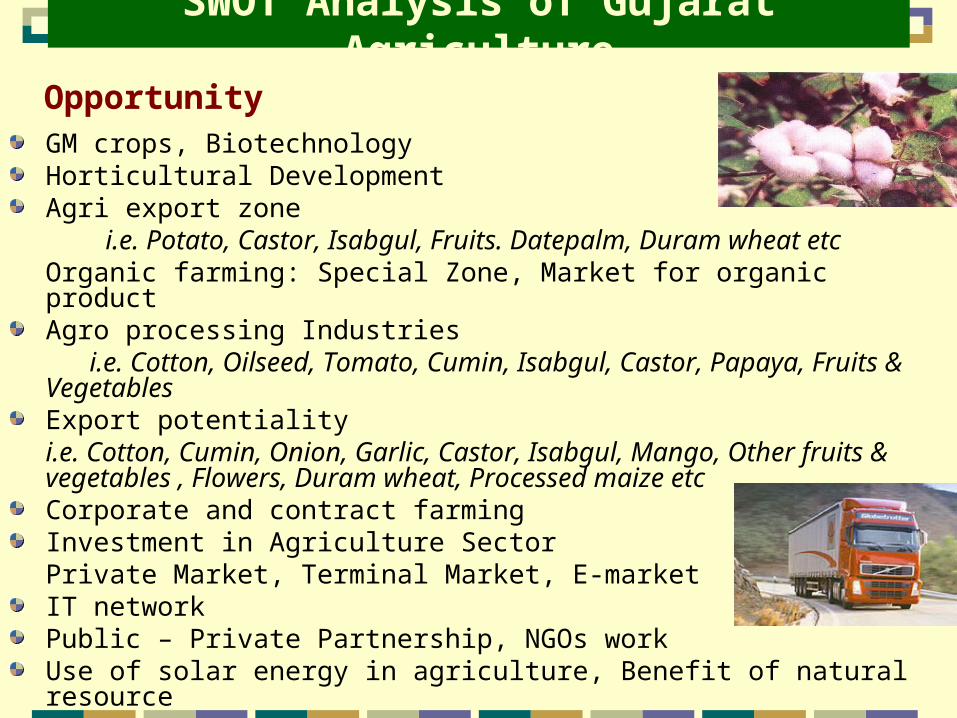
SWOT Analysis of Gujarat Agriculture
GM crops, Biotechnology Horticultural DevelopmentAgri export zone
i.e. Potato, Castor, Isabgul, Fruits. Datepalm, Duram wheat etcOrganic farming: Special Zone, Market for organic productAgro processing Industries
i.e. Cotton, Oilseed, Tomato, Cumin, Isabgul, Castor, Papaya, Fruits & VegetablesExport potentialityi.e. Cotton, Cumin, Onion, Garlic, Castor, Isabgul, Mango, Other fruits & vegetables , Flowers, Duram wheat, Processed maize etcCorporate and contract farming Investment in Agriculture SectorPrivate Market, Terminal Market, E-marketIT network Public – Private Partnership, NGOs workUse of solar energy in agriculture, Benefit of natural resource
Opportunity
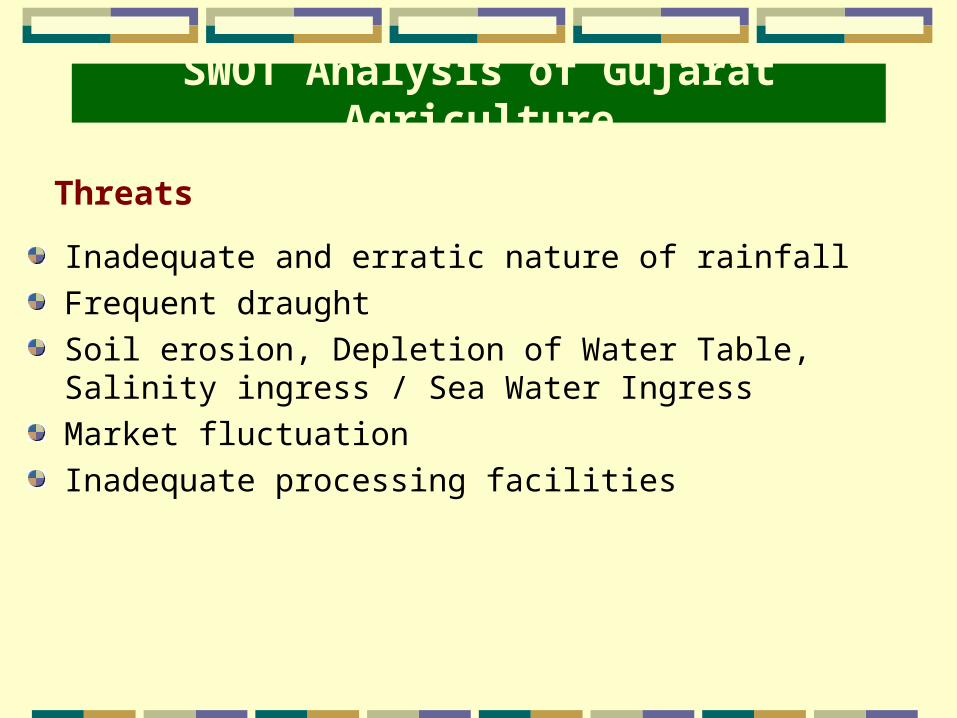
SWOT Analysis of Gujarat Agriculture
Inadequate and erratic nature of rainfall
Frequent draught
Soil erosion, Depletion of Water Table, Salinity ingress / Sea Water Ingress
Market fluctuation
Inadequate processing facilities
Threats
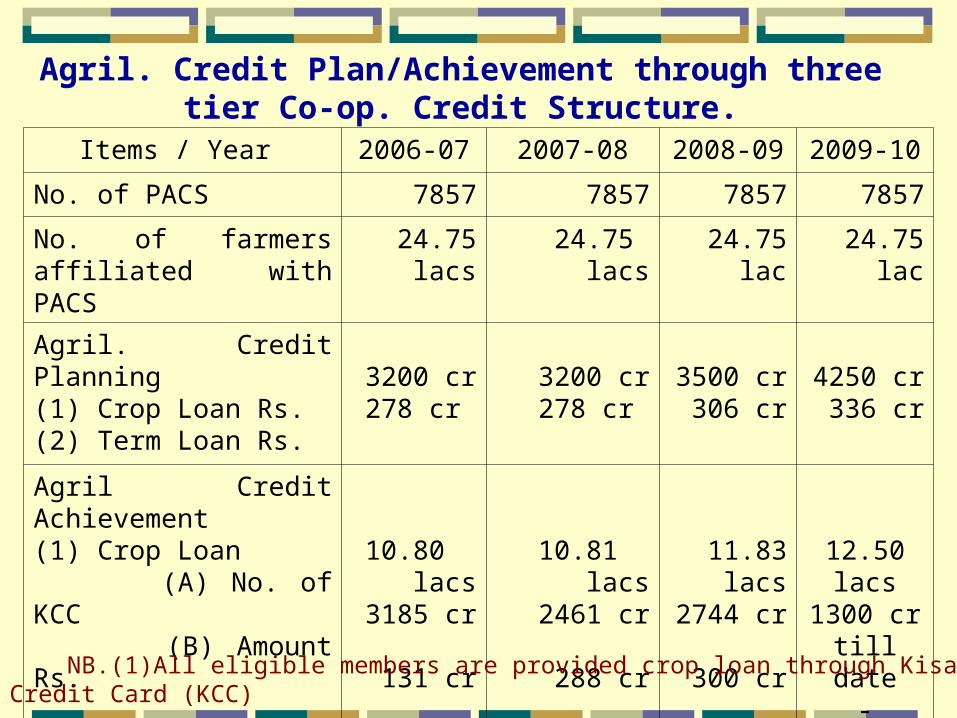
Agril. Credit Plan/Achievement through three tier Co-op. Credit Structure.
Items / Year 2006-07 2007-08 2008-09 2009-10
No. of PACS 7857 7857 7857 7857
No. of farmers affiliated with PACS
24.75 lacs 24.75 lacs 24.75 lac 24.75 lac
Agril. Credit Planning (1) Crop Loan Rs.(2) Term Loan Rs.
3200 cr278 cr
3200 cr278 cr
3500 cr306 cr
4250 cr336 cr
Agril Credit Achievement (1) Crop Loan (A) No. of KCC (B) Amount Rs.
(2) Term Loan Rs.
10.80 lacs3185 cr
131 cr
10.81 lacs2461 cr
288 cr
11.83 lacs2744 cr
300 cr
12.50 lacs1300 cr till
date-
NB.(1)All eligible members are provided crop loan through Kisan Credit Card (KCC)
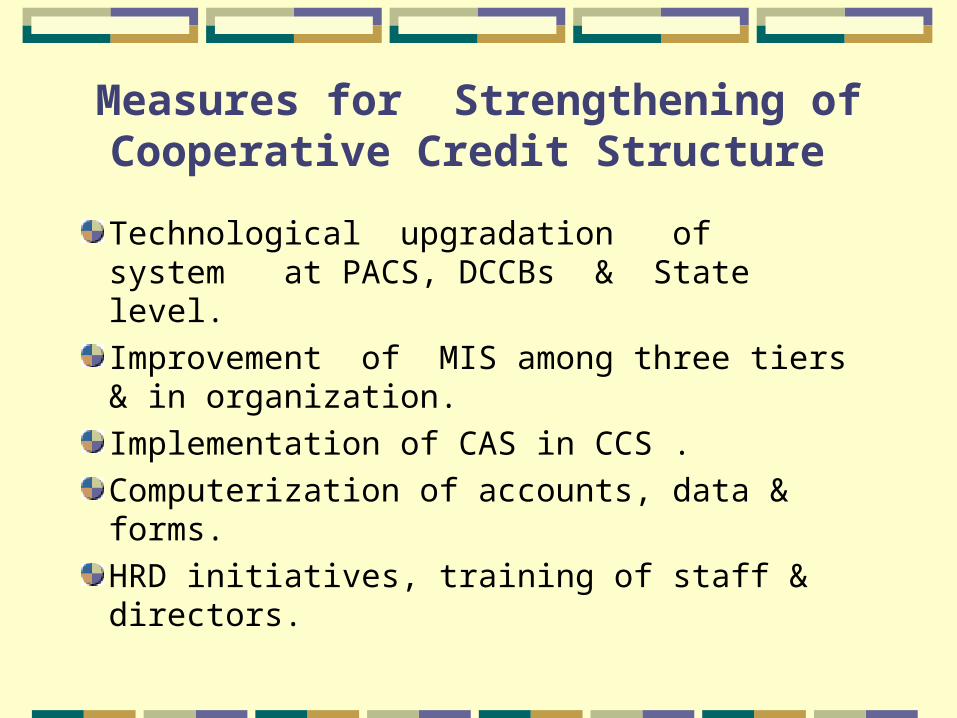
Measures for Strengthening of Cooperative Credit Structure
Technological upgradation of system at PACS, DCCBs & State level.
Improvement of MIS among three tiers & in organization.
Implementation of CAS in CCS .
Computerization of accounts, data & forms.
HRD initiatives, training of staff & directors.

Cont……
Increase in refinance to CCS from NABARD.Steps to increase low cost deposits by promoting SHGs.Diversification of business/portfolio.Implementation of Vaidhyanathan committee measures to strengthen Credit Cooperative Structure.
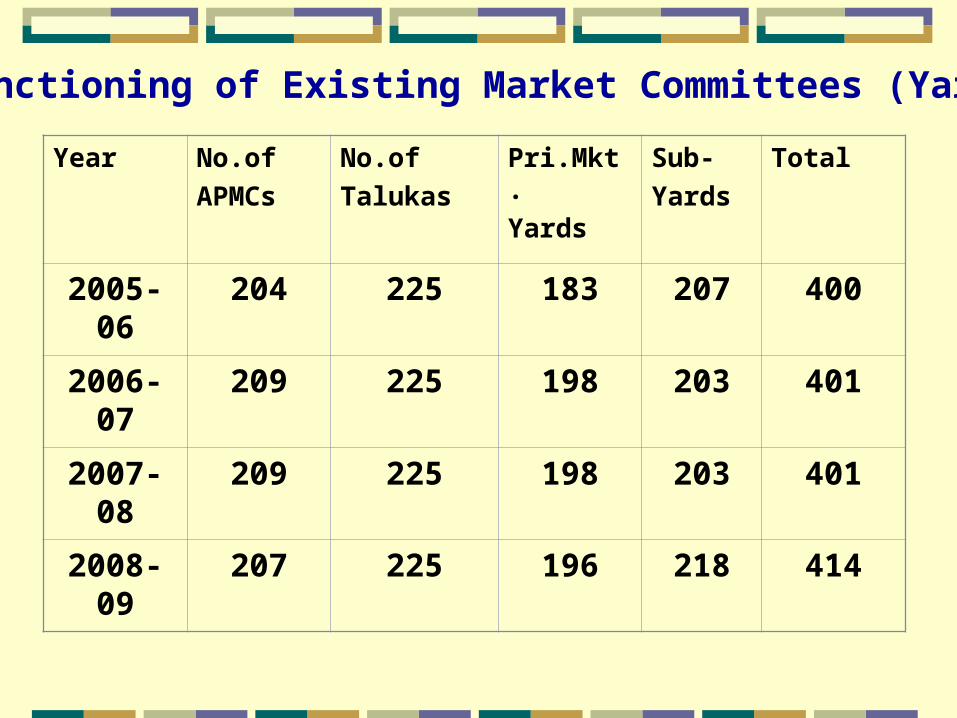
Functioning of Existing Market Committees (Yards)
Year No.of
APMCs
No.of
Talukas
Pri.Mkt.
Yards
Sub-
Yards
Total
2005-06 204 225 183 207 400
2006-07 209 225 198 203 401
2007-08 209 225 198 203 401
2008-09 207 225 196 218 414
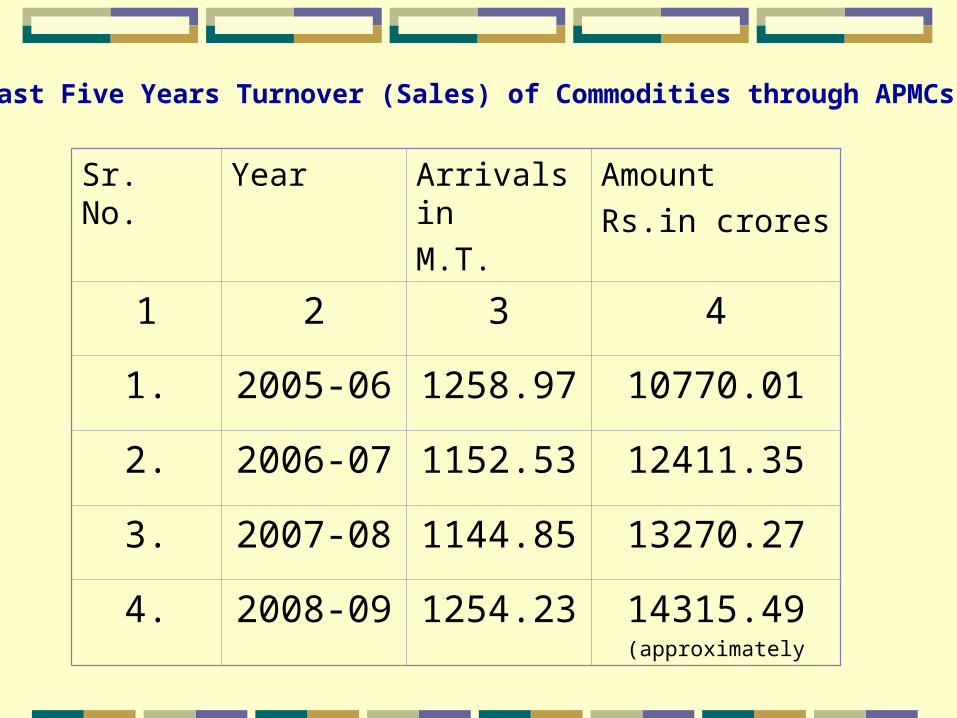
Last Five Years Turnover (Sales) of Commodities through APMCs.
Sr. No. Year Arrivals in
M.T.
Amount
Rs.in crores
1 2 3 4
1. 2005-06 1258.97 10770.01
2. 2006-07 1152.53 12411.35
3. 2007-08 1144.85 13270.27
4. 2008-09 1254.23 14315.49(approximately
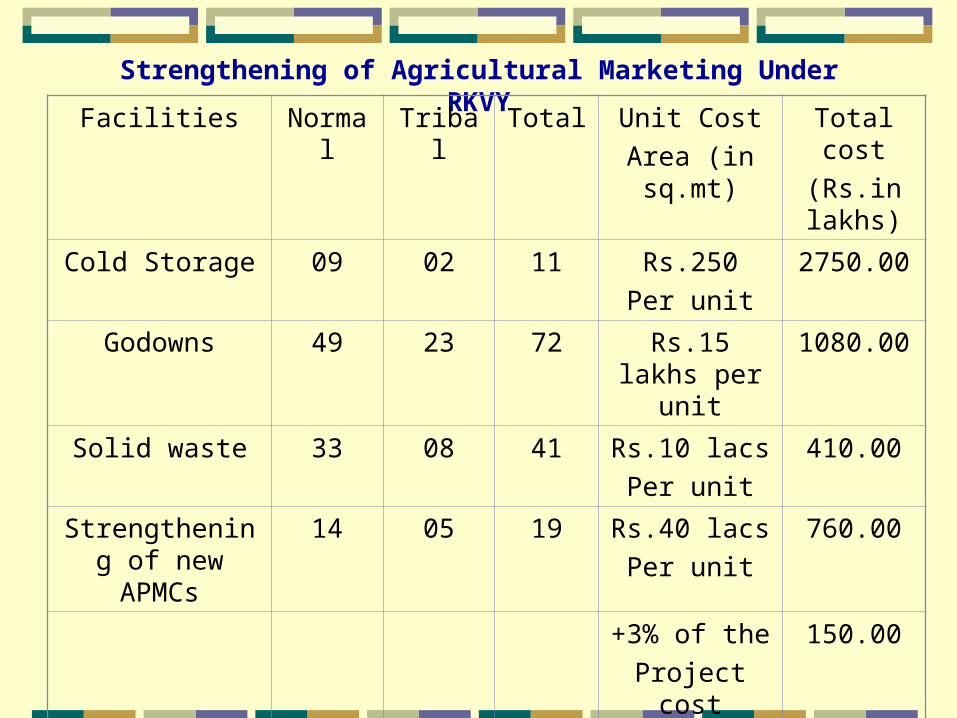
Strengthening of Agricultural Marketing Under RKVY
Facilities Normal Tribal Total Unit Cost
Area (in sq.mt)
Total cost
(Rs.in lakhs)
Cold Storage 09 02 11 Rs.250
Per unit
2750.00
Godowns 49 23 72 Rs.15 lakhs per unit
1080.00
Solid waste 33 08 41 Rs.10 lacs
Per unit
410.00
Strengthening of new APMCs
14 05 19 Rs.40 lacs
Per unit
760.00
+3% of the
Project cost
150.00
Total 5150.00

“Each success only buys an admission ticket to a more difficult problem.”
- Henry Kissinger