Embed Size (px)
Citation preview
1
A year of consolidation…as performance continues to
improve
RESULTS PRESENTATIONYear ended 31 March 2002
TM
NSBW
2
Part 1 Group financial performance
Part 2Part 2 Business performance
Part 3Part 3 Strategy
Part 4Part 4 Outlook
Agenda
3
A$m change
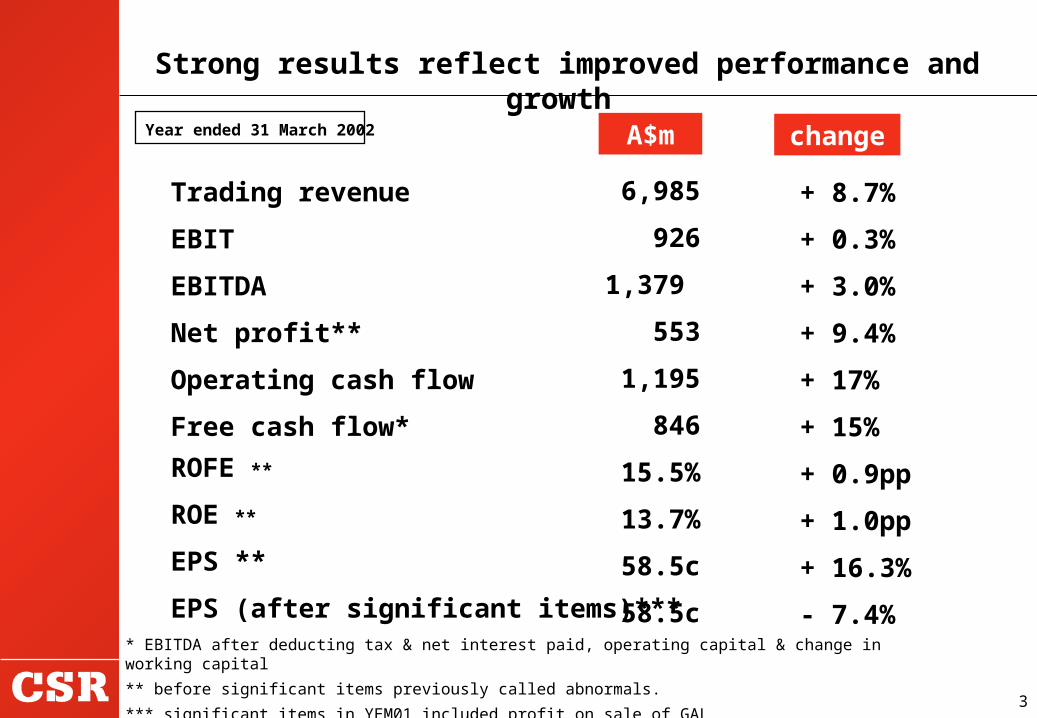
Strong results reflect improved performance and growth
6,985
926
1,379
553
1,195
846
15.5%
13.7%
58.5c
58.5c
+ 8.7%
+ 0.3%
+ 3.0%
+ 9.4%
+ 17%
+ 15%
+ 0.9pp
+ 1.0pp
+ 16.3%
- 7.4%
Trading revenue
EBIT
EBITDA
Net profit**
Operating cash flow
Free cash flow*
ROFE **
ROE **
EPS **
EPS (after significant items)**** EBITDA after deducting tax & net interest paid, operating capital & change in working capital
** before significant items previously called abnormals.
*** significant items in YEM01 included profit on sale of GAL
Year ended 31 March 2002
4
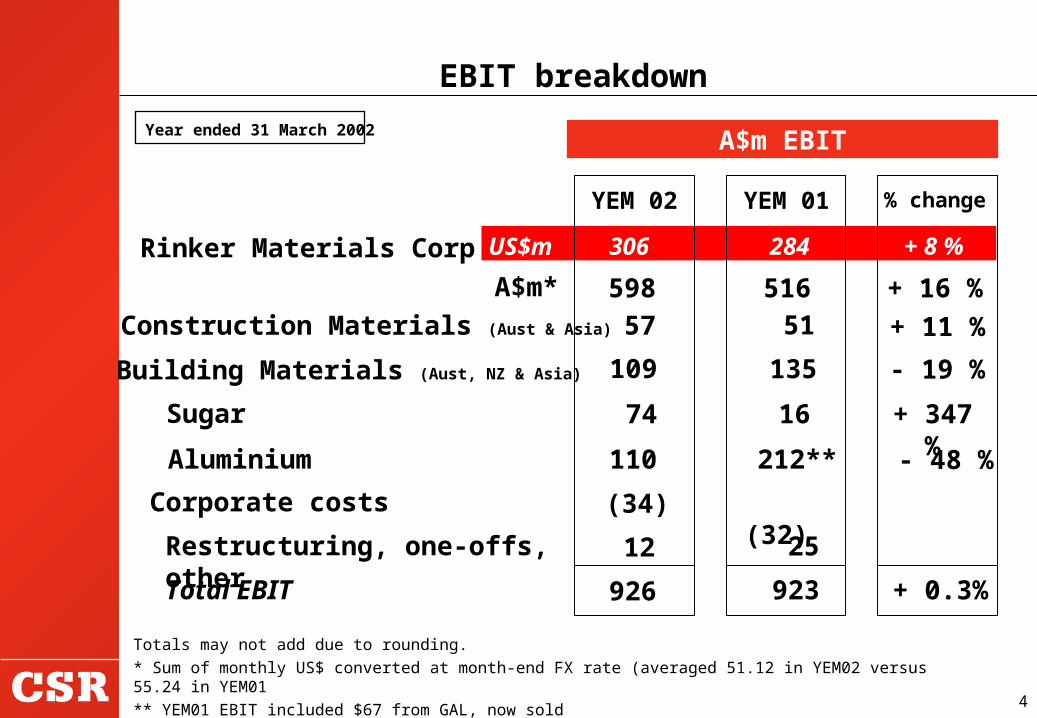
YEM 02 YEM 01 % change
Rinker Materials Corp
598 516 + 16 %Construction Materials (Aust & Asia) 57 + 11
%Building Materials (Aust, NZ & Asia) 109
764 702 + 8%74 16 + 347 %110 212**
Sugar
Corporate costs
- 48 %
A$m EBIT
(34) (32)
Restructuring, one-offs, other
EBIT breakdown
A$m*
25
Aluminium
51
306 284 + 8 % US$m
135 - 19 %
12
Totals may not add due to rounding.* Sum of monthly US$ converted at month-end FX rate (averaged 51.12 in YEM02 versus 55.24 in YEM01** YEM01 EBIT included $67 from GAL, now sold
Year ended 31 March 2002
Total EBIT 923926 + 0.3%
5
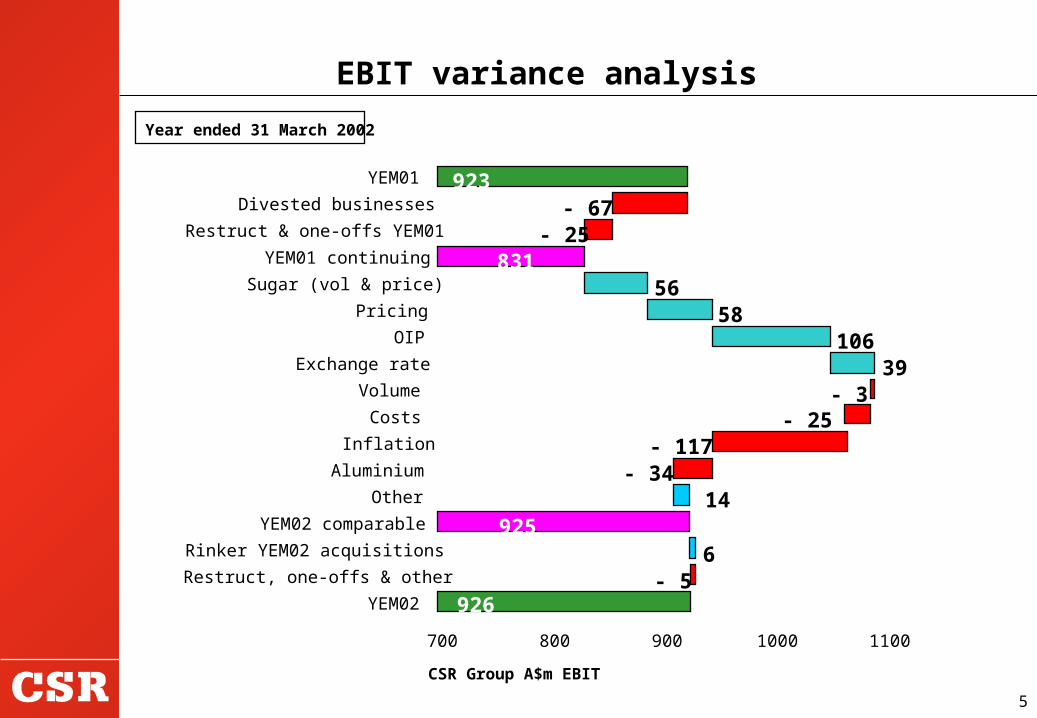
EBIT variance analysis
Year ended 31 March 2002
CSR Group A$m EBIT
926
- 117- 25
5856
831
- 67923
14925
106
- 25
- 339
- 34
- 56
700 800 900 1000 1100
YEM02
Restruct, one-offs & other
Rinker YEM02 acquisitions
YEM02 comparable
Other
Aluminium
Inflation
Costs
Volume
Exchange rate
OIP
Pricing
Sugar (vol & price)
YEM01 continuing
Restruct & one-offs YEM01
Divested businesses
YEM01
6
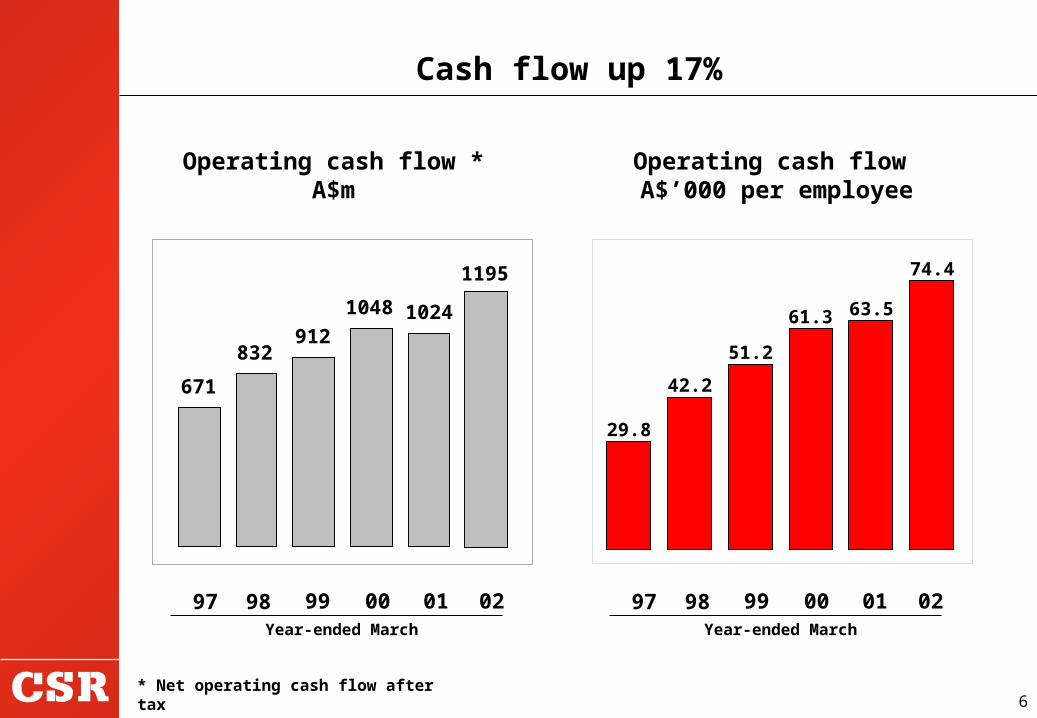
Cash flow up 17%
Operating cash flow A$’000 per employee
* Net operating cash flow after tax
671
832912
1048 1024
1195
99 00 01 98 97Year-ended March
02 99 00 01 98 97Year-ended March
02
29.8
42.2
51.2
61.3 63.5
74.4
Operating cash flow * A$m
7
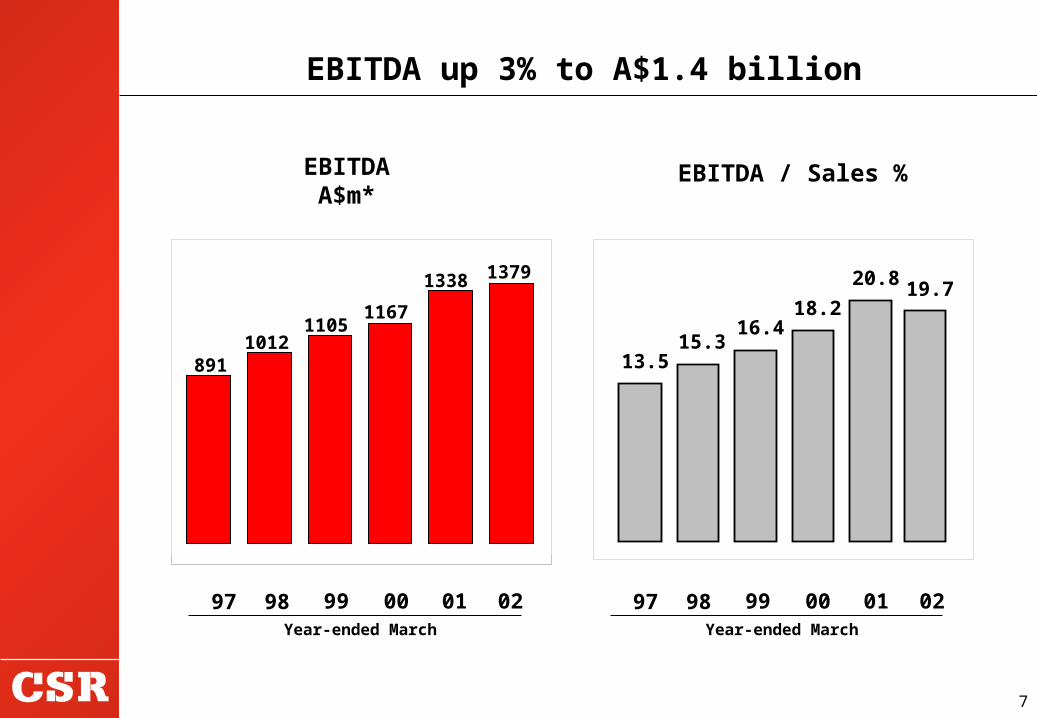
EBITDA up 3% to A$1.4 billion
EBITDA A$m*
99 00 01 98 97Year-ended March
02
8911012
11051167
1338 1379
EBITDA / Sales %
13.515.3
16.418.2
20.8 19.7
99 00 01 98 97Year-ended March
02
8
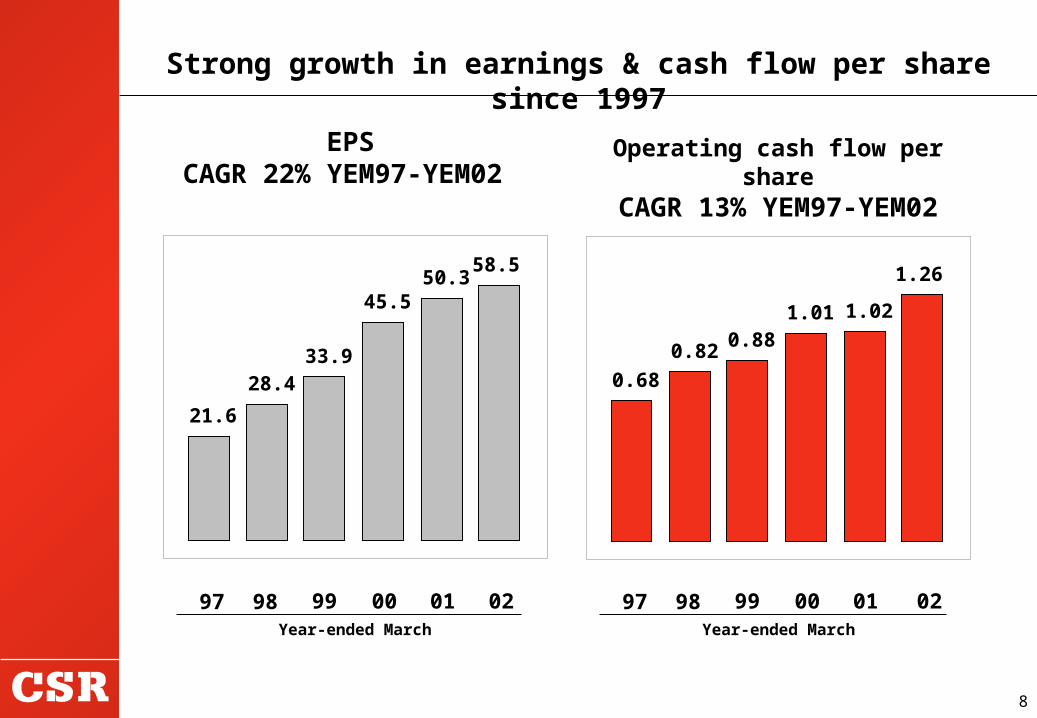
Strong growth in earnings & cash flow per share since 1997
EPS CAGR 22% YEM97-YEM02
Operating cash flow per share
CAGR 13% YEM97-YEM02
99 00 01 98 97Year-ended March
21.6
28.433.9
45.550.3
58.5
0.68
0.820.88
1.01 1.02
1.26
99 00 01 98 97Year-ended March
02 02
9
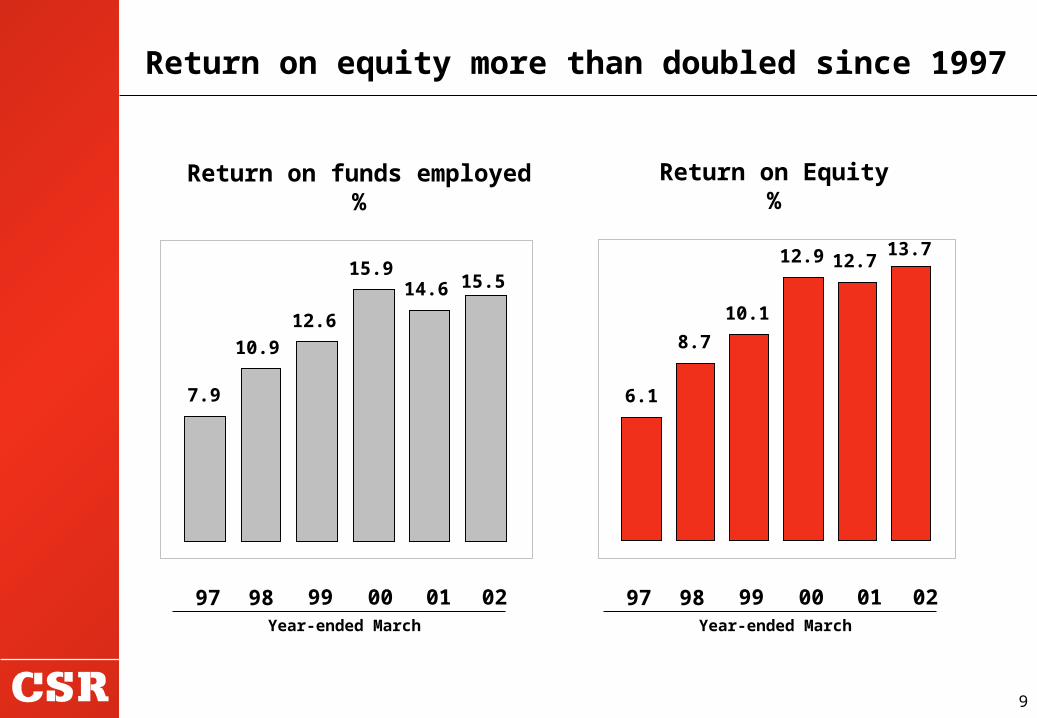
Return on equity more than doubled since 1997
7.9
10.9
12.6
15.914.6 15.5
6.1
8.7
10.1
12.9 12.713.7
Return on funds employed
%
Return on Equity%
99 00 01 98 97Year-ended March
02 99 00 01 98 97Year-ended March
02
10
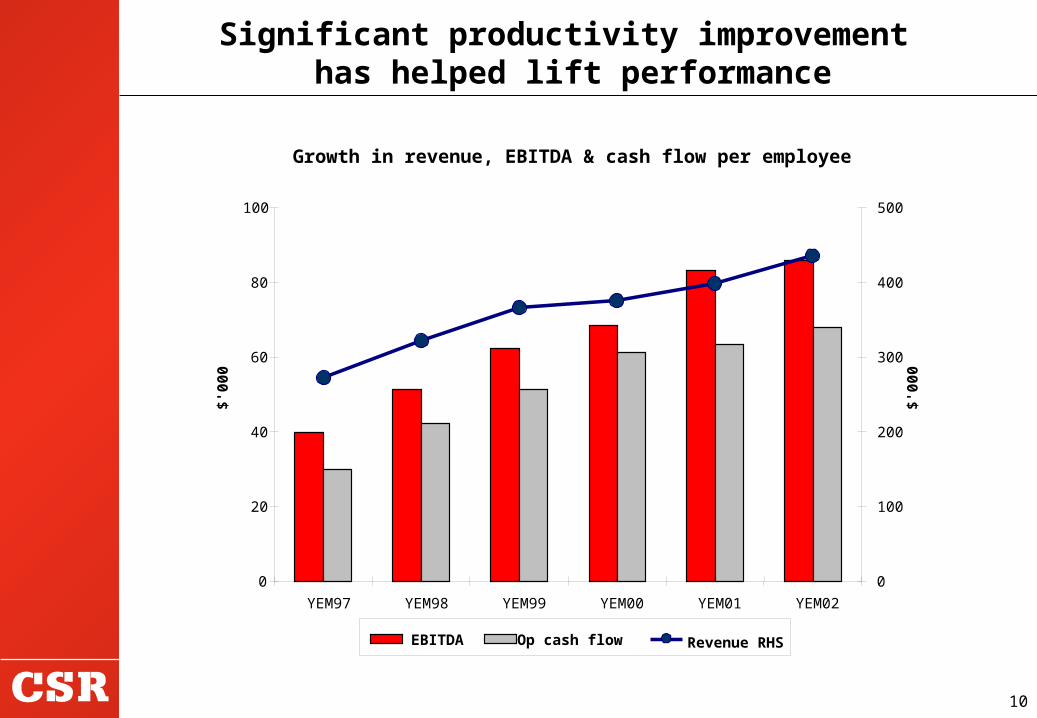
Significant productivity improvement has helped lift performance
Growth in revenue, EBITDA & cash flow per employee
0
20
40
60
80
100
YEM97 YEM98 YEM99 YEM00 YEM01 YEM02
$'00
0
0
100
200
300
400
500
$'00
0
EBITDA Op cash flow Revenue RHS
11
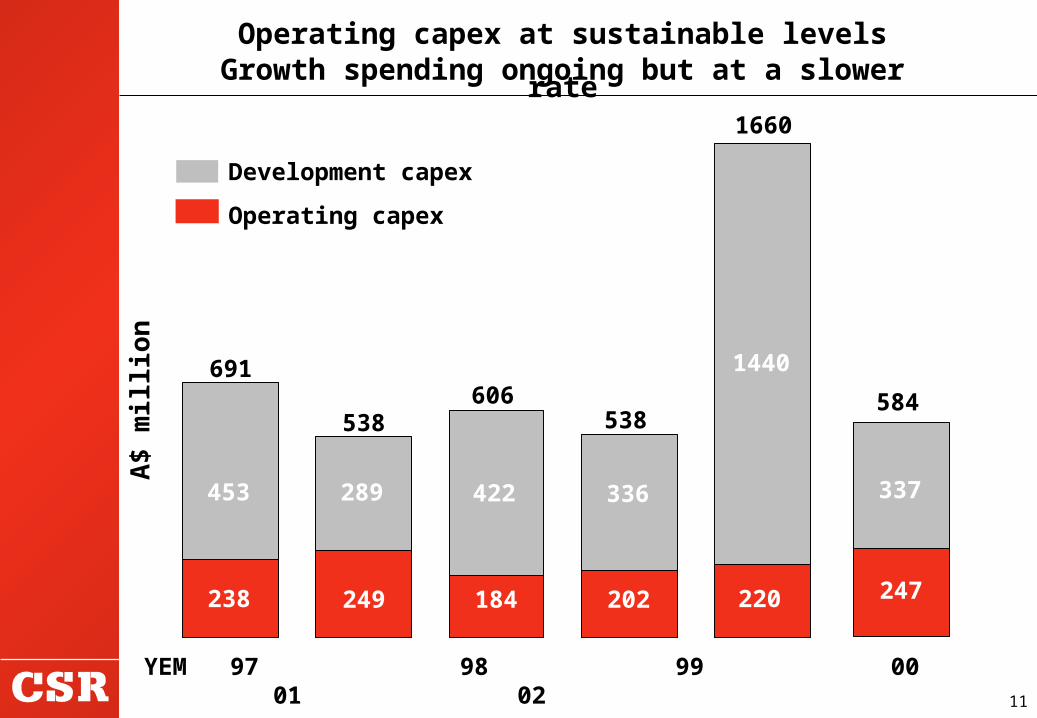
YEM 97 98 99 00 01 02
Operating capex at sustainable levelsGrowth spending ongoing but at a slower
rate
A$ m
illion
Development capex
Operating capex
691
538606
538
1660
453 289 422 336
238 220202184249
1440 584
337
247
12
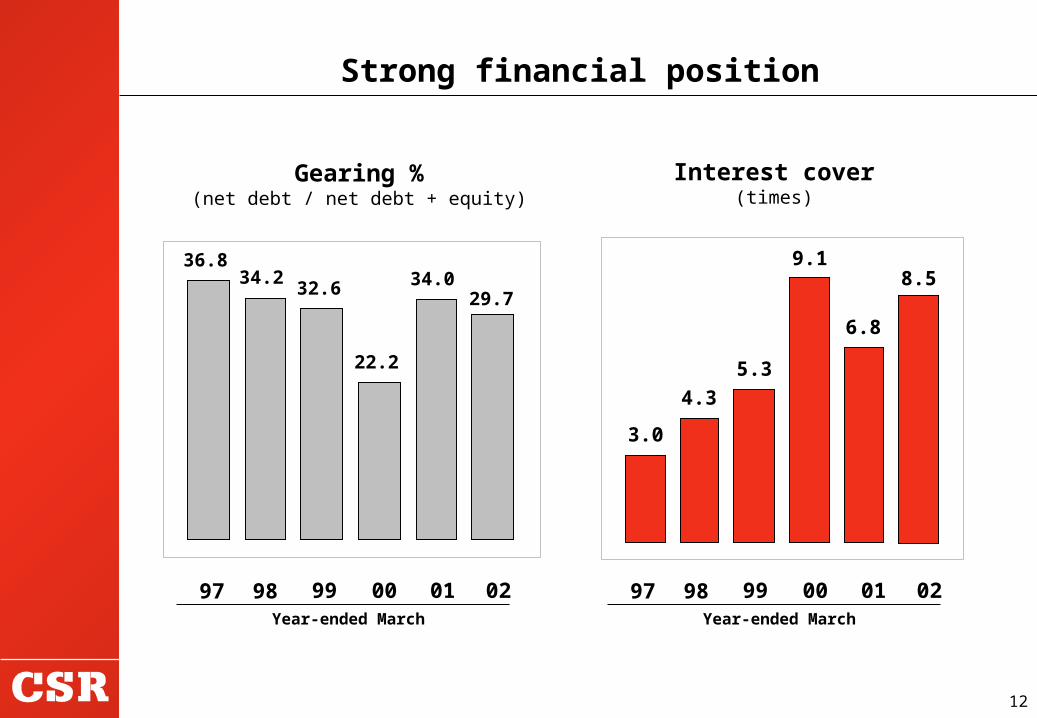
Strong financial position
Gearing %(net debt / net debt + equity)
Interest cover(times)
36.834.2
32.6
22.2
34.029.7
3.0
4.3
5.3
9.1
6.8
8.5
99 00 01 98 97Year-ended March
02 99 00 01 98 97Year-ended March
02

13
Part 1 Group financial performance
Part 2 Business performance
Part 3Part 3 Strategy
Part 4Part 4 Outlook
Agenda
14
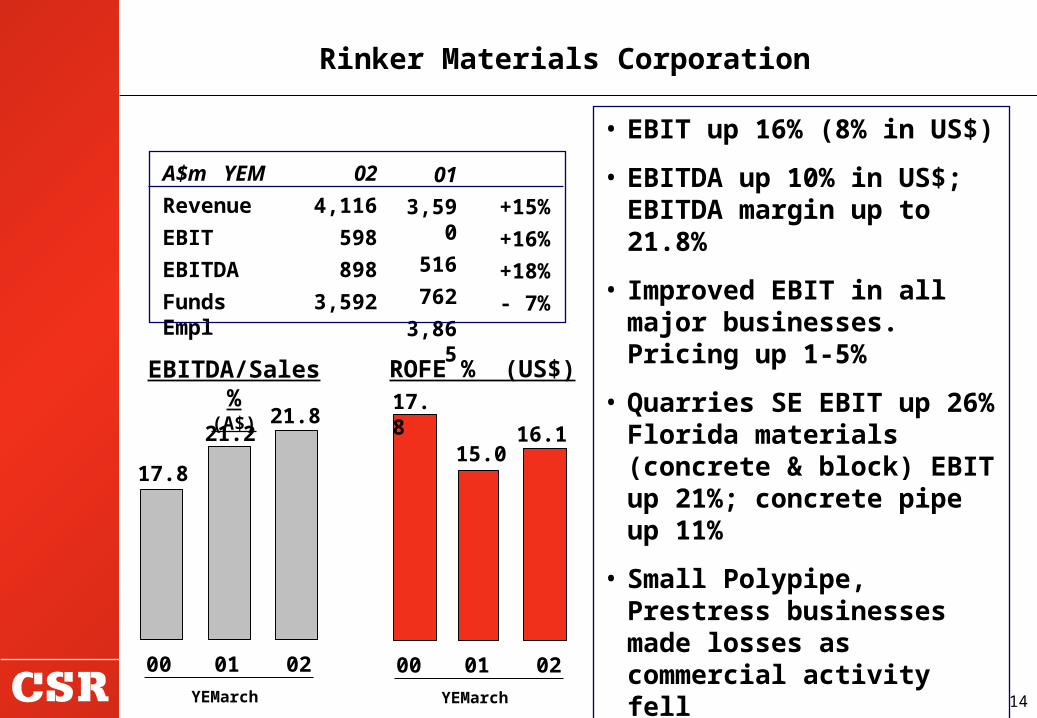
• EBIT up 16% (8% in US$)
• EBITDA up 10% in US$; EBITDA margin up to 21.8%
• Improved EBIT in all major businesses. Pricing up 1-5%
• Quarries SE EBIT up 26% Florida materials (concrete & block) EBIT up 21%; concrete pipe up 11%
• Small Polypipe, Prestress businesses made losses as commercial activity fell
• Gypsum Supply profit down US$8m as demand-supply conditions back to normal
Rinker Materials Corporation
EBITDA/Sales %
(A$)
17.8
21.2
ROFE % (US$)17.8
15.016.1
21.8
A$m YEM
Revenue
EBIT
EBITDA
Funds Empl
02
4,116
598
898
3,592
01
3,590
516
762
3,865
+15
%
+16%
+18%
- 7%
00 01YEMarch
02 00 01YEMarch
02
15
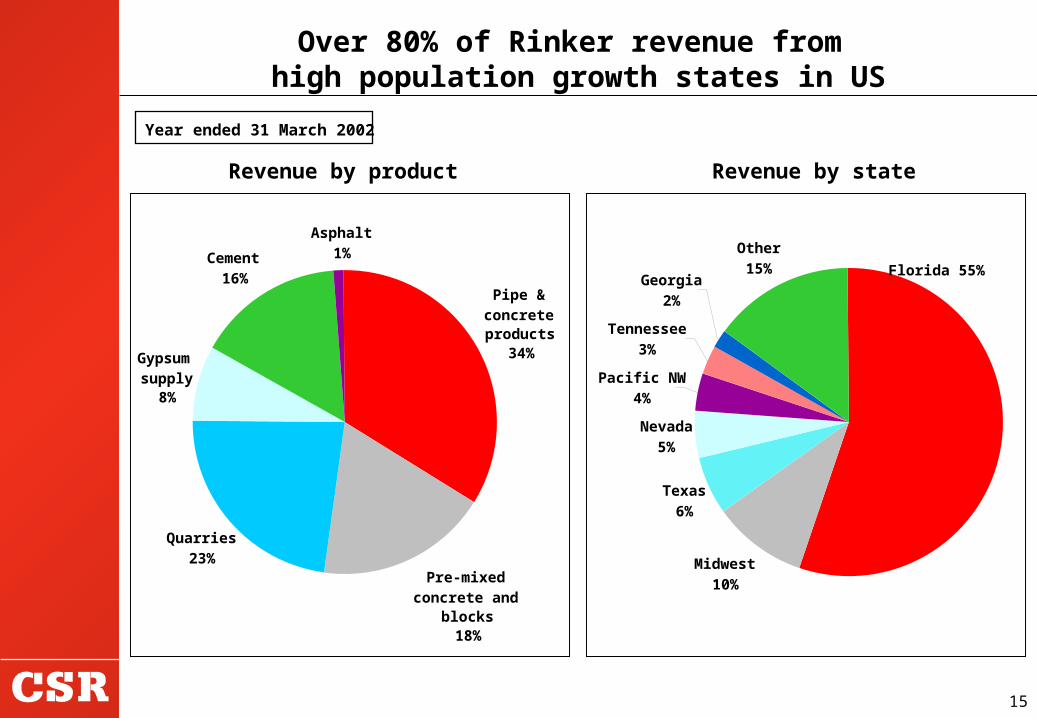
Pipe & concrete products
34%
Quarries23%
Gypsum supply
8%
Cement16%
Asphalt1%
Pre-mixed concrete and
blocks18%
Over 80% of Rinker revenue from high population growth states in US
Revenue by product Revenue by state
Year ended 31 March 2002
Florida 55%
Texas
6%
Nevada
5%
Pacific NW
4%
Tennessee
3%
Georgia
2%
Other
15%
Midwest
10%
16
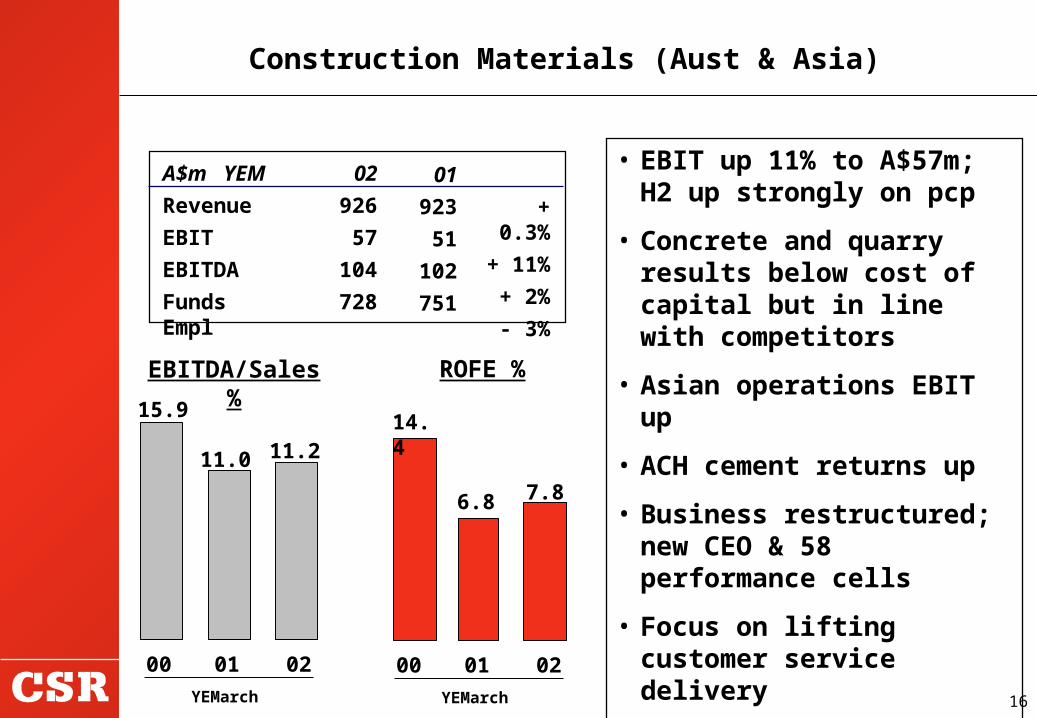
• EBIT up 11% to A$57m; H2 up strongly on pcp
• Concrete and quarry results below cost of capital but in line with competitors
• Asian operations EBIT up
• ACH cement returns up
• Business restructured; new CEO & 58 performance cells
• Focus on lifting customer service delivery
• Price rises from 1 April 02
• Further increase later in year
Construction Materials (Aust & Asia)
EBITDA/Sales %15.9
11.0
ROFE %
14.4
6.8 7.8
11.2
A$m YEM
Revenue
EBIT
EBITDA
Funds Empl
02
926
57
104
728
01
923
51
102
751
+ 0.3%
+ 11%
+ 2%
- 3%
00 01YEMarch
02 00 01YEMarch
02
17
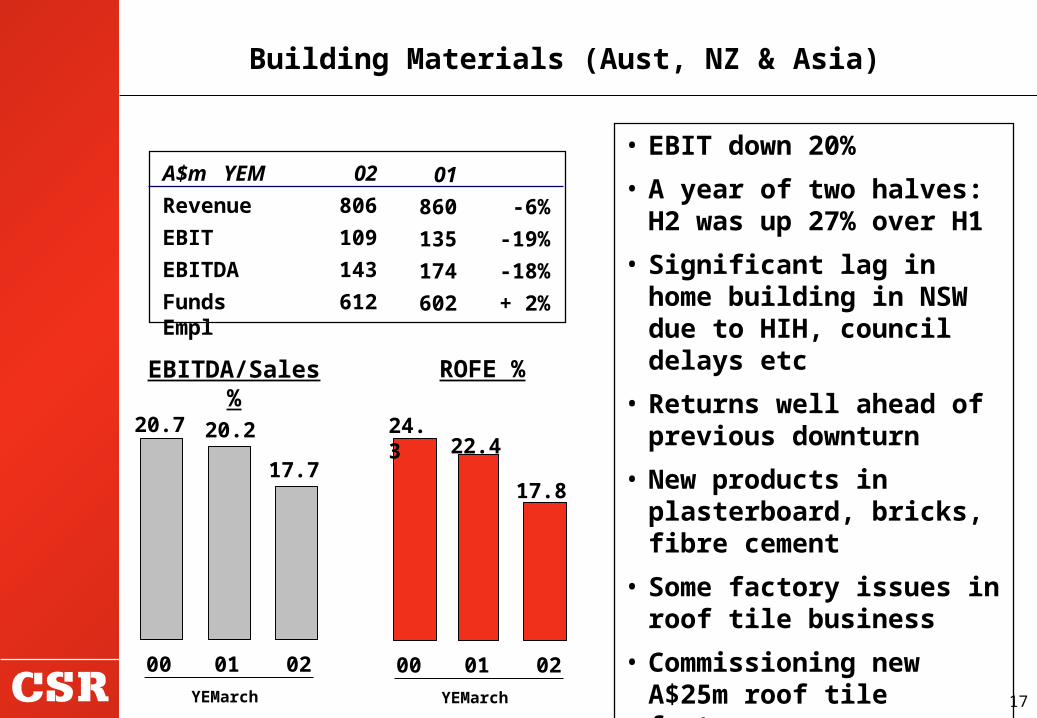
Building Materials (Aust, NZ & Asia)
EBITDA/Sales %
20.7 20.2
ROFE %
24.3 22.4
17.817.7
A$m YEM
Revenue
EBIT
EBITDA
Funds Empl
02
806
109
143
612
01
860
135
174
602
-6%
-19%
-18%
+ 2%
• EBIT down 20%
• A year of two halves: H2 was up 27% over H1
• Significant lag in home building in NSW due to HIH, council delays etc
• Returns well ahead of previous downturn
• New products in plasterboard, bricks, fibre cement
• Some factory issues in roof tile business
• Commissioning new A$25m roof tile factory00 01
YEMarch
02 00 01YEMarch
02
18
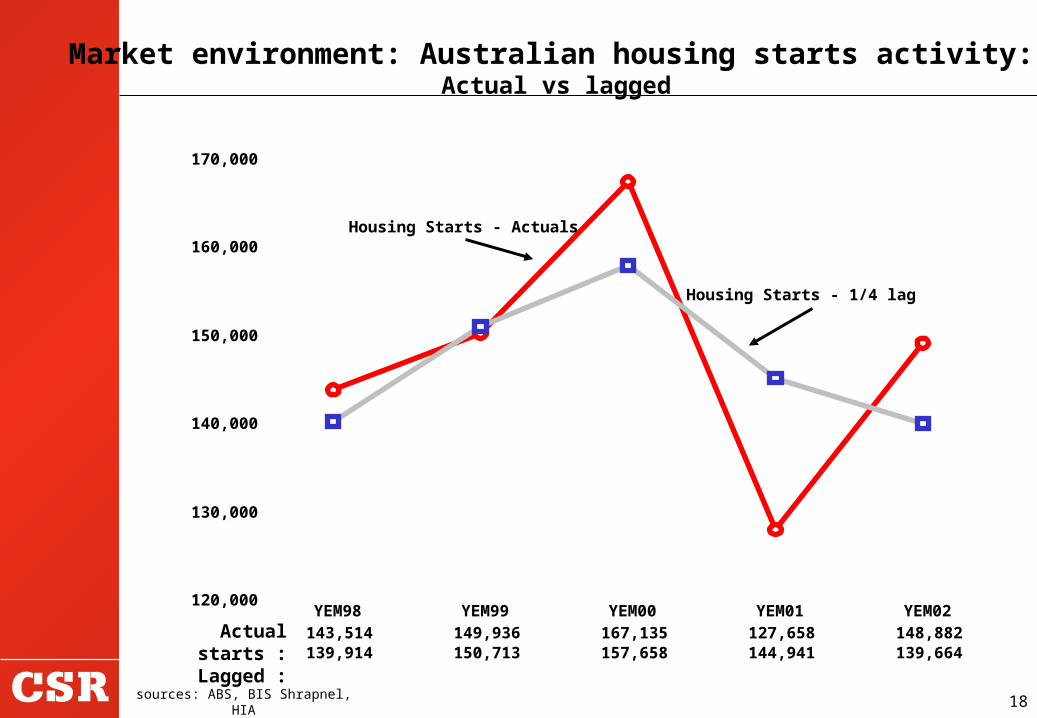
Market environment: Australian housing starts activity:
Actual vs lagged
sources: ABS, BIS Shrapnel, HIA
120,000
130,000
140,000
150,000
160,000
170,000
143,514 149,936 167,135 127,658 148,882 139,914 150,713 157,658 144,941 139,664
YEM98 YEM99 YEM00 YEM01 YEM02
Housing Starts - 1/4 lag
Housing Starts - Actuals
Actual starts :
Lagged :

19
• EBIT up significantly to A$74m mainly on higher world prices
• Crop size still disappointing
• Tonnes crushed at 11.6mt, up 2% in Qld on pcp
• Distilleries improved returns
• Refining EBIT recovered in H2, NZ performing strongly
Milling Refineries Distilleries Other
A$m YEM
Revenue
EBIT
EBITDA
Funds Empl
02
694
74
110
698
01
529
16
54
757
+31%
+347%
+106%
-8%
Sugar EBIT up
year-ended March
0
25
50
75
100
98 99 00 01 02
A$
m E
BIT
$97m$88m
$45m
$17m
$74m
20
Improving CSR Sugar’s earnings profile
•Low cost, high return investment opportunities
•Help stabilise earnings stream
•Co-generation – “green” electricity. Currently only significant in 1 of 7 mills
•Distilleries - expanding production of ethanol for bio-fuel blends
•A$150m industry-wide productivity program underway
21
$1412
YEM01 YEM02
GAF EBIT A$M
GAL EBIT A$M
YEM 00 01 02
164160
$1544
Aluminium tonnes sold ‘000
Avge US$/tonne world aluminium price
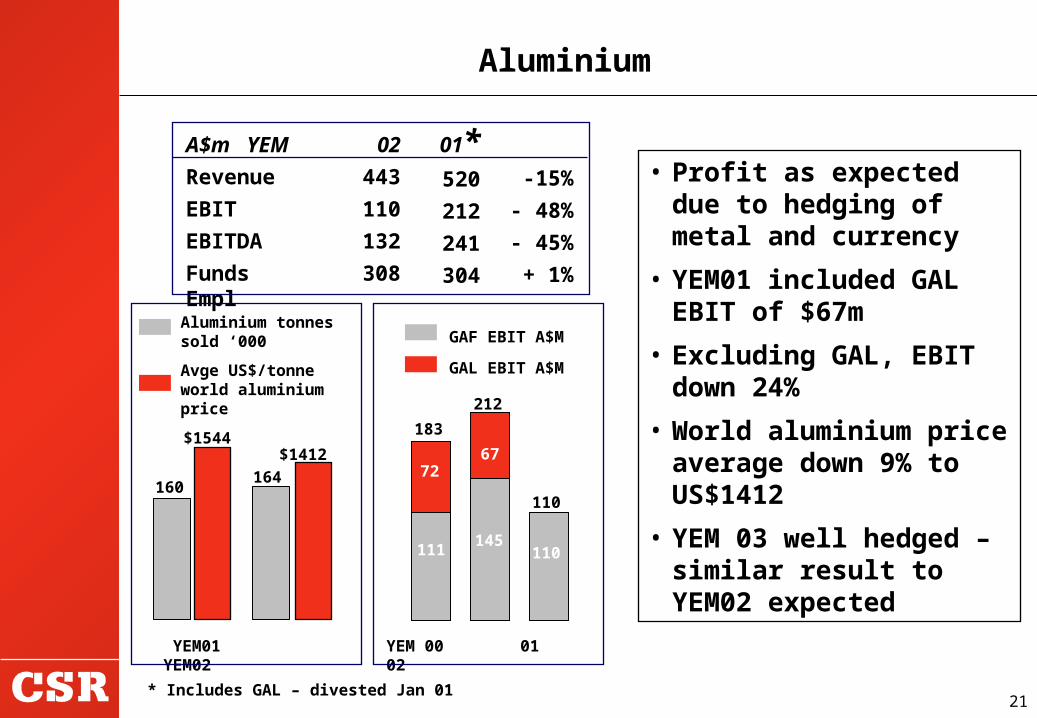
A$m YEM
Revenue
EBIT
EBITDA
Funds Empl
02
443
110
132
308
01*520
212
241
304
-15%
- 48%
- 45%
+ 1%
Aluminium
• Profit as expected due to hedging of metal and currency
• YEM01 included GAL EBIT of $67m
• Excluding GAL, EBIT down 24%
• World aluminium price average down 9% to US$1412
• YEM 03 well hedged – similar result to YEM02 expected
* Includes GAL – divested Jan 01
110
183
111145
212
7267
110
22
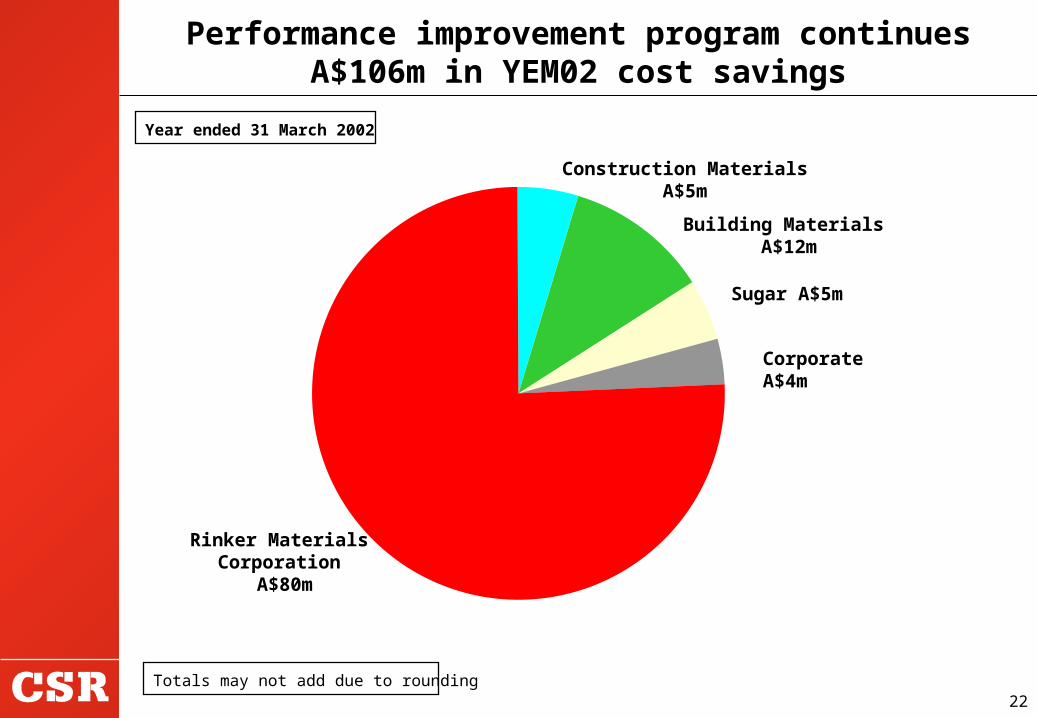
Performance improvement program continuesA$106m in YEM02 cost savings
Year ended 31 March 2002
Totals may not add due to rounding
Construction Materials A$5m
Building Materials A$12m
Sugar A$5m
Corporate A$4m
Rinker Materials Corporation
A$80m
23
Part 1 Group financial performance
Part 2 Business performance
Part 3 Strategy
Part 4Part 4 Outlook
Agenda
24
CSR group strategy - Growth in heavy building materials and separating other assets for value
•Develop CSR as a focused, high performing, heavy building materials group, growing internationally
•Use shareholder value as decision driver
•Employ full gamut of value levers to drive value from portfolio
•Pursue growth & portfolio rationalisation in parallel
•Recognise that most parts of portfolio are cyclical and that cyclical issues will influence timing
•Growth focus is heavy building materials, mainly in Rinker in the US
25
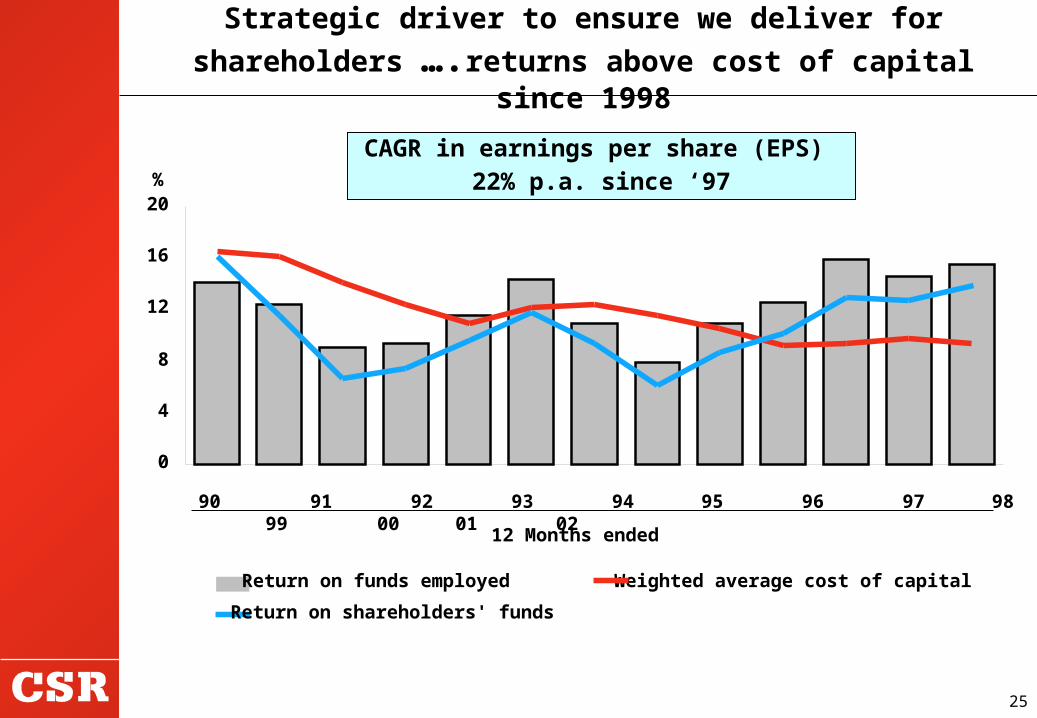
Strategic driver to ensure we deliver for
shareholders ….returns above cost of capital since 1998
0
4
8
12
16
20
90 91 92 93 94 95 96 97 98 99 00 01 02
12 Months ended
%
Return on funds employed Weighted average cost of capital
Return on shareholders' funds
CAGR in earnings per share (EPS) 22% p.a. since ‘97
26
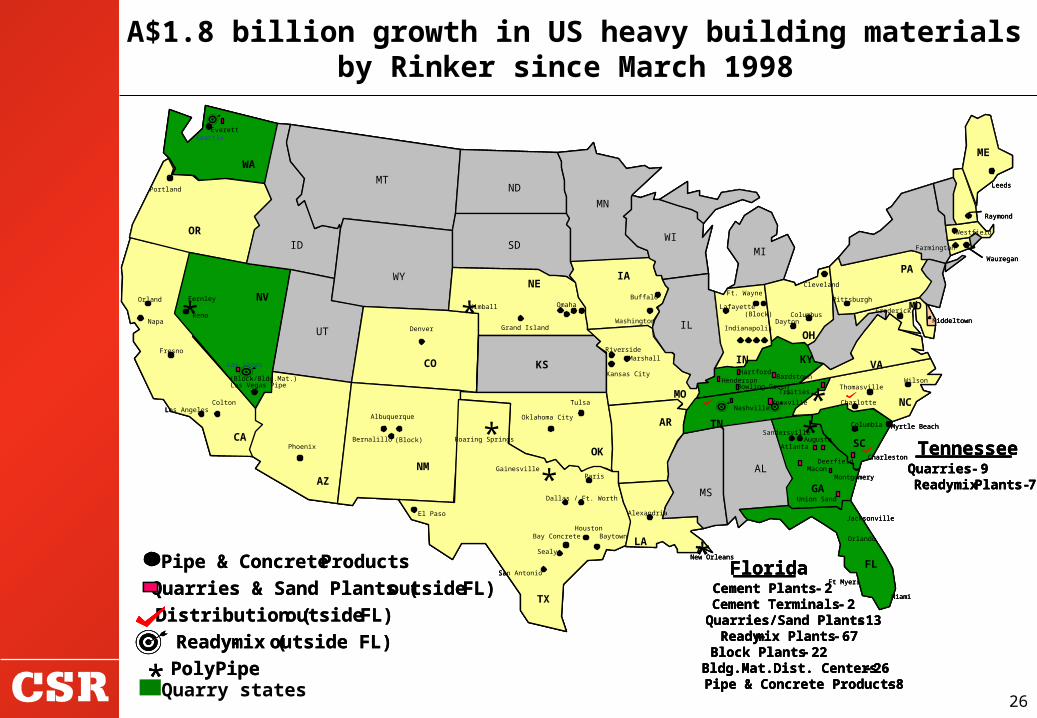
A$1.8 billion growth in US heavy building materialsby Rinker since March 1998
Pipe & Concrete Products
Quarries & Sand Plants (outside FL)
Distribution (outside FL)
Ready-mix (outside FL)
PolyPipe
Phoenix
Colton
Fresno
Napa
Orland
Denver
Sandersville
MarshallRiverside
Wilson
Bernalillo
Las Vegas
Oklahoma CityColumbia
El Paso
Dayton
Gainesville
Tulsa
(Block)
Cleveland
Deerfield
CA
WA
OR
NV
AZ
CO
NM
TX
NE
OK
MO
AR
LA
IN
OH
PA
MD
VA
NC
SC
GA
FL
KY
TN
Ft. Wayne
Indianapolis
Lafayette
Henderson
Kimball
Bay Concrete
Thomasville
SeattleEverett
Albuquerque
Reno
Augusta
(Block)
Dallas / Ft. Worth
San Antonio
Portland
Omaha
Knoxville
Columbus
Pittsburgh
Frederick
Charlotte
Macon
Atlanta
Fernley
Los Angeles
WY
KS
Paris
Alexandria
New Orleans
Union Sand
Orlando
Miami
Ft Myers
Florida
Wauregan
Farmington
Westfield
Raymond
Middeltown
Las Vegas Pipe
Cement Plants - 2Cement Terminals - 2Quarries/Sand Plants - 13Ready-mix Plants - 67Block Plants - 22Bldg.Mat.Dist. Centers - 26Pipe & Concrete Products - 8
Nashville
Charleston
Jacksonville
IA
Grand IslandWashington
Kansas City
Tri-cities
ME
Leeds
Montgomery
TennesseeQuarries - 9Readymix Plants -7
(Block/Bldg.Mat.)
Buffalo
Sealy
Baytown
*
*
*
*
**
Hartford
Bowling Green
Bardstown
MT
ID
ND
SD
UT
MN
WIMI
IL
MS
AL
*Roaring Springs
Myrtle Beach
*Houston
Quarry states
27
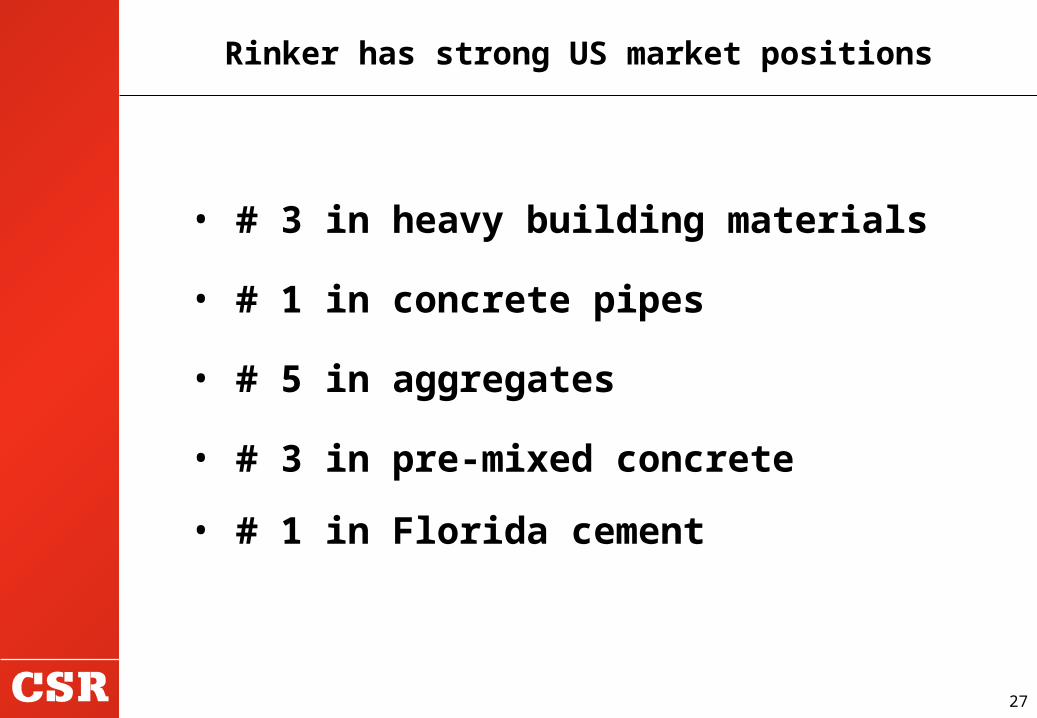
• # 3 in heavy building materials
• # 1 in concrete pipes
• # 5 in aggregates
• # 3 in pre-mixed concrete
• # 1 in Florida cement
Rinker has strong US market positions
28
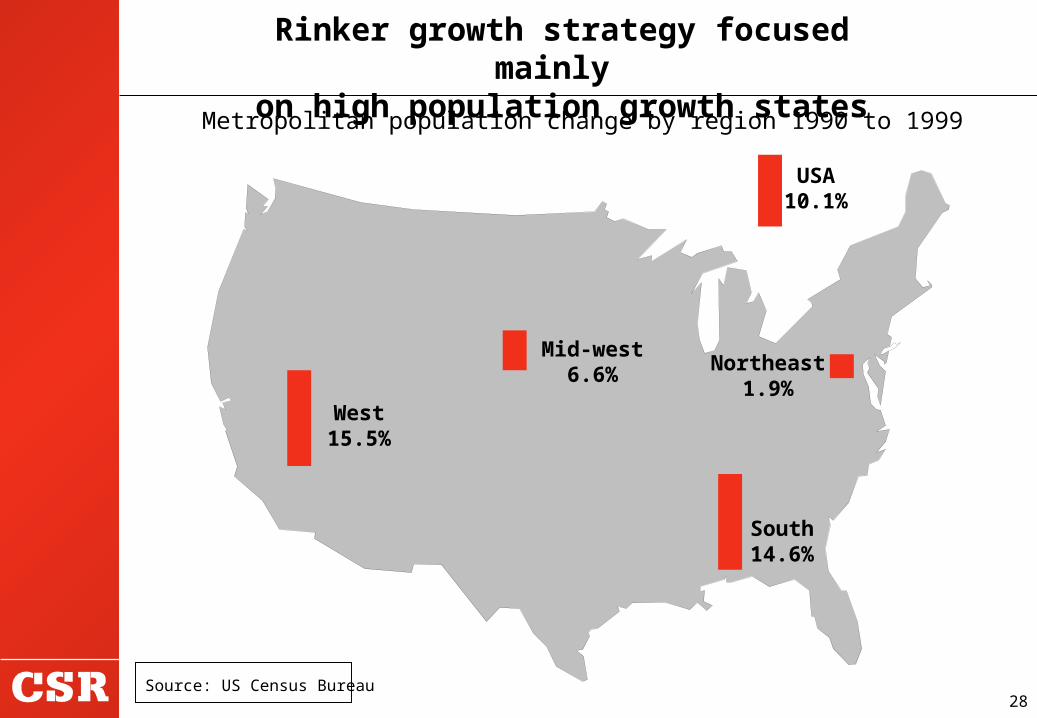
Rinker growth strategy focused mainly
on high population growth states
West15.5%
USA10.1%
Northeast1.9%
South14.6%
Mid-west6.6%
Metropolitan population change by region 1990 to 1999
Source: US Census Bureau
29
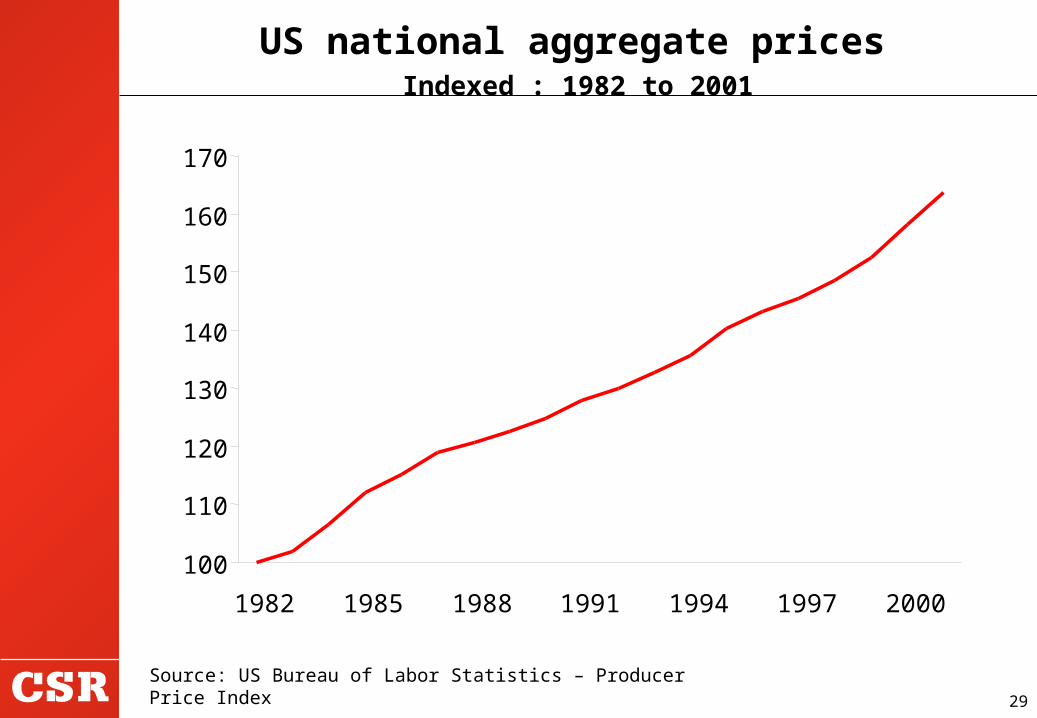
US national aggregate prices Indexed : 1982 to 2001
100
110
120
130
140
150
160
170
1982 1985 1988 1991 1994 1997 2000
Source: US Bureau of Labor Statistics – Producer Price Index
30
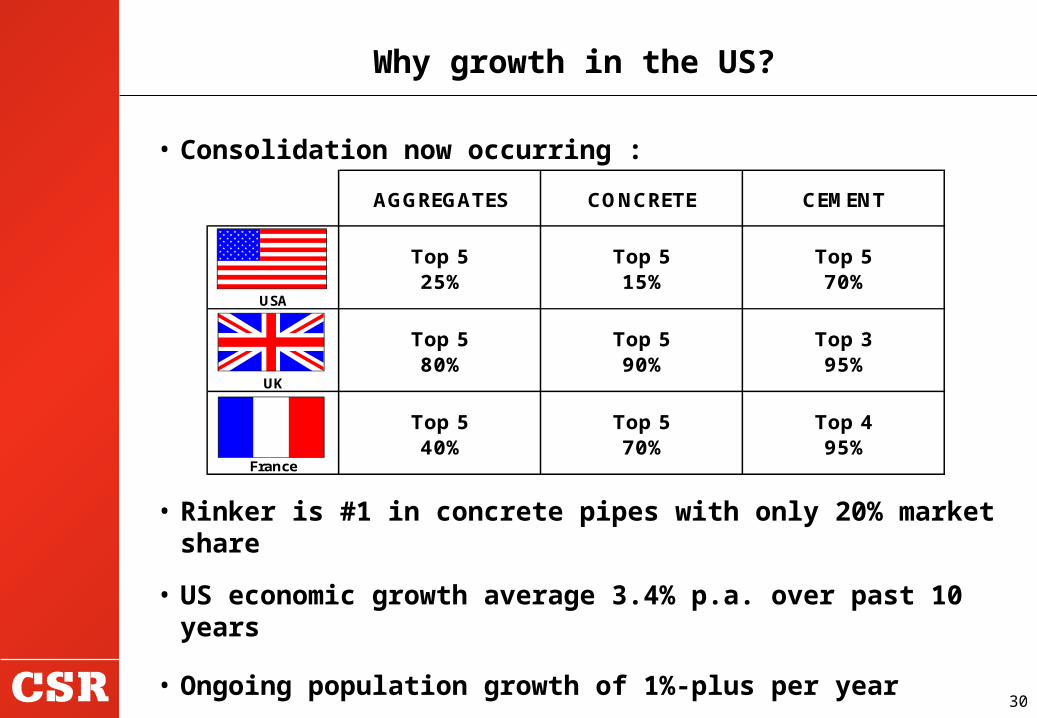
• Consolidation now occurring :
Why growth in the US?
AGGREGATES CONCRETE CEMENT
Top 5 Top 5 Top 5
USA25% 15% 70%
Top 5 Top 5 Top 3
UK80% 90% 95%
Top 5 Top 5 Top 4
France40% 70% 95%
• Rinker is #1 in concrete pipes with only 20% market share
• US economic growth average 3.4% p.a. over past 10 years
• Ongoing population growth of 1%-plus per year
• High performance and environmental standards required.
31
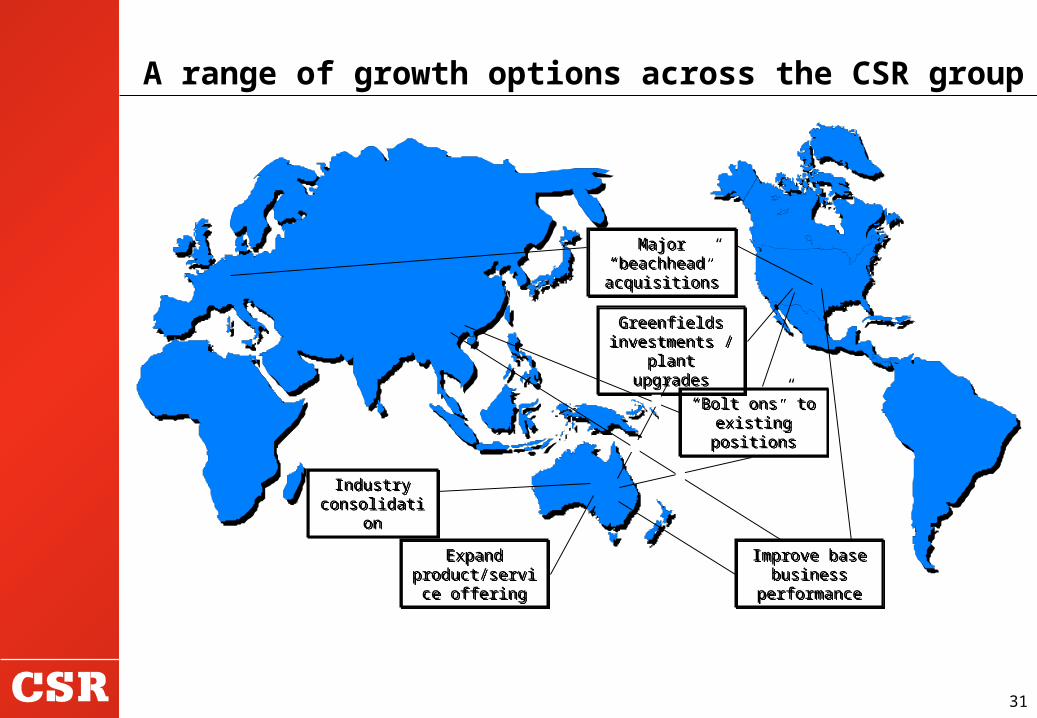
A range of growth options across the CSR group
Industry consolidation
Industry consolidation
Expand product/service
offering
Expand product/service
offering
Improve base business
performance
Improve base business
performance
“Bolt ons” to existing positions
“Bolt ons” to existing positions
Major “beachhead” acquisitions
Major “beachhead” acquisitions
Greenfields investments /
plant upgrades
Greenfields investments /
plant upgrades
32
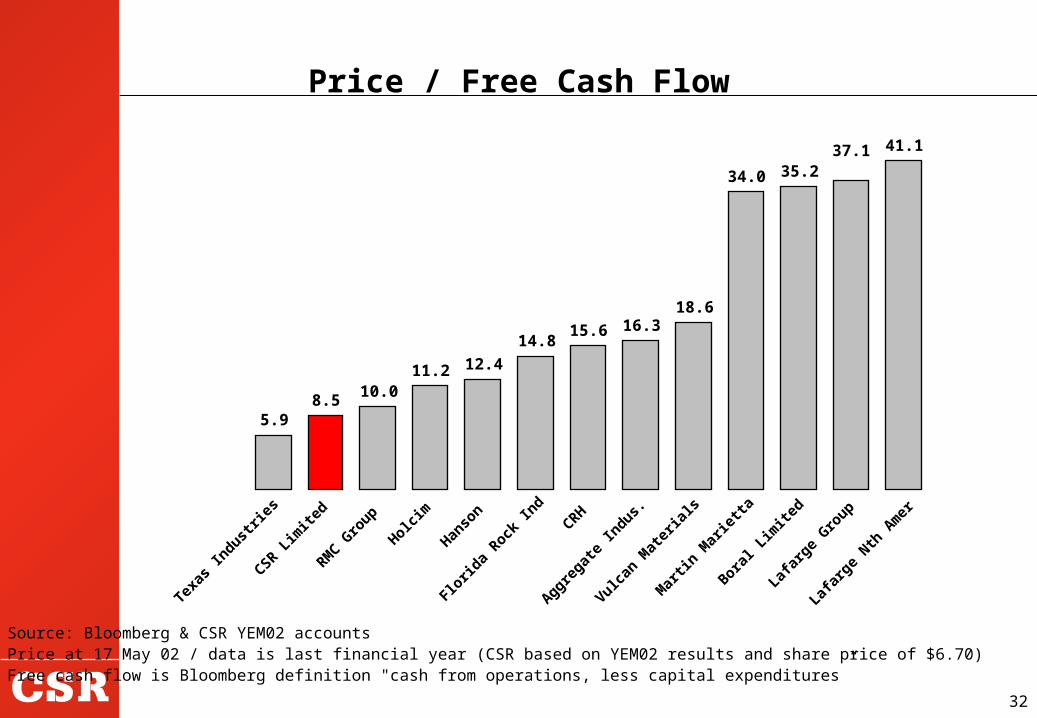
Price / Free Cash Flow
5.98.5
10.011.2 12.4
14.815.6 16.3
18.6
34.0 35.237.1 41.1
Texas
Indust
ries
CSR Lim
ited
RMC G
roup
Holcim
Hanso
n
Florid
a Rock
Ind
CRH
Aggregat
e In
dus.
Vulcan
Mat
eria
ls
Mar
tin M
arie
tta
Boral L
imite
d
Lafar
ge Nth
Am
er
Lafar
ge Gro
up
Source: Bloomberg & CSR YEM02 accounts Price at 17 May 02 / data is last financial year (CSR based on YEM02 results and share price of $6.70)Free cash flow is Bloomberg definition "cash from operations, less capital expenditures”

33
EV / EBITDA
5.96.9 7.2
7.3 7.5 7.9 7.9 7.9 8.2 8.38.8 8.9
10.2
17.0
CSR Lim
ited
Lafa
rge
Nth A
mer
RMC G
roup
Aggre
gate
Indu
s.Han
son
Flor
ida
Rock
Ind
Mar
tin M
arie
ttaTe
xas
Indu
strie
sHol
cim
CRH
Lafa
rge
Gro
upJa
mes
Har
die
Source: Bloomberg & CSR YEM02 accounts EBITDA is Bloomberg definition. CSR number includes share of associates incomeEV based on market cap as at 17 May 02 - CSR share price = $6.70; other financial data T12 months
Vulca
n M
ater
ials
Boral
Lim
ited
34
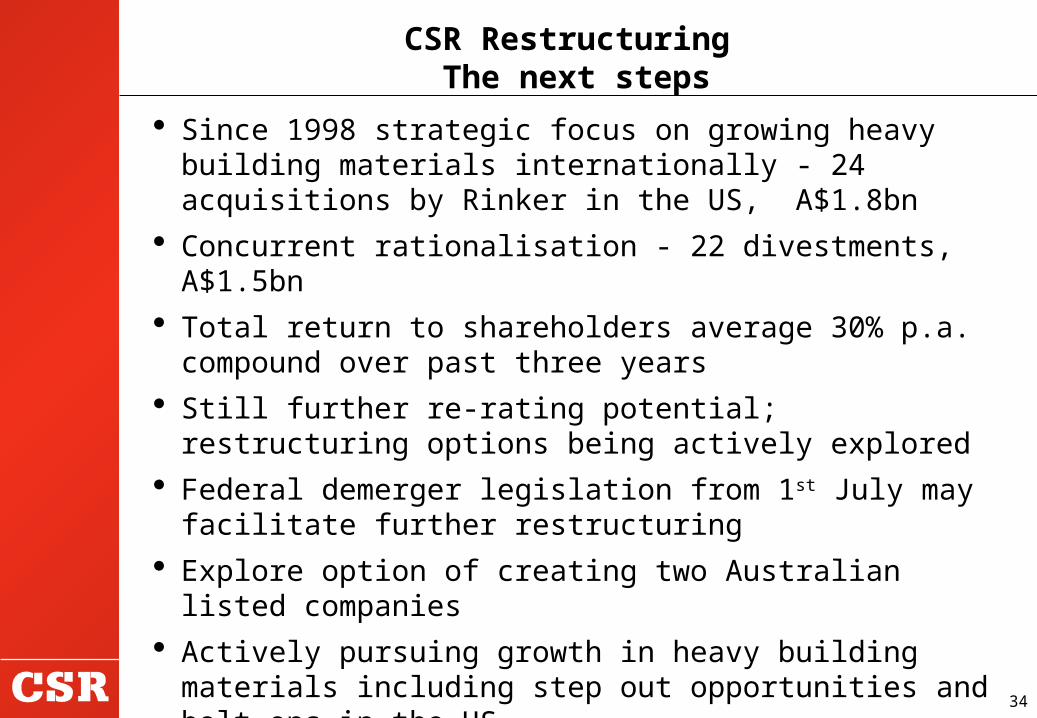
Since 1998 strategic focus on growing heavy building materials internationally - 24 acquisitions by Rinker in the US, A$1.8bn
Concurrent rationalisation - 22 divestments, A$1.5bn Total return to shareholders average 30% p.a.
compound over past three years Still further re-rating potential; restructuring options
being actively explored Federal demerger legislation from 1st July may facilitate
further restructuring Explore option of creating two Australian listed
companies Actively pursuing growth in heavy building materials
including step out opportunities and bolt ons in the US
CSR Restructuring The next steps
35
Part 1 Group financial performance
Part 2 Business performance
Part 3Part 3 Strategy
Part 4 Outlook
Agenda
36
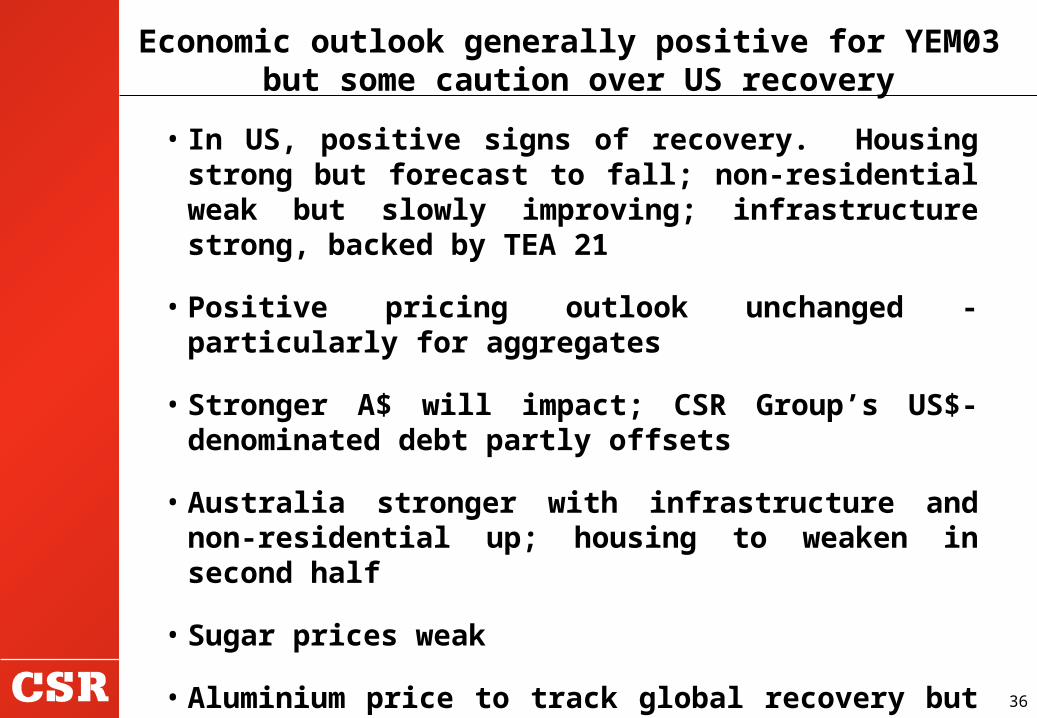
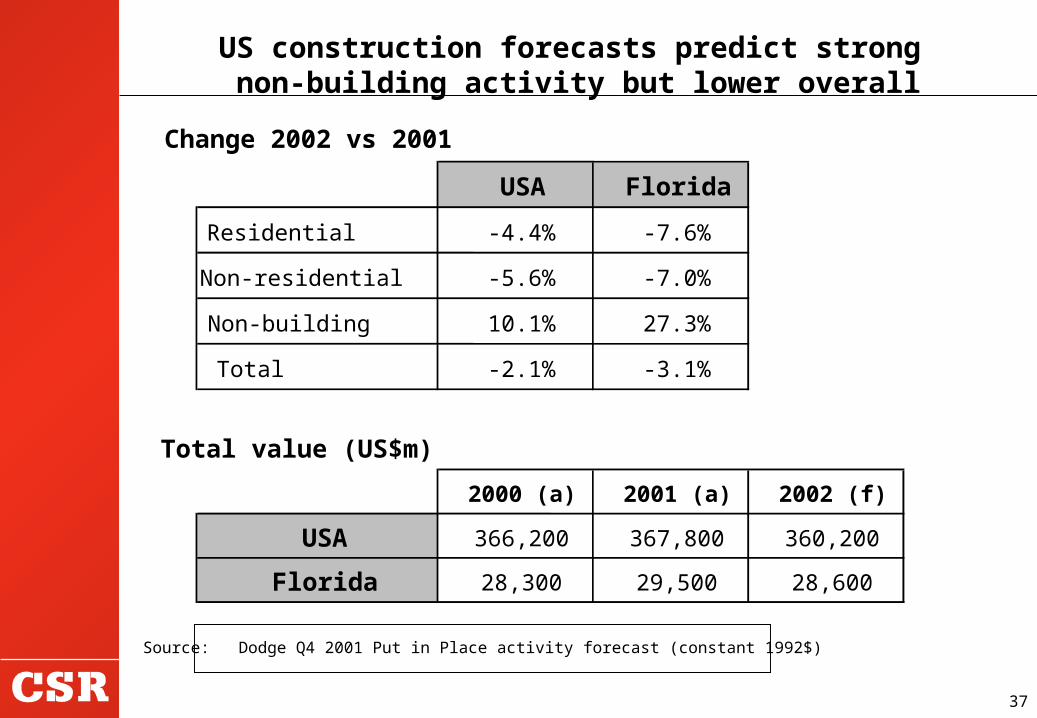
• In US, positive signs of recovery. Housing strong but forecast to fall; non-residential weak but slowly improving; infrastructure strong, backed by TEA 21
• Positive pricing outlook unchanged - particularly for aggregates
• Stronger A$ will impact; CSR Group’s US$-denominated debt partly offsets
• Australia stronger with infrastructure and non-residential up; housing to weaken in second half
• Sugar prices weak
• Aluminium price to track global recovery but hedging will mean similar EBIT result
Economic outlook generally positive for YEM03 but some caution over US recovery
37
Source: Dodge Q4 2001 Put in Place activity forecast (constant 1992$)
US construction forecasts predict strong non-building activity but lower overall
Change 2002 vs 2001
USA Florida
Residential -4.4% -7.6%
Non-residential -5.6% -7.0%
Non-building 10.1% 27.3%
Total -2.1% -3.1%
Total value (US$m)
2000 (a) 2001 (a) 2002 (f)
USA 366,200 367,800 360,200
Florida 28,300 29,500 28,600
38
YEM98(actual)
YEM99(actual)
YEM00(actual)
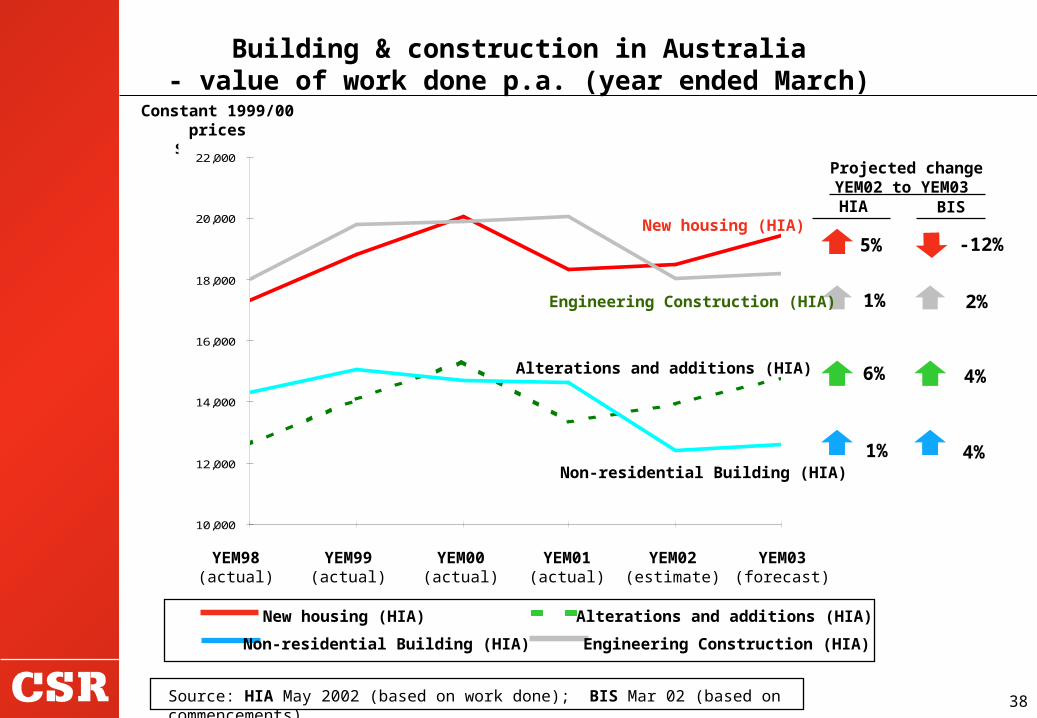
New housing (HIA) Alterations and additions (HIA)
Non-residential Building (HIA) Engineering Construction (HIA)
Constant 1999/00 prices$ million
Building & construction in Australia- value of work done p.a. (year ended March)
Source: HIA May 2002 (based on work done); BIS Mar 02 (based on commencements)
HIA
Projected change YEM02 to YEM03
-12%
1%
5%
6%
1%
BIS
2%
4%
4%
YEM01(actual)
YEM02(estimate)
YEM03(forecast)
10,000
12,000
14,000
16,000
18,000
20,000
22,000
Non-residential Building (HIA)
Alterations and additions (HIA)
Engineering Construction (HIA)
New housing (HIA)
39
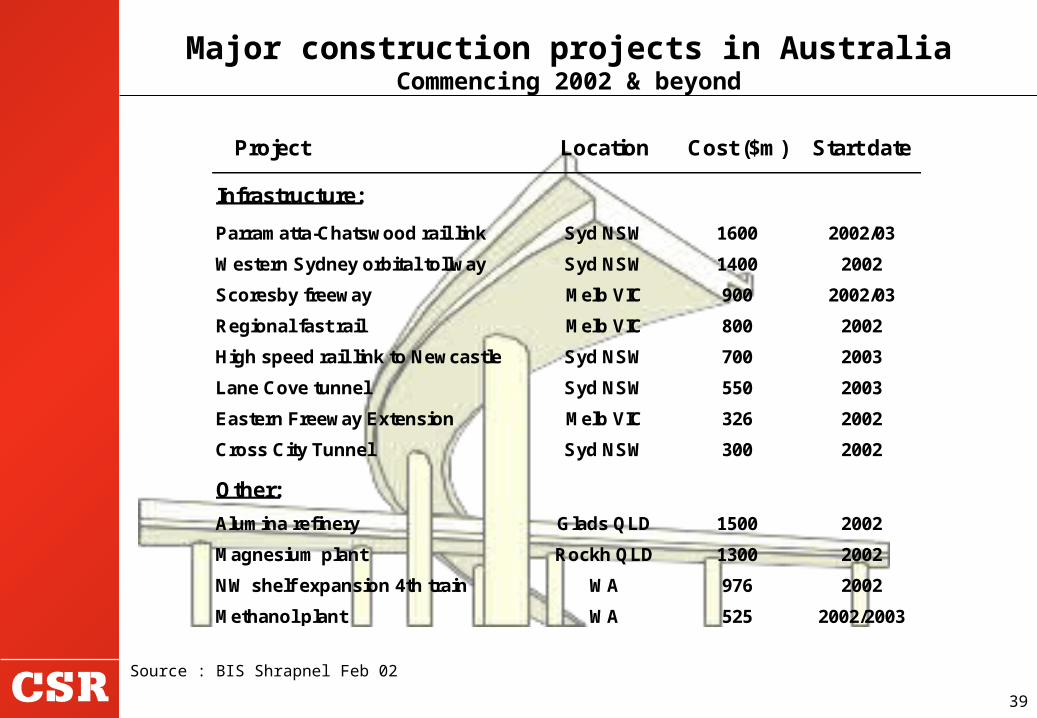
Major construction projects in AustraliaCommencing 2002 & beyond
Source : BIS Shrapnel Feb 02
Project Location Cost ($m) Start date
Infrastructure:
Parramatta-Chatswood rail link Syd NSW 1600 2002/03
Western Sydney orbital tollway Syd NSW 1400 2002
Scoresby freeway Melb VIC 900 2002/03
Regional fast rail Melb VIC 800 2002
High speed rail link to Newcastle Syd NSW 700 2003
Lane Cove tunnel Syd NSW 550 2003
Eastern Freeway Extension Melb VIC 326 2002
Cross City Tunnel Syd NSW 300 2002
Other:
Alumina refinery Glads QLD 1500 2002
Magnesium plant Rockh QLD 1300 2002
NW shelf expansion 4th train WA 976 2002
Methanol plant WA 525 2002/2003
40
• Actively pursuing US growth; bolt-ons plus larger acquisitions if value and synergies available to Rinker
• Australian construction materials volumes to lift as economic cycle turns up; price rises repairing profit
• Building Materials should see some pick up overall in another year of two very different halves
• Asian operations also stronger, particularly China
• But US economy and stronger $A may offset gains
• YEM02 A$41m tax refund benefit not in YEM03 PAT
•Overall, cautiously optimistic about a solid result
Ongoing growth and Australian construction recovery will lift YEM03 profit but US economy
and A$ may offset
41
CSR group priorities for YEM03
Further improve safety and environmental performance
Instil a high performance culture across the group
Continue to improve the performance of all businesses, particularly Construction Materials
Actively pursue international growth in heavy building materials
Expedite the separation of assets