Embed Size (px)
Citation preview
A Remotely-Controlled, Semi-Automatic Target System for Rutherford Backscattering 1 Spectrometry and Elastic Recoil Detection Analyses of Polymeric Membrane Samples 2 3 P.J. Attayeka,b, E.S. Meyera, L. Lina, G.C. Richc,d, T.B. Cleggc,d, O. Coronella,* 4 aDepartment of Environmental Sciences and Engineering, Gillings School of Global Public 5 Health, University of North Carolina at Chapel Hill, Chapel Hill, NC 27599-7431 6 bDepartment of Biomedical Engineering, University of North Carolina at Chapel Hill, Chapel 7 Hill, NC 27599-7575 8 cTriangle Universities Nuclear Laboratory (TUNL), Durham, NC 27708-0308 9 dDepartment of Physics and Astronomy, University of North Carolina at Chapel Hill, Chapel 10 Hill, NC 27599-3255 11 *
13
Corresponding author [tel:+1-919-966-9010; fax:+1-919-966-7911; e-mail: [email protected]] 12
Abstract: A new target system for Rutherford backscattering spectrometry and elastic recoil 14
detection analysis is described which enables remotely controlled, semi-automatic analysis of 15
multiple organic polymer samples without exceeding damaging incident beam fluences. Control 16
of fluence at a given beam current is achieved using two stepper motors to move a thin 17
aluminum disc loaded with polymer samples both radially and azimuthally across the beam. 18
Flexible beam spot locations and sample irradiation times are remotely controlled in two steps 19
via two custom LabVIEWTM programs. In the first step, a digital image of the target disc is 20
converted into precise radial and azimuthal coordinates for each mounted polymer sample. In 21
the second step, the motors implement the user-directed sample irradiation and fluence. 22
Schematics of the target system hardware, a block diagram of interactions between the target 23
system components, a description of routine procedures, and illustrative data taken with a 2-MeV 24
4He2+
Key Words: Rutherford backscattering spectrometry, elastic recoil detection, membranes, thin 26
film composite, reverse osmosis, nanofiltration 27
analysis beam are provided. 25
28
29
1. Introduction 30
31
Rutherford backscattering spectrometry (RBS) has recently been used as an analytical technique 32
to study the physico-chemical properties of the active layers of thin-film composite membranes 33
for water purification [1-9]. Thin-film composite membranes used in applications such as 34
reverse osmosis and nanofiltration consist of an ultrathin (~50−200 nm) organic active layer that 35
lies on top of an intermediate polysulfone support (~30 µm) backed by a polyester fabric (~200 36
µm) [10, 11]. The performance of such thin-film composite membranes, in terms of water 37
permeation and contaminant rejection, is mostly determined by their active layer [10, 11]. As a 38
result, the development of new improved membranes significantly benefits from studying the 39
physico-chemical properties of the active layers and their interactions with water and 40
contaminants. The recently published [1-6, 8] membrane characterization procedures that use 41
RBS for sample analysis take advantage of the ability of RBS to resolve the active layer from 42
their significantly thicker polysulfone and polyester supports [2, 5, 12]. 43
44
During RBS analyses, a high-energy ion beam (e.g., 2-MeV 4He+ [2, 5]) is used to irradiate the 45
target sample, and the spectrum resulting from the backscattered ions is analyzed to obtain the 46
elemental composition of the irradiated sample with nanometer depth resolution [2, 5, 12]. 47
Unfortunately, beam irradiation of organic polymers results in polymer degradation [13-17] with 48
a corresponding emission of beam-generated small molecules [13, 14] that leads to a changing 49
elemental composition of the irradiated sample as a function of beam ion fluence [13-15, 17]. 50
Studies [13, 16, 17] of polymer degradation upon beam irradiation have shown, however, that 51
induced changes in the elemental composition of irradiated samples can be neglected below 52

fluence thresholds that depend on the polymer analyzed. Among the materials relevant to the 53
structure of thin-film composite membranes, polysulfone has shown the lowest fluence threshold 54
value at 3×10¹⁴ ions/cm2 using a 2-MeV 4He+
56
ion beam [17]. 55
For RBS to be useful in the study of the properties of the active layers of thin-film composite 57
membranes [1-9], the beam ion fluence is maintained below the threshold values where changes 58
in the elemental composition of the sample analyzed would be detected. Given that the elements 59
(i.e., H, C, O, N, S) that make up thin-film composite membranes have relatively small scattering 60
cross sections (0-342 mb/sr) [12], the only possible strategy to avoid exceeding fluence threshold 61
values, while obtaining enough counts to quantify accurately the sample elemental composition, 62
is to scan a relatively large area (e.g., a few square centimeters) with the analysis beam. One 63
achieves this either by analyzing multiple points of the membrane sample or by continuously 64
scanning the ion beam over the sample [2-8]. Such scanning patterns have been achieved by 65
continual manual positioning of scattering target stages, a technique which is highly impractical 66
for analysis of multiple samples. Active layers of thin-film composite membranes can also be 67
studied after isolating the active layer on a solid surface by peeling off the polyester backing and 68
dissolving the polysulfone support using organic solvents [18-21]. Isolated active layers are 69
generally relatively small (i.e., a few square centimeters) and irregular in shape, and therefore, 70
the RBS analysis of isolated active layers requires both irregular scanning patterns and 71
millimeter-accurate positioning of the beam over the sample to stay within the sample 72
boundaries. 73
74
Thus, an innovative target system is needed to implement practical analysis of multiple organic 75
membrane samples while satisfying the fluence threshold, sample location, and scanning pattern 76
requirements described above. Accordingly, the objective of this work was to design, fabricate 77
and test a scattering target system for RBS analysis, and the sister technique of elastic recoil 78
detection (ERD) analysis, with the following capabilities: (i) remote control; (ii) irradiation of 79
samples according to regular and irregular scanning patterns defined by the user; (iii) positioning 80
of beam on target with millimeter-scale accuracy; and (iv) accommodation of multiple samples 81
of any shape on the sample holder. 82
83
2. Accelerator and Scattering Chamber 84
85
The new RBS/ERD target system utilizes systems associated with the tandem electrostatic 86
accelerator at the Triangle Universities Nuclear Laboratory (TUNL). Existing hardware at 87
TUNL includes a duoplasmatron ion source equipped with a sodium charge-exchange canal used 88
to produce a 30-keV 4He– ion beam which is injected into the accelerator. After initial 89
acceleration to the electrostatic accelerator terminal at 0.67 keV, the 4He– beam is stripped of its 90
electrons in a thin carbon foil inside the terminal, and then further accelerated. The emerging 2-91
MeV 4He2+ beam is momentum selected by deflection (52 degrees) through an analyzing magnet, 92
focused, and transported 15 meters to a multipurpose, aluminum scattering chamber. The 93
chamber is cylindrical in shape with internal diameter and depth of 59.7 cm and 26.0 cm, 94
respectively. The beam enters the chamber through entrance slits of adjustable aperture that 95
typically define a square 3-mm × 3-mm beam cross section. The beam spot on target is located 96
6.4 cm above a bottom plate that holds several detectors of scattered or recoil particles emerging 97
from the polymer film being used as a target. This bottom plate can be rotated while under 98
vacuum around the vertical axis of the chamber to set the desired detector angles. Signals from 99
the detectors are first sent through pre-amplifiers at the scattering chamber before being sent to 100
the accelerator control room for further processing and digitization. 101
102
3. RBS/ERD Target System 103
104
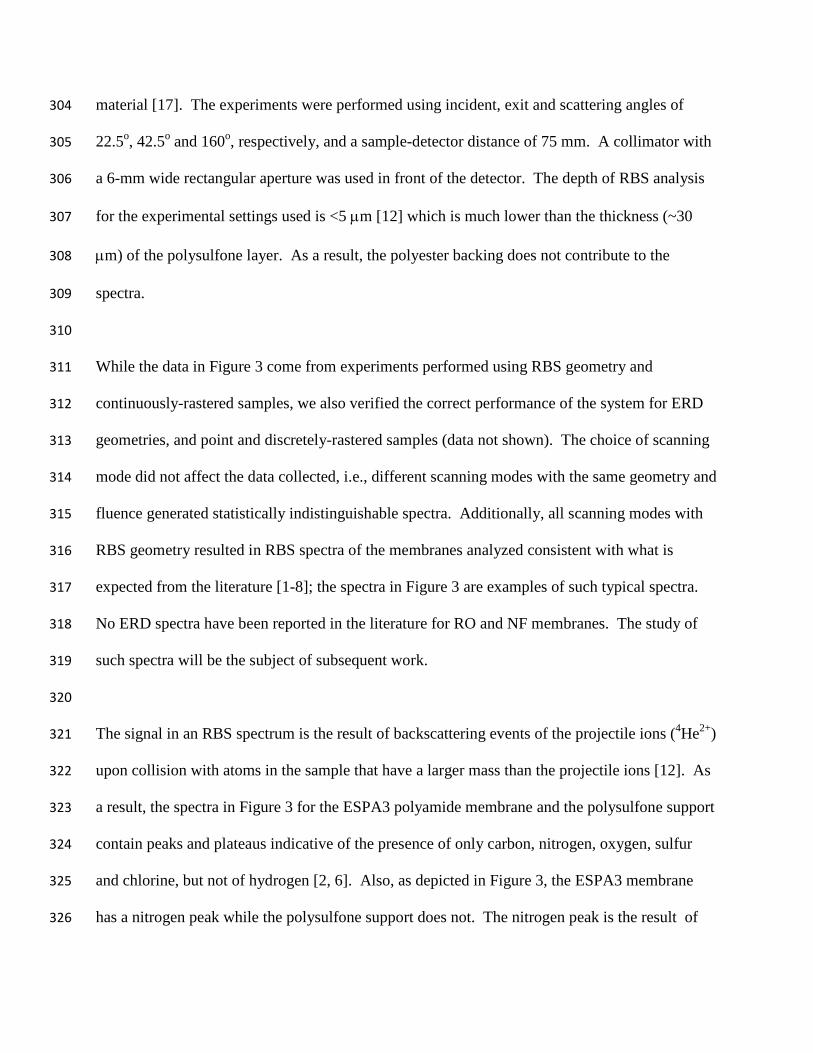
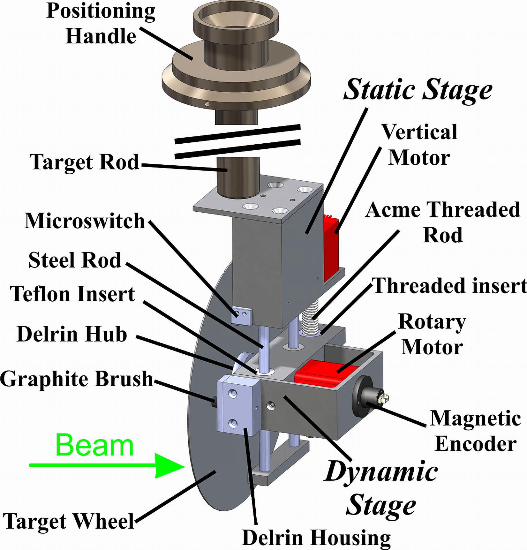
The new RBS/ERD target system consisting of a target rod, static stage, dynamic stage, and 105
target wheel is shown in Figure 1. The target rod secures and locates the rest of the target system 106
precisely inside the scattering chamber and allows for rotation of the system around the central 107
vertical axis of the chamber. The static stage houses a stepper motor that controls vertical 108
movement of the dynamic stage along two precisely located steel rods. The target wheel is 109
attached to a second stepper motor on the dynamic stage which controls its azimuthal motion. 110
The two stepper motors thus move the target wheel vertically and rotate it around its central axis. 111
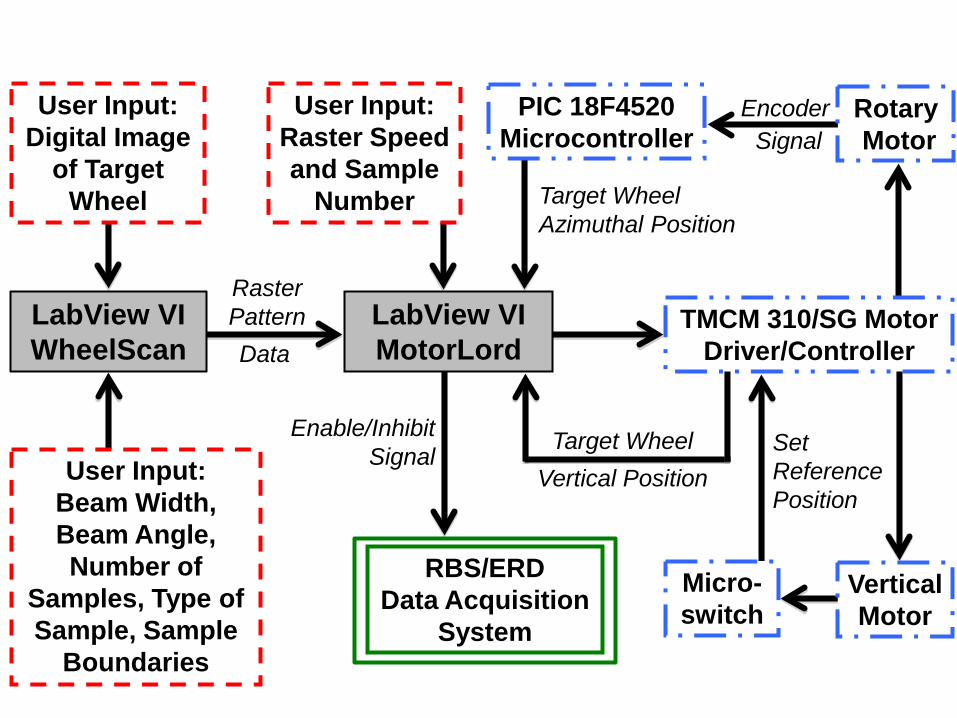
The target system is controlled via two custom LabVIEWTM
119
programs. One program, 112
WheelScan, combines a digital picture of a loaded target wheel with input from the user to 113
establish the movement patterns of the two stepper motors. A second program, MotorLord, then 114
uses data generated by WheelScan to control the two stepper motors, thus implementing desired 115
movements of the target wheel. Figure 2 illustrates the interaction between the hardware, 116
software and user of the target system. Detailed information about all system components is 117
included in the following sections. 118
Insert Figure 1. Size suggestion: 1.5 column 120

Insert Figure 2. Size suggestion: 1.5 column 121
122
3.1. Hardware 123
124
3.1.1. Sample Holder Target Rod 125
126
The nickel-plated brass target rod supporting the sample holder system slides vertically and 127
rotates easily while maintaining a secure vacuum seal with the scattering chamber lid. The 128
positioning handle of the target rod has azimuthal fiducial marks in 5 degree increments to 129
indicate the angle of incidence of the beam with respect to the normal of the target wheel. The 130
positioning handle is also pinned to a frame atop the scattering chamber to support the weight of 131
the sample holder system and align the vertical axis of the rod with the horizontal beam axis. 132
Using an optical transit, the horizontal rotation axis of the target wheel was confirmed to 133
intersect both the axis of the beam and the vertical axis of the rod through the center of the 134
scattering chamber to within 0.5 mm. 135
136
3.1.2. Target Wheel 137
138
The aluminum target wheel, having 15.9-cm outer diameter and 0.8-mm thickness, is designed to 139
be lightweight and to hold as many membrane samples as possible while fitting within the 140
scattering chamber. The 1.59-cm inner diameter of the target wheel fits snugly over a Delrin® 141
hub to define its axial location while providing electrical insulation from the rest of the sample 142
holder apparatus. Four calibration holes, 0.5 mm in diameter, positioned in a 110-mm × 110-mm 143
square grid centered on the axis of the wheel are used as reference points to define the exact 144
position of membrane samples as described in Section 3.2.1. Additionally, the target wheel has 145
an engraved 3.18-cm diameter circle centered on the wheel axis and an engraved chord whose 146
closest point is located 7.6 cm from the center of the target wheel. Samples must lie within these 147
engraved boundaries as the vertical scanning range of the wheel is limited by the size of the 148
scattering chamber. The Delrin®
154
hub at the center of the wheel can easily be detached from and 149
re-attached to the sample holder, allowing for sample loading and removal. Membrane samples 150
may be secured to the wheel by double-sided conductive tape, which inhibits charge build-up 151
and conducts heat to the wheel when beam strikes the membranes, or alternatively by using two 152
perpendicular diametrical arrays of small threaded holes in the wheel to clamp samples in place. 153
3.1.3. Lower Stages 155
156
Two stages, one static and one dynamic, which are attached to the bottom of the target rod house, 157
separate identical vacuum-rated stepper motors (NEMA 11 bipolar vacuum-rated stepper motor, 158
Lin Engineering, Morgan Hill, CA, USA). The motor on the static stage controls the vertical 159
motion of the target wheel, while that mounted on the dynamic stage controls its azimuthal 160
rotation. 161
162
The shaft of the vertical motor is coupled directly to an Acme threaded rod (0.375-inch diameter, 163
16 pitch) and the corresponding threaded insert is attached to the dynamic stage. Motion of the 164
dynamic stage is guided by two steel rods, 6.3 mm in diameter, which fit into linear Teflon® 165
bushings. The stepper motor normally has 200 full steps per revolution (1.8 deg/step); however, 166
a motor driver/controller circuit (TMCM-310/SG, Trinamic Motion Control GmbH & Co. KG, 167
Hamburg, Germany) is used to microstep the motor eight times per full step resulting in more 168
precise control of the motion with 1,600 microsteps per revolution (0.225 deg/microstep). A 169
microswitch attached to the static stage indicates when the dynamic stage reaches its uppermost 170
point, giving the motor driver/controller a reference point for positioning the vertical motor. As 171
long as power to the motor driver/controller circuit is maintained, the driver/controller tracks the 172
number of microsteps from the reference point allowing for accurate vertical positioning of the 173
wheel. 174
175
The azimuthal motor drive shaft attaches to the Delrin® hub of the target wheel via a custom 176
keyed, shouldered shaft extension. The Delrin®
187
hub is pressed onto the shaft extension and 177
snuggly against the shoulder for precise positioning of the target wheel within the scattering 178
chamber. The rotary stepper motor has 200 full steps per revolution but is micro-stepped 64 179
times per full step resulting in 12,800 microsteps per revolution (0.0281 deg/step) allowing for 180
very precise azimuthal rotation of the target wheel. The azimuthal motor also has a small rear 181
drive shaft where an absolute magnetic encoder (MAE3 Absolute Magnetic Kit Encoder, US 182
Digital, Vancouver, WA) is attached to enable highly accurate tracking of the azimuthal position 183
of the target wheel. The encoder outputs a digital clock signal of 250 Hz whose variable duty 184
cycle is correlated to the azimuthal position of the drive shaft. The pulse width of the signal has 185
12-bit precision giving the encoder a resolution of 4,096 distinct duty cycles per revolution. 186
A graphite brush housed in Delrin® is attached to the dynamic stage of the target system. This 188
brush is spring loaded to make good sliding contact against the insulated target wheel during 189

rotation. A wire connected to the brush carries current outside of the scattering chamber for 190
remote beam current integration and monitoring. 191
192
Electronics outside the scattering chamber power the stepper motors, the absolute position 193
encoder, and the motor driver/controller. Electronic connections to the two stepper motors, 194
absolute encoder, and microswitch from the external power supplies and motor driver/controller 195
are established via a 25 pin D-subminiature (DB-25) vacuum feedthrough in the scattering 196
chamber wall. 197
198
3.2. Software 199
200
National Instruments LabVIEWTM and Vision Development Module programs are used to 201
control the target system. Two LabVIEWTM
205
virtual instruments called WheelScan and 202
MotorLord are used to control the beam irradiation of samples on the target wheel as described 203
in the following sections. 204
3.2.1. WheelScan 206
207
The first virtual instrument, WheelScan, determines the coordinate positions of the membrane 208
samples on the target wheel and the method and pattern for beam irradiation of each sample. 209
The primary input to WheelScan is a digital photograph of the target wheel loaded with 210
membrane samples, taken with the engraved target wheel chord oriented approximately 211
horizontally and located in the upper third of the picture. When WheelScan is executed, it 212
prompts the user to specify the width of the expected square beam spot in millimeters as well as 213
the expected incident angle. The user then selects the digital photograph of the loaded target 214
wheel and identifies the location of the four calibration holes on the wheel image by clicking on 215
them. Since the physical locations of the calibration holes on the wheel are precisely known, 216
WheelScan uses their pixel locations on the digital wheel image to determine the physical 217
dimension of an image pixel. WheelScan then converts locations in the image, specified by pixel 218
coordinates, into physical locations on the wheel itself, specified by polar coordinates (mm, 219
radians) with the origin at the center of the target wheel. 220
221
The user then specifies the number of individual samples to be analyzed, and designates the 222
scanning mode to be used for each sample by selecting between point, discrete rastering and 223
continuous rastering. For point samples, the user selects a single coordinate where the beam will 224
be focused for the duration of the exposure of the sample. Point samples are used for calibration 225
of RBS/ERD energy spectra, and should be samples that are not damaged by prolonged beam 226
exposure. For discretely- or continuously-rastered samples, the user employs a polygon tool to 227
draw on the digital wheel image a closed outline of the area to be analyzed. Using the specified 228
beam width, WheelScan decomposes the specified polygon area into a series of adjacent arcs that 229
define the beam irradiation pattern. For each arc, both the start and end angles and the radial 230
displacement are saved by the software. If the sample is to be discretely rastered, WheelScan 231
decomposes each arc into a series of discrete points that are spaced far enough apart to avoid 232
overlapping beam spots. After defining all samples, the user assigns a name to the file in which 233
WheelScan stores the data that define the raster patterns of all samples in the wheel. The 234
generated file is then ready to be used by the second virtual instrument, MotorLord. 235
236
3.2.2. MotorLord 237
238
The second virtual instrument, MotorLord, uses the data created by WheelScan to control the 239
two stepper motors on the target system and data acquisition from the RBS/ERD detector(s). 240
LabVIEWTM interfaces with the microswitch in the target stage and the electronics that comprise 241
the RBS/ERD data acquisition system (DAQ) via a small USB DAQ (USB NI-6009, National 242
Intruments, Austin, TX, USA) that handles digital, transistor-transistor logic input and output. 243
LabVIEWTM communicates with the motor driver/controller using a TCP connection established 244
via an Ethernet-to-RS232 converter (ESL 1 port RS-232 DB9, Lava Computer MFG Inc., 245
Toronto, Canada). The output signal from the absolute magnetic encoder is input into a 246
microcontroller (PIC18F4520, Microchip Technology Inc., Chandler, AZ) with a 20 MHz crystal 247
which calculates the duty cycle of the system. The microcontroller communicates with 248
LabVIEWTM
251
via RS232 through a TTL-to-RS232 level converter (MAX232, Maxim Integrated 249
Products Inc., Sunnyvale, CA). 250
When MotorLord is executed, the user loads the file generated using WheelScan which contains 252
the raster patterns of the samples to be analyzed. MotorLord then sends digital inhibit signals to 253
the analog-to-digital converter (ADC) and scalar of the RBS/ERD data acquisition system. The 254
software then instructs the vertical motor to move the dynamic stage upward until the 255
microswitch is tripped, establishing the zero reference position for the motor; this procedure 256
recurs between analysis of any separate samples to assure continued precision. As described 257
above, MotorLord also reads the duty cycle of the absolute magnetic encoder which provides the 258
position of the rotary motor. Once the wheel position is properly set to user-chosen locations, 259
the beam current is tuned to the desired value, as needed, by the accelerator operator. Once 260
tuning of the beam current is complete, the user selects the sample to analyze. For a point 261
sample, MotorLord instructs the two motors to move to the corresponding polar coordinates and 262
enables the DAQ, beginning data collection. The user can stop data collection at any time by 263
clicking on a command button. 264
265
For discretely-rastered samples, the user inputs the number of points to be analyzed and the time 266
each point is to be irradiated. MotorLord then instructs first the rotary and then the vertical 267
motors to move to their respective initial sample coordinates. Once at the target coordinate, 268
MotorLord enables data collection. After the specified irradiation time has been reached, 269
MotorLord inhibits data collection, moves the motors so the beam hits the next point on the 270
sample and re-enables data collection. This process continues until all specified points on the 271
sample have been irradiated. 272
273
For continuously-rastered samples, MotorLord prompts the user to input the desired raster speed 274
(mm/s) and analyzes the raster pattern to determine a starting angle 0.1 radians outside the raster 275
area. MotorLord then moves the rotary motor to this starting angle and the vertical motor to the 276
starting radial position of the innermost arc. Next, the software instructs the rotary motor to 277
move to the beginning point of the current arc, enables data collection, and instructs the motor to 278
move at the user-specified speed towards the end angle of the arc. Once there, the rotary motor 279
is returned to the start of the arc and data collection is inhibited before the motor is returned to 280
the starting angle. MotorLord then instructs the vertical motor to move to the radial position of 281
the next arc and the process is repeated until all the arcs have been rastered. 282
283
The user has the option to pause or abort RBS/ERD analysis at any point during a sample run. 284
Once all the desired samples have been analyzed, the user ends execution of MotorLord. 285
286
4. Results 287
288
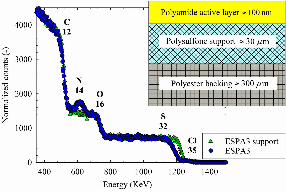
Figure 3 shows RBS spectra of the ESPA3 reverse osmosis membrane (circles) and its 289
polysulfone support (triangles) (Hydranautics, Oceanside, CA). To facilitate spectra comparison, 290
counts for the polysulfone support have been normalized so that the sulfur plateau matches that 291
of the ESPA3 membrane. The inset in the figure depicts the thin-film composite structure of the 292
ESPA3 membrane and indicates that the active layer is made of polyamide; such structure with a 293
polyamide active layer is the most common structure of reverse osmosis and nanofiltration 294
membranes [2, 6, 10]. The polysulfone support lacks the top polyamide layer and is made up of 295
only the polyester backing and the polysulfone layer. 296
297
Insert Figure 3. Size suggestion: Single column 298
299
The RBS spectra were obtained using the new target system and a 2-MeV 4He2+ analysis beam 300
collimated to a square shape of 3 mm × 3 mm. The membrane samples (i.e., 2.5-cm × 5.0-cm 301
coupons) were attached to the target wheel using double-sided conductive tape, and the ion 302
fluence was always maintained below 3×10¹⁴ ions/cm2 to prevent damage of the polymer 303
material [17]. The experiments were performed using incident, exit and scattering angles of 304
22.5o, 42.5o and 160o
310
, respectively, and a sample-detector distance of 75 mm. A collimator with 305
a 6-mm wide rectangular aperture was used in front of the detector. The depth of RBS analysis 306
for the experimental settings used is <5 µm [12] which is much lower than the thickness (~30 307
µm) of the polysulfone layer. As a result, the polyester backing does not contribute to the 308
spectra. 309
While the data in Figure 3 come from experiments performed using RBS geometry and 311
continuously-rastered samples, we also verified the correct performance of the system for ERD 312
geometries, and point and discretely-rastered samples (data not shown). The choice of scanning 313
mode did not affect the data collected, i.e., different scanning modes with the same geometry and 314
fluence generated statistically indistinguishable spectra. Additionally, all scanning modes with 315
RBS geometry resulted in RBS spectra of the membranes analyzed consistent with what is 316
expected from the literature [1-8]; the spectra in Figure 3 are examples of such typical spectra. 317
No ERD spectra have been reported in the literature for RO and NF membranes. The study of 318
such spectra will be the subject of subsequent work. 319
320
The signal in an RBS spectrum is the result of backscattering events of the projectile ions (4He2+) 321
upon collision with atoms in the sample that have a larger mass than the projectile ions [12]. As 322
a result, the spectra in Figure 3 for the ESPA3 polyamide membrane and the polysulfone support 323
contain peaks and plateaus indicative of the presence of only carbon, nitrogen, oxygen, sulfur 324
and chlorine, but not of hydrogen [2, 6]. Also, as depicted in Figure 3, the ESPA3 membrane 325
has a nitrogen peak while the polysulfone support does not. The nitrogen peak is the result of 326
4He2+ scattering from the top polyamide active layer in the ESPA3 membrane [2, 5]. 327
Additionally, since the helium beam loses energy as it travels through the membrane [12] and the 328
top polyamide layer in the ESPA3 membrane does not contain sulfur, the onset of the sulfur 329
signal appears at lower energies in the spectrum of the ESPA3 membrane [2, 5]. Using the 330
theoretical hydrogen-to-carbon ratios of 0.667 and 0.815 for the elemental compositions of 331
polyamide and polysulfone [2, 5, 10, 22], respectively, the commercial software SIMNRA [23] 332
was used to simulate the spectra in Figure 3 (see solid lines). Elemental compositions of 333
C0.50H0.41O0.07S0.02 and C0.49H0.33O0.08N0.08Cl0.01 were obtained for the polysulfone support and 334
the ESPA3 reverse osmosis membrane, respectively. The thickness of the polyamide active 335
layer was estimated at 100 nm assuming a polyamide density of 1.24 g/cm3
338
[7, 21]. All results 336
are consistent with previously published results [7]. 337
Acknowledgements 339
340
The RBS and ERD measurements were carried out in the Triangle Universities Nuclear 341
Laboratories (TUNL), Durham, NC, which is partially supported by the U.S. Department of 342
Energy Office of Nuclear Physics under grants DE-FG02-97ER41041 and DE-FG02-343
97ER41033
348
. The authors gratefully acknowledge Professor Hugon Karwowski and Professor 344
Nalin Parikh for assistance in setting up the scattering system, and John Dunham for assistance 345
in the operation of the tandem accelerator. The company Hydranautics (Oceanside, CA) is also 346
gratefully acknowledged for providing membrane materials. 347
References 349
350
[1] C.R. Bartels, J. Mem. Sci., 45 (1989) 225-245. 351
[2] B. Mi, O. Coronell, B.J. Mariñas, F. Watanabe, D.G. Cahill, I. Petrov, J. Mem. Sci., 282 352
(2006) 71-81. 353
[3] B. Mi, B.J. Mariñas, D.G. Cahill, Environ. Sci. Technol., 41 (2007) 3290-3295. 354
[4] X. Zhang, D.G. Cahill, O. Coronell, B.J. Mariñas, Appl. Phys. Lett., 91 (2007) 181904. 355
[5] O. Coronell, B.J. Mariñas, X. Zhang, D.G. Cahill, Environ. Sci. Technol., 42 (2008) 5260-356
5266. 357
[6] O. Coronell, B.J. Mariñas, D.G. Cahill, Environ. Sci. Technol., 43 (2009) 5042-5048. 358
[7] O. Coronell, M.I. González, B.J. Mariñas, D.G. Cahill, Environ. Sci. Technol., 44 (2010) 359
6808-6814. 360
[8] O. Coronell, B.J. Mariñas, D.G. Cahill, Environ. Sci. Technol., 45 (2011) 4513-4520. 361
[9] T. Maugin, T. Renkens, A. Martínez Sáenz de Jubera, J.P. Croué, B.J. Mariñas, S. Rapenne, 362
Fate of reverse osmosis (RO) membranes during desalination of chloraminated seawater, in: 363
Proceedings of the American Water Works Association Membrane Technology Conference, 364
Long Beach, CA, 2011. 365
[10] R.J. Petersen, J. Mem. Sci., 83 (1993) 81-150. 366
[11] M. Mulder, Principles of Membrane Technology, Second ed., Kluwer Academic, Boston, 367
MA, 1996. 368
[12] W.-K. Chu, J.W. Mayer, M.A. Nicolet, Backscattering spectrometry, Academic Press, New 369
York, NY, 1978. 370
[13] F. Namavar, J.I. Budnick, Nucl. Instrum. Meth. B, B15 (1986) 285-287. 371

[14] T. Venkatesan, W.L. Brown, C.A. Murray, K.J. Marcantonio, B.J. Wilkens, Polym. Eng. 372
Sci., 23 (1983) 931-934. 373
[15] A.L. Evelyn, D. Ila, R.L. Zimmerman, K. Bhat, D.B. Poker, D.K. Hensley, C. Klatt, S. 374
Kalbitzer, N. Just, C. Drevet, Nucl. Instrum. Meth. B, B148 (1999) 1141-1145. 375
[16] L.J. Matienzo, F. Emmi, D.C. Van Hart, T.P. Gall, J. Vac. Sci. Technol. A, 7 (1989) 1784-376
1789. 377
[17] B. Mi, D.G. Cahill, B.J. Mariñas, J. Mem. Sci., 291 (2007) 77-85. 378
[18] S. Bason, V. Freger, J. Mem. Sci., 302 (2007) 1-9. 379
[19] V. Freger, Environ. Sci. Technol., 38 (2004) 3168-3175. 380
[20] F.A. Pacheco, I. Pinnau, M. Reinhard, J.O. Leckie, J. Mem. Sci., 358 (2010) 51-59. 381
[21] X. Zhang, D.G. Cahill, O. Coronell, B.J. Mariñas, J. Mem. Sci., 331 (2009) 143-151. 382
[22] K. Ikeda, S. Yamamoto, H. Ito Sulfonated polysulfone composite semipermeable 383
membranes. European Patent, EP 0 165 077 B2, 1998. 384
[23] M. Mayer, J.L. Duggan, I.L. Morgan, SIMNRA, a simulation program for the analysis of 385
NRA, RBS and ERDA, in: Proceedings of the 15th International Conference on the Application 386
of Accelerators in Research and Industry, Denton, TX, 1998. 387
388
389
Set Reference Position
RBS/ERD Data Acquisition
System
Encoder Signal
Target Wheel Azimuthal Position
Raster Pattern
Enable/Inhibit Signal Target Wheel
Vertical Position
Rotary Motor
PIC 18F4520 Microcontroller
User Input: Raster Speed and Sample
Number
Vertical Motor
TMCM 310/SG Motor Driver/Controller
Micro- switch
LabView VI MotorLord Data
LabView VI WheelScan
User Input: Digital Image
of Target Wheel
User Input: Beam Width, Beam Angle, Number of
Samples, Type of Sample, Sample
Boundaries