Embed Size (px)
Citation preview
1
2012 Economic Outlook
Phoenix Chamber of Commerce Economic Outlook BreakfastSeptember 30, 2011
Beckie HolmesDiretor, Marketing Science, Cox Communications Arizona
2
Overview
• The recession has left lasting damage• Credit markets still fundamentally weak• No political will for further fiscal support, unclear that
monetary policy can help• Bottom line: Slow and painful recovery continues into 2012;
risk of recession is high

3
The Post-Recession Economy: More Services, Government, Exports, Less Investment, Durable Goods
Percent Change Real GDP: 2007Q4 to 2011Q2
-0.5% 0.9% 1.4% 0.7%
-31.5%
-1.3%
-38.1%
8.7%-0.1%
13.4% 17.6%
-5.0%
-50%-40%-30%-20%-10%
0%10%20%30%
GDP DurableGoods
NondurableGoods
Services CommercialStructures
BusinessEquip &
Software
Residential Exports Imports NationalDefense
FederalNondefense
State andLocal
Perc
ent C
hang
e
Net Exports -25.4% Government +2.2%Consumption +0.8% Investment -16.3%
Changing Share of GDP: 2011Q2 vs 2007Q4
-0.77%
0.86%1.23%
-1.28%
-0.51%
-1.72%
1.52%
-0.68%
0.77%0.46%
-0.18%
-2.0%-1.5%-1.0%-0.5%0.0%0.5%1.0%1.5%2.0%
DurableGoods
NondurableGoods
Services CommercialStructures
BusinessEquip &
Software
Residential Exports Imports NationalDefense
FederalNondefense
State andLocal
Perc
ent o
f GD
P
Consumption +1.3% Investment -3.2% Net Exports +0.8% Government +1.0%
Source: Department of Commerce, Bureau of Economic Statistics
4
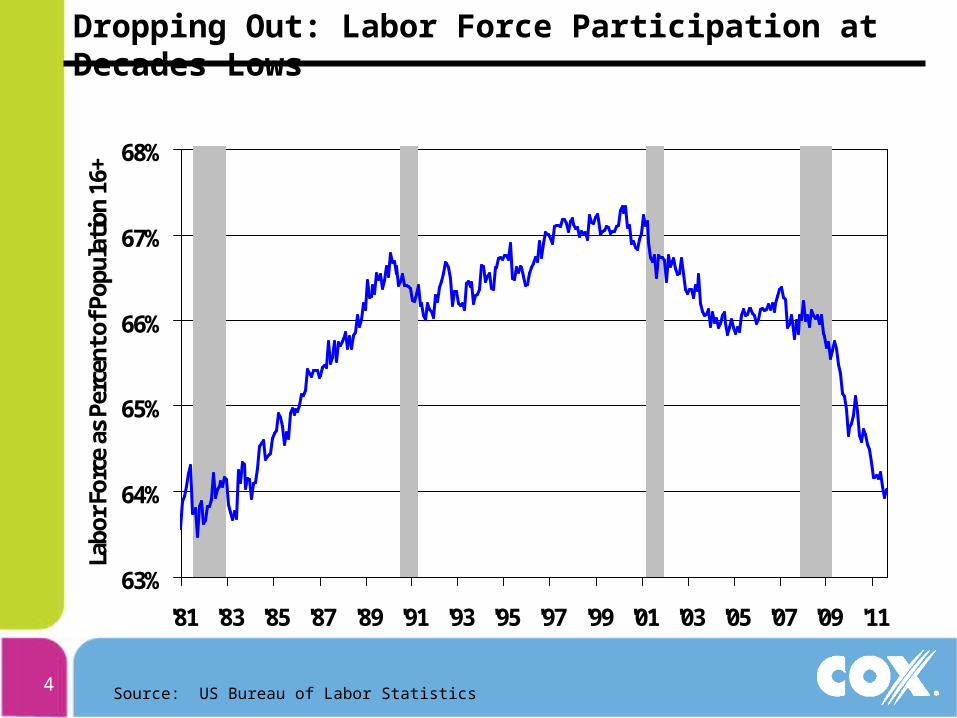
Dropping Out: Labor Force Participation at Decades Lows
63%
64%
65%
66%
67%
68%
'81 '83 '85 '87 '89 '91 '93 '95 '97 '99 '01 '03 '05 '07 '09 '11
Labo
r For
ce a
s Pe
rcen
t of P
opul
ation
16+
Source: US Bureau of Labor Statistics
55
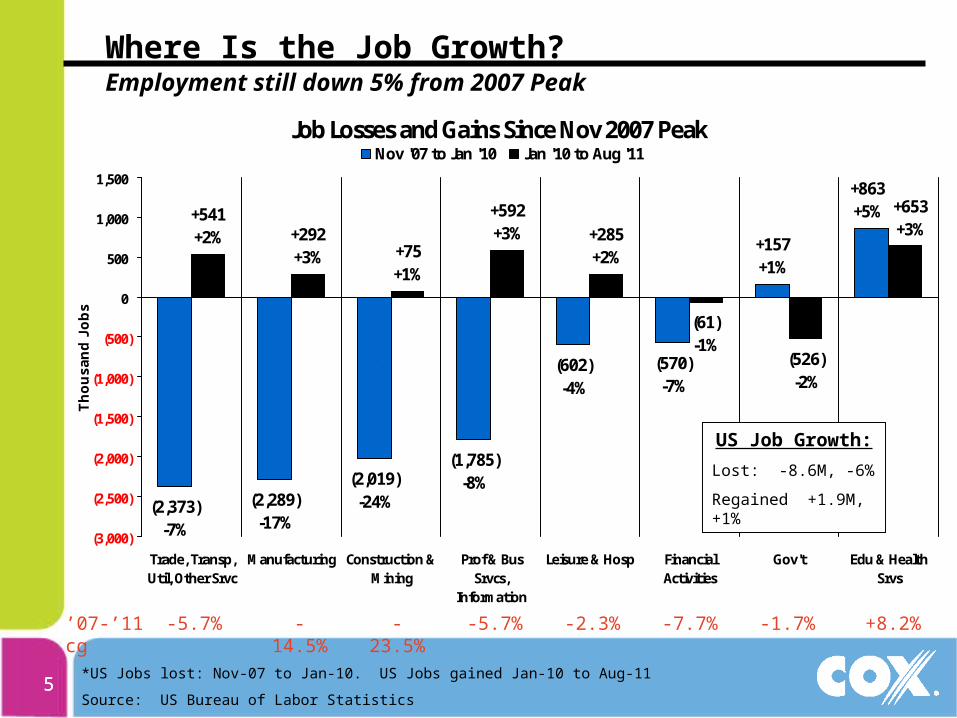
Where Is the Job Growth? Employment still down 5% from 2007 Peak
Job Losses and Gains Since Nov 2007 Peak
+863 +5%
(570)-7%
(602)-4%
(1,785)-8%(2,019)
-24%(2,289)-17%
(2,373)-7%
+157+1%
+653+3%
(526)-2%
(61)-1%
+285 +2%
+592 +3%
+75+1%
+292 +3%
+541 +2%
(3,000)
(2,500)
(2,000)
(1,500)
(1,000)
(500)
0
500
1,000
1,500
Trade, Transp,Util, Other Srvc
Manufacturing Construction &Mining
Prof & BusSrvcs,
Information
Leisure & Hosp FinancialActivities
Gov't Edu & HealthSrvs
Th
ou
sa
nd
Jo
bs
Nov '07 to Jan '10 Jan '10 to Aug '11
`
*US Jobs lost: Nov-07 to Jan-10. US Jobs gained Jan-10 to Aug-11
Source: US Bureau of Labor Statistics
US Job Growth:
Lost: -8.6M, -6%
Regained +1.9M, +1%
-5.7% -23.5%-14.5% -5.7% -1.7% +8.2%-7.7%-2.3%’07-’11 cg
6
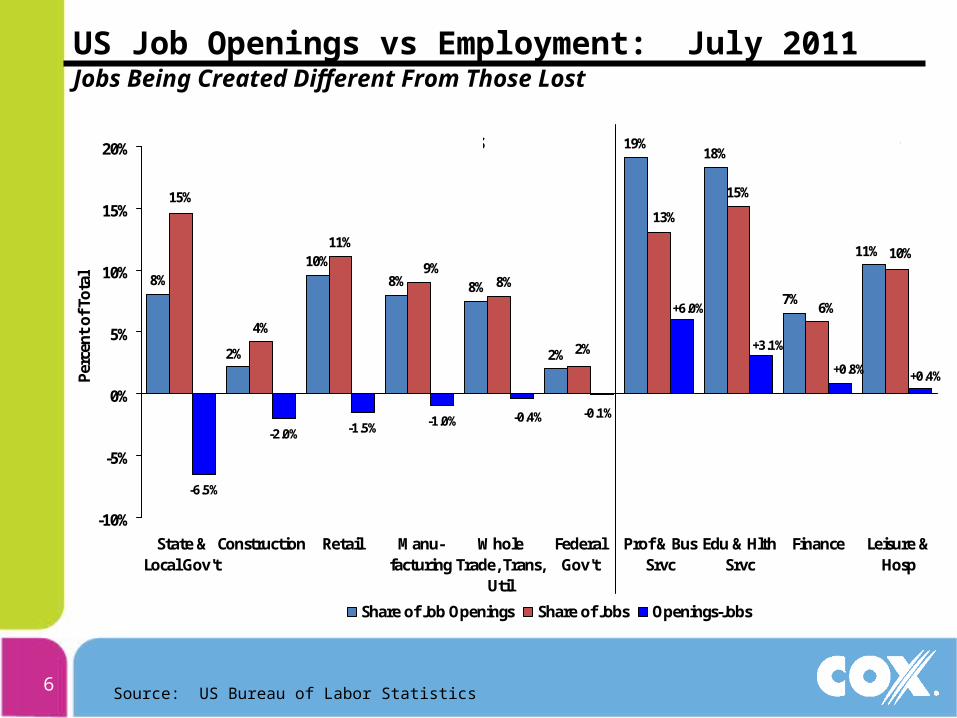
US Job Openings vs Employment: July 2011 Jobs Being Created Different From Those Lost
8%10%
8% 8%
2%
19%18%
4%
11%
15%
-6.5%
-2.0% -1.5% -1.0%
11%
2%
7%
10%
2%
8%
13%
6%
15%
9%
+6.0%
+0.4%
-0.4%
+0.8%
+3.1%
-0.1%
-10%
-5%
0%
5%
10%
15%
20%
State &Local Gov't
Construction Retail Manu-facturing
WholeTrade, Trans,
Util
FederalGov't
Prof & BusSrvc
Edu & HlthSrvc
Finance Leisure &Hosp
Perc
ent
of T
otal
Share of Job Openings Share of Jobs Openings-Jobs
Surplus Workers Worker Shortage
Source: US Bureau of Labor Statistics
7
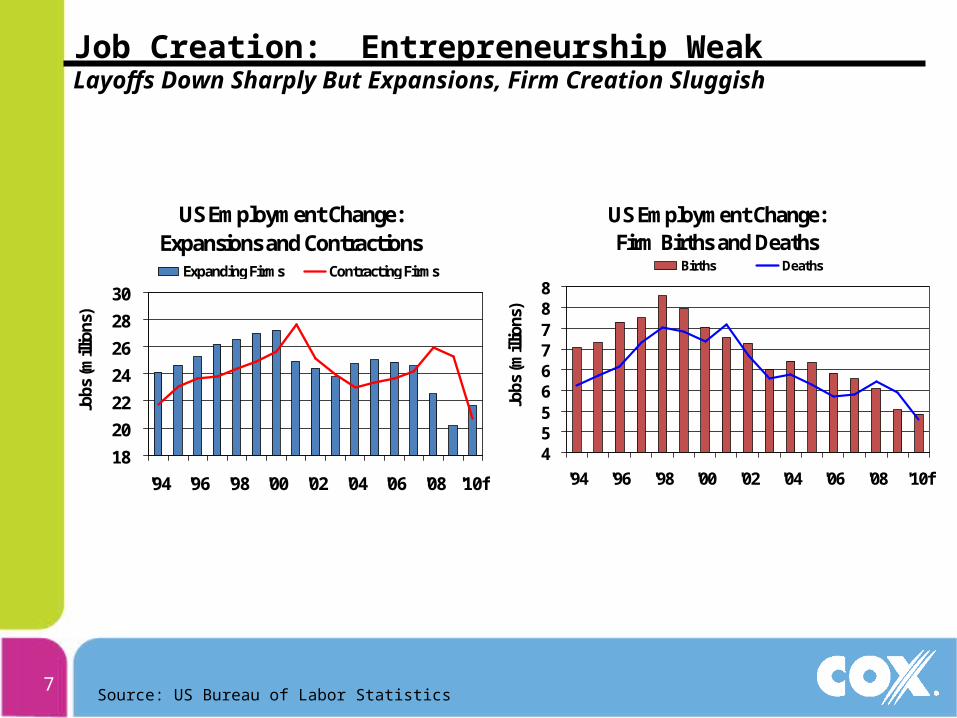
Job Creation: Entrepreneurship WeakLayoffs Down Sharply But Expansions, Firm Creation Sluggish
US Employment Change: Expansions and Contractions
18
20
22
2426
28
30
'94 '96 '98 '00 '02 '04 '06 '08 '10f
Jobs
(mill
ions
)
Expanding Firms Contracting Firms
Source: US Bureau of Labor Statistics
US Employment Change: Firm Births and Deaths
455667788
'94 '96 '98 '00 '02 '04 '06 '08 '10f
Jobs
(mill
ions
)
Births Deaths
8
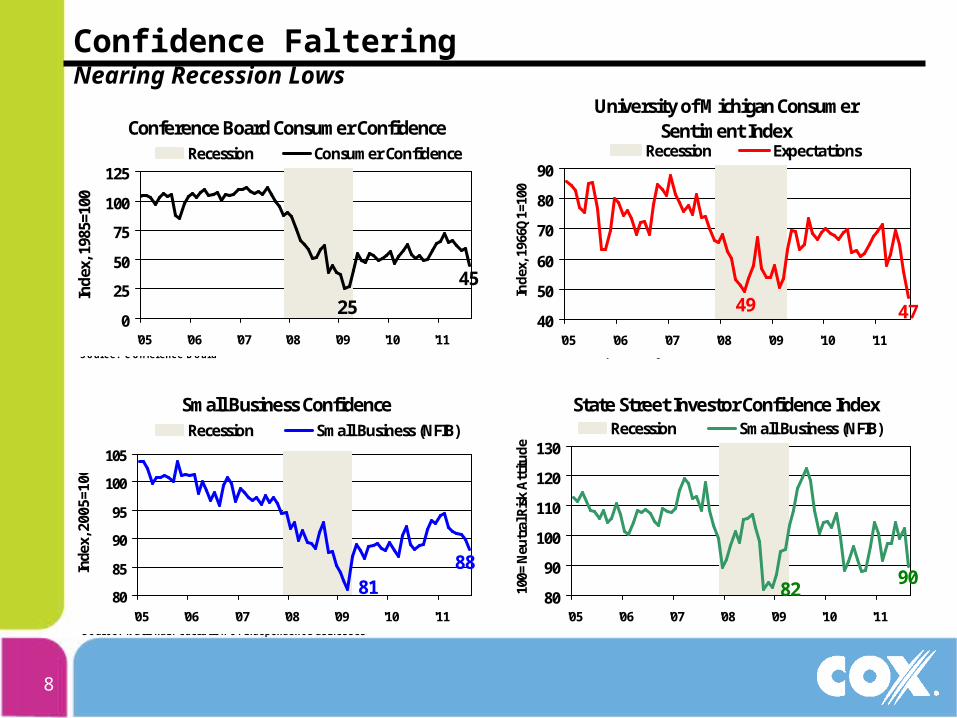
Confidence Faltering Nearing Recession Lows
Conference Board Consumer Confidence
45
250
25
50
75
100
125
'05 '06 '07 '08 '09 '10 '11
Inde
x, 1
985=
100
Recession Consumer Confidence
Source: Conference Board
Small Business Confidence
8881
80
85
90
95
100
105
'05 '06 '07 '08 '09 '10 '11
Inde
x, 2
005=
100
Recession Small Business (NFIB)
Source: National Federation of Independent Businesses
University of Michigan Consumer Sentiment Index
474940
50
60
70
80
90
'05 '06 '07 '08 '09 '10 '11
Inde
x, 1
966Q
1=10
0
Recession Expectations
Source: University of Michigan
State Street Investor Confidence Index
908280
90
100
110
120
130
'05 '06 '07 '08 '09 '10 '11
100=
Neu
tral
Ris
k A
ttitu
de
Recession Small Business (NFIB)
Source: State Street Global Markets
9
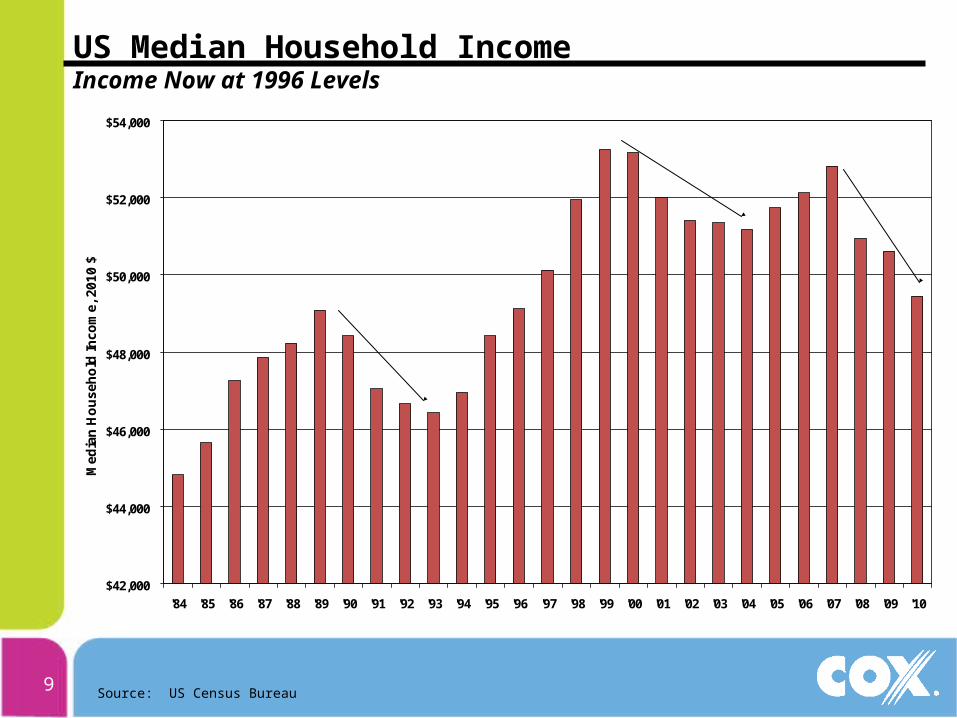
US Median Household IncomeIncome Now at 1996 Levels
$42,000
$44,000
$46,000
$48,000
$50,000
$52,000
$54,000
'84 '85 '86 '87 '88 '89 '90 '91 '92 '93 '94 '95 '96 '97 '98 '99 '00 '01 '02 '03 '04 '05 '06 '07 '08 '09 '10
Me
dia
n H
ou
seh
old
Inco
me
, 201
0 $
'89-'93-5.4%
'99-'04-3.9%
'07-'10-6.4%
Source: US Census Bureau
10
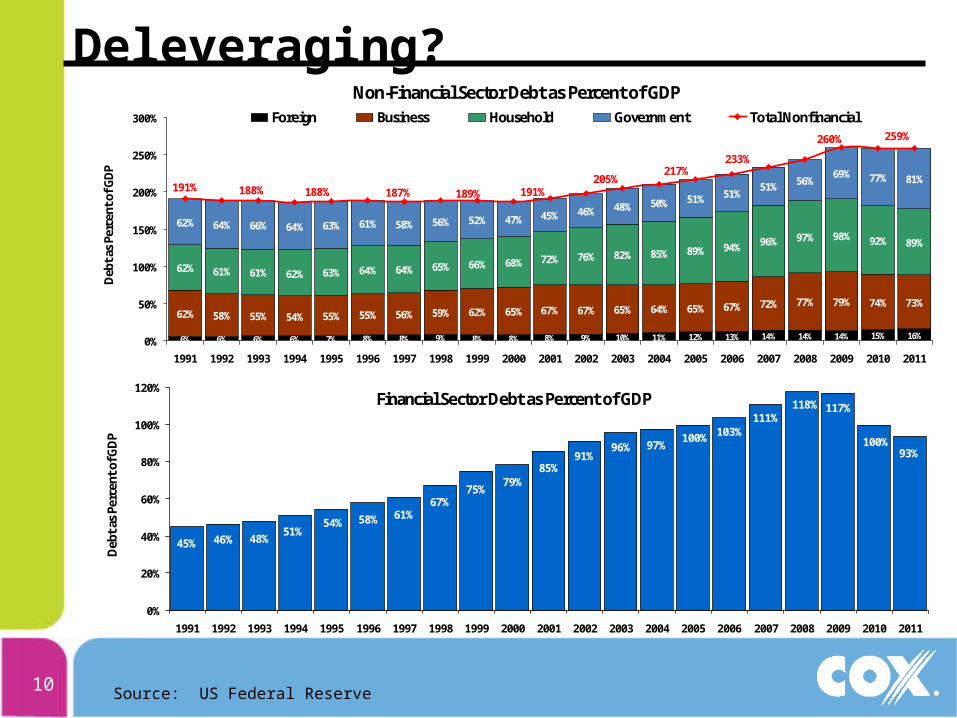
Deleveraging?Non-Financial Sector Debt as Percent of GDP
6% 6% 6% 6% 7% 8% 8% 9% 8% 8% 8% 9% 10% 11% 12% 13% 14% 14% 15% 16%
62% 58% 55% 54% 55% 55% 56% 59% 62% 65% 67% 67% 65% 64% 65% 67% 72% 77% 79% 74% 73%
62% 61% 61% 62% 63% 64% 64% 65% 66% 68% 72% 76% 82% 85% 89% 94% 96% 97% 98% 92% 89%
62% 64% 66% 64% 63% 61% 58% 56% 52% 47% 45% 46% 48% 50% 51% 51%51% 56%
69% 77% 81%
14%
191% 188% 188% 187% 189% 191%205%
217%233%
260% 259%
0%
50%
100%
150%
200%
250%
300%
1991 1992 1993 1994 1995 1996 1997 1998 1999 2000 2001 2002 2003 2004 2005 2006 2007 2008 2009 2010 2011
Deb
t as
Perc
ent o
f GD
PForeign Business Household Government Total Nonfinancial
Financial Sector Debt as Percent of GDP
45% 46% 48%51%
54% 58% 61%67%
75%79%
85%91%
96% 97%100% 103%
111%118% 117%
100%93%
0%
20%
40%
60%
80%
100%
120%
1991 1992 1993 1994 1995 1996 1997 1998 1999 2000 2001 2002 2003 2004 2005 2006 2007 2008 2009 2010 2011
Deb
t as
Perc
ent o
f GD
P
Source: US Federal Reserve
11
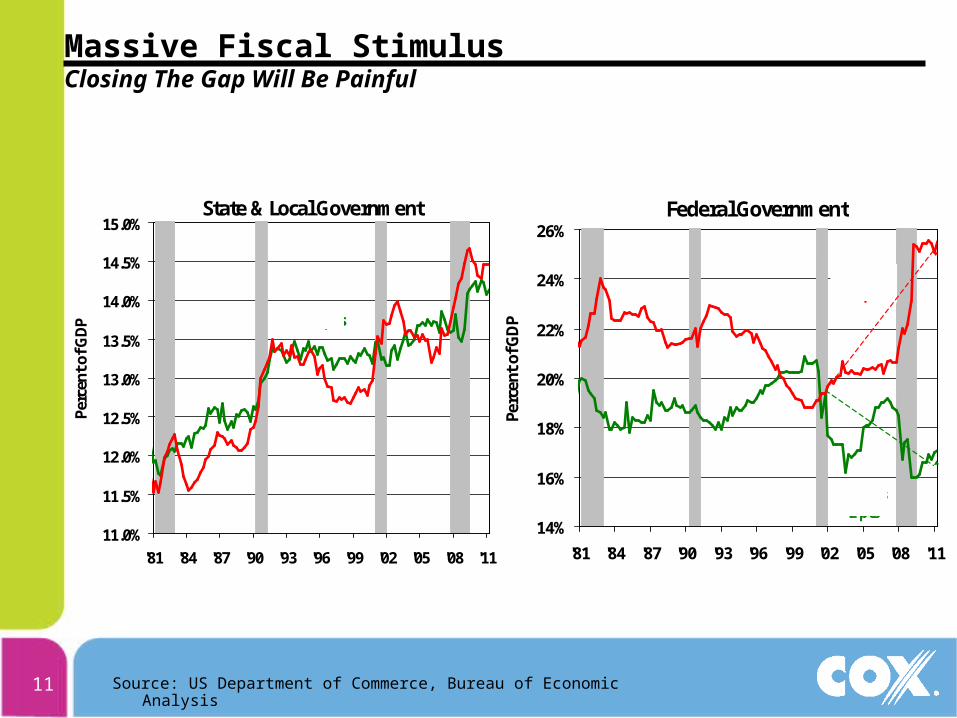
Massive Fiscal StimulusClosing The Gap Will Be Painful
State & Local Government
11.0%
11.5%
12.0%
12.5%
13.0%
13.5%
14.0%
14.5%
15.0%
'81 '84 '87 '90 '93 '96 '99 '02 '05 '08 '11
Perc
ent o
f GDP
Spending
Receipts
Federal Government
14%
16%
18%
20%
22%
24%
26%
'81 '84 '87 '90 '93 '96 '99 '02 '05 '08 '11
Perc
ent o
f GD
P
Spending+6 pts
Receipts-2 pts
Source: US Department of Commerce, Bureau of Economic Analysis
12
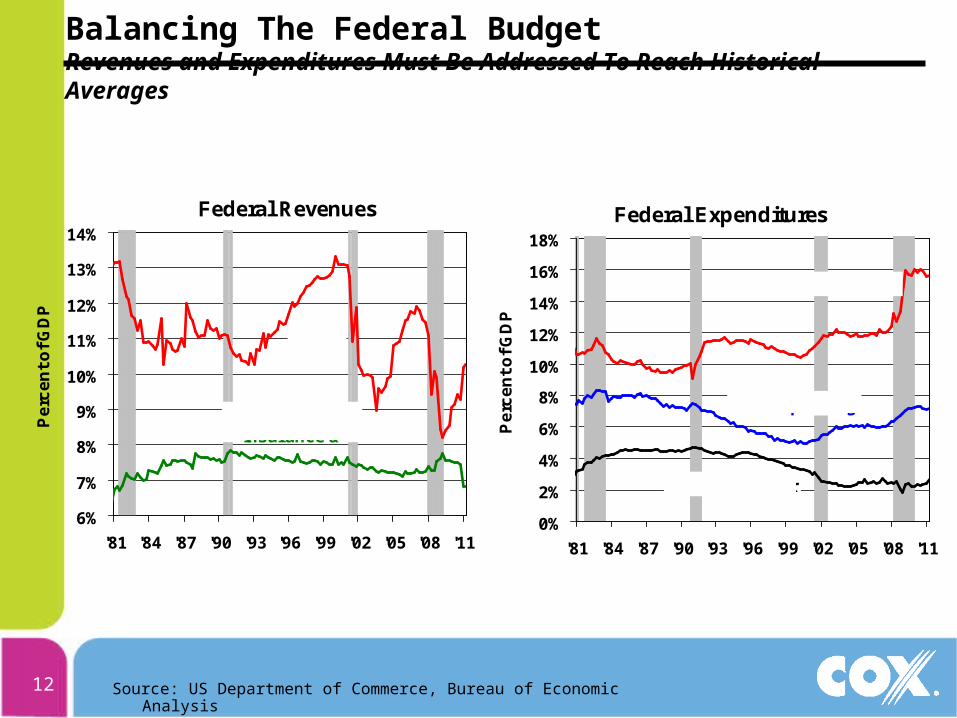
Balancing The Federal BudgetRevenues and Expenditures Must Be Addressed To Reach Historical Averages
Federal Revenues
6%
7%
8%
9%
10%
11%
12%
13%
14%
'81 '84 '87 '90 '93 '96 '99 '02 '05 '08 '11
Pe
rce
nt
of
GD
P
Social Insurance &
Taxes
Federal Expenditures
0%
2%
4%
6%
8%
10%
12%
14%
16%
18%
'81 '84 '87 '90 '93 '96 '99 '02 '05 '08 '11
Pe
rce
nt
of
GD
P
Transfers
Interest & Other
Gov't Spending
Source: US Department of Commerce, Bureau of Economic Analysis
13
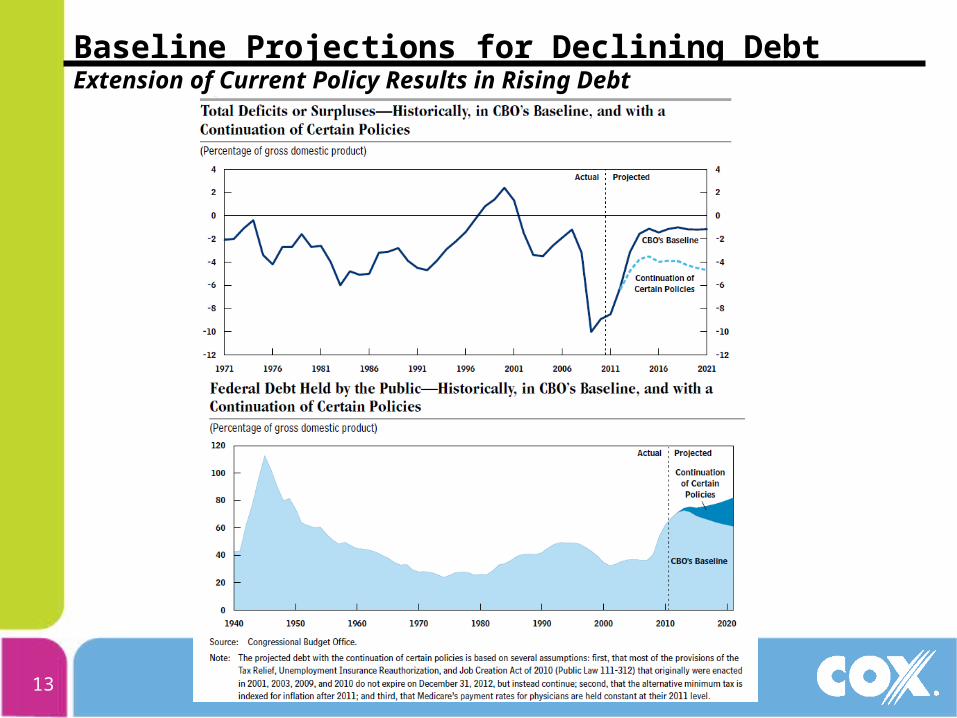
Baseline Projections for Declining DebtExtension of Current Policy Results in Rising Debt
14
Conclusions• Recovery at risk
– Risk of another recession now about 50%– Fiscal contraction will subtract 2-4 points from GDP growth
• Good Signs– Household and corporate balance sheets healthy– Job creation has returned
• Worrying Signs– No turnaround in hardest-hit sectors– Lasting damage to labor market– Congressional discord on deficit reduction