Embed Size (px)
Citation preview
1
2
Web Address
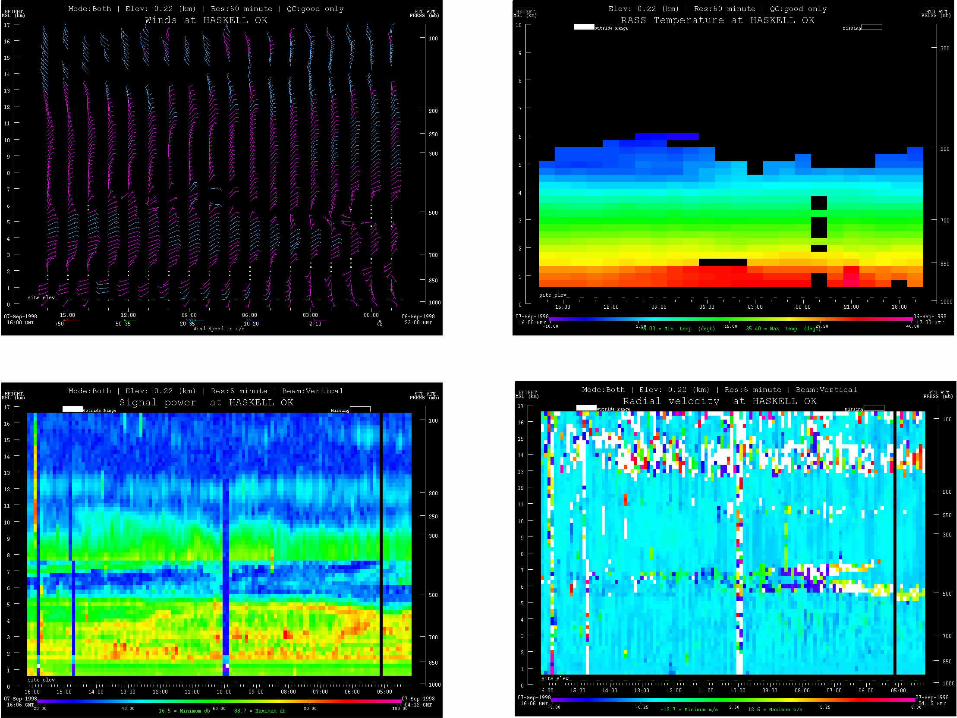
For comprehensive information about:
• NOAA Network Profilers and RASS
• Boundary-layer profilers • Surface-based estimates of total precipitable water vapor from GPS
Go to:
http://www-dd.fsl.noaa.gov/profiler.html
3
Introduction to NAOS
NAOS - North American Atmospheric Observing System
• Program to make recommendations on the configuration of the upper air observing systems over North America and adjacent water areas
• NAOS Council has representatives from 15 agencies in U.S., Canada, and Mexico to identify issues, set priorities, coordinate work of the program, and seek financial support
• NAOS Test and Evaluation Working Group– Assesses potential effects of proposed observing systems and
configurations on the overall efficacy of forecasting services.
– Assessments involve tests of hypotheses concerning the sensitivity of forecast accuracy to specific mixes of observing systems.
– Assessments must also consider utility of data to field forecasters, who use them subjectively, and to the climate community.
4
Hypothesis 1
It will be possible to reduce the number of rawinsondes in the U.S. network without noticeably reducing forecast accuracy provided that the sites removed have substitute observing systems already in place.
Test in two steps:
• Identify rawinsonde sites close to busy hub airports. At these sites withhold rawinsonde and all potential substitute observations for the periods covered by the sensitivity test. Compare forecasts generated from reduced data set with operational forecasts.
• Restore all substitute observations but continue to withhold rawinsondes. Compare these forecasts with operational forecasts.
5
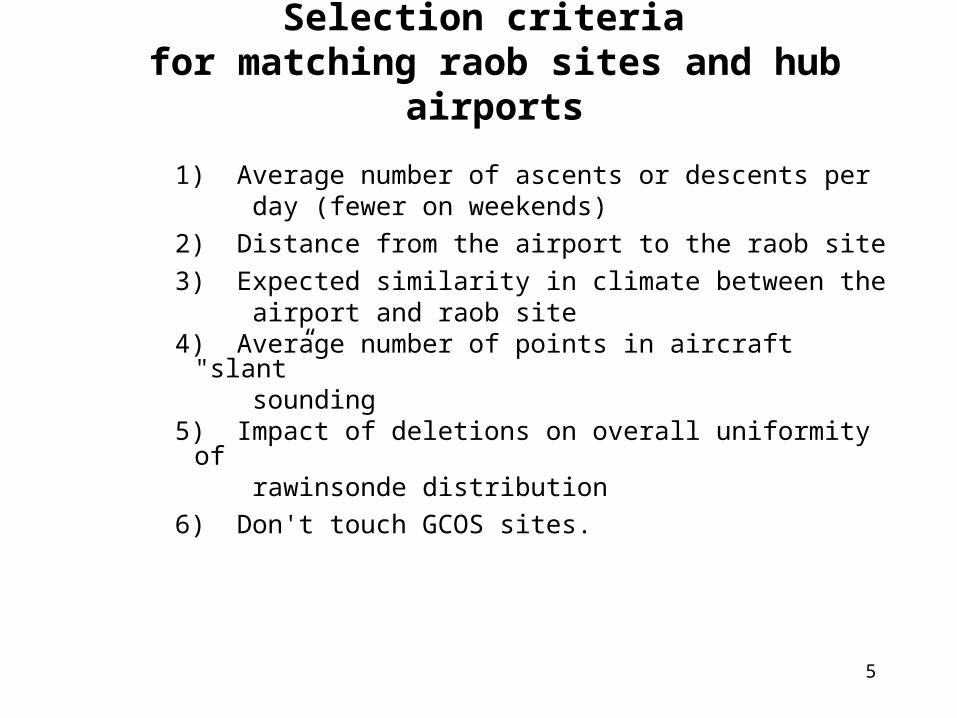
Selection criteria for matching raob sites and hub airports
1) Average number of ascents or descents per day (fewer on weekends)
2) Distance from the airport to the raob site
3) Expected similarity in climate between the airport and raob site4) Average number of points in aircraft "slant” sounding5) Impact of deletions on overall uniformity of rawinsonde distribution
6) Don't touch GCOS sites.
6
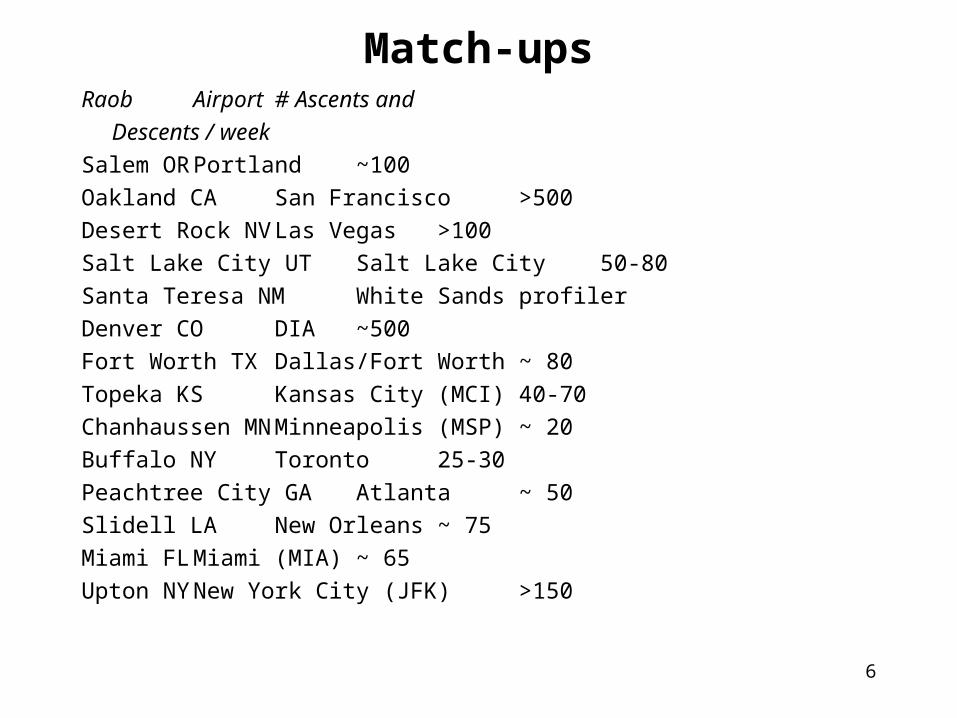
Match-upsRaob Airport # Ascents and
Descents / week
Salem OR Portland ~100
Oakland CA San Francisco >500
Desert Rock NV Las Vegas >100
Salt Lake City UT Salt Lake City 50-80
Santa Teresa NM White Sands profiler
Denver CO DIA ~500
Fort Worth TX Dallas/Fort Worth ~ 80
Topeka KS Kansas City (MCI) 40-70
Chanhaussen MN Minneapolis (MSP) ~ 20
Buffalo NY Toronto 25-30
Peachtree City GA Atlanta ~ 50
Slidell LA New Orleans ~ 75
Miami FL Miami (MIA) ~ 65
Upton NY New York City (JFK) >150
7
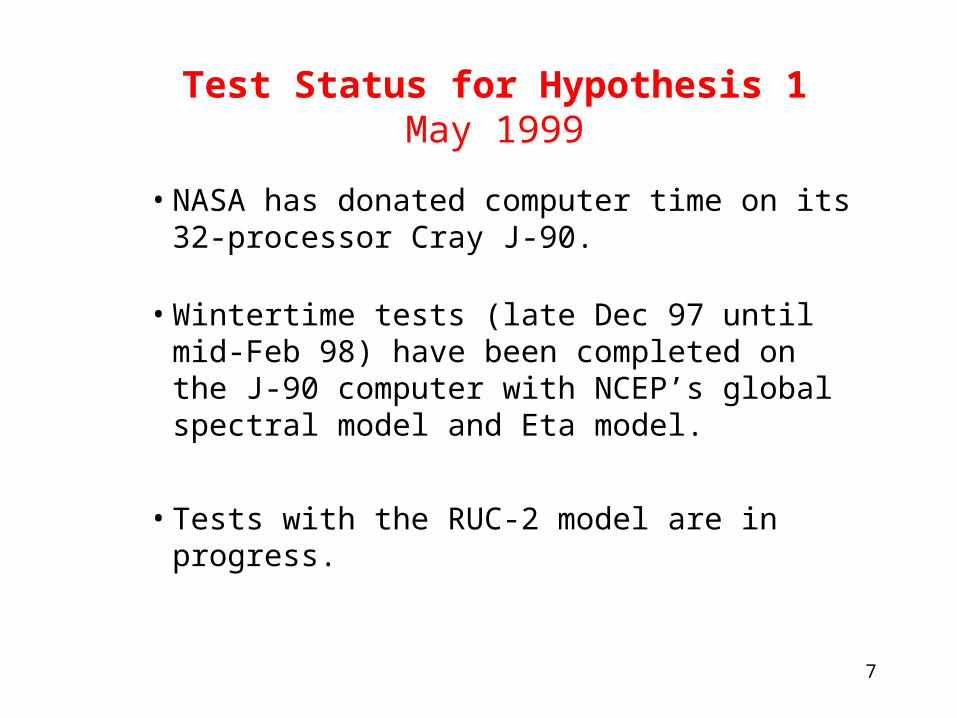
Test Status for Hypothesis 1May 1999
• NASA has donated computer time on its 32-processor Cray J-90.
• Wintertime tests (late Dec 97 until mid-Feb 98) have been completed on the J-90 computer with NCEP’s global spectral model and Eta model.
• Tests with the RUC-2 model are in progress.
8