Embed Size (px)
Citation preview

1

2
The crime statistics cover five broad categories of crime:
1.1 Contact crimes (including subcategories of aggravated robbery)1.2 Contact-related crimes1.3 Property-related crimes1.4 Crimes heavily dependent on police action for detection1.5 Other serious crimes
Provincial crime situation only covers the subcategories of aggravated robbery not meeting the 7-10% reduction target.
The figures in the accompanying graphs represent crime ratios, i.e. the incidence of crime per 100 000 of the South African population. For the subcategories of aggravated robbery, raw figures are used .
Xenophobic outbursts only started on 11 May 2008 and had no effect on the crime statistics presented here.

3
1.1.1 Murder
1.1.2 Attempted murder
1.1.3 Rape (including attempts)
1.1.4 Indecent assault
1.1.5 Assault with the intent to inflict
grievous bodily harm (GBH)
1.1.6 Common assault
1.1.7 Robbery with aggravating
circumstances
1.1.8 Common robbery
CRIMES AGAINST THE PERSON
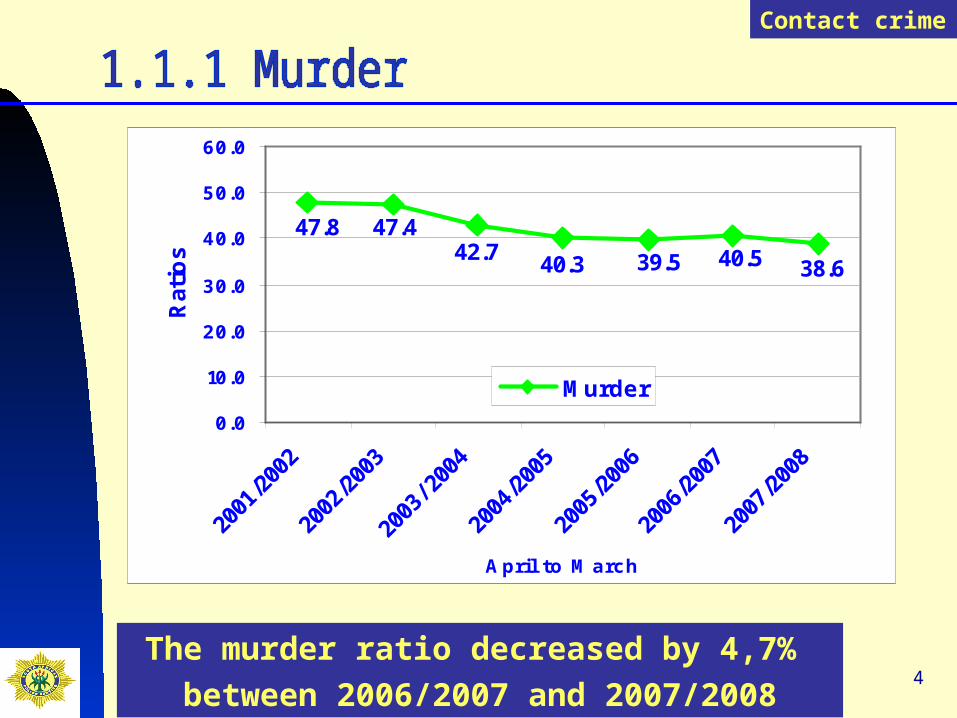
4The murder ratio decreased by 4,7%
between 2006/2007 and 2007/2008
Contact crime
38.640.539.540.342.747.447.8
0.0
10.0
20.0
30.0
40.0
50.0
60.0
April to March
Rat
ios
Murder

5
The attempted murder ratio decreased by 7,5%
between 2006/2007 and 2007/2008
39.342.543.9
52.6
64.8
78.9
69.8
0.0
12.5
25.0
37.5
50.0
62.5
75.0
87.5
April to March
Rat
ios
Attempted murder
Contact crime

6The rape ratio decreased by 8,8%
between 2006 and 2007
75.6
82.9
88.288.084.191.7
85.6
0.0
25.0
50.0
75.0
100.0
125.0
April to December
Rati
os
Rape
Contact crime

7The indecent assault ratio decreased by 2,1%
between 2006 and 2007
14.114.415.516.114.514.1
12.6
0.0
4.0
8.0
12.0
16.0
20.0
April to December
Rat
ios
Indecent assault
Contact crime

8The assault GBH ratio decreased by 4,6%
between 2006/2007 and 2007/2008
439.1460.1484.0
535.3560.7585.9589.1
0.0
85.5
171.0
256.5
342.0
427.5
513.0
598.5
April to March
Rat
ios
Assault with the intent to inflict grievous bodily harm
Contact crime
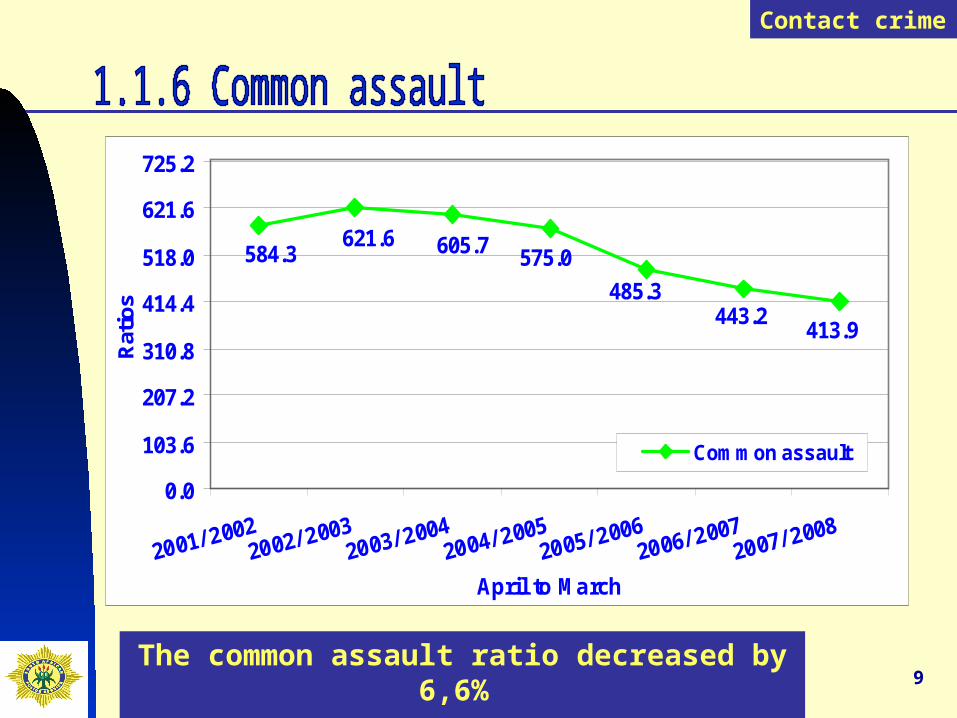
9The common assault ratio decreased by 6,6%
between 2006/2007 and 2007/2008
413.9443.2
485.3
575.0605.7621.6584.3
0.0
103.6
207.2
310.8
414.4
518.0
621.6
725.2
April to March
Rat
ios
Common assault
Contact crime

10The aggravated robbery ratio decreased by 7,4%
between 2006/2007 and 2007/2008
Contact crime
260.5
279.2 288.1272.2
255.3267.1
247.3
0.0
60.0
120.0
180.0
240.0
300.0
April to March
Rat
ios
Robbery with aggravating circumstances

11The common robbery ratio decreased by 9,5%
between 2006/2007 and 2007/2008
201.3223.4
206.0195.0
159.4150.1
135.8
0.0
32.5
65.0
97.5
130.0
162.5
195.0
227.5
April to March
Rat
ios
Common robbery
Contact crime

12
1.2.1 Arson
1.2.2 Malicious damage to property

13The arson ratio decreased by 6,6%between 2006/2007 and 2007/2008
Contact-related crime
15.516.616.3
17.619.0
20.219.5
0.0
3.0
6.0
9.0
12.0
15.0
18.0
21.0
April to March
Rat
ios
Arson

14The malicious damage ratio decreased by 5,4%
between 2006/2007 and 2007/2008
Contact-related crime
324.5 345.6
341.2
323.7307.7 302.5
286.2
0.0
50.0
100.0
150.0
200.0
250.0
300.0
350.0
400.0
April to March
Rat
ios
Malicious damage to property

15
1.3.1 Burglary at residential premises
1.3.2 Burglary at non-residential premises
1.3.3 Theft of motor vehicles and motorcycles
1.3.4 Theft out of or from motor vehicles
1.3.5 Stock-theft

16The residential burglary ratio decreased by 5,6%
between 2006/2007 and 2007/2008
Property-related crime
497.1526.8
559.9592.8
645.2704.0675.3
0.0
101.0
202.0
303.0
404.0
505.0
606.0
707.0
808.0
April to March
Rat
ios
Burglary at residential premises

17The non-residential burglary ratio increased by 6,8%
between 2006/2007 and 2007/2008
Property-related crime
194.4
162.8
139.3120.3 116.0 123.3 131.7
0.0
30.5
61.0
91.5
122.0
152.5
183.0
213.5
April to March
Rat
ios
Burglary at non-residential premises

18The theft of vehicle ratio decreased by 7,9%
between 2006/2007 and 2007/2008
Property-related crime
216.1
204.9 167.7182.1183.3180.0190.0
0
50
100
150
200
250
April to March
Rat
ios
Theft of motor vehicle and motorcycle

19The theft out of/from vehicle ratio decreased by 10,8%
between 2006/2007and 2007/2008
Property-related crime
444.6 431.0370.8
318.8 296.6261.7
233.4
0.0
90.0
180.0
270.0
360.0
450.0
540.0
April to March
Rat
ios
Theft out of or from motor vehicle

20The stock-theft ratio decreased by 1,2%
between 2006/2007 and 2007/2008
Property-related crime
60.160.861.3
70.1
89.0102.7
92.9
0.0
20.5
41.0
61.5
82.0
102.5
123.0
April to March
Rat
ios
Stock-theft

21
1.4.1 Illegal possession of firearms and
ammunition
1.4.2 Drug-related crimes
1.4.3 Driving under the influence of alcohol
or drugs
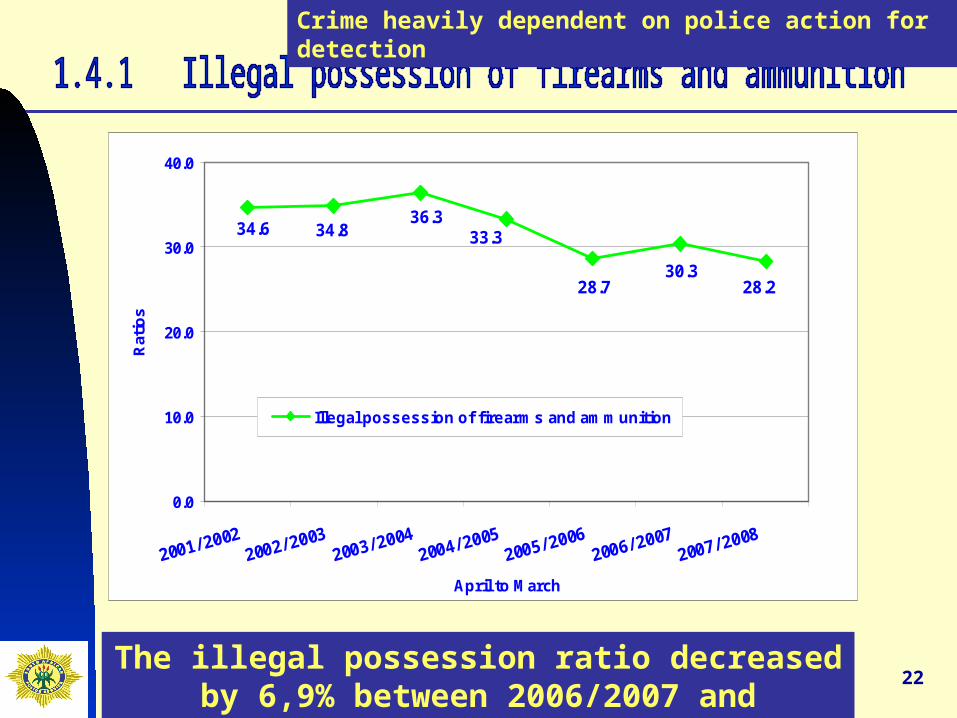
22The illegal possession ratio decreased by 6,9%
between 2006/2007 and 2007/2008
Crime heavily dependent on police action for detection
34.834.636.3
33.3
28.730.3
28.2
0.0
10.0
20.0
30.0
40.0
April to March
Rat
ios
Illegal possession of firearms and ammunition

23The drug-related crime ratio increased by 3,3%
between 2006/2007 and 2007/2008
Crime heavily dependent on police action for detection
118.0 118.4135.1
180.3204.1
220.9 228.1
0.0
50.0
100.0
150.0
200.0
250.0
April to March
Ratio
s
Drug-related crime

24The driving under the influence ratio increased by
25,4% between 2006/2007 and 2007/2008
Crime heavily dependent on police action for detection
54.8 48.7 53.764.2
70.680.7
101.2
0.0
20.0
40.0
60.0
80.0
100.0
120.0
2001/ 20022002/ 2003
2003/ 20042004/ 2005
2005/ 20062006/ 2007
2007/ 2008
April to March
Rat
ios
Driving under the influence of alcohol or drugs

25
1.5.1 All theft not mentioned elsewhere
1.5.2 Commercial crime
1.5.3 Shoplifting

26The other theft ratio decreased by 5,7%
between 2006/2007 and 2007/2008
Other serious crime
1 286.7
1 364.6
1 307.5
1 151.1
922.7 876.0
826.1
0.0
250.0
500.0
750.0
1 000.0
1 250.0
1 500.0
2001/ 20022002/ 2003
2003/ 20042004/ 2005
2005/ 20062006/ 2007
2007/ 2008
April to March
Ra
tio
s
All theft not mentioned elsewhere

27
Other serious crime
115.8 115.6
130.2136.4
120.4123.7130.4
0.0
30.0
60.0
90.0
120.0
150.0
April to March
Rat
ios
Commercial crime
The commercial crime ratio increased by 4,8%between 2006/2007 and 2007/2008

28The shoplifting ratio increased by 1,3%
between 2006/2007 and 2007/2008
Other serious crime
152.6 151.8 155.0142.8 137.5 138.2 140.0
0.0
44.0
88.0
132.0
176.0
April to March
Rat
ios
Shoplifting

29
1.1.7.1 Carjacking
1.1.7.2 Robbery at residential premises
(House robbery)
1.1.7.3 Robbery at non-residential premises
(Business robbery)
1.1.7.4 Truck hijacking
1.1.7.5 Robbery of cash in transit
1.1.7.6 Bank robbery
1.1.7.7 Public/street robbery
Raw figures are used

30
Figure 1
27,2%
67,0%
3,8%
2,0%
Other Serious Crimes
Contact Crimes(excludingaggravated robbery)
Aggravated Robbery(excluding highprofile subcategories)
High profile violentcrimes

31
Figure 2
66,0%
0,1%
0,3% 1,1%
8,3%
12,2%
12,0%
Public/Street robbery
Carjacking
Robbery at residentialpremises
Robbery at businesspremises
Truck hijacking
Robbery of cash intransit
Bank robbery

32The carjacking increased by 4,4% (602)
between 2006/2007 and 2007/2008
Subcategory of aggravated robbery
15 84614 691
13 79312 434 12 825
13 599
14 201
0
3 500
7 000
10 500
14 000
17 500
April to March
Raw
fig
ure
s
Carjacking

33
1.1.7.1 (b) Carjacking sorted from highest decreases to highest increases between 2006/2007 and 2007/2008.
TABLE 1
Policing Area 2006/2007 2007/2008 Difference % Inc. or Dec.
RSA 13 599 14 201 602 4.4%
Eastern Cape 607 604 - 3 -0,5%Western Cape 911 923 12 1,3%Gauteng 7 314 7 466 152 2,1%North West 284 291 7 2,5%Limpopo 196 203 7 3,6%KwaZulu-Natal 3 563 3 889 326 9,1%Mpumalanga 597 664 67 11,2%Northern Cape 4 5 1 25,0%Free State 123 156 33 26,8%

20 Stations depicting the highest incidence of carjacking
1. Booysens (Gauteng) 11. Jhb Central (Gauteng)
2. Pinetown (KZN) 12. Cleveland (Gauteng)
3. Umlazi (KZN) 13. Durban Central (KZN)
4. Phoenix (KZN) 14. Boksburg (Gauteng)
5. Sandton (Gauteng) 15. Brackendowns (Gauteng)
6. Mondeor (Gauteng) 16. Isipingo (KZN)
7. Chatsworth (KZN) 17. Jeppe (Gauteng)
8. Midrand (Gauteng) 18. Newlands East (KZN)
9. Bramley (Gauteng) 19. Springs (Gauteng)
10. Moroka (Gauteng) 20. Edenvale (Gauteng)
Cumulative total : 23.9%
TABLE 2
34
35
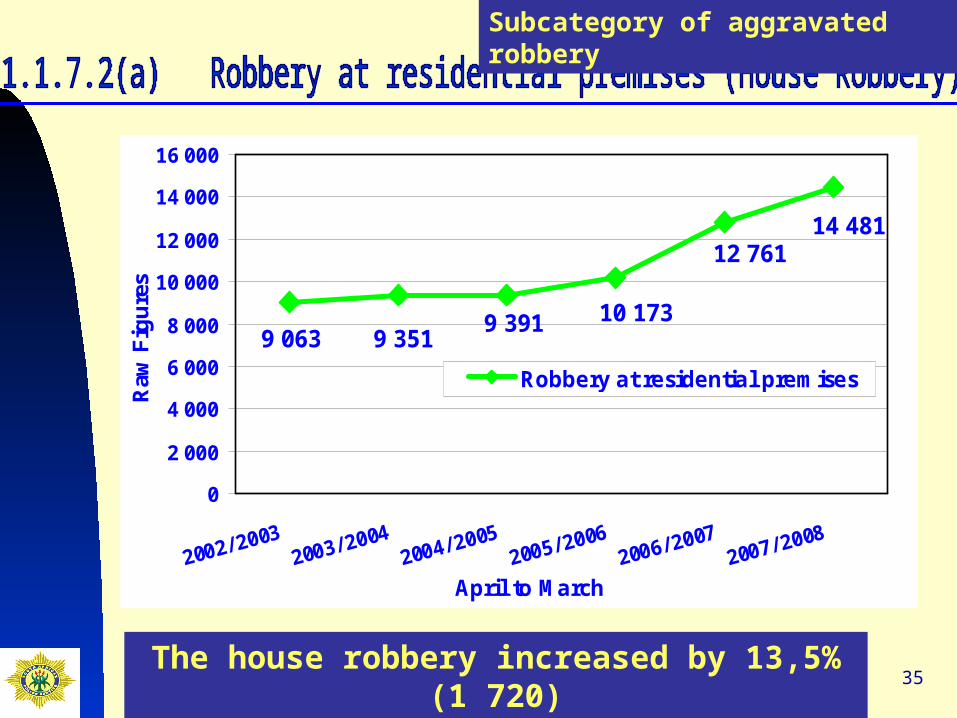
14 48112 761
9 3519 06310 1739 391
0
2 000
4 000
6 000
8 000
10 000
12 000
14 000
16 000
April to March
Raw
Fig
ure
s
Robbery at residential premises
The house robbery increased by 13,5% (1 720) between 2006/2007and 2007/2008
Subcategory of aggravated robbery

36
1.1.7.2 (b) Robbery at residential premises sorted from highest decreases to highest increases between 2006/2007 and 2007/2008.
TABLE 3
Policing Area 2006/2007 2007/2008 Difference % Inc. or Dec.
RSA 12 761 14 481 1 720 13,5%
Gauteng 7 732 7 314 - 418 -5,4%Northern Cape 10 12 2 20,0%Western Cape 658 796 138 21,0%Kwazulu-Natal 2 667 3 480 813 30,5%North West 584 821 237 40,6%Mpumalanga 540 862 322 59,6%Eastern Cape 344 662 318 92,4%Limpopo 162 319 157 96,9%Free State 64 215 151 235,9%

20 Stations depicting the highest incidence of residential robbery
1. Sandton (Gauteng) 11. Douglasdale (Gauteng)
2. Honeydew (Gauteng) 12. Roodepoort (Gauteng)
3. Tembisa (Gauteng) 13. Brooklyn (Gauteng)
4. KwaMashu (KZN) 14. Parkview (Gauteng)
5. Midrand (Gauteng) 15. Garsfontein (Gauteng)
6. Umlazi (KZN) 16. Kwadukuza (KZN)
7. Ivory Park (Gauteng) 17. Esikhawini (KZN)
8. Wierdabrug (Gauteng) 18. Kanyamazane (MP)
9. Rustenburg (NW) 19. Inanda (KZN)
10. Booysens (Gauteng) 20. Randburg (Gauteng)
Cumulative total : 25.3%
TABLE 4

38
Subcategory of aggravated robbery
3 3203 6774 387
6 689
9 862
5 498
0
1 500
3 000
4 500
6 000
7 500
9 000
10 500
2002/ 20032003/ 2004
2004/ 20052005/ 2006
2006/ 20072007/ 2008
April to March
Raw
fig
ure
s
Robbery at business premises
The business robbery increased by 47,4% (3 173) between 2006/2007 and 2007/2008

39
1.1.7.3 (b) Robbery at non-residential premises sorted from lowest to highest increases between 2006/2007 and 2007/2008
TABLE 4unVao day nghe bai nay di ban http://nhatquanglan.xlphp.net/
TABLE 5
Policing Area 2006/2007 2007/2008 Difference % Inc. or Dec.
RSA 6 689 9 862 3 173 47,4%
Gauteng 4 492 5 098 606 13,5%Mpumalanga 195 305 110 56,4%North West 406 747 341 84,0%KwaZulu-Natal 997 1 923 926 92,9%Eastern Cape 241 488 247 102,5%Western Cape 197 635 438 222,3%Northern Cape 16 54 38 237,5%Limpopo 83 314 231 278,3%Free State 62 298 236 380,6%

20 Stations depicting the highest incidence of business robbery
Cumulative total : 25.0%
1. Jhb Central (Gauteng) 11. Phoenix (KZN)
2. Durban Central (KZN) 12. Pietermaritzburg (KZN)
3. Pinetown (KZN) 13. Alberton (Gauteng)
4. Booysens (Gauteng) 14. Randburg (Gauteng)
5. Rustenburg (NW) 15. Bramley (Gauteng)
6. Sandton (Gauteng) 16. Greenwood Park (KZN)
7. Honeydew (Gauteng) 17. Jeppe (Gauteng)
8. Boksburg North (Gauteng) 18. Florida (Gauteng)
9. Benoni (Gauteng) 19. Kempton Park (Gauteng)
10. Germiston (Gauteng) 20. Springs (Gauteng)
TABLE 4unVao day nghe bai nay di ban http://nhatquanglan.xlphp.net/
TABLE 6
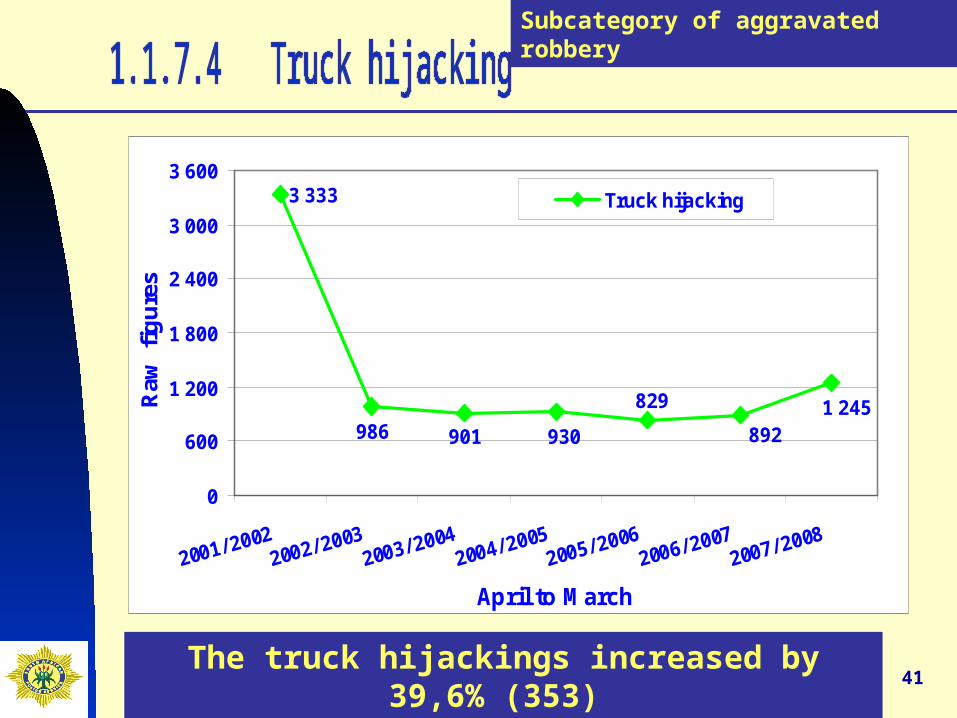
41The truck hijackings increased by 39,6% (353)
between 2006/2007 and 2007/2008
Subcategory of aggravated robbery
1 245 892
829
930 901 986
3 333
0
600
1 200
1 800
2 400
3 000
3 600
April to March
Raw
fig
ure
s
Truck hijacking

42
1.1.7.4 (b) Truck hijacking sorted from highest decreases to highest increases between 2006/2007 and 2007/2008
TABLE 7
Province 2006/2007 2007/2008 Difference % Inc. or Dec.
RSA 892 1 245 353 39,6%
Northern Cape 3 1 - 2 -66,7%Limpopo 15 14 - 1 -6,7%North West 81 77 - 4 -4,9%Eastern Cape 23 28 5 21,7%Free State 50 64 14 28,0%Gauteng 536 754 218 40,7%KwaZulu-Natal 85 133 48 56,5%Mpumalanga 90 151 61 67,8%Western Cape 9 23 14 155,6%
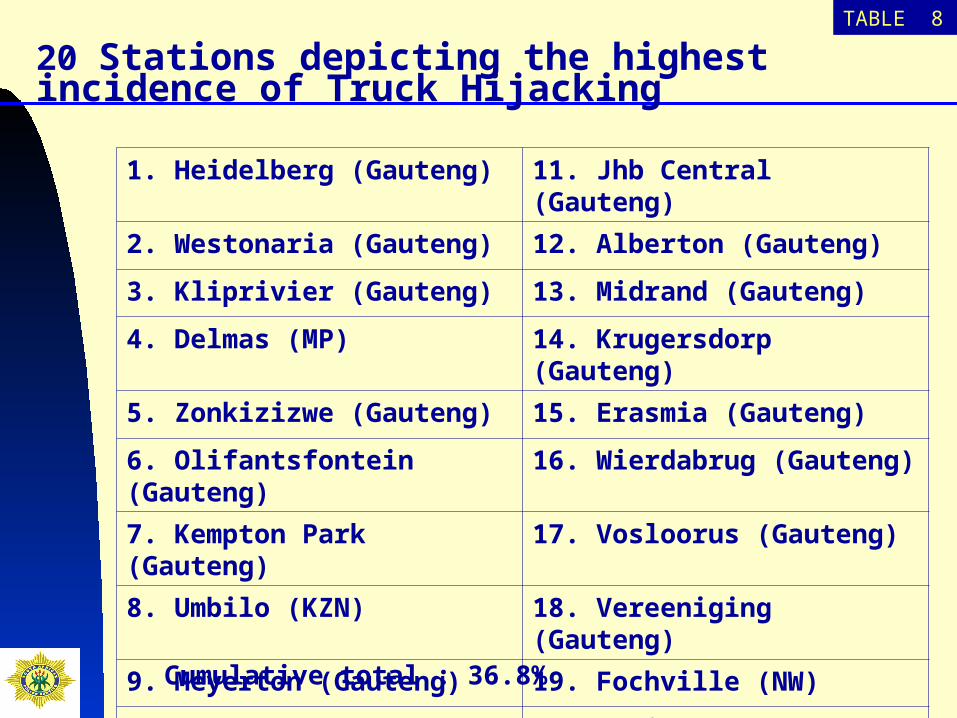
20 Stations depicting the highest incidence of Truck Hijacking
Cumulative total : 36.8%
1. Heidelberg (Gauteng) 11. Jhb Central (Gauteng)
2. Westonaria (Gauteng) 12. Alberton (Gauteng)
3. Kliprivier (Gauteng) 13. Midrand (Gauteng)
4. Delmas (MP) 14. Krugersdorp (Gauteng)
5. Zonkizizwe (Gauteng) 15. Erasmia (Gauteng)
6. Olifantsfontein (Gauteng) 16. Wierdabrug (Gauteng)
7. Kempton Park (Gauteng) 17. Vosloorus (Gauteng)
8. Umbilo (KZN) 18. Vereeniging (Gauteng)
9. Meyerton (Gauteng) 19. Fochville (NW)
10. Brackendowns (Gauteng) 20. Springs (Gauteng)
TABLE 8

44The bank robbery increased by 11,6% (15)
between 2006/2007 and 2007/2008
Subcategory of aggravated robbery
144129
595854
127
356
0
80
160
240
320
400
2001/ 20022002/ 2003
2003/ 20042004/ 2005
2005/ 20062006/ 2007
2007/ 2008
April to March
Ra
w f
igu
res
Bank robbery

45The CIT robberies decreased by -15,4% (-72)
between 2006/2007 and 2007/2008
Subcategory of aggravated robbery
220
383
467
395
192
374
238
0
80
160
240
320
400
480
2001/ 20022002/ 2003
2003/ 20042004/ 2005
2005/ 20062006/ 2007
2007/ 2008
April to March
Raw
fig
ure
s
Robbery of cash in transit

46The public/street robbery decreased by 15,3% (-13
904) between 2006/2007 and 2007/2008
Subcategory of aggravated robbery
96 963 96 166105 690
78 117
92 02191 070100 436
0
25 000
50 000
75 000
100 000
125 000
2001/ 20022002/ 2003
2003/ 20042004/ 2005
2005/ 20062006/ 2007
2007/ 2008
April to March
Raw
fig
ure
s
Public/Street robbery

20 Stations depicting the highest incidence of street robbery
Cumulative total : 21.7%
1. Durban Central (KZN) 11. Nyanga (WC)
2. Jhb Central (Gauteng) 12. Pinetown (KZN)
3. Hillbrow (Gauteng) 13. Rustenburg (NW)
4. Mitchells Plain (WC) 14. Cape Town Central (WC)
5. Pta Central (Gauteng) 15. Thabong (FS)
6. Khayelitsha (WC) 16. Kwazakele (EC)
7. Booysens (Gauteng) 17. Galeshewe (NC)
8. Umlazi (KZN) 18. Sunnyside (Gauteng)
9. Parkweg (FS) 19. Dobsonville (Gauteng)
10. KwaMashu (KZN) 20. Phoenix (KZN)
47
TABLE 9

48
End of presentation
THANK YOU