Embed Size (px)
Citation preview
The crime statistics cover five broad categories of crime: Contact crimes Contact-related crimes Property-related crimes Crimes heavily dependent on police action for detection Other serious crimes
Detailed analysis is presented only with regard to contact crimes and the subcategories of aggravated robbery.
The figures in the accompanying graphs represent crime ratios, i.e. the incidence of crime per 100 000 of the South African population.

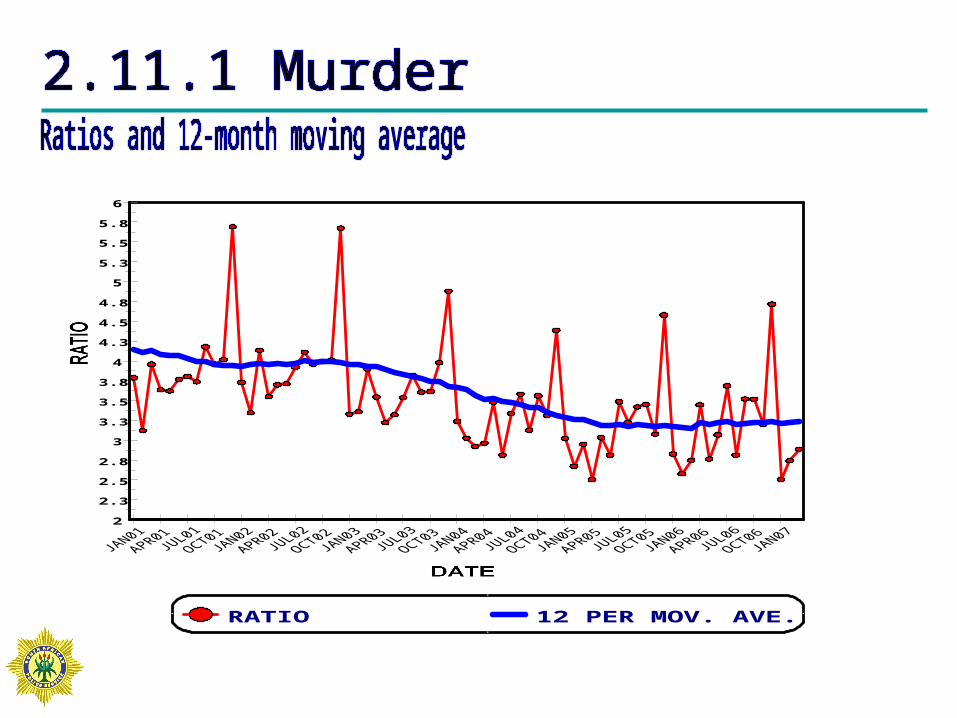
Murder
Rape
Indecent assault
Attempted murder
Assault with the intent to inflict grievous bodily harm
Common assault
Robbery with aggravating circumstances
Common robbery
CRIMES AGAINST THE PERSON
Contact crime
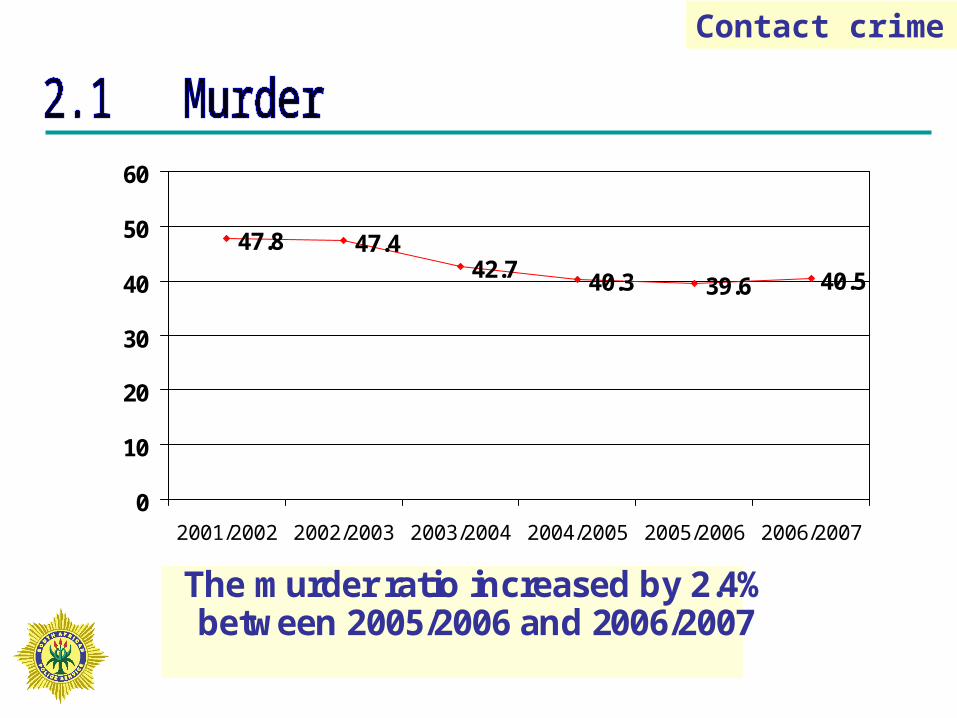
The murder ratio increased by 2.4%between 2005/2006 and 2006/2007
47.8 47.442.7 40.3 39.6 40.5
0
10
20
30
40
50
60
2001/2002 2002/2003 2003/2004 2004/2005 2005/2006 2006/2007
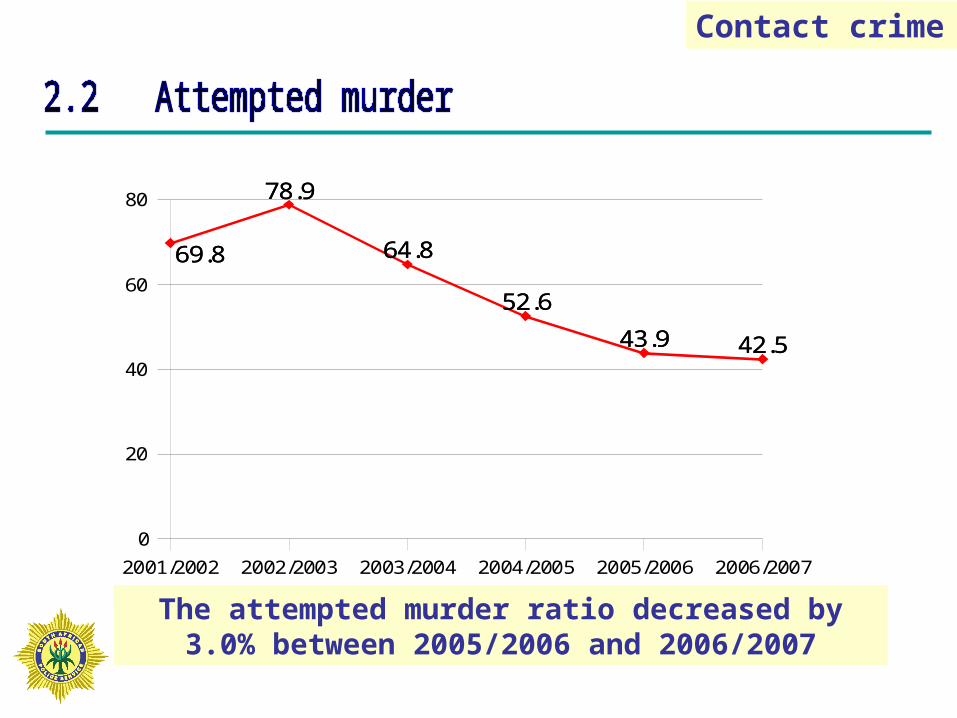
The attempted murder ratio decreased by 3.0% between 2005/2006 and 2006/2007
69.8
78.9
64.8
52.6
43.9 42.5
69.8
78.9
64.8
52.6
43.9 42.5
2001/2002 2002/2003 2003/2004 2004/2005 2005/2006 2006/2007
0
20
40
60
80
Contact crime
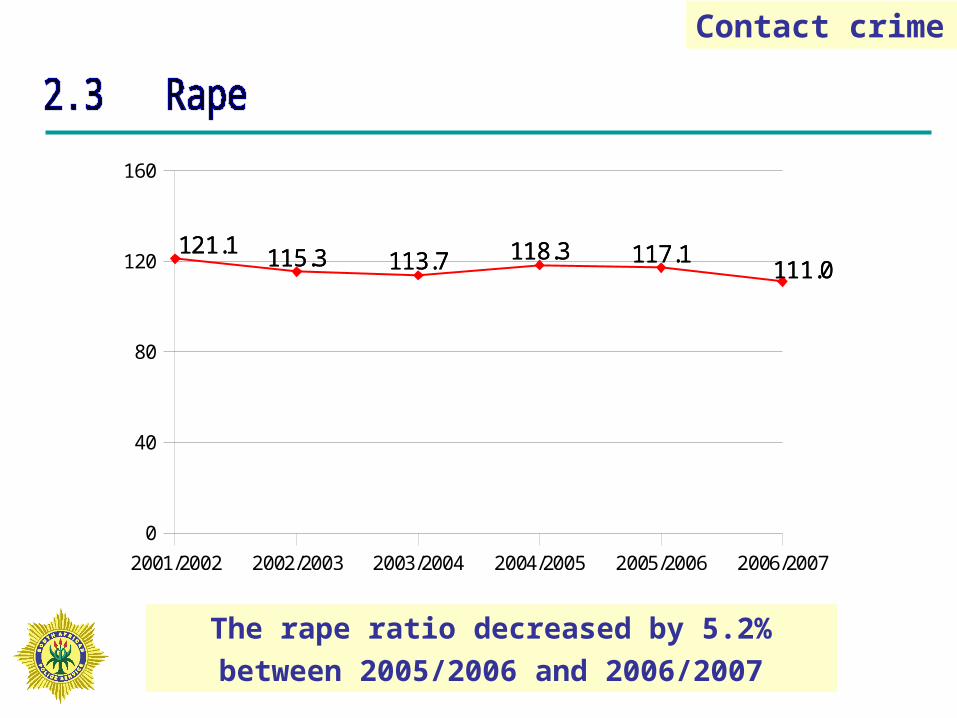
The rape ratio decreased by 5.2%
between 2005/2006 and 2006/2007
121.1 115.3 113.7 118.3 117.1111.0
121.1 115.3 113.7 118.3 117.1111.0
2001/2002 2002/2003 2003/2004 2004/2005 2005/2006 2006/2007
0
40
80
120
160
Contact crime
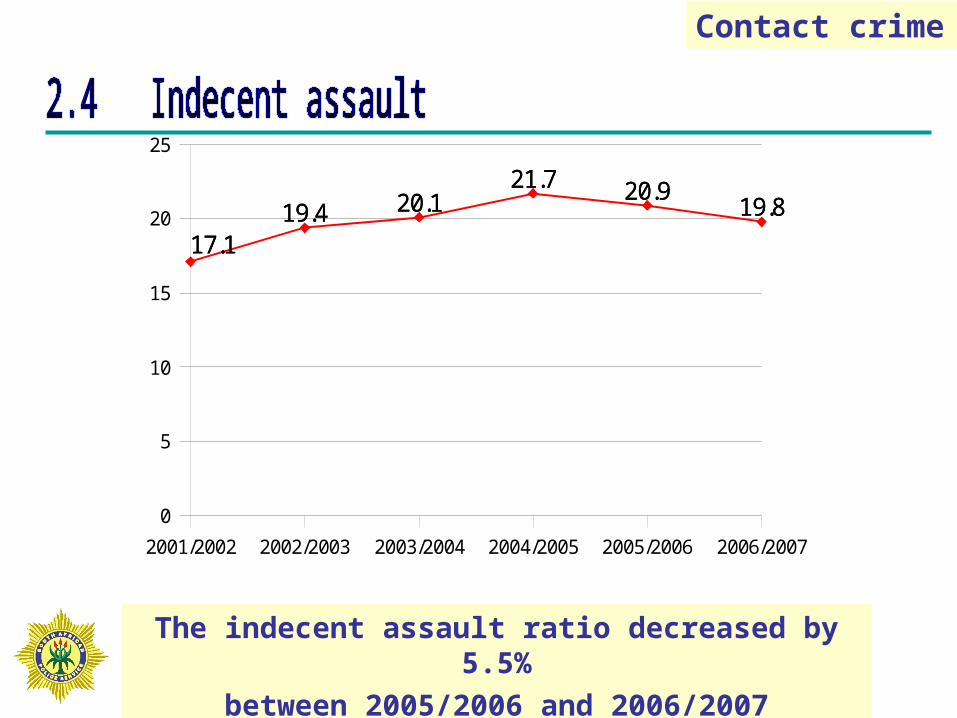
The indecent assault ratio decreased by 5.5%
between 2005/2006 and 2006/2007
17.119.4 20.1
21.7 20.919.8
17.119.4 20.1
21.7 20.919.8
2001/2002 2002/2003 2003/2004 2004/2005 2005/2006 2006/2007
0
5
10
15
20
25
Contact crime
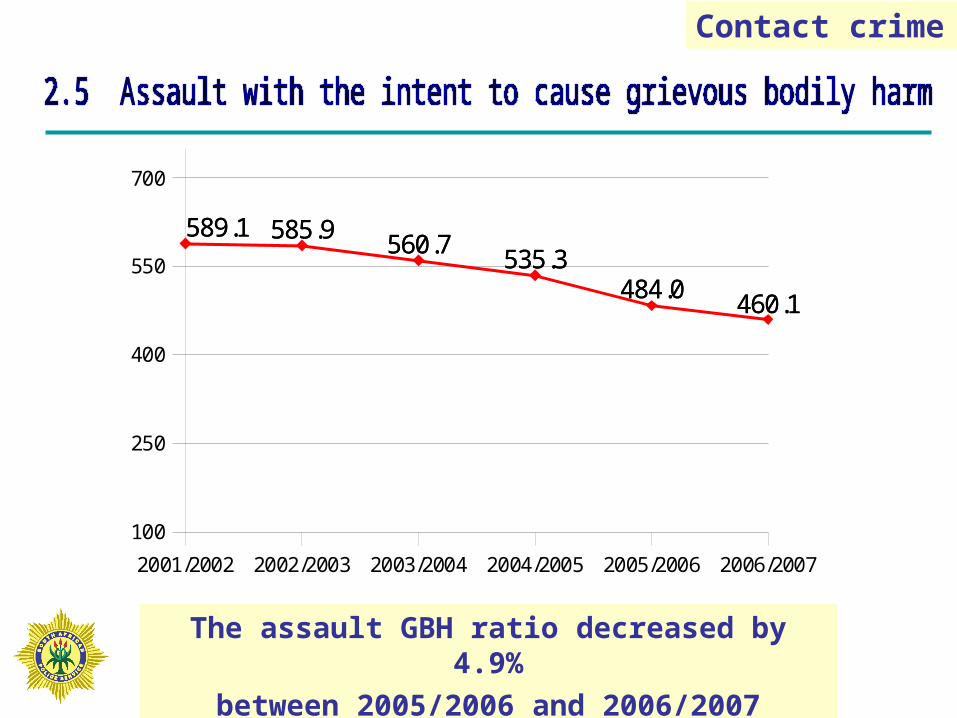
The assault GBH ratio decreased by 4.9%
between 2005/2006 and 2006/2007
589.1 585.9560.7
535.3484.0
460.1
589.1 585.9560.7
535.3484.0
460.1
2001/2002 2002/2003 2003/2004 2004/2005 2005/2006 2006/2007
100
250
400
550
700
Contact crime
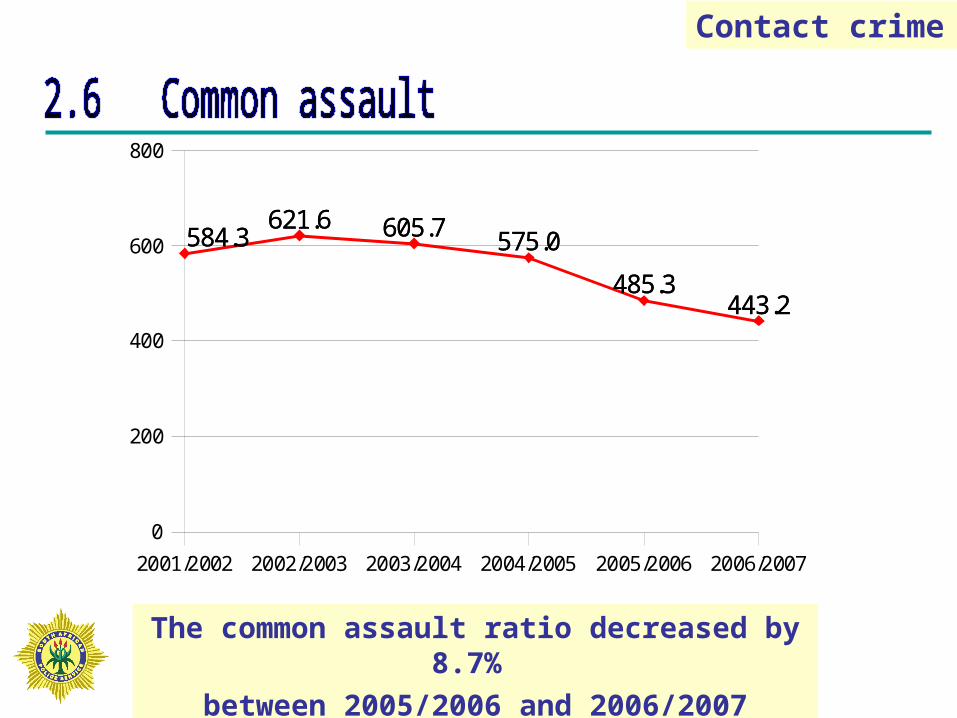
The common assault ratio decreased by 8.7%
between 2005/2006 and 2006/2007
584.3621.6 605.7 575.0
485.3443.2
584.3621.6 605.7 575.0
485.3443.2
2001/2002 2002/2003 2003/2004 2004/2005 2005/2006 2006/2007
0
200
400
600
800
Contact crime
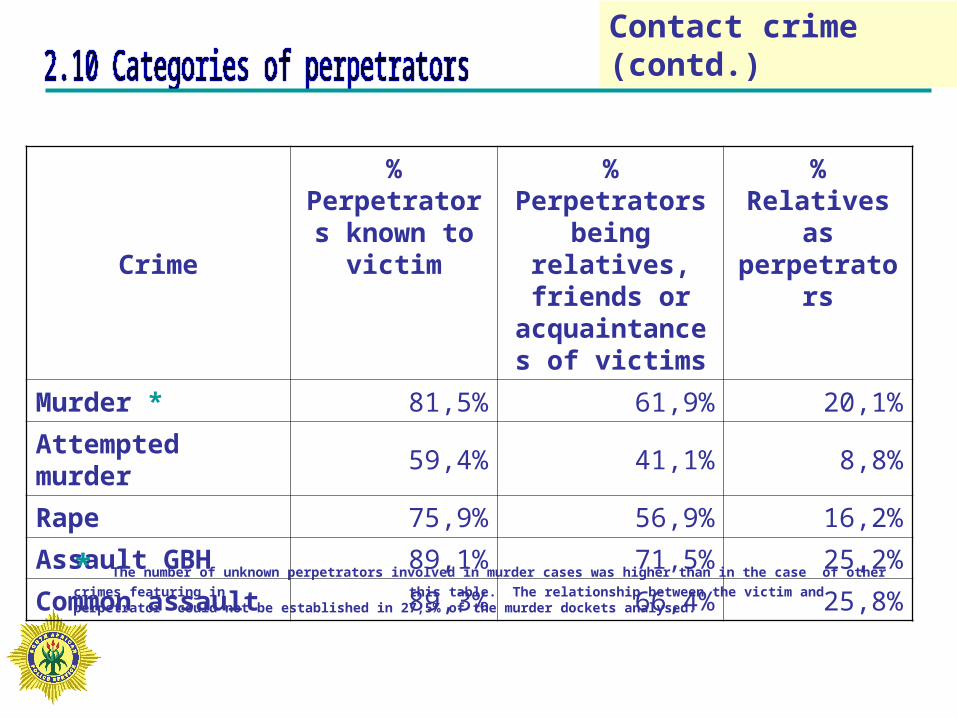
Crime
% Perpetrators
known to victim
% Perpetrators being relatives,
friends or acquaintances
of victims
% Relatives as
perpetrators
Murder * 81,5% 61,9% 20,1%
Attempted murder 59,4% 41,1% 8,8%
Rape 75,9% 56,9% 16,2%
Assault GBH 89,1% 71,5% 25,2%
Common assault 89,3% 66,4% 25,8%
* The number of unknown perpetrators involved in murder cases was higher than in the case of other
crimes featuring in this table. The relationship between the victim and perpetrator could not be established in 27,5% of the murder dockets analysed.
Contact crime (contd.)
2
2.3
2.5
2.8
3
3.3
3.5
3.8
4
4.3
4.5
4.8
5
5.3
5.5
5.8
6
RATIO 12 PER MOV. AVE.
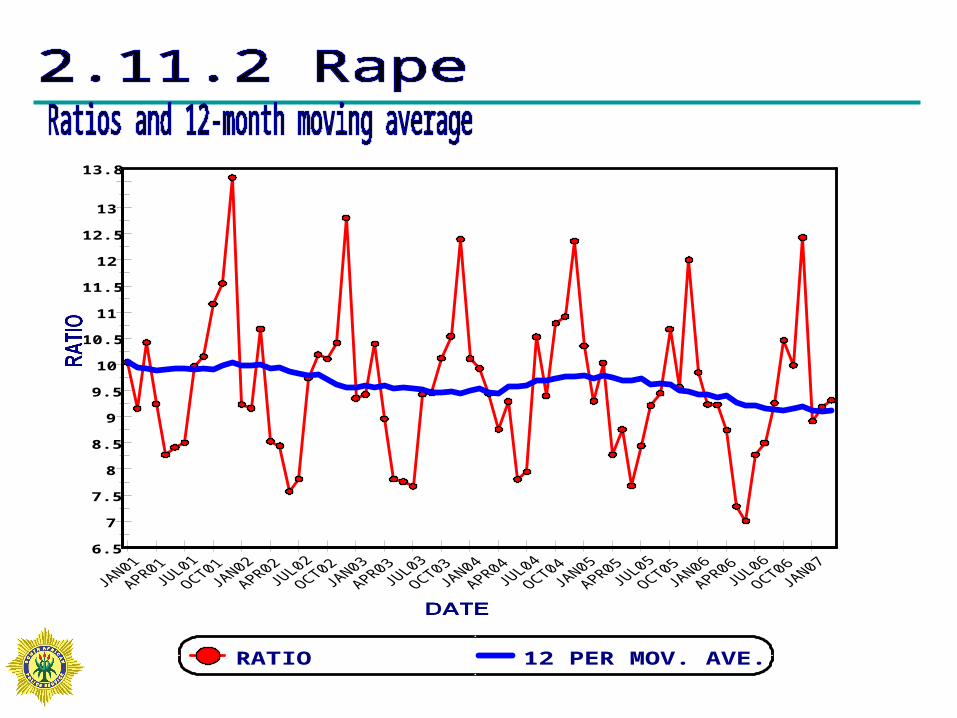
6.5
7
7.5
8
8.5
9
9.5
10
10.5
11
11.5
12
12.5
13
13.8
RATIO 12 PER MOV. AVE.
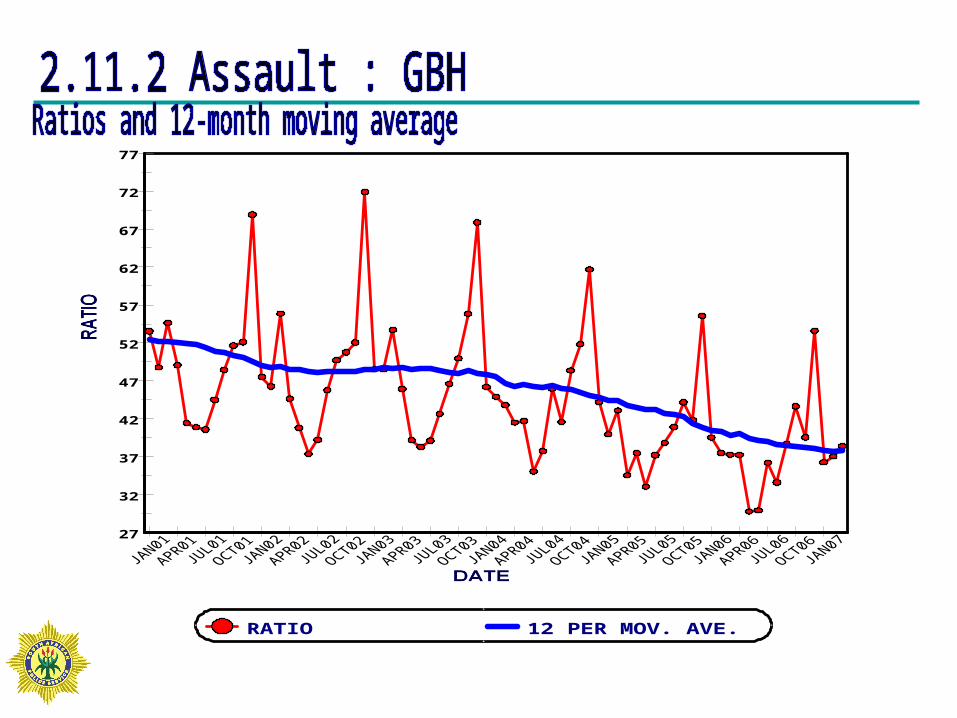
27
32
37
42
47
52
57
62
67
72
77
RATIO 12 PER MOV. AVE.
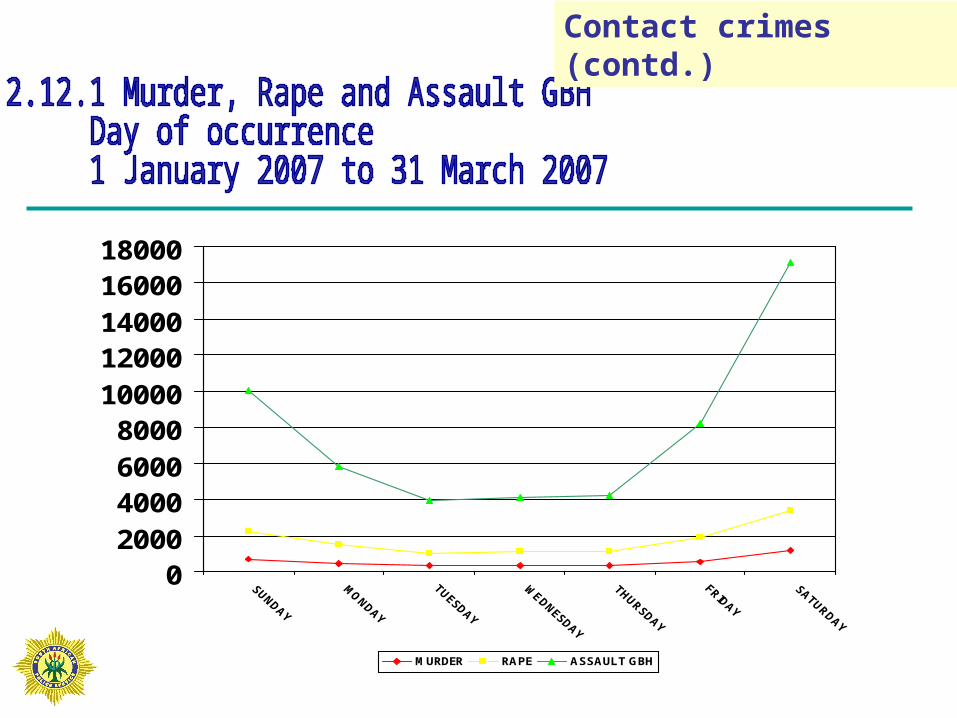
02000400060008000
1000012000140001600018000
MURDER RAPE ASSAULT GBH
Contact crimes (contd.)
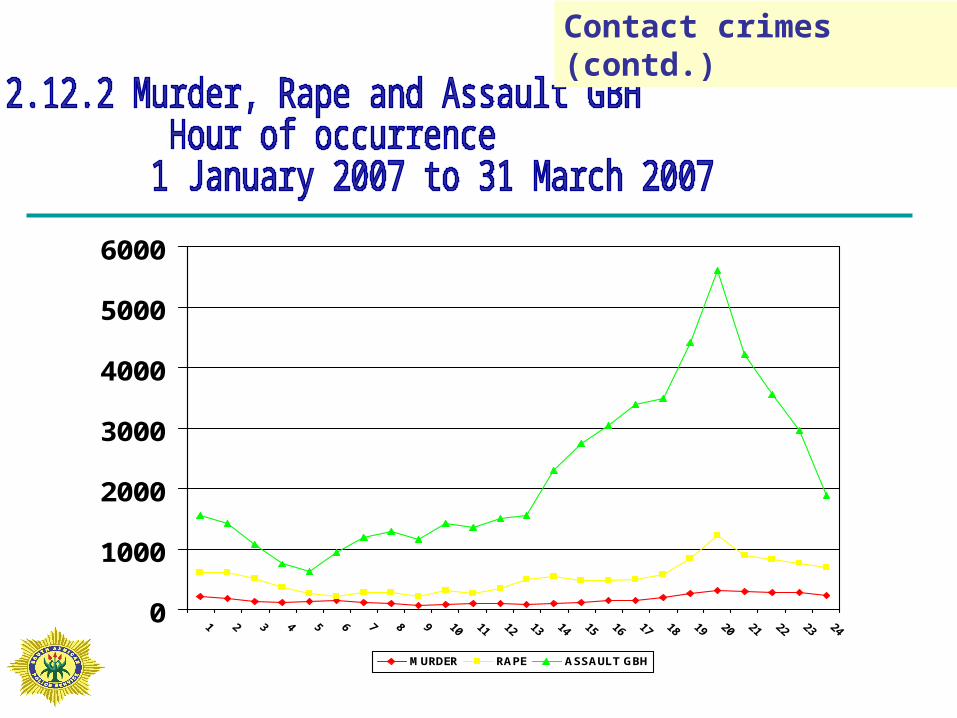
0
1000
2000
3000
4000
5000
6000
MURDER RAPE ASSAULT GBH
Contact crimes (contd.)
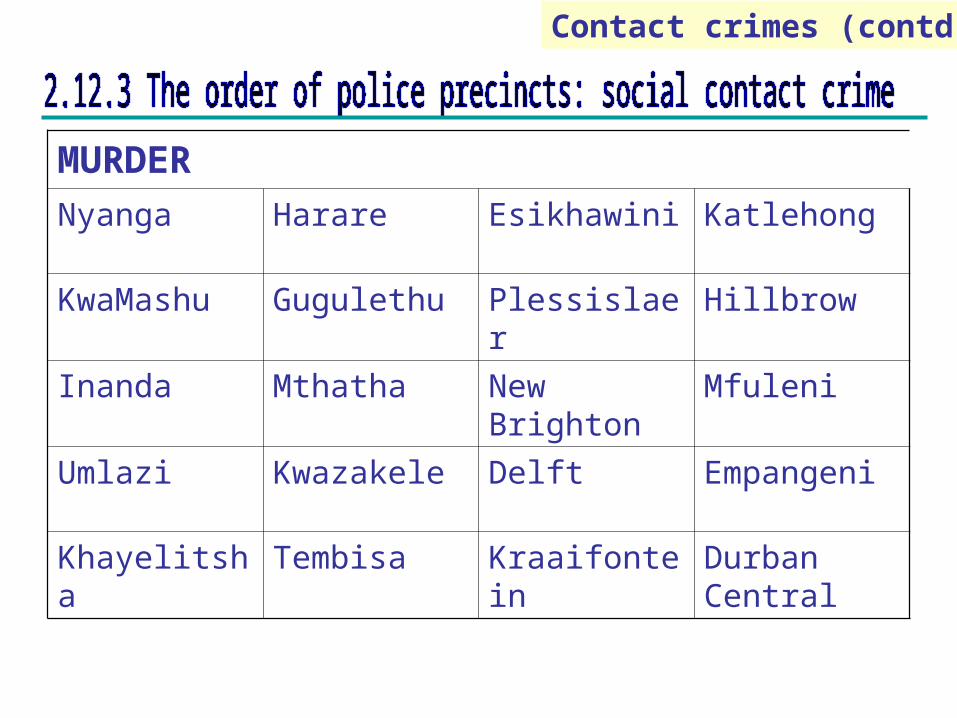
MURDER
Nyanga Harare Esikhawini Katlehong
KwaMashu Gugulethu Plessislaer Hillbrow
Inanda Mthatha New Brighton Mfuleni
Umlazi Kwazakele Delft Empangeni
Khayelitsha Tembisa Kraaifontein Durban Central
Contact crimes (contd.)
Contact crimes (contd.)
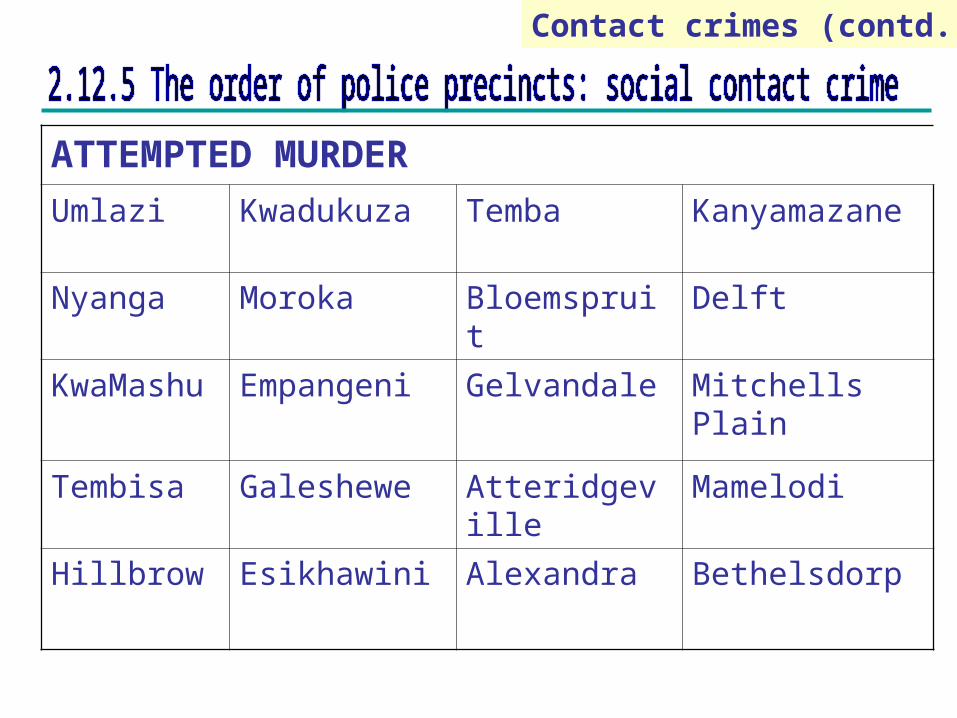
ATTEMPTED MURDER
Umlazi Kwadukuza Temba Kanyamazane
Nyanga Moroka Bloemspruit Delft
KwaMashu Empangeni Gelvandale Mitchells Plain
Tembisa Galeshewe Atteridgeville Mamelodi
Hillbrow Esikhawini Alexandra Bethelsdorp
Contact crimes (contd.)
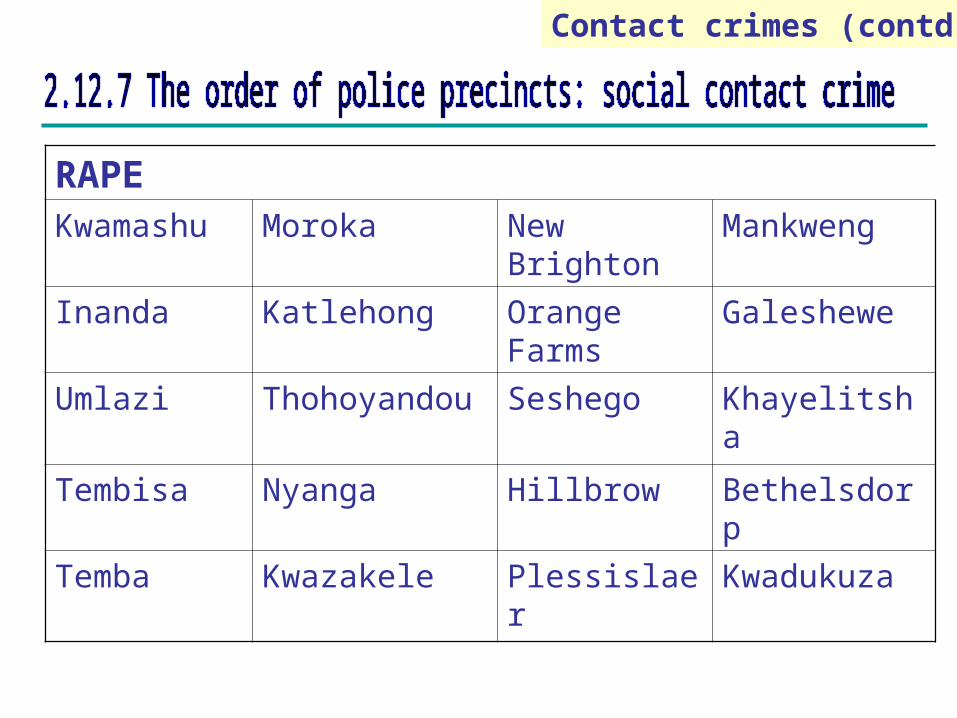
RAPEKwamashu Moroka New Brighton Mankweng
Inanda Katlehong Orange Farms
Galeshewe
Umlazi Thohoyandou Seshego Khayelitsha
Tembisa Nyanga Hillbrow Bethelsdorp
Temba Kwazakele Plessislaer Kwadukuza
Contact crimes (contd.)
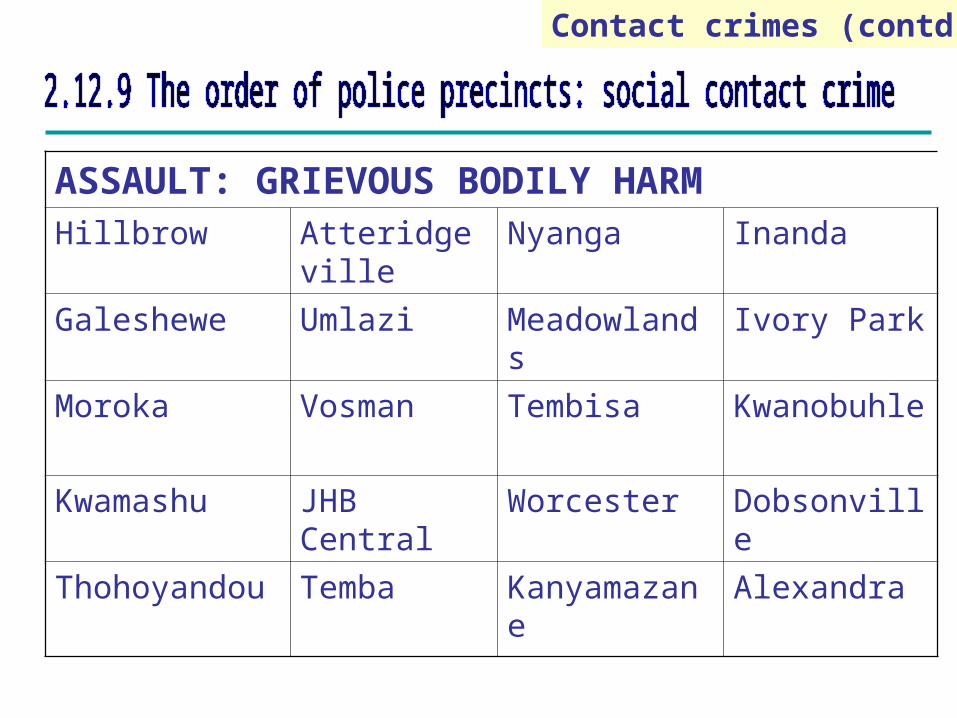
ASSAULT: GRIEVOUS BODILY HARMHillbrow Atteridgeville Nyanga Inanda
Galeshewe Umlazi Meadowlands Ivory Park
Moroka Vosman Tembisa Kwanobuhle
Kwamashu JHB Central Worcester Dobsonville
Thohoyandou Temba Kanyamazane Alexandra
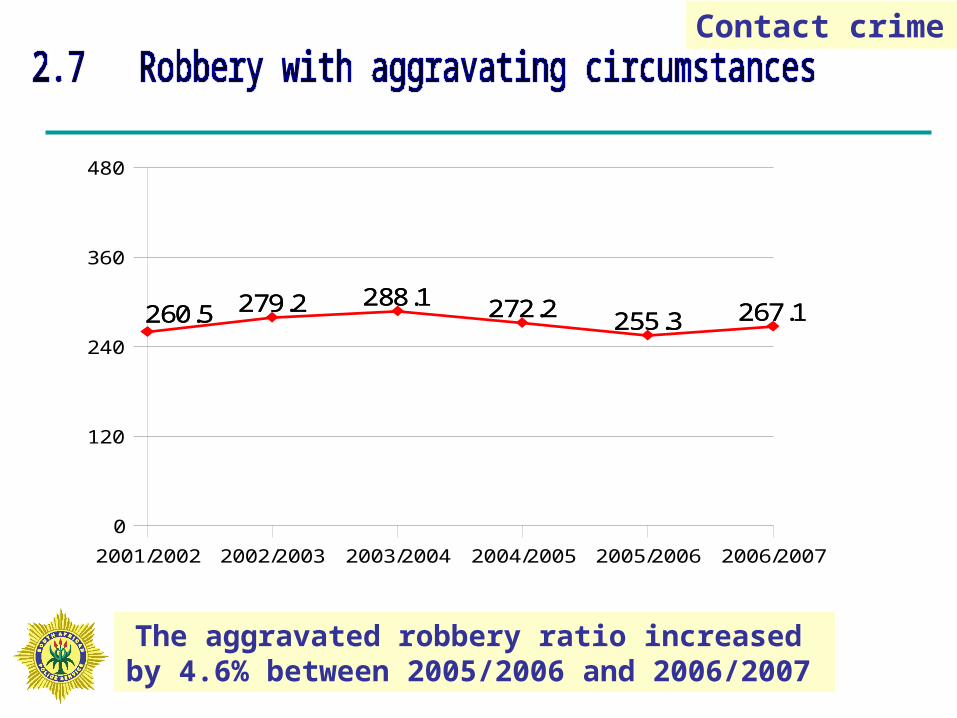
The aggravated robbery ratio increased by 4.6% between 2005/2006 and 2006/2007
260.5 279.2 288.1 272.2 255.3 267.1260.5 279.2 288.1 272.2 255.3 267.1
2001/2002 2002/2003 2003/2004 2004/2005 2005/2006 2006/2007
0
120
240
360
480
Contact crime
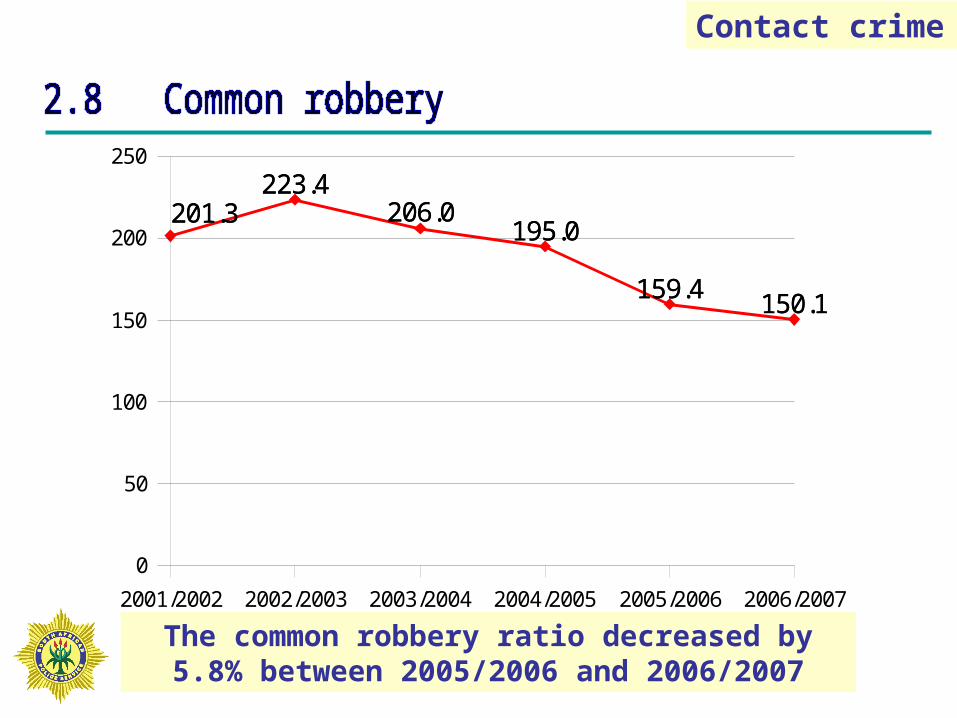
The common robbery ratio decreased by 5.8% between 2005/2006 and 2006/2007
201.3223.4
206.0195.0
159.4 150.1
201.3223.4
206.0195.0
159.4 150.1
2001/2002 2002/2003 2003/2004 2004/2005 2005/2006 2006/2007
0
50
100
150
200
250
Contact crime
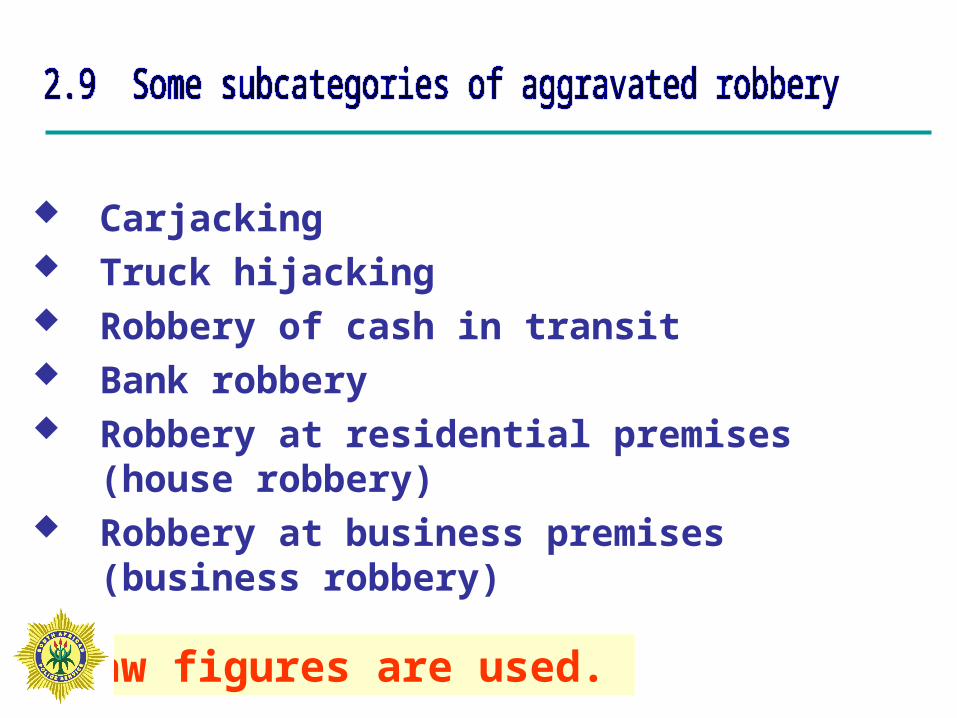
Carjacking Truck hijacking Robbery of cash in transit Bank robbery Robbery at residential premises (house
robbery) Robbery at business premises (business
robbery)
Raw figures are used.
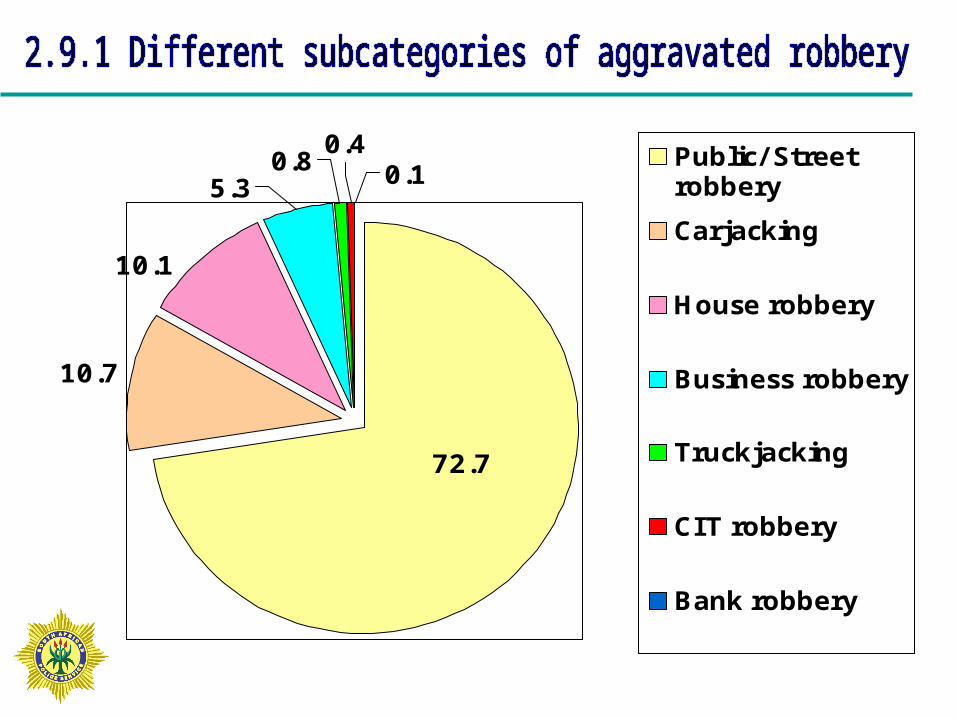
5.3 0.10.80.4
10.1
10.7
72.7
Public/ Streetrobbery
Carjacking
House robbery
Business robbery
Truckjacking
CIT robbery
Bank robbery
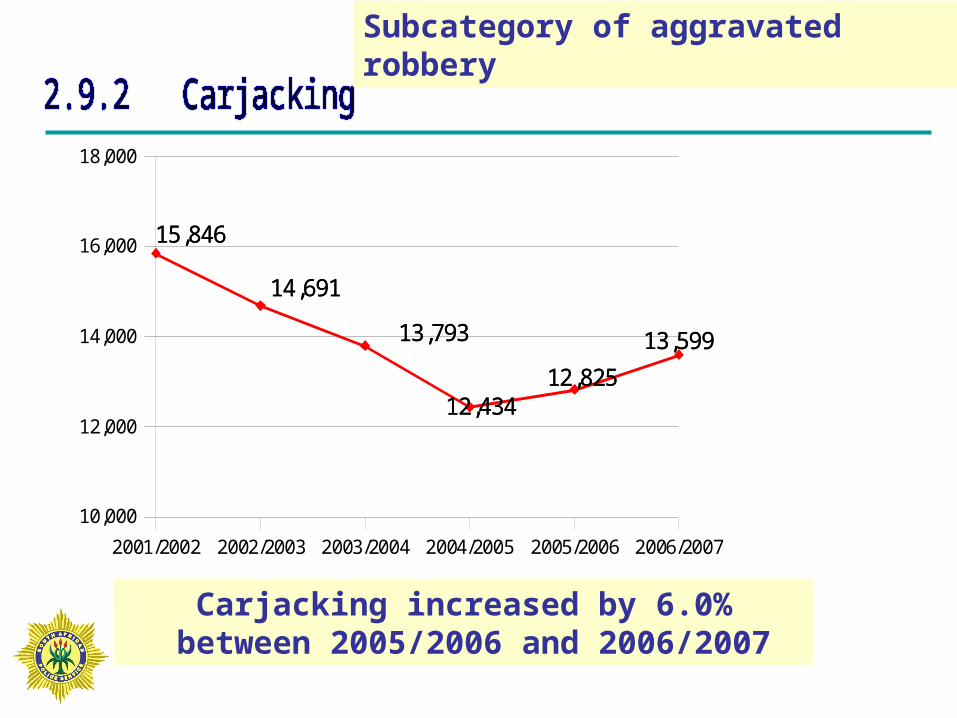
Carjacking increased by 6.0% between 2005/2006 and 2006/2007
Subcategory of aggravated robbery
15,846
14,691
13,793
12,43412,825
13,599
15,846
14,691
13,793
12,43412,825
13,599
2001/2002 2002/2003 2003/2004 2004/2005 2005/2006 2006/2007
10,000
12,000
14,000
16,000
18,000
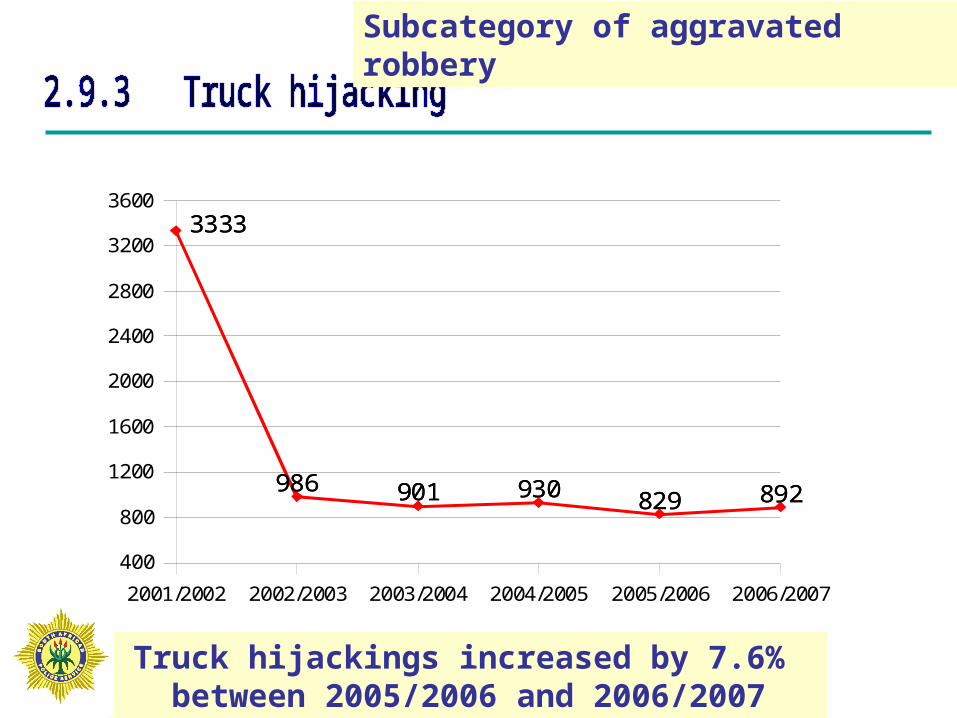
Truck hijackings increased by 7.6% between 2005/2006 and 2006/2007
3333
986 901 930 829 892
3333
986 901 930 829 892
2001/2002 2002/2003 2003/2004 2004/2005 2005/2006 2006/2007
400
800
1200
1600
2000
2400
2800
3200
3600
Subcategory of aggravated robbery
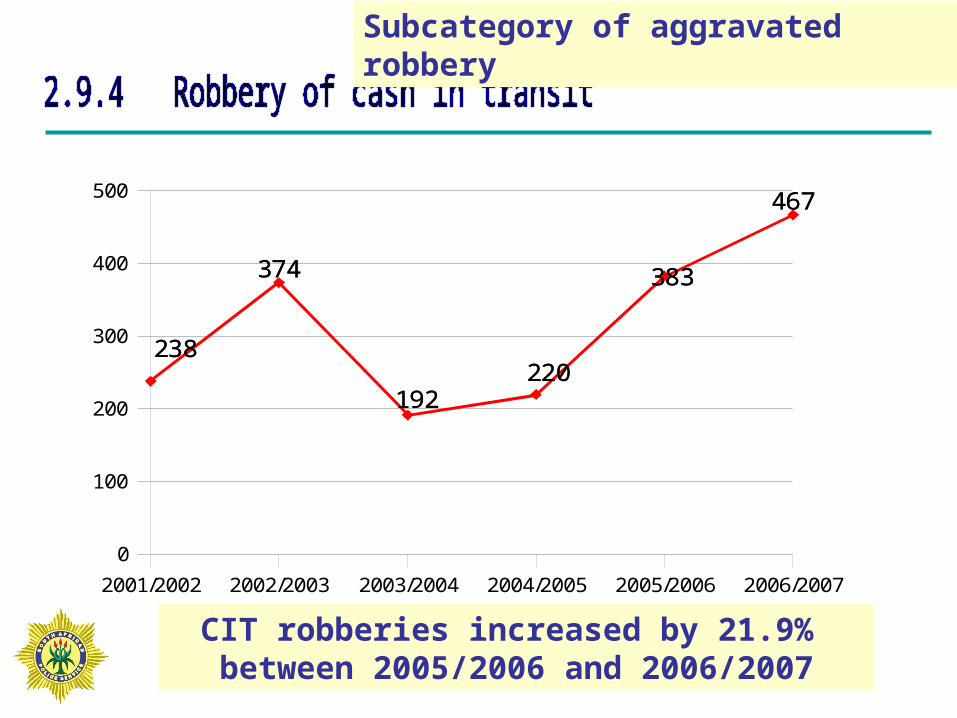
CIT robberies increased by 21.9% between 2005/2006 and 2006/2007
238
374
192220
383
467
238
374
192220
383
467
2001/2002 2002/2003 2003/2004 2004/2005 2005/2006 2006/2007
0
100
200
300
400
500
Subcategory of aggravated robbery
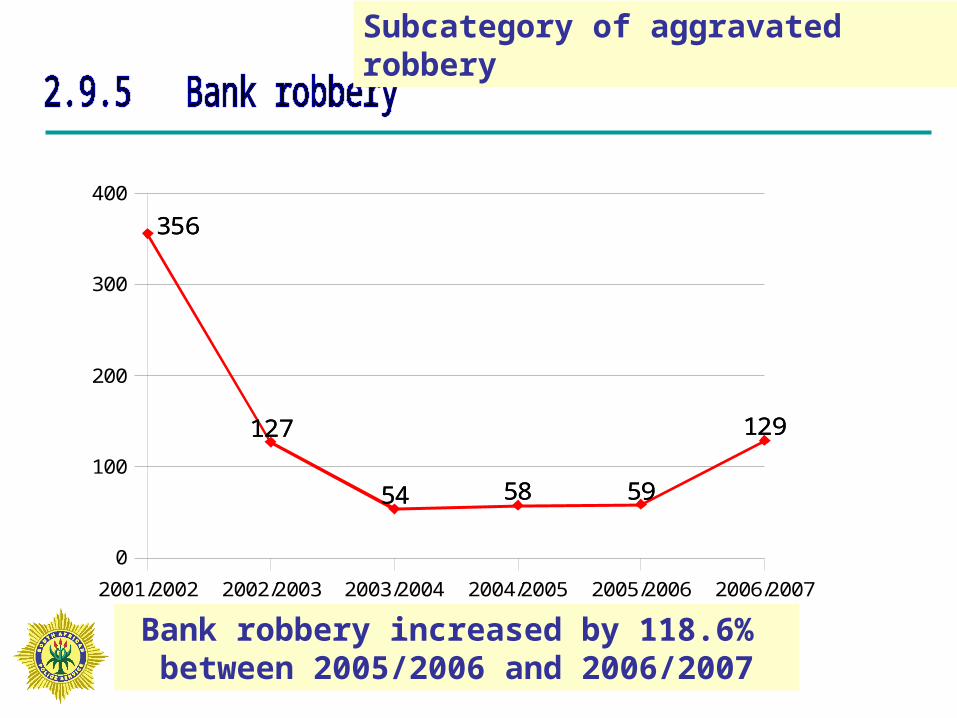
Bank robbery increased by 118.6% between 2005/2006 and 2006/2007
356
127
54 58 59
129
356
127
54 58 59
129
2001/2002 2002/2003 2003/2004 2004/2005 2005/2006 2006/2007
0
100
200
300
400
Subcategory of aggravated robbery
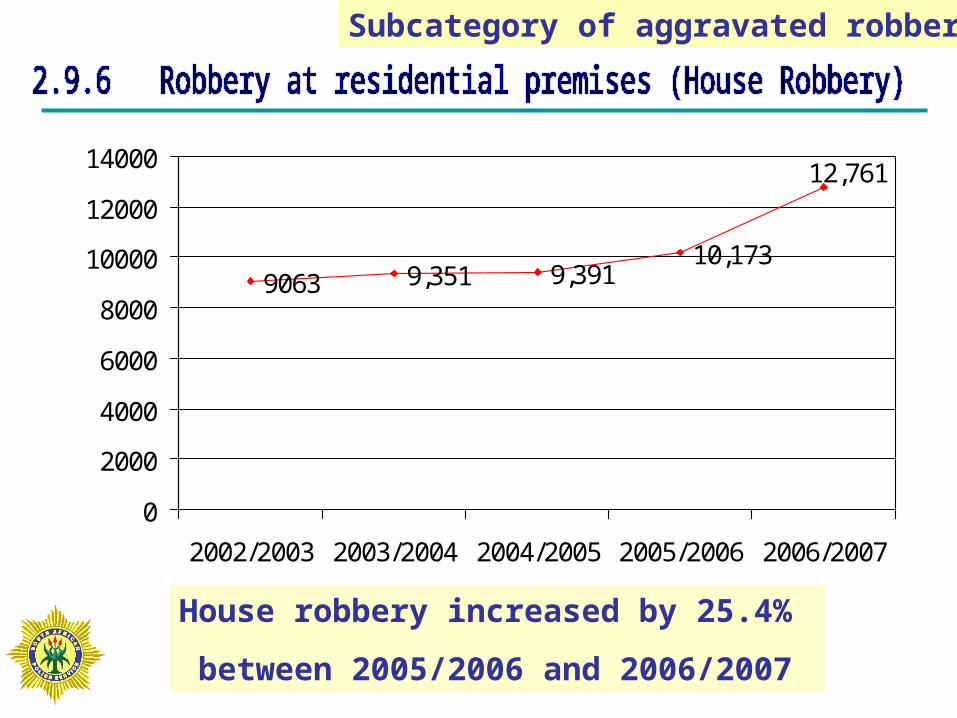
9063 9,351 9,39110,173
12,761
0
2000
4000
6000
8000
10000
12000
14000
2002/2003 2003/2004 2004/2005 2005/2006 2006/2007
House robbery increased by 25.4%
between 2005/2006 and 2006/2007
Subcategory of aggravated robbery
Subcategory of aggravated robbery
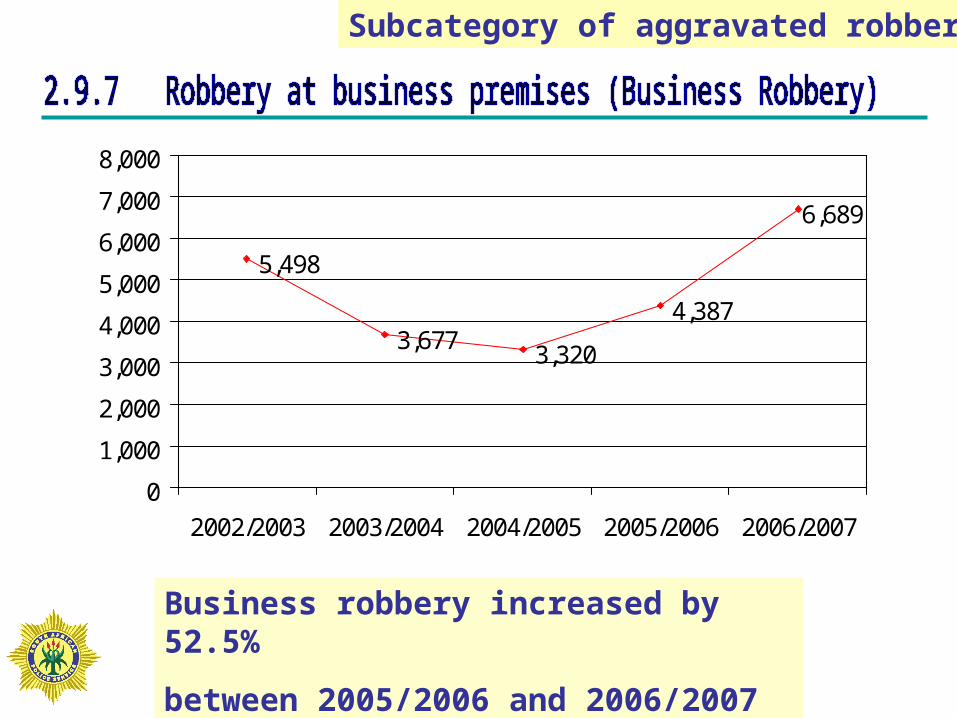
5,498
3,6773,320
4,387
6,689
0
1,000
2,000
3,000
4,000
5,000
6,000
7,000
8,000
2002/2003 2003/2004 2004/2005 2005/2006 2006/2007
Business robbery increased by 52.5%
between 2005/2006 and 2006/2007
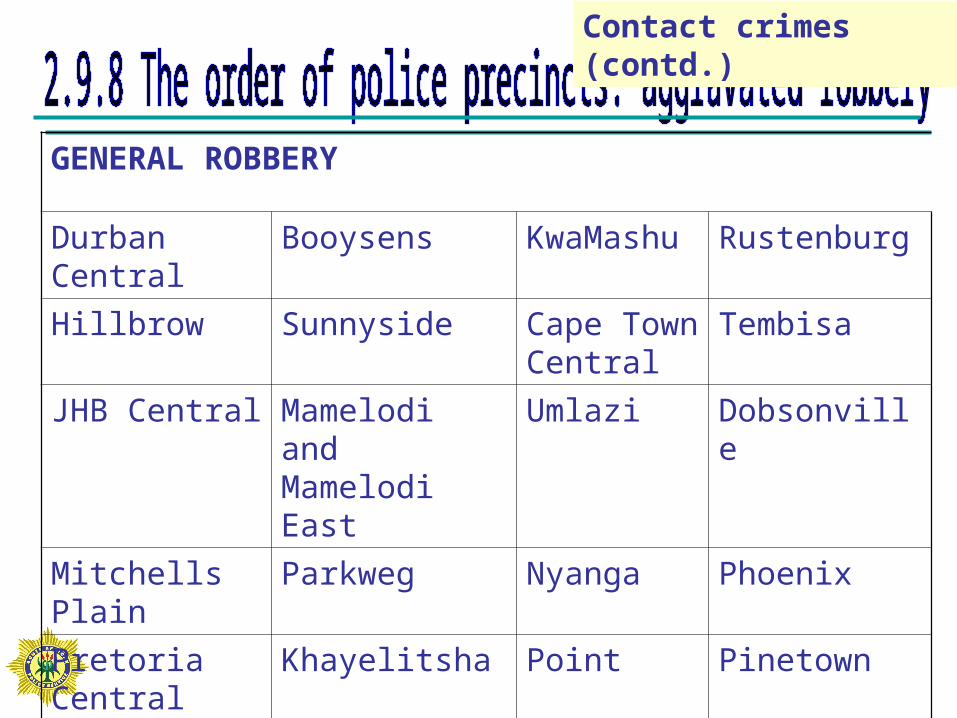
Contact crimes (contd.)
GENERAL ROBBERY
Durban Central
Booysens KwaMashu Rustenburg
Hillbrow Sunnyside Cape Town Central
Tembisa
JHB Central Mamelodi and Mamelodi East
Umlazi Dobsonville
Mitchells Plain Parkweg Nyanga Phoenix
Pretoria Central
Khayelitsha Point Pinetown
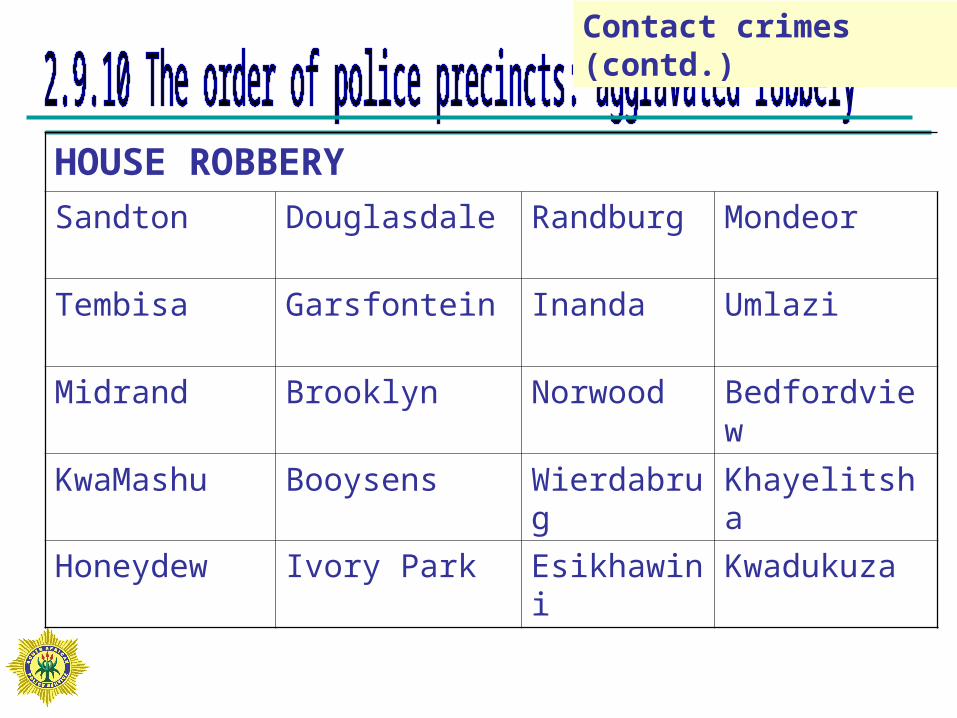
Contact crimes (contd.)
HOUSE ROBBERY
Sandton Douglasdale Randburg Mondeor
Tembisa Garsfontein Inanda Umlazi
Midrand Brooklyn Norwood Bedfordview
KwaMashu Booysens Wierdabrug Khayelitsha
Honeydew Ivory Park Esikhawini Kwadukuza
Contact crimes (contd.)
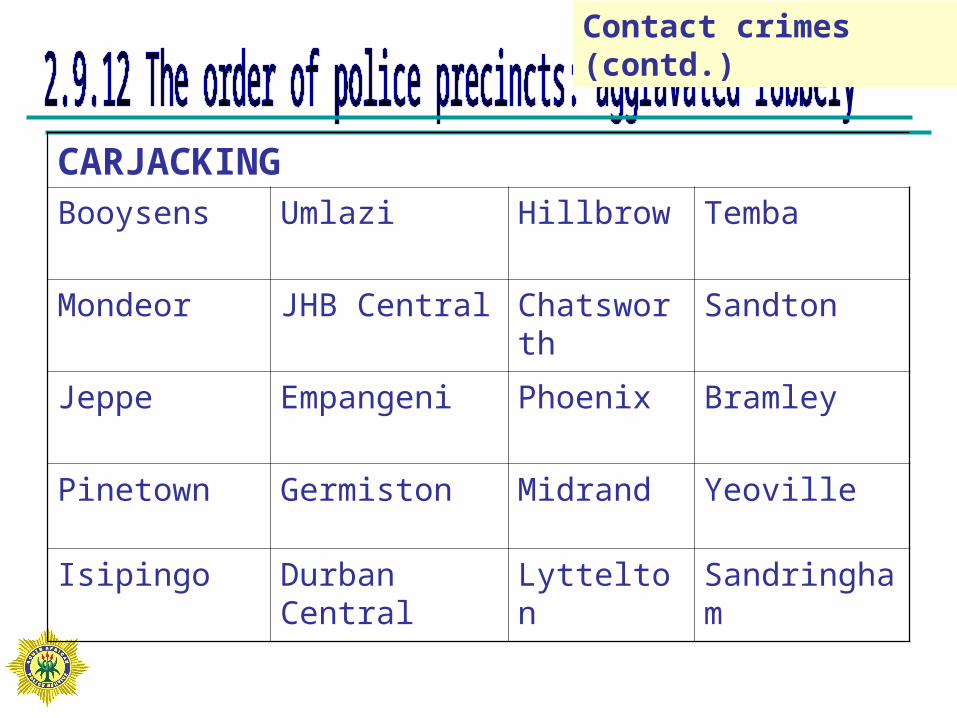
CARJACKINGBooysens Umlazi Hillbrow Temba
Mondeor JHB Central Chatsworth Sandton
Jeppe Empangeni Phoenix Bramley
Pinetown Germiston Midrand Yeoville
Isipingo Durban Central Lyttelton Sandringham
Contact crimes (contd.)
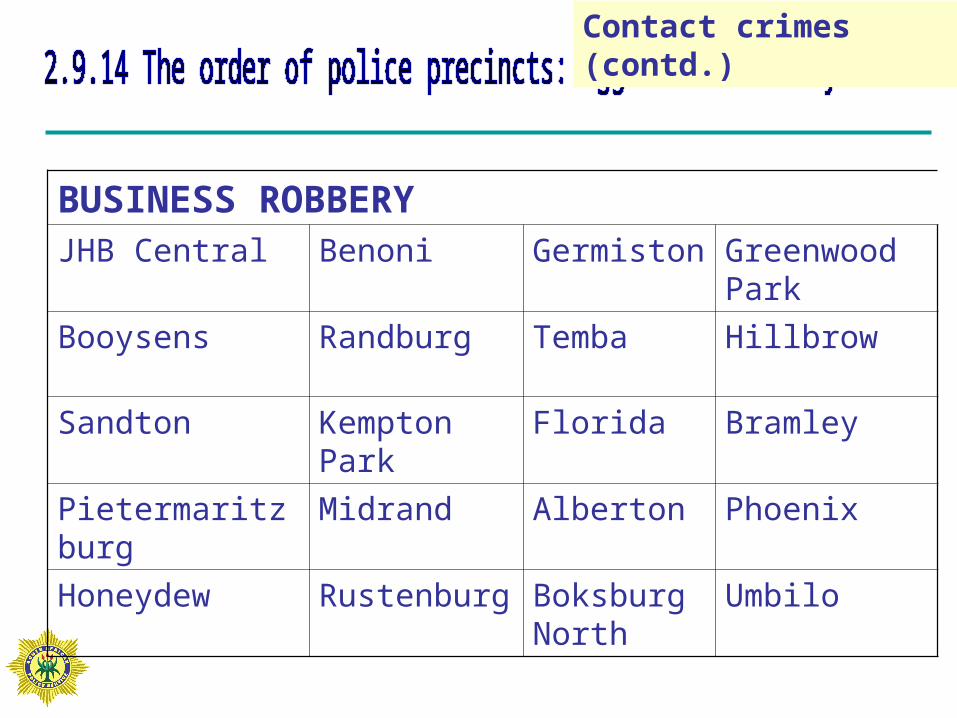
BUSINESS ROBBERYJHB Central Benoni Germiston Greenwood
Park
Booysens Randburg Temba Hillbrow
Sandton Kempton Park
Florida Bramley
Pietermaritzburg Midrand Alberton Phoenix
Honeydew Rustenburg Boksburg North
Umbilo
Arson Malicious damage to property
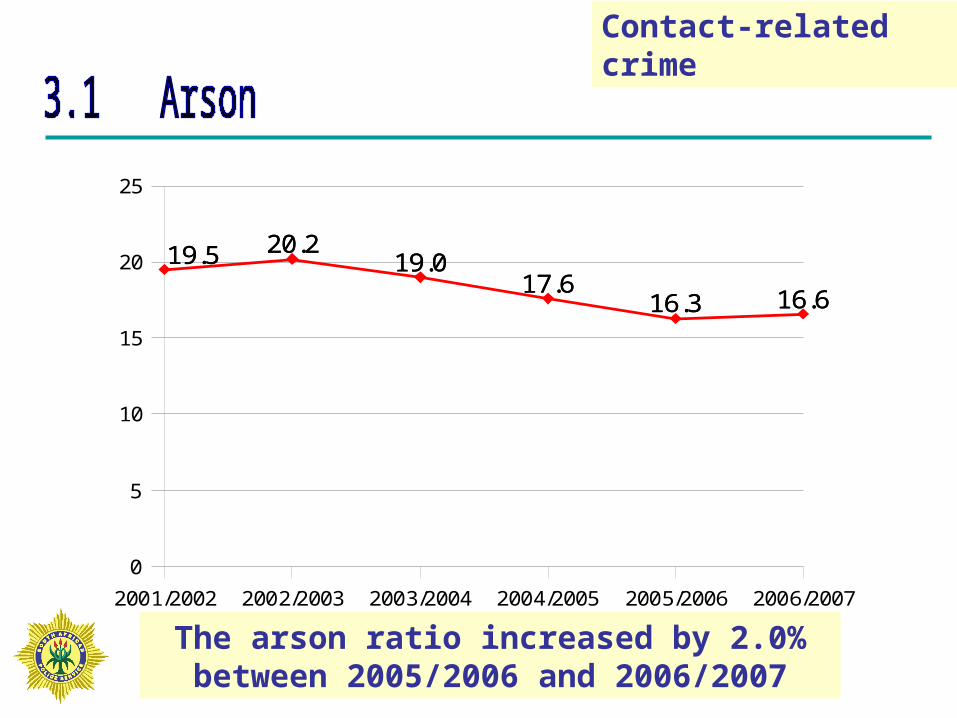
The arson ratio increased by 2.0%between 2005/2006 and 2006/2007
Contact-related crime
19.5 20.219.0
17.616.3 16.6
19.5 20.219.0
17.616.3 16.6
2001/2002 2002/2003 2003/2004 2004/2005 2005/2006 2006/2007
0
5
10
15
20
25
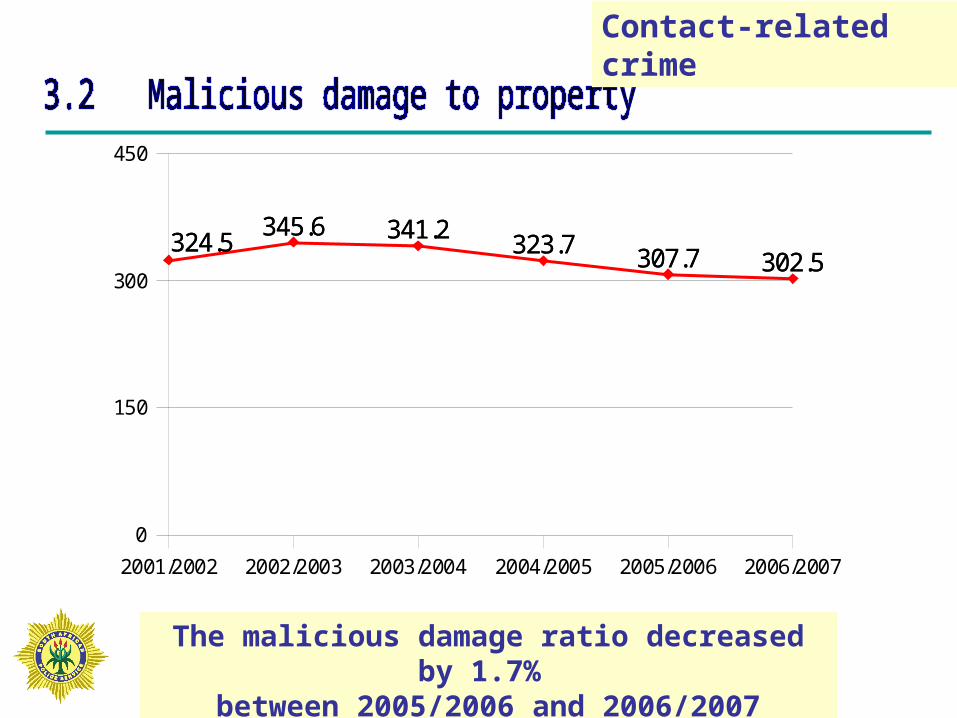
The malicious damage ratio decreased by 1.7% between 2005/2006 and 2006/2007
324.5345.6 341.2
323.7 307.7 302.5324.5
345.6 341.2323.7 307.7 302.5
2001/2002 2002/2003 2003/2004 2004/2005 2005/2006 2006/2007
0
150
300
450
Contact-related crime
Burglary at residential premises Burglary at non-residential premises Theft of motor vehicles and motorcycles Theft out of or from motor vehicles Stock-theft
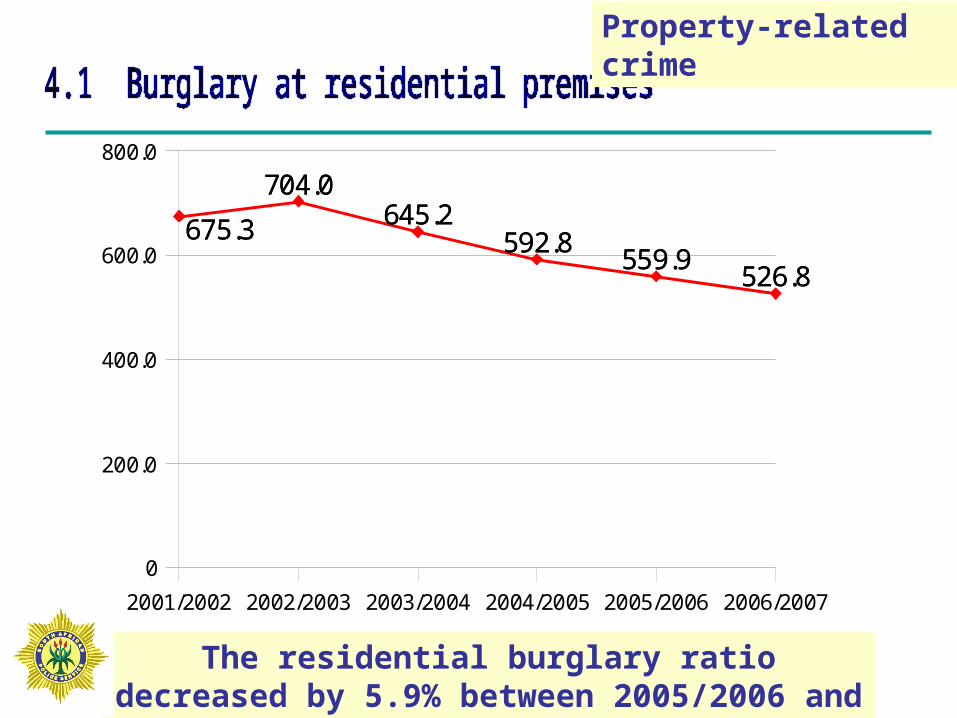
The residential burglary ratio decreased by 5.9% between 2005/2006 and 2006/2007
Property-related crime
675.3
704.0645.2
592.8559.9
526.8
675.3
704.0645.2
592.8559.9
526.8
2001/2002 2002/2003 2003/2004 2004/2005 2005/2006 2006/2007
0
200.0
400.0
600.0
800.0
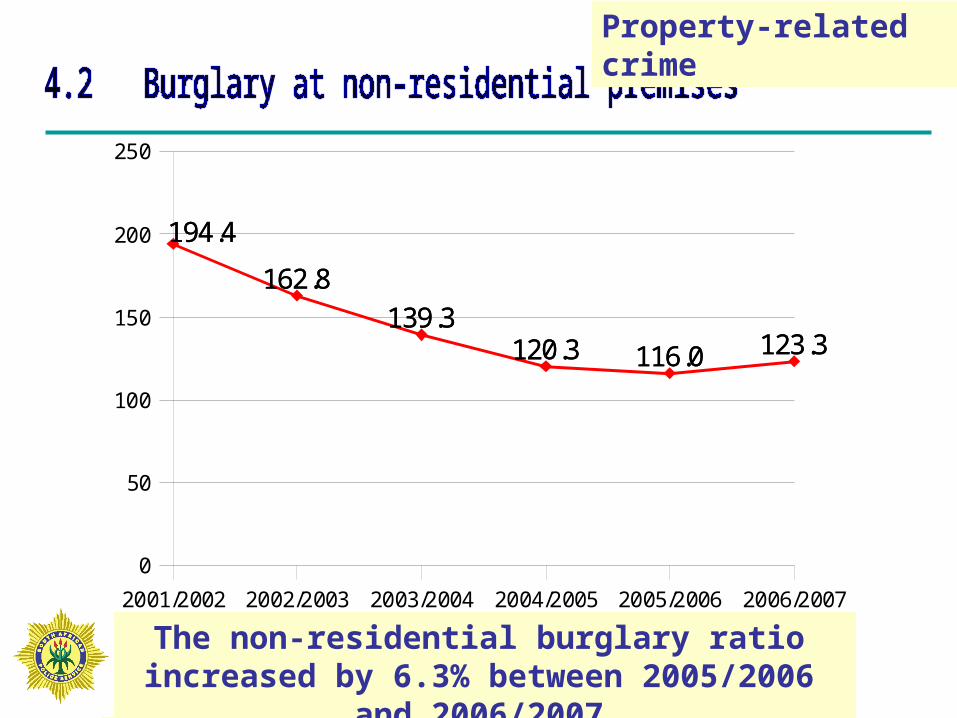
The non-residential burglary ratio increased by 6.3% between 2005/2006 and 2006/2007
194.4
162.8139.3
120.3 116.0 123.3
194.4
162.8139.3
120.3 116.0 123.3
2001/2002 2002/2003 2003/2004 2004/2005 2005/2006 2006/2007
0
50
100
150
200
250
Property-related crime
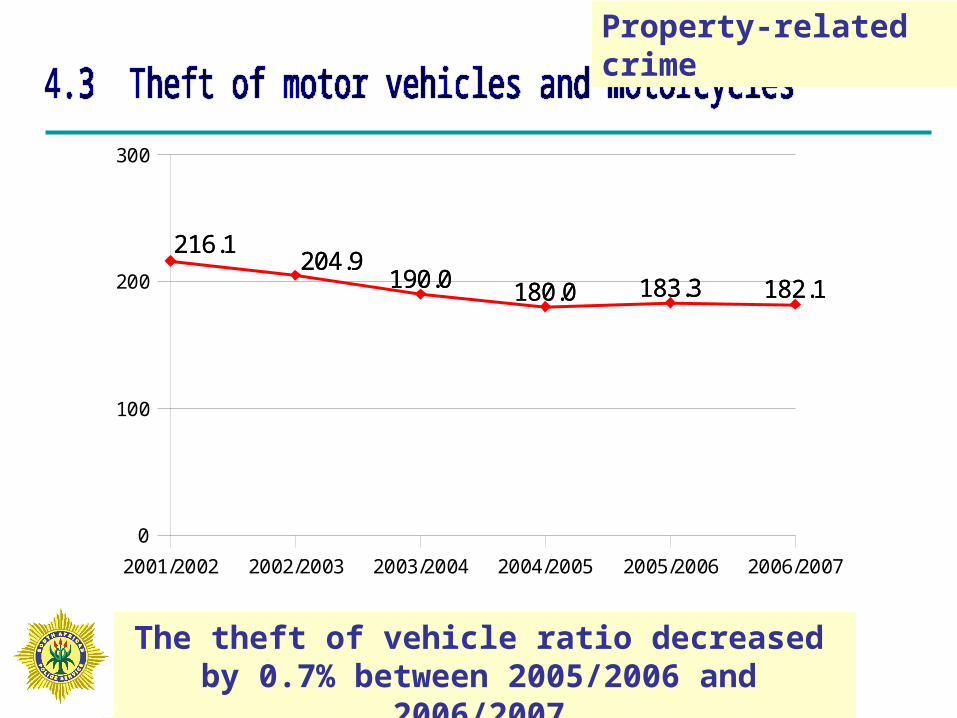
The theft of vehicle ratio decreased by 0.7% between 2005/2006 and 2006/2007
216.1204.9
190.0 180.0 183.3 182.1
216.1204.9
190.0 180.0 183.3 182.1
2001/2002 2002/2003 2003/2004 2004/2005 2005/2006 2006/2007
0
100
200
300
Property-related crime
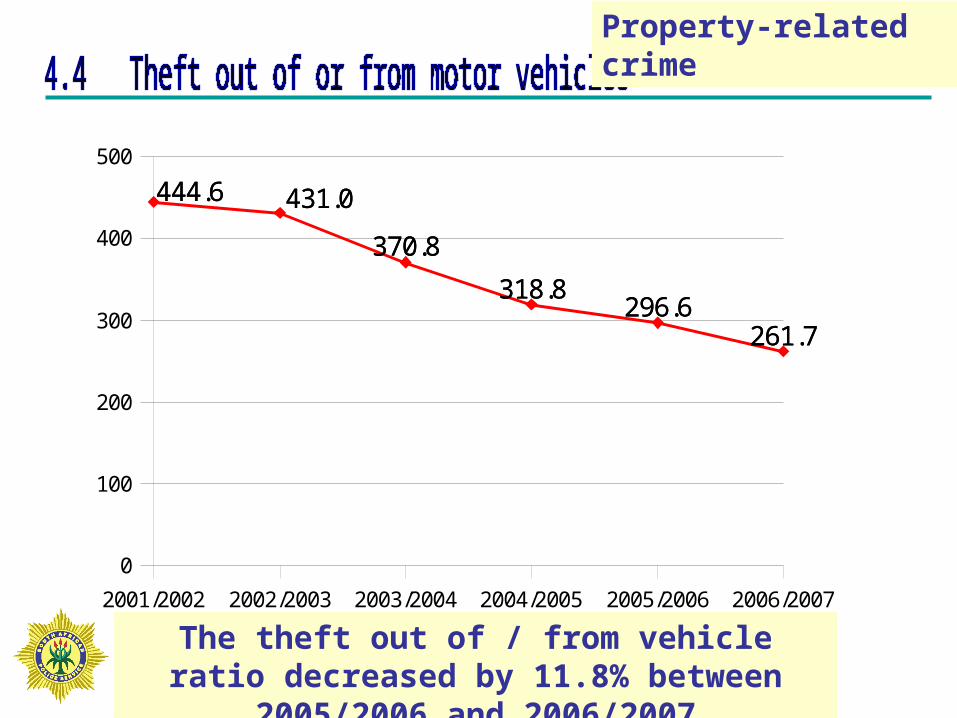
The theft out of / from vehicle ratio decreased by 11.8% between 2005/2006 and 2006/2007
444.6 431.0
370.8
318.8296.6
261.7
444.6 431.0
370.8
318.8296.6
261.7
2001/2002 2002/2003 2003/2004 2004/2005 2005/2006 2006/2007
0
100
200
300
400
500
Property-related crime
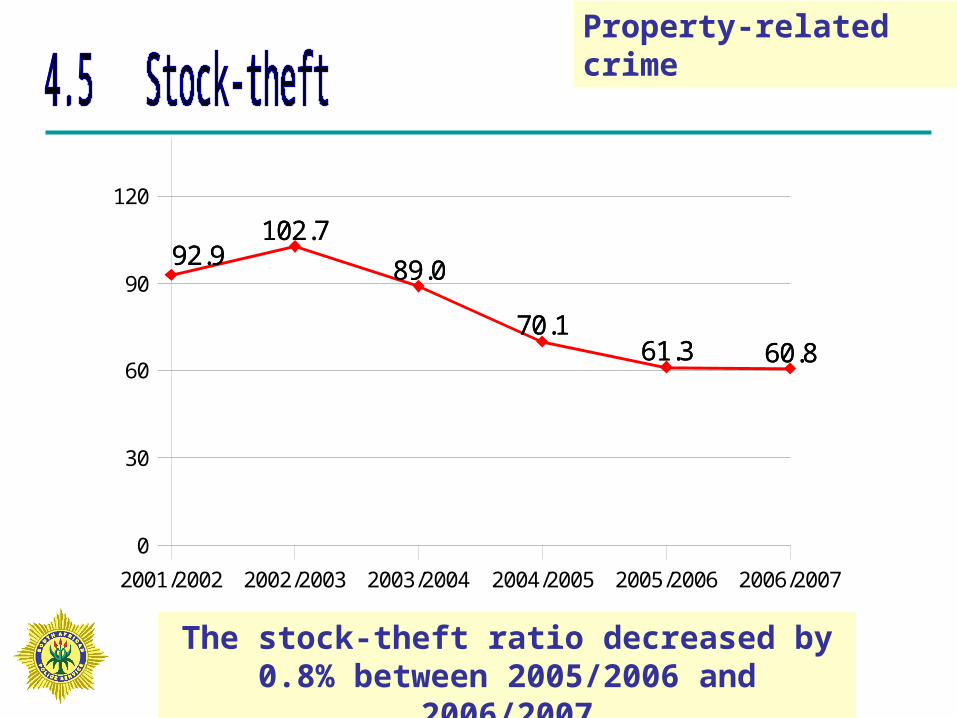
The stock-theft ratio decreased by 0.8% between 2005/2006 and 2006/2007
92.9102.7
89.0
70.161.3 60.8
92.9102.7
89.0
70.161.3 60.8
2001/2002 2002/2003 2003/2004 2004/2005 2005/2006 2006/2007
0
30
60
90
120
Property-related crime
Illegal possession of firearms and ammunition
Drug-related crimes Driving under the influence of
alcohol or drugs
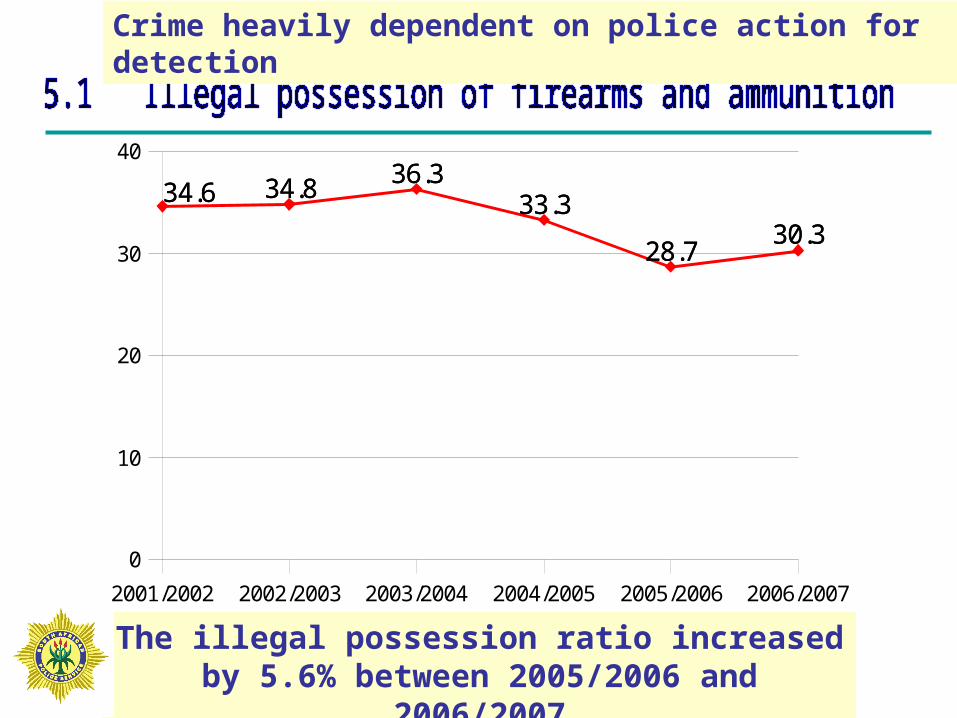
The illegal possession ratio increased by 5.6% between 2005/2006 and 2006/2007
Crime heavily dependent on police action for detection
34.6 34.8 36.333.3
28.730.3
34.6 34.8 36.333.3
28.730.3
2001/2002 2002/2003 2003/2004 2004/2005 2005/2006 2006/2007
0
10
20
30
40
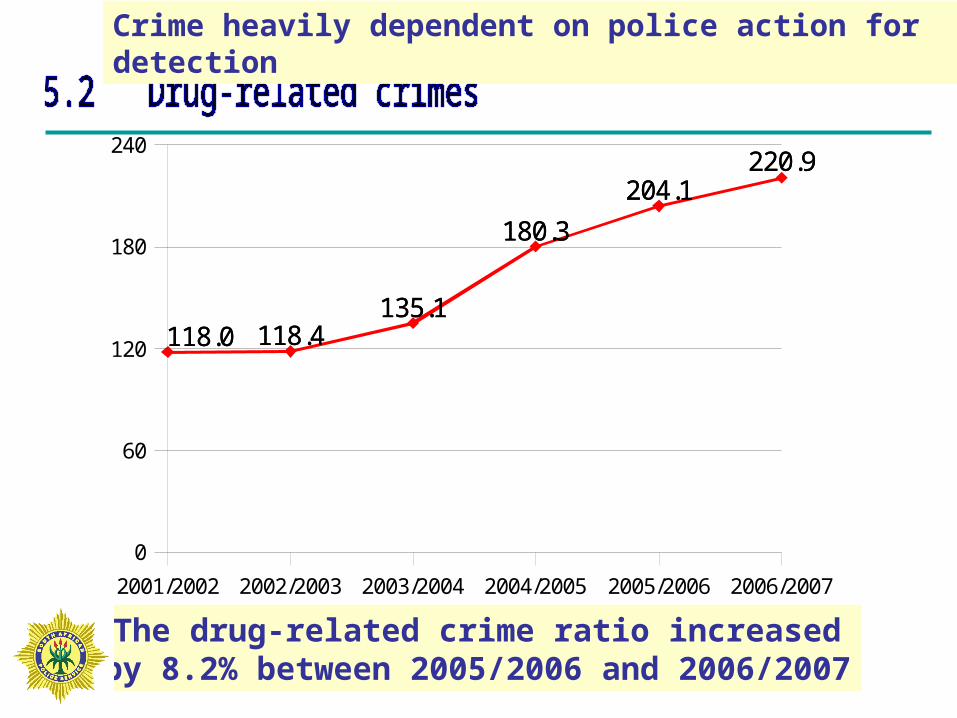
The drug-related crime ratio increased by 8.2% between 2005/2006 and 2006/2007
118.0 118.4135.1
180.3
204.1220.9
118.0 118.4135.1
180.3
204.1220.9
2001/2002 2002/2003 2003/2004 2004/2005 2005/2006 2006/2007
0
60
120
180
240
Crime heavily dependent on police action for detection
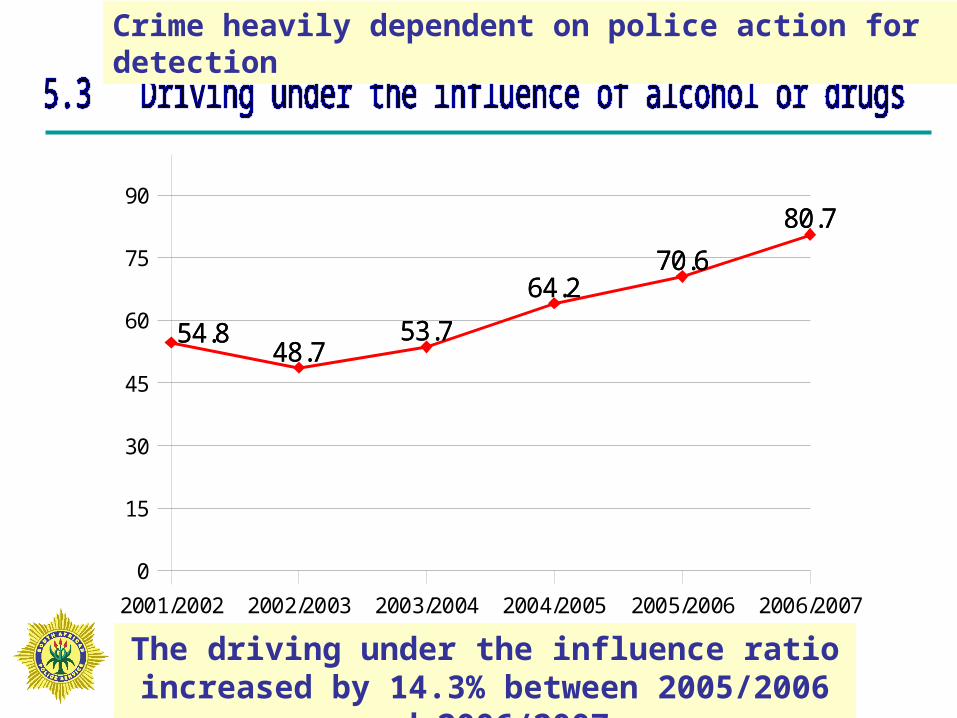
The driving under the influence ratio increased by 14.3% between 2005/2006 and 2006/2007
54.848.7
53.7
64.270.6
80.7
54.848.7
53.7
64.270.6
80.7
2001/2002 2002/2003 2003/2004 2004/2005 2005/2006 2006/2007
0
15
30
45
60
75
90
Crime heavily dependent on police action for detection
All theft not mentioned elsewhere Commercial crime Shoplifting
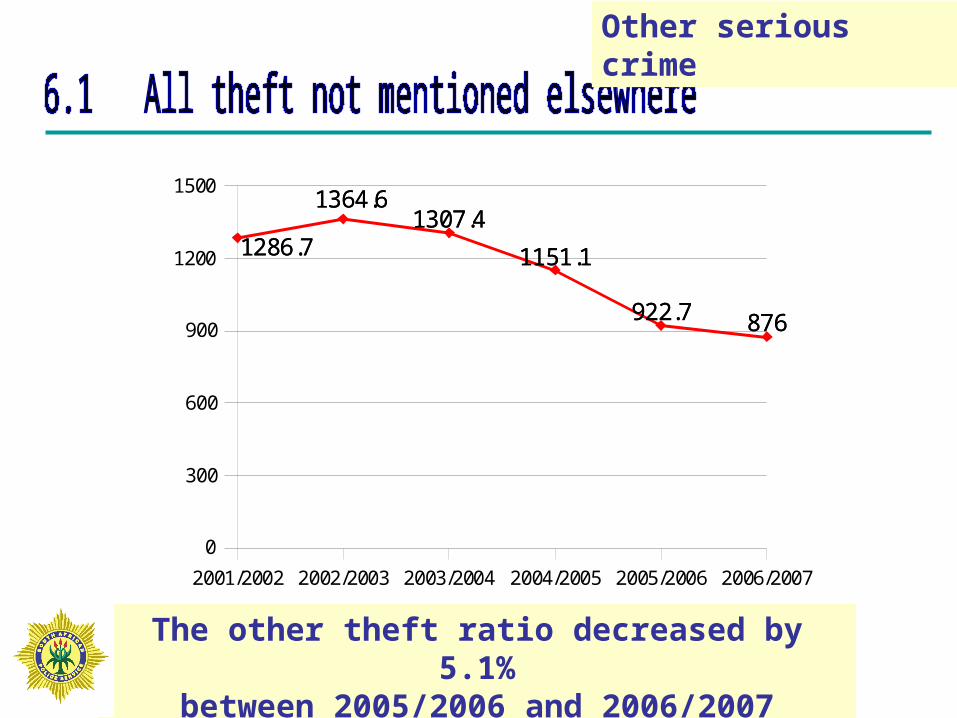
The other theft ratio decreased by 5.1%between 2005/2006 and 2006/2007
Other serious crime
1286.7
1364.61307.4
1151.1
922.7 876
1286.7
1364.61307.4
1151.1
922.7 876
2001/2002 2002/2003 2003/2004 2004/2005 2005/2006 2006/2007
0
300
600
900
1200
1500
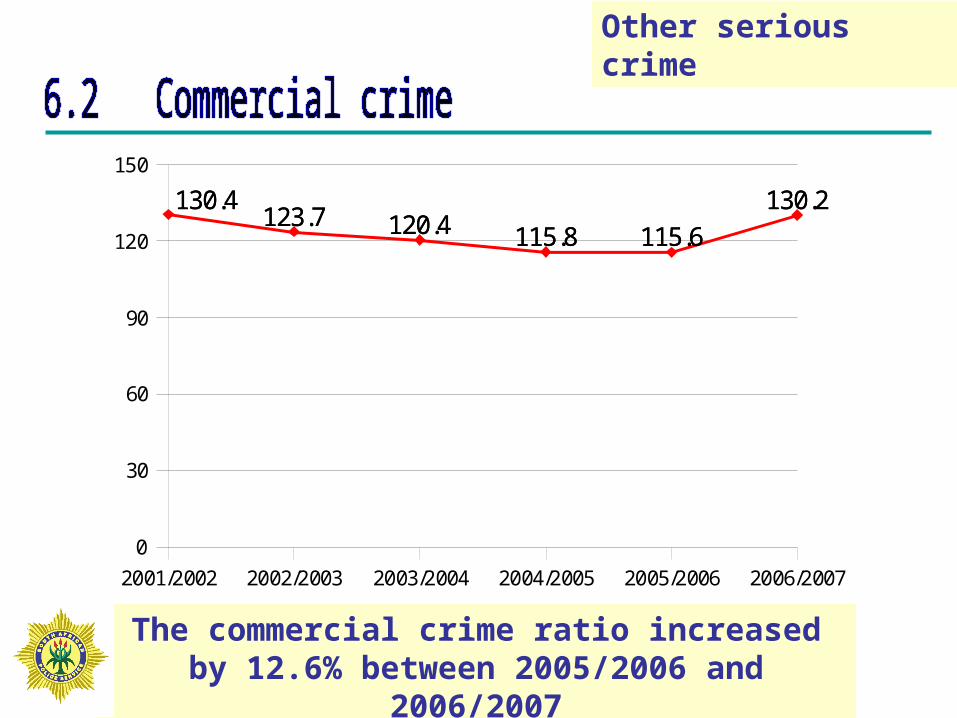
The commercial crime ratio increased by 12.6% between 2005/2006 and 2006/2007
130.4123.7 120.4 115.8 115.6
130.2130.4123.7 120.4 115.8 115.6
130.2
2001/2002 2002/2003 2003/2004 2004/2005 2005/2006 2006/2007
0
30
60
90
120
150
Other serious crime
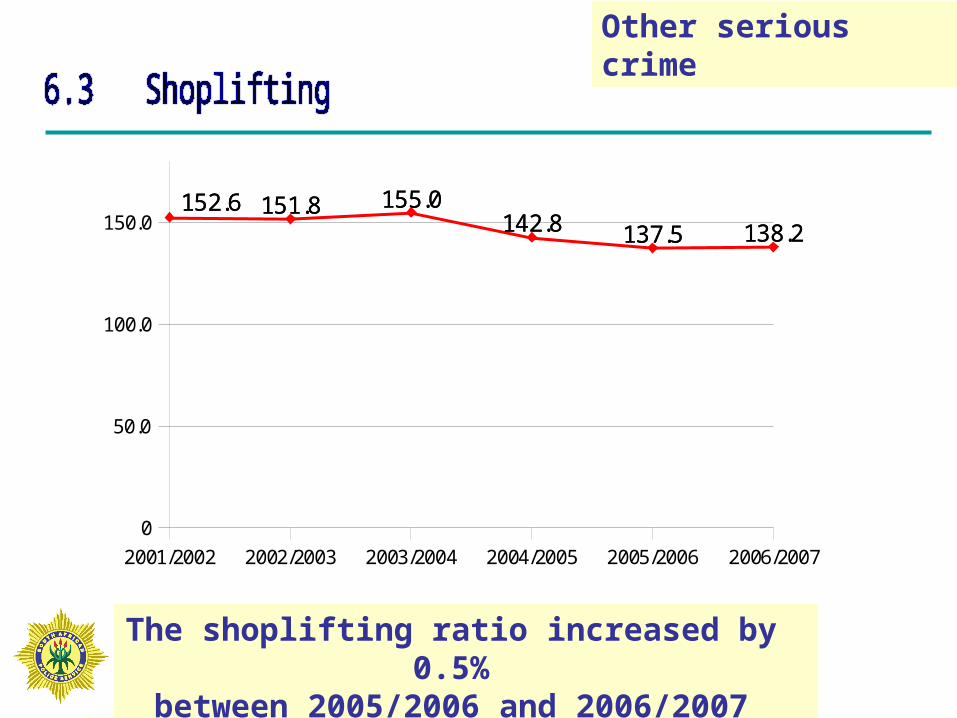
The shoplifting ratio increased by 0.5%between 2005/2006 and 2006/2007
152.6 151.8 155.0142.8 137.5 138.2
152.6 151.8 155.0142.8 137.5 138.2
2001/2002 2002/2003 2003/2004 2004/2005 2005/2006 2006/2007
0
50.0
100.0
150.0
Other serious crime

- End of presentation -
THANK YOU