Embed Size (px)
Citation preview

1
1

2
Finding The Stories Behind The Data
Ministry of EducationWebcast
December 6, 2006

3
Part 1How to work with school data
4

5
Co-Presenters•Kim Howland, President, BCCPAC•Charlie Coleman, Principal, SD79
“Data for Beginners”
Introductions and Overview
•Who?•Why?•How?

6
1. Understanding data sources•Information•Evidence•Data
2.Connecting data with:
Goals for this webcast
•Student learning•School planning•Stories behind the data

7
Think about something you enjoy doing. It can be a hobby, sport, skill or talent.
•How good are you at it?•Were you always that good?•Are you improving? How do you know?
•How good do you want to be? By when?
•How will you know that you are getting better?
•3 minutes of partner talk
Starting the Conversation

8
The Planning Cycle
9
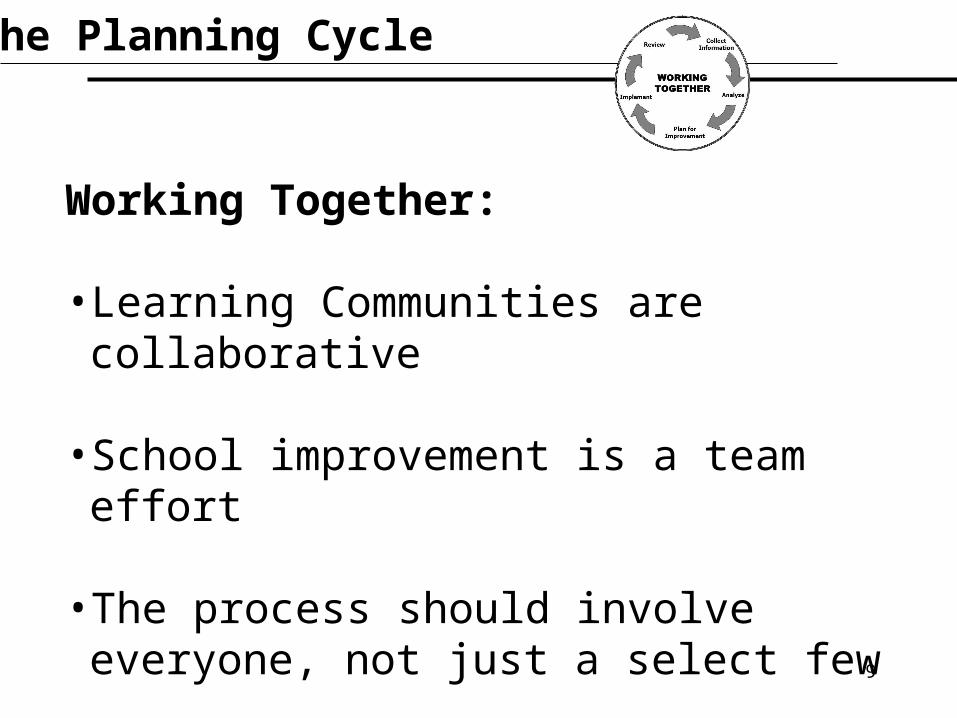
The Planning Cycle
Working Together:
•Learning Communities are collaborative
•School improvement is a team effort
•The process should involve everyone, not just a select few

10
The Planning Cycle
Review:
•Review current school plan
•Monitor progress of goals
•Ask if the current strategies are making a difference

11
The Planning Cycle
Collect Information:
•Gather information, evidence, data
•Consider various sources
•Determine what is relevant

12
The Planning Cycle
Analyze:
•Engage in conversations about the data
•Ask questions about the data
•Consider the unique needs of the school

13
The Planning Cycle
Plan for Improvement:
•Select goals that matter to your school
•Set meaningful and measurable targets
•Choose strategies that will impact student learning

14
The Planning Cycle
Implement the Plan:
•Take action based on the plan
•Involve parents, staff and students
•Be flexible; the plan must be able to adapt to changing circumstances

15
COLLECT INFORMATION
“Improving districts and schools are actively
considering at least three sources of evidence
including classroom, school, district and provincial data”
District Review Guide

16
classroom
school / school community
district / community
provincial
Sources of Evidence
(See Handout)

17
Sources of Evidence
“Sources of Evidence”(See Handout)
At your table…
• Take 3 minutes to preview this handout
• What stands out for you?• Discuss with a partner. 2 minutes• Table Talk. 3 minutes
What questions arise from this handout?

18
Classroom EvidenceExamples of classroom-based data include:
•BC Performance Standards •Unit tests and quizzes•Report card marks•Teacher observations, checklists and notes•Assessments developed by teacher, school or district•Attendance information
19
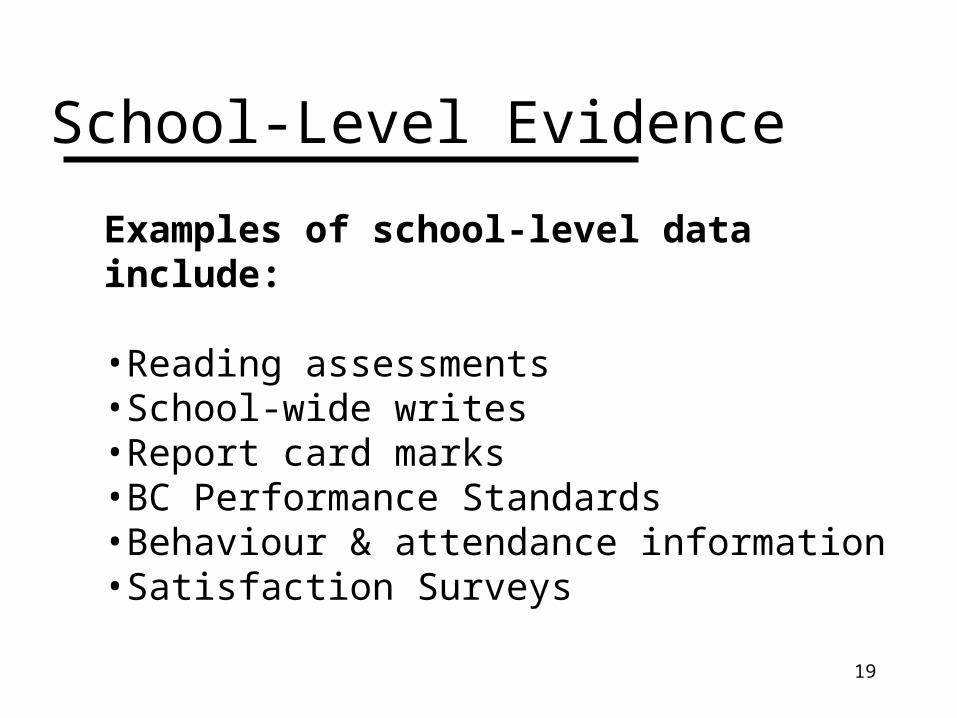
School-Level Evidence
Examples of school-level data include:
•Reading assessments •School-wide writes•Report card marks•BC Performance Standards•Behaviour & attendance information•Satisfaction Surveys

20
District-Level EvidenceExamples of district-level data include:
•District-wide assessments (reading, math, etc.) •District-wide write•Report card marks•Participation rates•Discipline & attendance records•Demographic information

21
Provincial-Level Evidence
Examples of Provincial-level data include:
•Ministry of Education Satisfaction Surveys •Foundation Skills Assessment (FSA)•Provincial Exams•Dogwood Completion Rate•Grade-to-grade transition rates

22
Classroom
School / school community
District/ community
Provincial
•Classroom data informs instruction and tracks progress of individual students.
•School data tracks progress and informs school practices / policies / goals and objectives.
•District data tracks trends and informs district practices / policies / goals and objectives.
•Provincial data tracks trends over time and reveals patterns and systemic strengths and weaknesses.

23
• See handout: “Commonly Used Terms”• Take 5 minutes to preview this handout• Is there something of particular interest?
Why?• Discuss with a partner. 2 minutes• Table talk. 3 minutes• What did you find that was new or
surprising?
Return from Break at 7:25
Commonly Used Terms:(Jargon Alert!!!)

24
Part 2Finding the stories behind the data
25
Questions and Answers

26
“It’s not the raw scores that count but what you do with them”
Michael Fullan, Macleans, May 2001

27
ANALYZE
1. Look for patterns and trends over time 2. Check participation rates3. Check the data for sub-populations (i.e.
Male, Female, Aboriginal, ESL)4. Compare data from different sources5. Ask questions and generate alternate
hypotheses6. Plan for improvement based on the data
Finding the stories behind the data:

28
An Elementary Example
READING (2002 - 2006)Students (%) meeting or exceeding expectations
72%78% 81%
74%67%
73%
78% 78% 79% 84% 87%83%83%
0%
20%
40%
60%
80%
100%
Jun Dec Mar Jun Dec Mar Jun Dec Mar Jun Dec Mar Jun
BC Performance Standards (each term)
29
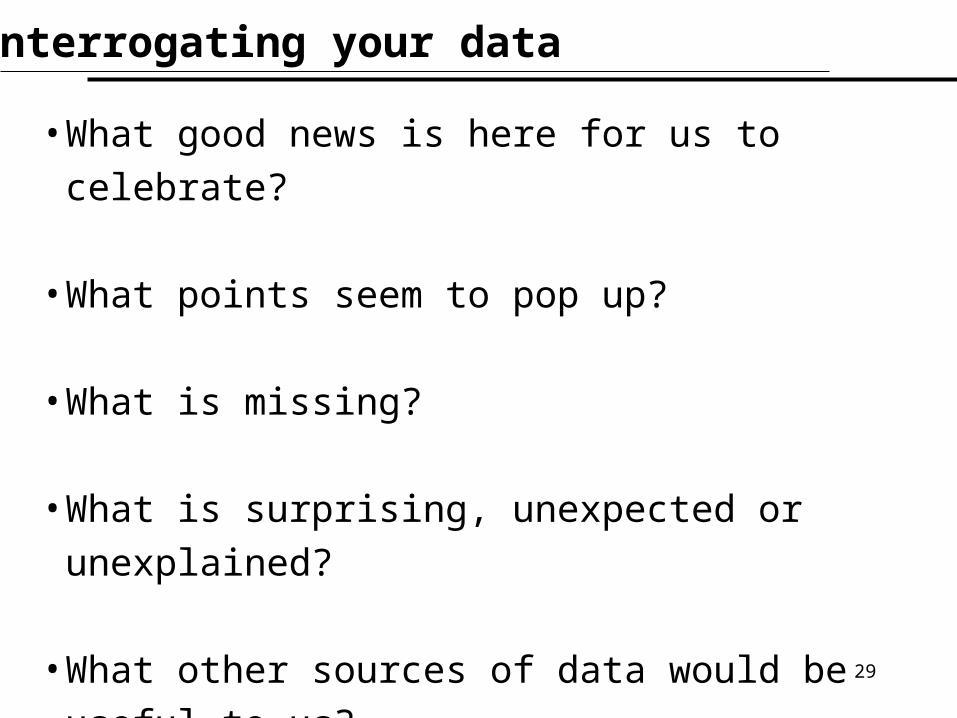
Interrogating your data
•What good news is here for us to celebrate?
•What points seem to pop up?
•What is missing?
•What is surprising, unexpected or unexplained?
•What other sources of data would be useful to us?

30
A Middle School Example
In your materials…
•Find the data for “Erehwon Middle School”•Have a 5 minute conversation•Start by asking questions…(see next slide)

31
Looking at some data
- What important points seem to emerge?
- Are there patterns that you notice?- Based on this data, what appear to be
strengths of the school?- What is missing? What does the data
not tell us?- Based on this data, what goals might
be included in a school plan?

32
A Secondary Example
Secondary SchoolSocial Responsibility Goal
33
What to do with the data:
•Ask lots of questions
•Focus on student learning
•Find the stories behind the data

34

35
Collecting & AnalyzingInformation:
(See Handout)
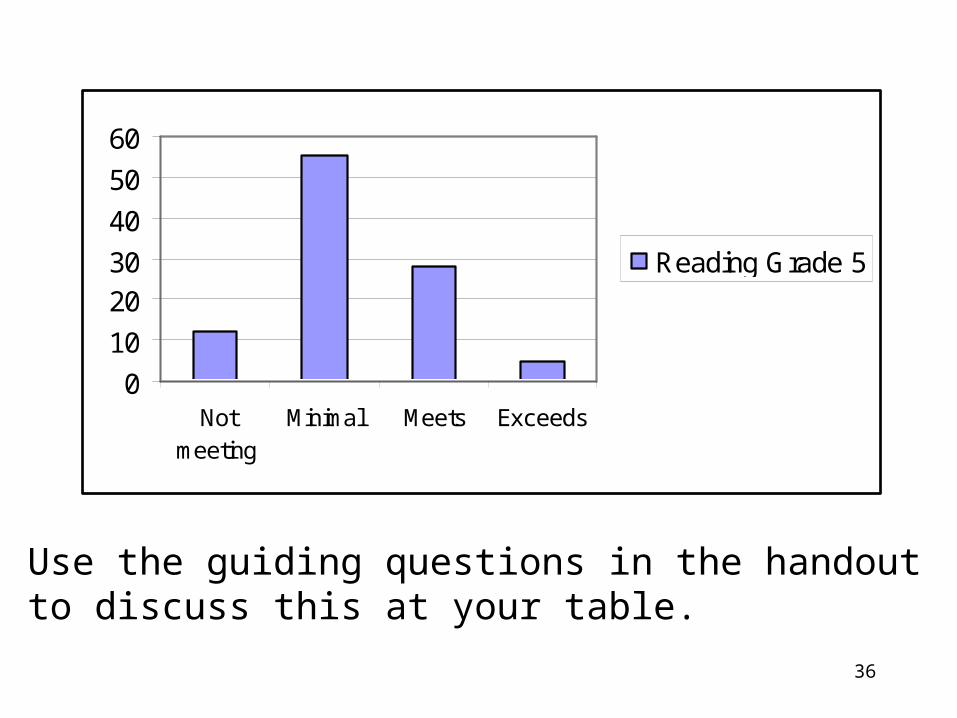
36
0
10
2030
40
50
60
Notmeeting
Minimal Meets Exceeds
Reading Grade 5
Use the guiding questions in the handout to discuss this at your table.

37
Use the guiding questions in the handout to discuss this at your table.
Indicators/evidence What data did we look at?
Results to Date How are we doing?
TargetWhat do we hope to achieve?
Comments/Summary of Progress
District-wide Assessment; Grades 3and 6BC Social ResponsibilityPerformance Standards:Solving Problems inPeaceful Ways. All Grade 3 and 6 students in the school, assessed by classroom teachers(June 2005)
June 2005% at each level of BCPerformance StandardsPercent fully meeting orexceeding expectationscombinedGrade 3 74%Boys 67%Girls 82%Aboriginal 67%Grade 6 64%Boys 54%Girls 76%Aboriginal 46%gr. 3 n=115(96% participation);Aboriginal n=30gr. 6 n=131(93% participation);Aboriginal n=26
Increase the percent of students who "fullymeet" or "exceed"expectations for SolvingProblems in PeacefulWays.Increase the percent of boys who fully meet orexceed expectations inthis area.Increase in the percent of Aboriginal students whofully meet or exceedexpectations.
Baseline data has now been established and will be supported with structures and strategies. The results show that at both grades, teachers’ ratings of girls were substantially higher than for boys. Aboriginal students, overall,were less likely to be assessed asfully meeting or exceeding expectations than non-Aboriginal students.When Grade 3 and Grade 6 data were compared, younger students were more likely to be rated as fully meeting or exceeding expectations than wereolder students.The lower pattern of ratings for Aboriginal students is troubling, and the basis for these decisions by school staff needs to be carefully examined to ensurethat there is no systematic bias in the results. A similar examination of ratings for boys also needs to be undertaken. This may involve a focus group of teachers.

38
Use the guiding questions in the handout to discuss this at your table.

39
Table Talk
Look at the sample data in the handout “Collecting and Analyzing Information”.
In pairs, discuss the guiding questions below each example.
At your table discuss:•What is new or surprising for you?•What stories might be behind this data?

40
The Planning Cycle

41
Questions for Continuous Review
• What are we most proud of in our work
towards improving student achievement?
• What results are we finding so far?
• What strategies are working well?
• What strategies might need to be revised?
• Have we met our targets – if not, why?
• What adjustments might need to be made?
• What are some new priorities or challenges
that we might need to address?

42
Celebrations!
It is important to celebrate your success stories.
This should occur regularly. Examples of this include:
• Individual student “high fives”• Newsletters, memos and presentations• Conversations in the parking lot • Discussions at school functions • Conversations in the Staff Room or Parent Room• PAC and SPC meetings
How else could you celebrate success stories?

43
Conclusion
To accomplish great things, we must not only dream, but act.- Bill Blackman
ACT!
Great changes may not happen right away, but with effort even the difficult may become easy.
- Bill Blackman
PERSEVERE!
INQUIRE!To be on a quest is nothing more or less than to become an asker of questions
-Author Unknown
“Celebrate what you want to see more of”-Thomas J. Peters
CELEBRATE!

44
Thank you!
For more information check out:
•www.bced.bc.ca/spc•January 31, 2007 SPC Webcast