Embed Size (px)
Citation preview
Title:
Food through the child’s eye: an eye-tracking study on attentional bias for food in healthy-
weight children and children with obesity.
Jessica Werthmann 2, Anita Jansen , Anita C. Vreugdenhil3, Chantal Nederkoorn , Ghislaine
Schyns , & Anne Roefs
Faculty of Psychology & Neuroscience, Maastricht University, The Netherlands
2 Institute of Psychiatry, Psychology & Neuroscience, King’s College London, United
Kingdom
3Department of Paediatrics, University Hospital Maastricht, The Netherlands
Acknowledgements:
We would like to thank the Titus Brandsma Basisschool in Brunssum, the Basisschool Sint
Theresia in Slenaken, and the Sophianum in Gulpen, The Netherlands, for their helpful
cooperation with this study. We would also like to thank the Department of Pediatrics and the
Pediatric polyclinic at the Maastricht University Medical Centre, The Netherlands, for their
help in recruiting participants.
Address for correspondence Jessica Werthmann [email protected] King’s College London Institute of Psychiatry, Psychology, & Neuroscience Section of Eating Disorders Denmark Hill 103 SE 5 8AF London, U.K.
7LWOH�3DJH�ZLWK�$OO�$XWKRU�,QIRUPDWLRQ
ATTENTION BIAS FOR FOOD IN CHILDREN
1
1
2
3
4
5
6
Title: 7
Food through the child’s eye: an eye-tracking study on attentional bias for food in healthy-8
weight children and children with obesity. 9
10
0DVNHG�0DQXVFULSW�ZLWKRXW�$XWKRU�,QIRUPDWLRQ��,1&/8'(�0$6.('�7,7/(�3$*(
ATTENTION BIAS FOR FOOD IN CHILDREN
2
Abstract 11
Objective: Obesity prevalence among children is high and knowledge on cognitive factors 12
that contribute to children’s reactivity to the “obesogenic” food environment could help to 13
design effective treatment and prevention campaigns. Empirical studies in adults suggest that 14
attention bias for food could be a risk factor for overeating. Accordingly, the current study 15
tested if children with obesity have an elevated attention bias for food when compared to 16
healthy-weight children. Another aim was to explore whether attention biases for food 17
predicted weight-change after three and six months in obese children. 18
Method: Obese children (n =34) were recruited from an intervention program and tested prior 19
to the start of this intervention. Healthy-weight children (n = 36) were recruited from local 20
schools. First, attention biases for food were compared between children with obesity (n = 30) 21
and matched healthy-weight children (n = 30). Secondly, regression analyses were conducted 22
to test if food-related attention biases predicted weight changes after three and six months in 23
children with obesity following a weight loss lifestyle intervention. 24
Results: Results showed that obese children did not differ from healthy-weight children in 25
their attention bias to food. Yet automatically directing attention towards food (i.e. initial 26
orientation bias) was related to a reduced weight loss (R2 = .14, p = .032) after six months in 27
children with obesity. 28
Discussion: High palatable food is a salient stimulus for all children, irrespective of their 29
weight status. However, automatically directing attention to food cues might facilitate further 30
weight gain in children with obesity. 31
Keywords: Obesity, Childhood, Attention bias, Weight gain, Eye-tracking 32
WORDS: 24933
ATTENTION BIAS FOR FOOD IN CHILDREN
3
Obesity is a serious problem worldwide, for both adults and children (Ogden, Carroll, Kit, & 34
Flegal, 2014; Wang & Lim, 2012; World Health Organization, 2013). Childhood obesity is 35
particularly problematic because it is not only associated with several severe comorbid 36
psychological and physical problems (Pulgaron, 2013), but is also predictive of adult obesity 37
and a risk factor for mortality (Cali & Caprio, 2008). Given the negative consequences of 38
childhood obesity, it is important to gain a better understanding of factors contributing to 39
overeating and obesity in children in order to develop effective treatments and prevention 40
strategies. 41
In the western “obesogenic” environment high-calorie and palatable foods are 42
available everywhere and marketed aggressively, particularly to children (Halford, Gillespie, 43
Brown, Pontin, & Dovey, 2004; Harris, Bargh, & Brownell, 2009; Kelly et al., 2010). All 44
western children live in the same obesogenic environment, but many of them are not obese. 45
Studying (cognitive) mechanisms, which could cause some children to be overly responsive to 46
these food temptations, could contribute to a better understanding of individual differences in 47
eating behavior and weight status. 48
Attention biases to palatable, high-calorie food could be one possible vulnerability 49
factor that contributes to overeating (e.g., Berridge, 1996; Castellanos et al., 2009; 50
Werthmann et al., 2011). Research on attention biases for food and its relation to body weight 51
has mainly been conducted in adults, with mixed results (see for a review Werthmann, Jansen, 52
& Roefs, 2014). 53
For example, some studies suggest increased attention bias for food in participants 54
with obesity versus healthy-weight participants (e.g., Castellanos, et al., 2009). Yet others 55
report increased attention bias followed by avoidance to look at high calorie food in 56
overweight versus healthy-weight participants (e.g., Werthmann, et al., 2011), or even 57
increased attentional avoidance of food cues with increasing BMI (e.g., Nummenmaa, et al., 58
ATTENTION BIAS FOR FOOD IN CHILDREN
4
2011). Other studies report no association between food-related attentional biases and BMI 59
(e.g., Loeber, et al. 2012). 60
While a number of studies on attention bias for food have been conducted in adults, 61
only two studies so far have been conducted in children with obesity (Braet & Crombez, 62
2003; Soetens & Braet, 2007). Similar to findings on attentional bias for food in adults, these 63
two studies provided contradictory evidence for an attention bias for food cues in children 64
with overweight and obesity when compared to healthy-weight children. One study, using a 65
food Stroop task (Braet & Crombez, 2003), showed that children with obesity were slower in 66
naming the color of a colored food word than a colored neutral word, as compared to healthy-67
weight children. Accordingly, the authors concluded that children with obesity found it more 68
difficult to suppress processing the meaning of food words and might thus be more pre-69
occupied with food, whereas healthy-weight children were not distracted by the meaning of 70
food words (Braet & Crombez, 2003). The other study (Soetens & Braet, 2007) used an 71
embedded word task comprising high-calorie food words and matched control words as a 72
measure of attention bias for food in overweight and healthy-weight adolescents (between 12 73
and 18 years). The embedded word task consists of a grid of words and non-words and 74
requires detecting as many words as possible during a certain time interval (in this study six 75
minutes). No significant differences in the number of detected food words were found 76
between overweight and healthy-weight adolescents, indicating that the two groups did not 77
differ in their processing of hidden food words (Soetens & Braet, 2007). 78
The diversity of research findings in both adult and pediatric samples could be due to 79
methodological differences in the assessment of attentional bias. When measuring attention 80
bias, an important distinction can be made between an indirect and a direct assessment of 81
attention allocation. Both studies in pediatric samples relied on indirect tasks. A recognized 82
difficulty of assessing attention biases indirectly (e.g., by response latencies) is that only a 83
ATTENTION BIAS FOR FOOD IN CHILDREN
5
snap-shot view of attention processes can be provided (Mogg, et al., 2003). Indirect 84
assessments rely on inferences on attention allocation during the critical stimulus 85
presentation, and often fail to inform us of the direction of attention or the underlying 86
temporal attention components (e.g., Field, Munafó, & Franken, 2009; Mogg, Bradley, Field, 87
& De Houwer, 2003). A direct measure of visual attention allocation is eye-tracking, and a 88
recent meta-analysis concluded that eye-movements are the most sensitive measure to capture 89
visual attention biases (Field, et al., 2009). The current study advances previous studies on 90
attention bias in children by measuring food-related attentional allocation as closely as 91
possible, using eye-tracking technology in addition to the assessment of response latencies. 92
By means of eye-tracking, different temporal components of attention can be 93
identified within each trial and insight on the direction of attention is provided. This 94
information is important for research on attention bias and eating behaviour. For example, the 95
direction of the attention process, that is looking towards or away from food, has been 96
associated with subsequent increase or decrease of food intake in adults (e.g., Werthmann, 97
Field, Roefs, Nederkoorn, & Jansen, 2013). Moreover, information on different temporal 98
attention components is important because they are thought to reflect automatic versus 99
controlled attention processes (LaBerge, 2002). For example, initial attention orientation and 100
initial gaze durations are thought to reflect more automatic processes of attentional bias. 101
Dwell time bias (maintained attention) on food stimuli presumably reflects more controlled 102
and wilful attention allocation. Research suggested that these different temporal attention 103
components might have differential associations with subsequent eating behaviour and 104
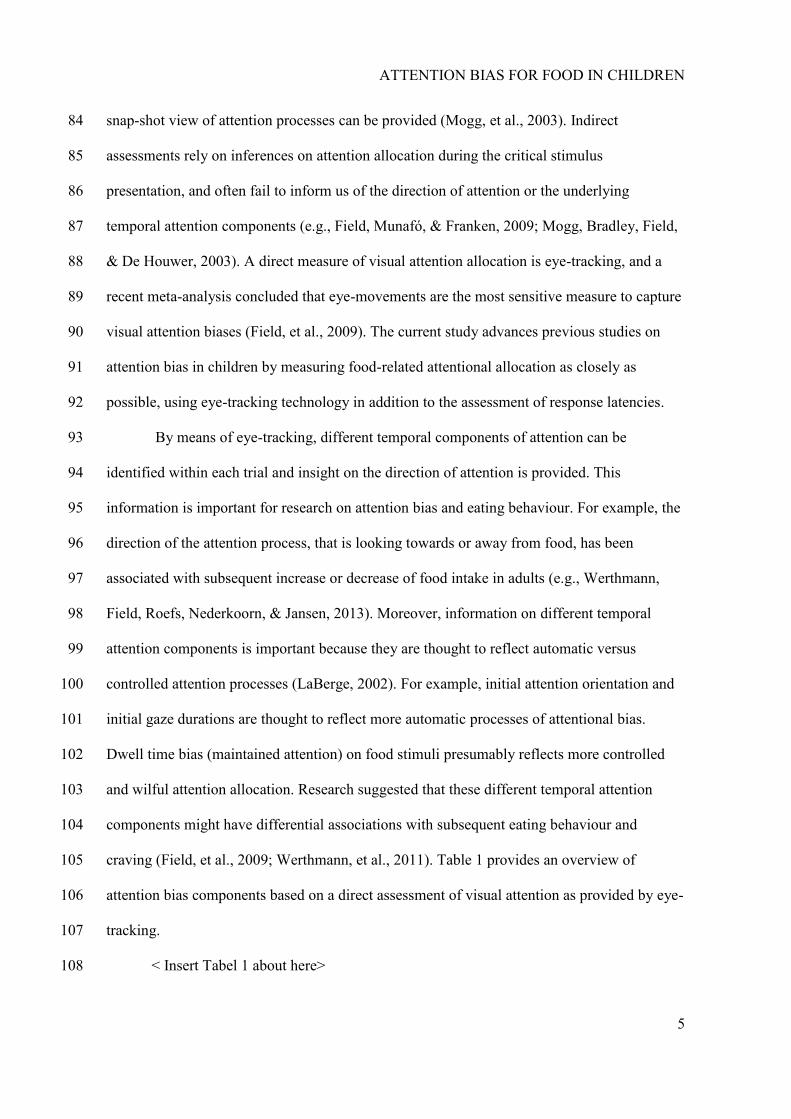
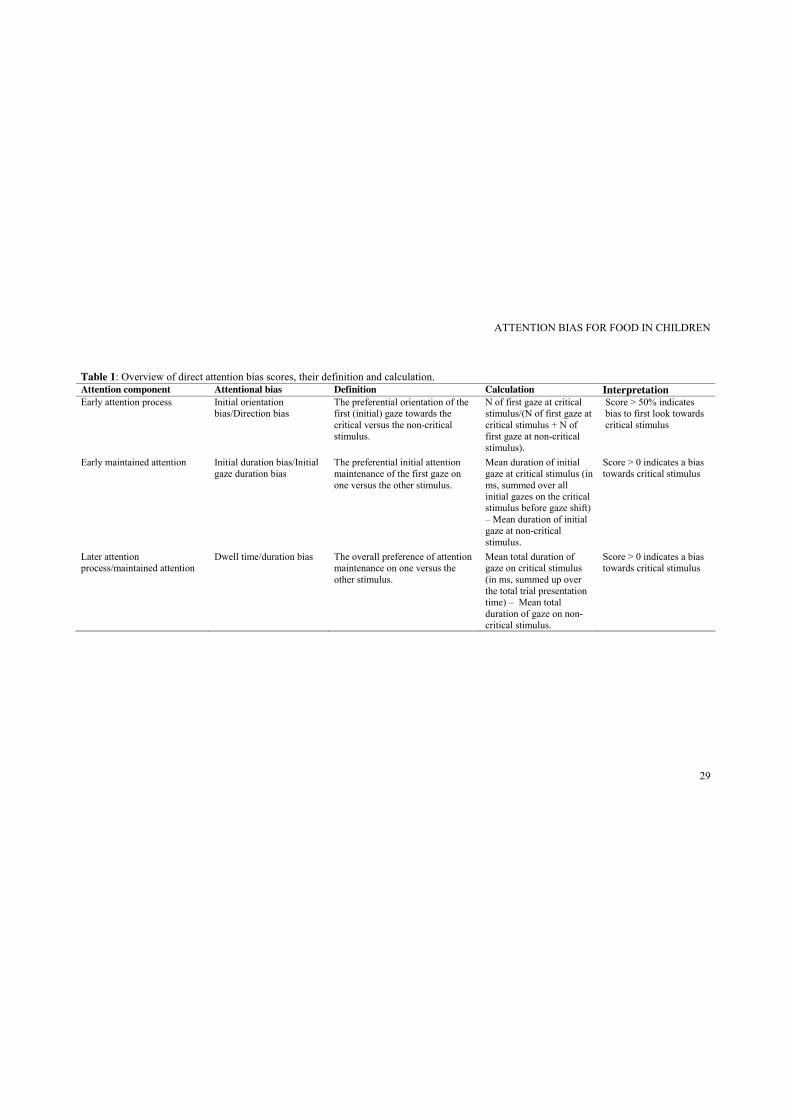
craving (Field, et al., 2009; Werthmann, et al., 2011). Table 1 provides an overview of 105
attention bias components based on a direct assessment of visual attention as provided by eye-106
tracking. 107
< Insert Tabel 1 about here> 108
ATTENTION BIAS FOR FOOD IN CHILDREN
6
Research on the role of attentional bias for food in relation to BMI has mainly been 109
conducted cross-sectionally, leaving the relation of an attention bias for food and subsequent 110
weight change unexplored. However, two recent studies suggest that increased attentional 111
processing of unhealthy food cues predicts increase in BMI in female adolescents (Yokum, 112
Ng, & Stice, 2011) and a student sample (Calitri, Pothos, Tapper, Brunstrom, & Rogers, 113
2010). Hence, the current study explored whether attentional biases predict weight change 114
over time in children with obesity who were enrolled in a lifestyle intervention. 115
To sum up, the primary aim of the current study was to test if children with obesity 116
have an elevated attention bias for high-calorie food when compared to matched healthy-117
weight children, using eye-tracking technology as a dynamic and direct measure of visual 118
attention. Another aim was to extend the cross-sectional design of previous research, and to 119
test prospectively whether attention bias for food could predict weight change over three and 120
six months in children with obesity following a lifestyle intervention. 121
We expected that children with obesity would show enhanced attentional biases 122
towards high-calorie food images in comparison to healthy-weight children (hypothesis 1). In 123
addition, we hypothesized that stronger attentional biases for food would be predictive of 124
reduced weight loss or increased weight gain at 3 and 6 months follow-up in children with 125
obesity following a lifestyle intervention to lose weight (hypothesis 2). 126
127
Method 128
Participants 129
34 children with obesity, who were enrolled in an outpatient pediatric obesity lifestyle 130
intervention at the local academic hospital, and 36 healthy-weight children recruited from 131
local schools were tested. For our first hypothesis, which involved testing a cross-section of 132
obese and healthy children and determining whether their attention bias for food differed, we 133
ATTENTION BIAS FOR FOOD IN CHILDREN
7
found an individual matching on age and gender in 30 obese/healthy-weight children pairs. 134
Thus, our cross-sectional analysis is based on a subsample of all tested obese children (30 out 135
of 34 children) and healthy-weight children (30 out of 36 children). For our second 136
hypothesis, testing whether attention biases for food related to weight change over three and 137
six months in obese children, we included all 34 tested obese children. However, data on 3 138
children was missing on the re-assessment of height and weight after three months and thus 139
this analysis was based on data of 31 obese children. At the six-month re-assessment, data on 140
two children was missing and thus this analysis was based on data of 32 children1. 141
All participants received the same information about the study with an information 142
letter and an informed consent form. Recruitment procedures differed slightly per participant 143
group. Children with obesity and their parents were approached in the pediatric obesity unit at 144
the hospital, and were asked to participate in the current study at one of their first 145
appointments there, prior to the start of a lifestyle intervention for weight loss. Thus, the 146
participating children with obesity partook in the current experimental procedure prior to the 147
start of the lifestyle intervention. The children with obesity then proceeded to follow the first 148
six months of the lifestyle intervention, which was planned to continue for a longer duration. 149
During this time, follow-up measurements of weight and height in the obese children were 150
obtained for the current study. The children with obesity included in our study represent only 151
a small subsample of the children included in the lifestyle intervention. Clinical effectiveness 152
results regarding the lifestyle intervention, as well as a description of the lifestyle 153
intervention, will be reported in due time in a separate report. 154
Healthy-weight children were approached in their schools. Children received 155
information verbally by one of the experimenters and their parents received information 156
1 The cross-sectional analysis, testing hypothesis 1, was repeated including all tested 34 obese children and 36 healthy-weight children and results remained the same. Similarly, follow-up analyses, testing hypothesis 2, were repeated for the sub-sample of the 30 obese children (included to test hypothesis 1) also yielded the same results as when including the whole sub-sample of obese children.
ATTENTION BIAS FOR FOOD IN CHILDREN
8
leaflets. Healthy-weight children were informed that they were only eligible for participation 157
if they had a healthy-weight (based on self-report) and would match in the mean age and 158
gender range of included children with obesity. If parents and their children provided 159
informed consent they were invited for participation. 160
Six school children were tested but not included in analyses, because at the end of data 161
collection, they did not match tested obese participants in age and/or gender (n = 4) or 162
because assessment of the body mass index (BMI) at the end of testing indicated that they 163
were overweight (n = 2). So, 30 children with obesity and 30 healthy-weight children who 164
were matched individually on age and gender were included in data analyses for testing 165
hypothesis 1 (i.e., differences in attentional biases between children with obesity and healthy-166
weight children). Matching was successful, in that the groups of children with obesity and 167
healthy-weight children did not differ on age, t(29) = 0.14, p = .89, or gender distribution, 168
χ2(1, 60) = 0.00, p = 1, see Table 3 for characteristics. The percentage of overweight was 169
calculated based on the body mass index divided by the national (Dutch) norm BMI (Van 170
Winckel & Van Mil, 2001), adjusted for gender and age, × 100 (for a similar classification see 171
e.g., Braet & Crombez, 2003; Nederkoorn, Coelho, Guerrieri, Houben, & Jansen, 2012; 172
Soetens & Braet, 2007). According to this percentage a value of 100% indicates 0 % 173
overweight. A BMI percentage of 90 – 120% is regarded as a healthy BMI range for a child. 174
A percentage of 120 % - 140% of the ideal weight is classified as overweight, a percentage of 175
140 – 160% is classified as moderate obesity, and a percentage of 160% is regarded as serious 176
obesity. According to this classification, 9 (30%) of the tested children with obesity were 177
moderately obese and 21 (70%) were severely obese (range: 142.28% - 232.56%). All 178
healthy-weight children had an adjusted BMI within the healthy weight range (range: 81.67% 179
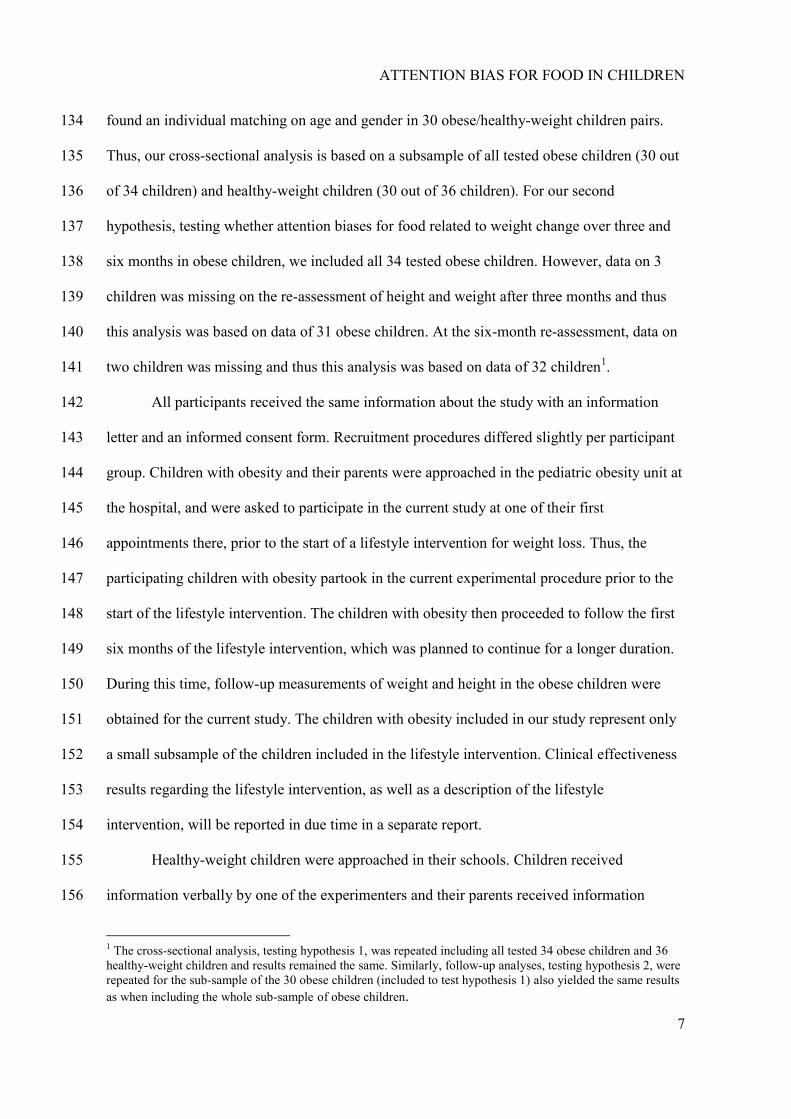
- 116.84%). For mean adjusted BMI per group, see Table 2. 180
< Insert Table 2 about here> 181
ATTENTION BIAS FOR FOOD IN CHILDREN
9
Three and six month follow-up data on BMI for 31 and 32 children with obesity 182
respectively was available throughout the assessment in the hospital and was used to test 183
hypothesis 2 (i.e., whether attentional biases for food cues predict weight change over time). 184
Pictorial visual probe paradigm 185
Overview. Attention allocation towards high-calorie food stimuli was measured during 186
a visual probe task with concurrent recordings of eye movements as a direct measure of 187
attention bias, and the assessment of response latencies as an indirect index of attention bias. 188
In the visual probe task, two images are presented simultaneously side by side followed by a 189
probe (*) appearing in the location of one of the images. Children were instructed to indicate 190
the location of the probe as quickly as possible by pressing a corresponding key on a standard 191
computer keyboard. Children first completed a brief practice round to get familiarized with 192
the visual probe task. 193
Timing Trials. Each trial started with a central fixation cross, which remained on the 194
screen for 100 ms. Subsequently, the target image pair was presented for 3000 ms. Then the 195
probe, (*), was presented until the participant responded by pressing the appropriate key on a 196
button box. 197
Trial types. A brief practice round with 10 trials was included prior to the actual task. 198
The actual visual probe paradigm included 80 trials in total: 64 critical trials and 16 filler 199
trials. These trials were divided into 2 blocks of each 40 trials. Critical trials consisted of 16 200
stimulus pairs, which each presented four times. Filler trials consisted of 4 stimulus pairs, 201
each of which presented four times. The position of the probe was equally distributed per 202
stimulus type and displayed on the left and right side of the screen in equal measure. The 203
order of trials was uniquely randomized for each participant. 204
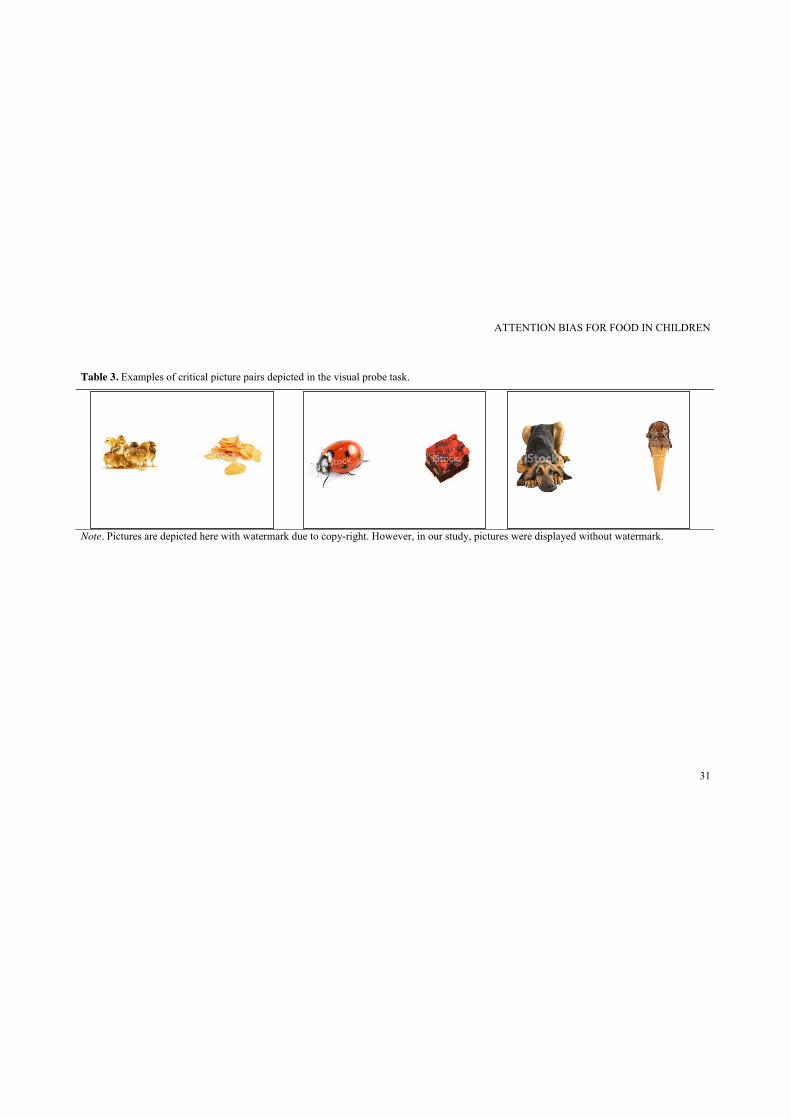
Stimuli. In critical trials, the image pair consisted of a picture of a high-calorie food 205
item and a picture of an animal, for example vanilla muffins and little ducklings, see Table 3 206
ATTENTION BIAS FOR FOOD IN CHILDREN
10
for illustration. Filler trials consisted of picture pairs depicting two neutral non-food 207
photographs (e.g. shoes and furniture). All image pairs were matched as closely as possible 208
with regard to colour, complexity and brightness, and size of the depicted object. A pilot test 209
was conducted to match food and animal stimuli on attractiveness. For critical picture pairs, 210
pictures of animals were matched with pictures of palatable, high-calorie food on visual 211
features and pictures of furniture and shoes were matched on visible feature to create neutral 212
filler picture pairs. In the pilot, 65 school children rated a pool of 48 matched critical picture 213
pairs and 18 matched neutral filler picture pairs on the valence and attractiveness of each of 214
the depicted stimuli on a 5-point Likert scale, with higher scores indicating more 215
attractiveness. Based on these ratings, the 20 picture critical pairs in which the food stimulus 216
and the animal stimulus were rated most attractive and at the same time most similar in terms 217
of attractiveness were used in this study (M ratings animals = 3.89, SD = 0.5; M ratings food = 4.07, 218
SD = 0.4, overall M ratings critical pairs = 3.88, SD = 0.3). For filler trials, ten of the most neutrally 219
and similarly rated neutral filler pairs were included (overall M ratings filler pairs = 2.99, SD = 0.3). 220
Each picture was presented equally often on the left and on the right of the screen. For 221
practice trials, pictures pairs consisted of photographs of neutral non-food items, which were 222
different from the photographs used for filler trials. See Table 3 for examples of critical 223
picture pairs. 224
< Insert Table 3 about here> 225
Eye movement measurements. Eye movements were recorded by a desktop mounted 226
EyeLink 1000 system (SR Research Ltd., Mississauga, Ontario, Canada). A 9-point 227
calibration with subsequent validation procedure was conducted prior to the visual probe 228
paradigm. To assess attention allocation processes, participants’ gaze fixations were studied. 229
Gaze fixations were defined as any period that is not a blink or saccade and lasts at least 100 230
ms (Eyelink Dataviewer User’s Manual, 2002-2008, SR Research Ltd.). Eye movements that 231
ATTENTION BIAS FOR FOOD IN CHILDREN
11
occurred before the presentation of an image pair were excluded, because these movements 232
could represent anticipatory fixations. 233
For analysis purposes the computer screen was divided into three areas of interest: the 234
mid-section, which indicated the location of the fixation cross, and the left and right sections, 235
representing the locations of the picture stimuli. Only eye movements in critical trials directed 236
either to the left or the right section of the screen were extracted for further analyses. Eye 237
movements in filler trials and gaze fixations in the mid area were excluded from further 238
analyses. Eye movements were extracted using Data Viewer (SR Research Ltd., Mississauga, 239
Ontario, Canada). 240
Attention Bias Scores. Three attention bias scores were derived from the eye 241
movement data: initial orientation bias scores, initial gaze duration bias scores and gaze dwell 242
time bias scores, see also Table 1. 243
An initial orientation bias reflects an early attentional process, and is calculated based 244
on the number of first fixations that are directed to a high-calorie food picture as a proportion 245
of all trials on which a first fixation is made to either picture (Castellanos, et al., 246
2009;Werthmann, et al., 2013). A bias score of 50% indicates no bias for food, a bias score 247
greater than 50% represents a higher proportion of first fixations directed to high-calorie food 248
stimuli, whereas a bias score lower than 50% indicates a higher proportion of first fixations 249
directed to non-food stimuli. 250
The initial gaze duration bias is seen as a measure for early attention maintenance (e.g. 251
Bradley, Mogg, Wright, & Field, 2003). This bias is calculated based on the sum of multiple 252
fixations occurring within the region of the initially fixated picture before gaze is shifted 253
away. This means that the first initial fixation may be followed by a second or third fixation 254
within the same picture. The sum of these initial fixations together indicates initial gaze 255
duration before the person looked away from the picture. Initial gaze durations per image 256
ATTENTION BIAS FOR FOOD IN CHILDREN
12
category (high-calorie food or non-food) were averaged over the relevant trials per 257
participant. Bias scores for the initial gaze duration were computed by subtracting the mean 258
duration of initial fixation directed to non-food images from the mean duration of initial 259
fixation directed to high-calorie food images. Thus, a positive score is indicative of longer 260
initial attention maintenance on high-calorie food stimuli, whereas a negative score is 261
indicative of the reverse: longer initial maintenance on non-food stimuli. 262
Gaze dwell time is informative regarding the maintenance of attention on critical 263
stimuli (e.g. Mogg, Field, & Bradley, 2005). Overall dwell time per image category (high-264
calorie food vs. non-food) was calculated for each critical trial, and then averaged per image 265
category over all trials, resulting in an average total dwell time per image category. For the 266
gaze dwell time bias score, the mean dwell time on non-food images was subtracted from the 267
mean dwell time on high-calorie food images. Thus, a positive score indicates that attention 268
was maintained longer on high-calorie food items than on non-food items, whereas a negative 269
score indicates the reverse: longer maintained attention on non-food items. 270
Manual response latencies to probes. The logic of the visual probe task presumes that 271
participants are faster to respond to probes appearing in the location of the stimulus that they 272
attended are slower to respond to probes appearing in the location of the stimulus that they did 273
not attend (MacLeod, Mathews, & Tata, 1986). Participant’s manual response latencies when 274
indicating the location of the probe were used to calculate response latency bias scores. Based 275
on a stimulus duration of 3000 ms the response latency bias indirectly reflects a maintained 276
attention process. For analysis, response latencies from incorrect trials were excluded. 277
Response latencies were excluded from further analyses if they were faster than 200ms, 278
slower than 2000ms, and then if they deviated more than 3 SDs from each participant’s mean 279
(e.g. Castellanos, et al., 2009; Mogg, Bradley, Hyare, & Lee, 1998). Based on this calculation, 280
on average 4% of data was discarded per participant and all participants had ≤ 6.25% of data 281
ATTENTION BIAS FOR FOOD IN CHILDREN
13
missing. Response latency bias scores were then calculated by subtracting the mean response 282
latency on congruent trials (that is, when the probe replaced a high-calorie food image) from 283
the mean response latency on incongruent trials (that is, when the probe appeared in the same 284
location as the preceding non-food image). A positive bias score indicates an attention bias 285
towards high-calorie food, whereas a negative bias score indicates an attention bias away 286
from high-calorie food. 287
Procedure 288
All children were tested individually in a dimly lit room between 9 am and 12 pm. 289
Healthy-weight children were tested at their respective schools and children with obesity were 290
tested in a laboratory room at the Faculty of Psychology & Neuroscience, as part of a general 291
baseline assessment of their physical and psychological condition at the hospital. After a brief 292
validation procedure to adjust eye-tracking parameters, children first completed the ten 293
practice trials and subsequently continued with the first half of the visual probe task. The 294
visual probe task was split in two blocks to give children the possibility to take a brief rest of 295
about one or two minutes between blocks. After the short break, children completed the 296
second half of the visual probe task. Then children or their parents provided information on 297
age and school type. Finally, weight and height were measured without shoes and in light 298
clothing to calculate the BMI and the adjusted BMI. Weight was measured using a digital 299
scale and height was measured with a tape measure. Weight and height for children with 300
obesity was subsequently assessed at their 3 month and their six month follow-up 301
appointment at the hospital. All children received compensation with the value of €7.50 for 302
their participation in the experiment. The current study received ethical approval from the 303
ethics committee of the Faculty of Psychology & Neuroscience and from the medical-ethical 304
committee at the local academic hospital. 305
Data Analysis 306
ATTENTION BIAS FOR FOOD IN CHILDREN
14
To test if healthy-weight children differ in their attention bias for food from children 307
with obesity (hypothesis 1), an independent t-test with group (healthy-weight vs. obese) as 308
independent variable was conducted for the four measures of attention biases (initial 309
orientation, initial gaze duration, dwell time, response latencies). To test further if observed 310
attention bias scores were significantly stronger for food images, several one-sample t-tests 311
were conducted for the whole group. To test if all children initially looked more often at the 312
food image than at the non-food image, a one-sample t-test for initial orientation bias (tested 313
against 50, indicating no bias) was conducted. To test if children remained with their attention 314
longer on food versus non-food stimuli, one-sample t-tests against 0 (indicating no bias on the 315
attention-maintenance based attention measures) were conducted for initial duration bias, for 316
dwell time bias and for the response latency bias. 317
To test hypothesis 2, we explored if attention biases for food predicted BMI change at 318
three months and at six months in children with obesity who were enrolled in the lifestyle 319
intervention. First, BMI change for three and six months was computed for all children with 320
obesity. For BMI change after three months, the adjusted BMI % at time of testing was 321
subtracted from the adjusted BMI % at three months. Similarly for BMI change after six 322
months, the adjusted BMI % at testing was subtracted from the adjusted BMI % at six 323
months. A positive score represents an increase in adjusted BMI %, thus weight gain over 324
time adjusted for gender and age, whereas a negative score represents a decrease in adjusted 325
BMI %, thus weight loss adjusted for gender and age. Follow-up data at three and six months 326
were missing for two children who stopped coming to their regular appointments at the 327
hospital, and for one child who missed the appointment at three months. Follow-up data on 328
the remaining sample of 32 children with obesity was used for analyses at six months and for 329
31 children with obesity at three months. BMI change at three and BMI change at six months 330
(based on % overweight, adjusted for gender and age, according to the national norms) was 331
ATTENTION BIAS FOR FOOD IN CHILDREN
15
entered as dependent variable in the two regression analyses respectively. All four attentional 332
bias measures (initial orientation, initial gaze duration, dwell time and response latencies) 333
were centred before being entered as predictors into the respective regression model. As 334
previous research does not give an indication which attention bias measure might be the best 335
predictor for BMI change over time, an exploratory approach was chosen by selecting the 336
backward method as analytic strategy to determine which predictor has a significant effect on 337
BMI change. 338
339
Results 340
Participant characteristics 341
Participating children were on average about 12 years old (Mage = 11.86, SD = 2.93, age range 342
= 6.45 – 16.82 years). More girls (n = 34) than boys (n = 26) participated. Although matching 343
children in age was successful, more obese children were still in the primary school at the 344
time of testing in comparison to healthy-weight children, even though this difference was not 345
significant, see Table 2 for all participants’ characteristics. 346
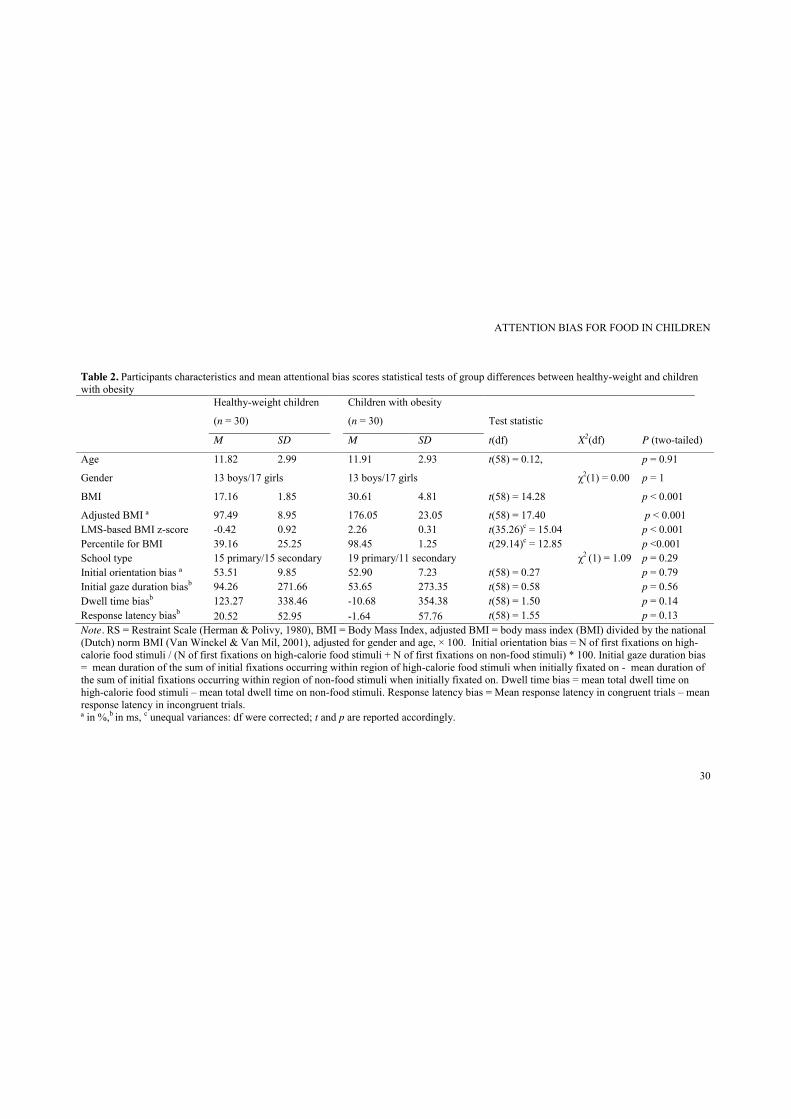
Do attentional biases differ between healthy-weight children and children with obesity? 347
Healthy-weight children and children with obesity were compared on attentional bias 348
measures (initial direction, initial gaze duration, dwell time, response latencies) Results 349
showed that attention for food did not differ on any of the attentional bias measures between 350
children with obesity and healthy-weight children, all ts < 1.50, all ps > .14, see Table 2 for 351
exact statistics. Further, one sample t-tests indicated that all children directed their first gaze 352
more often towards food cues than non-food cues (M = 53.21, SD = 8.58), t(59) = 2.90, p = 353
.005. Moreover, all children also maintained their first gaze longer on food cues than on non-354
food cues (M = 73.95, SD = 270.96), t(59) = 2.11, p = .039. No significant results for dwell 355
time bias (M = 56.30, SD = 350.14), t(59) = 1.24, p = .22, and response latency bias (M = - 356
ATTENTION BIAS FOR FOOD IN CHILDREN
16
8.51, SD = 59.04), t(59) = 1.12, p = .27, were obtained, indicating that attention was not 357
maintained longer on food images than non-food images in later attention processes in the 358
whole sample. 359
Do attentional biases predict change in BMI after three and six months? 360
Mean adjusted BMI change was – 1.58% (SD = 8.88) at three months and – 2.40% 361
(SD = 10.82) at six months. Inspection of a scatterplot suggested that one participant had an 362
outlying decrease in adjusted BMI scores after three months (- 28.68 % change in adjusted 363
BMI, i.e., 3.05 SDs below the mean adjusted BMI change) and after six months (- 38.90 % 364
change in adjusted BMI, i.e., 3.30 SDs above the mean adjusted BMI change), and therefore 365
these outlying BMI changes were recoded to the nearest BMI change score in the obese group 366
(-19.58%, i.e. 2.04 SDs below the mean adjusted BMI change, and -19.21%, i.e. 1.55 SDs 367
below the mean adjusted BMI change, respectively) (see Wilcox, 2011) prior to the regression 368
analysis2. Results of the regression analysis testing if attention bias measures predicted BMI 369
change at three months indicated that none of the attentional bias measures were significantly 370
related to change in adjusted BMI after three months in children with obesity enrolled in a 371
lifestyle intervention, all β < .16, all ps > .45. 372
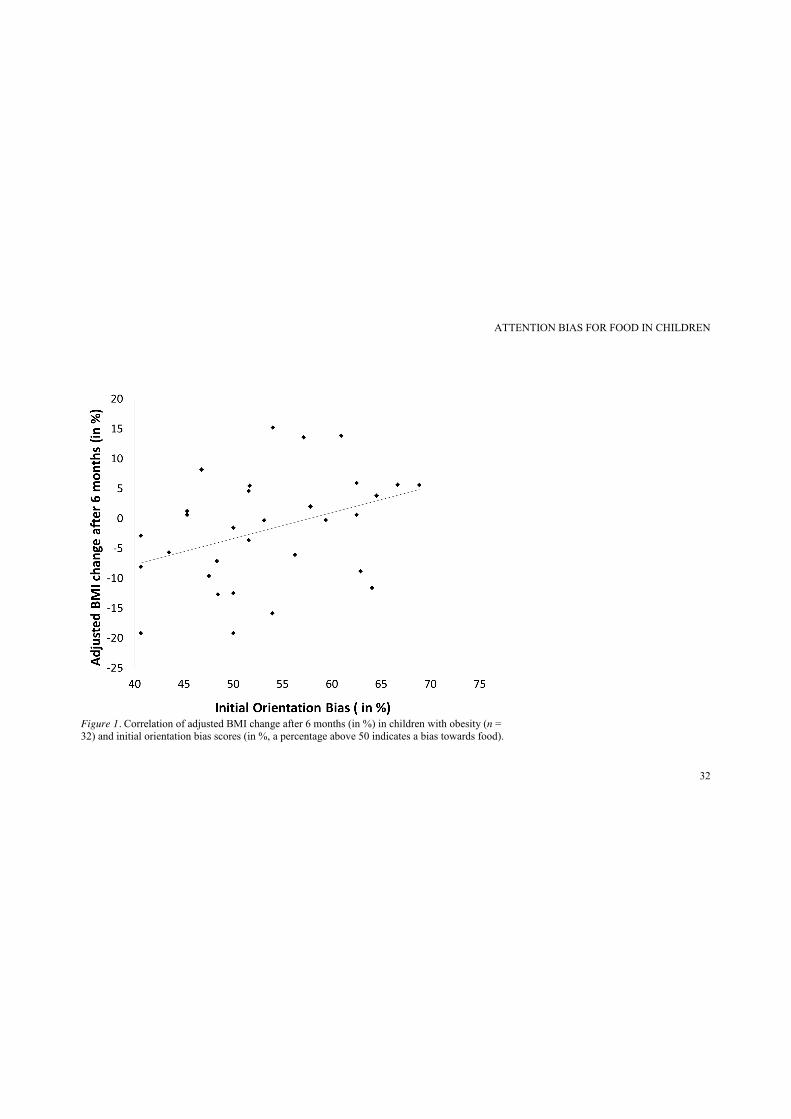
Results of the regression analysis testing if any of the attention bias measures was 373
related to BMI change at six months showed that initial orientation bias significantly 374
predicted changes in BMI after six months, β = 0.38, t(30)= 2.24, p =.032, and explained 14% 375
of variance in BMI change after six months, R2 = .14, F(30) = 5.03, p =.032, see Figure 1. 376
This finding suggests that initially directing attention more often towards food than non-food 377
stimuli was related to a reduced weight loss or even weight gain after six months in children 378
with obesity enrolled in a lifestyle intervention. 379
Discussion 380
2 Results remained the same when we included this participant with the original BMI change scores in our data analysis.
ATTENTION BIAS FOR FOOD IN CHILDREN
17
Attention bias for food might contribute to increased food intake and therefore constitute a 381
cognitive mechanism contributing to the development and/or maintenance of obesity. The 382
primary aim of this study was to test whether children with obesity differ in their attention 383
bias for food from healthy-weight children. A second aim was to test if attention bias for food 384
predicts subsequent weight change in children with obesity who were, by then, following a 385
weight loss lifestyle intervention. To test these hypotheses, attention bias for food was 386
measured in healthy-weight children and in children with obesity using a visual probe task 387
depicting food and non-food stimuli with concurrent assessment of eye-movements and 388
measurement of response latencies. 389
Contrary to our first hypothesis, our results provide no empirical evidence for 390
differences in attentional biases for food between children with obesity and healthy-weight 391
children. Instead, our results suggest that all children have a tendency to orientate towards 392
palatable high-calorie food cues (i.e. initial orientation bias) and initially maintain their first 393
gaze longer on food cues than on non-food cues (i.e. initial gaze duration bias). These 394
findings suggest that palatable high-calorie food cues are highly salient stimuli for all 395
children, irrespective of their weight status. Considering that food items were more powerful 396
in capturing children’s initial attention even when paired with equally liked animal pictures, 397
our results therefore highlight the prominence of food cues in the “obesogenic” environment 398
for children. 399
While the observation that all children, not only children with obesity, have an 400
attention bias for food cues concurs with similar findings in adults suggesting that all adults 401
have an attentional bias for food, irrespective of their weight (e.g., Nijs, Franken, & Muris, 402
2008; Werthmann, Roefs, Nederkoorn, & Jansen, 2013; Werthmann, Roefs, Nederkoorn, 403
Mogg, et al., 2013), it contradicts studies that demonstrated differences in attention bias for 404
food in obese versus healthy-weight adults and children (Braet & Crombez, 2003; 405
ATTENTION BIAS FOR FOOD IN CHILDREN
18
Castellanos, et al., 2009). One possible explanation for this diversity of results is related to the 406
choice of paradigm and the choice of relevant stimuli. Different paradigms tap into different 407
attention processes: Indirect measures of attention bias, as applied in previous studies with 408
pediatric samples, might reflect processes other than direct measurements of visual attention, 409
as applied in the current study. For example, the assessment of response latencies as a 410
measure for attention bias has been debated and researchers have argued that the indirect 411
assessment of attention bias via response latencies may not be reliable (Ataya et al., 2012; 412
Field & Christiansen, 2012; Kappenman, Farrens, Luck, & Proudfit, 2014). 413
Thus, a particular strength of the current study was that the direct assessment of 414
attention allocation (by means of eye-tracking) complemented indirect measurements of 415
attention processes. Eye-tracking provides a more detailed and accurate account of visual 416
information processing, thereby overcoming the disadvantage of indirect attention indices, 417
which reflect only a snap-shot view of attention allocation (based on the stimulus duration) 418
and cannot inform on attention processes during the stimuli presentation itself (see e.g. Mogg, 419
et al. 2009). In contrast, eye-tracking based attention bias scores reflect attentional processing 420
during the stimuli presentation and can provide information on different temporal components 421
of attention and on attentional approach or avoidance. Hence, previous studies might have 422
come to different results because they relied on indirect assessment of attention and therefore 423
tapped into a different mechanism than visual processing of food cues. 424
Moreover, the stimulus selection might also affect attentional processes. Previous 425
research that measured food-related attention often contrasted high-calorie food items with a 426
relatively neutral stimulus category, such as office supplies or musical instruments. In this 427
respect, the current study highlights the power of an attentional bias for food cues by 428
demonstrating that even in contrast to a highly liked contrast category (i.e., equally liked 429
animal pictures), food cues were more potent in grabbing attention. Thus, the current study 430
ATTENTION BIAS FOR FOOD IN CHILDREN
19
extends previous research on food-cue related attentional biases by showing that even in 431
contrast to comparatively attractive other objects, food cues are more capable of grabbing 432
early attention. 433
Another explanation for the diverse results could be that all children have an innate 434
attention bias for food, yet attention bias for food might wane in healthy-weight children 435
during the course of their development, whereas attention bias for food might remain 436
heightened, in contrast to other stimuli in the environment, in children with obesity. However, 437
this argument is purely speculative and future research should further investigate how 438
attention biases for food change over time in healthy-weight and obese children. 439
In this respect, the results concerning our second hypothesis might be important in 440
showing that a bias in initial orientation towards food positively predicted weight gain after 441
six months in children with obesity who were enrolled in a weight loss intervention. This 442
finding supports the hypothesized role of attention in the etiology and maintenance of obesity: 443
directing attention towards food might be a vulnerability factor for overconsumption, and thus 444
subsequent weight gain. However, based on our results it is not clear if this process is specific 445
for children with obesity following a lifestyle intervention or could also be observed in 446
healthy-weight children or children with obesity who are not enrolled in a lifestyle 447
intervention. Yet, in general, our findings are in line with results obtained in adolescents and 448
young adults. For example, a neuroimaging study yielded that activity in brain regions 449
associated with attention, during the presentation of food cues, was positively related to BMI 450
and weight gain over 12 months in female adolescents (Yokum, et al., 2011). Similarly, 451
another study demonstrated that Stroop interference for unhealthy food words predicted 452
weight gain in a mainly healthy-weight student sample, whereas Stroop interference for 453
healthy food words negatively predicted weight change (Calitri, et al., 2010). A clinical 454
implication of this finding is that attentional re-training might be a useful adjunct to 455
ATTENTION BIAS FOR FOOD IN CHILDREN
20
treatments that focus on weight-loss for obese children. Just recently a novel study supported 456
this notion by showing that an attentional training was related to eating in the absence of 457
hunger in obese children (Boutelle, Kuckertz, Carlson, & Amir, 2014). 458
With regard to the role of specific temporal attention components, it is interesting to 459
note that the early attention component was associated with reduced weight loss or even 460
weight gain in the current study. In contrast, previous research on substance use and food 461
intake suggested that a later attentional component, namely maintained attention, was 462
associated with subsequent consumption (e.g., Field, et al., 2009; Werthmann, Roefs, 463
Nederkoorn, & Jansen, 2013). A possible explanation for this divergence could be that a later 464
attention component reflects a rather conscious decision about eating, and thereby predicts 465
immediate consumption. Early attention, on the other hand, might reflect less conscious 466
motivational vulnerability to overconsumption, and thereby predicts weight change over time. 467
Yet, this conclusion is rather speculative and further research is needed to determine the 468
impact of different temporal attention components on eating behaviour and weight change 469
over time. 470
Our results should be viewed under the limitations of our study: Even though a pilot 471
test indicated that children rated animal pictures as similarly well liked as food pictures, we 472
did not ask children in the current study to rate the attractiveness of animal and food pictures. 473
Accordingly, it is possible that the participating children preferred food pictures over animal 474
pictures and this could have affected the observed results. Moreover, even though all children 475
were tested in the morning, after breakfast, we did not formally check if all children indeed 476
consumed breakfast and did not assess subjective hunger states. Considering that research 477
(e.g., Loeber, Grosshans, Herpertz, Kiefer, & Herpertz, 2013) suggests that hunger influences 478
an attention bias for food, the current results should be viewed under this limitation. 479
ATTENTION BIAS FOR FOOD IN CHILDREN
21
Differences in the testing environment for obese children (university/hospital) and 480
healthy-weight children (schools) might have induced different mind-sets: Obese children 481
might have been more focused on a healthy mind-set whereas healthy-weight children might 482
have been less focused on a healthy mind-set. Previous research demonstrated that such a 483
mind-set can influence implicit measures of food evaluation (Roefs et al., 2006). Thus, even 484
though speculative, it is possible that our results underestimate the attentional bias in children 485
with obesity, because obese children’s attention bias for high-calorie food might have been 486
attenuated by a testing environment that is associated with “health”. 487
In addition, as mentioned previously, our results on the relation of an attentional bias 488
and BMI change over time apply only for children with obesity participating in a lifestyle 489
intervention to lose weight and might be underpowered. Future studies should therefore 490
extend our results and test the impact of an attentional bias on weight change within a larger 491
sample of both healthy-weight children and children with obesity who are not enrolled in a 492
lifestyle intervention. 493
Despite these limitations, the present study has several strengths. A highly innovative 494
aspect of the current study is that the relation of visual attention bias for food and BMI 495
differences was measured within a pediatric sample and the relation of an attentional bias for 496
food and weight change was explored in obese children following a lifestyle intervention to 497
lose weight. A major methodological strength is the combination of an indirect and a direct 498
assessment for biased attention. Another novelty of this study was the use of valence-matched 499
non-food stimuli (i.e., pictures of cute animals) as a contrast to the food stimuli, which is also 500
a methodological strength because these picture pairs were pilot-tested with regard to the 501
attractiveness of depicted food/animals. 502
Taken together, the current findings might partly explain how the current food 503
environment influences children’s eating behavior: food cues grab the attention of all 504
ATTENTION BIAS FOR FOOD IN CHILDREN
22
children, even when other attractive alternatives are available. Our results moreover suggest 505
that biased attention for high-calorie foods increases the chance of future weight gain in 506
children with obesity. Our results stress the “toxic” impact of an obesogenic food 507
environment on children’s perception and on obesity in children. 508
509
ATTENTION BIAS FOR FOOD IN CHILDREN
23
References
Ataya, A. F., Adams, S., Mullings, E., Cooper, R. M., Attwood, A. S., & Munafo, M.
R. (2012). Internal reliability of measures of substance-related cognitive bias.
Drug Alcohol Depend, 121(1-2), 148-151. doi:
10.1016/j.drugalcdep.2011.08.023
Berridge, K. C. (1996). Food reward: Brain substrates of wanting and liking.
Neuroscience & Biobehavioral Reviews, 20, 1-25. doi: 10.1016/0149-
7634(95)00033-B
Boutelle, K. N., Kuckertz, J. M., Carlson, J., & Amir, N. (2014). A pilot study
evaluating a one-session attention modification training to decrease overeating
in obese children. Appetite, 8, 180-185.
Bradley, B. P., Mogg, K., Wright, T., & Field, M. (2003). Attentional bias in drug
dependence: Vigilance for cigarette-related cues in smokers. Psychology of
Addictive Behaviors, 17(1), 66-72. doi: 10.1037/0893-164X.17.1.66
Braet, C., & Crombez, G. (2003). Cognitive interference due to food cues in
childhood obesity. Journal of Clinical Child and Adolescent Psychology,
32(1), 32-39.
Cali, A. M., & Caprio, S. (2008). Obesity in children and adolescents. J Clin
Endocrinol Metab, 93(11 Suppl 1), 2008-1363.
Calitri, R., Pothos, E. M., Tapper, K., Brunstrom, J. M., & Rogers, P. J. (2010).
Cognitive Biases to Healthy and Unhealthy Food Words Predict Change in
BMI. Obesity. doi: 10.1038/oby.2010.78
Castellanos, E. H., Charboneau, E., Dietrich, M. S., Park, S., Bradley, B. P., Mogg,
K., & Cowan, R. L. (2009). Obese adults have visual attention bias for food
ATTENTION BIAS FOR FOOD IN CHILDREN
24
cue images: evidence for altered reward system function. [Article].
International Journal of Obesity, 33(9), 1063-1073. doi: 10.1038/ijo.2009.138
Field, M., & Christiansen, P. (2012). Commentary on, 'Internal reliability of measures
of substance-related cognitive bias'. Drug Alcohol Depend, 124(3), 189-190.
doi: 10.1016/j.drugalcdep.2012.02.009
Field, M., Munafó, M. R., & Franken, I. H. A. (2009). A meta-analytic investigation
of the relationship between attentional bias and subjective craving in substance
abuse. Psychological Bulletin, 135(4), 589-607. doi: 10.1037/a0015843
Halford, J. C., Gillespie, J., Brown, V., Pontin, E. E., & Dovey, T. M. (2004). Effect
of television advertisements for foods on food consumption in children.
Appetite, 42(2), 221-225.
Harris, J., L., Bargh, J., A., & Brownell, K., D. (2009). Priming effects of television
food adverstising on eating behavior. Health Psychology, 28(4), 404-413. doi:
10.1037/a0014399
Kappenman, E. S., Farrens, J. L., Luck, S. J., & Proudfit, G. H. (2014). Behavioral
and ERP measures of attentional bias to threat in the dot-probe task: poor
reliability and lack of correlation with anxiety. Front Psychol, 5, 1368. doi:
10.3389/fpsyg.2014.01368
Kelly, B., Halford, J. C., Boyland, E. J., Chapman, K., Bautista-Castano, I., Berg, C., .
. . Summerbell, C. (2010). Television food advertising to children: a global
perspective. Am J Public Health, 100(9), 1730-1736.
LaBerge, D. (2002). Attentional control: brief and prolonged. Psychol Res, 66(4),
220-233.
ATTENTION BIAS FOR FOOD IN CHILDREN
25
Loeber, S., Grosshans, M., Herpertz, S., Kiefer, F., & Herpertz, S. C. (2013). Hunger
modulates behavioral disinhibition and attention allocation to food-associated
cues in normal-weight controls. Appetite, 71, 32-39.
Loeber, S., Grosshans, M., Korucuoglu, O., Vollmert, C., Vollstadt-Klein, S.,
Schneider, S., . . . Kiefer, F. (2012). Impairment of inhibitory control in
response to food-associated cues and attentional bias of obese participants and
normal-weight controls. Int J Obes, 36(10), 1334-1339.
MacLeod, C., Mathews, A., & Tata, P. (1986). Attentional bias in emotional
disorders. Journal of Abnormal Psychology, 95(1), 15-20. doi: 10.1037/0021-
843x.95.1.15
Mogg, K., Bradley, B. P., Field, M., & De Houwer, J. (2003). Eye movements to
smoking-related pictures in smokers: Relationship between attentional biases
and implicit and explicit measures of stimulus valence. Addiction, 98(6), 825-
836. doi: 10.1046/j.1360-0443.2003.00392.x
Mogg, K., Bradley, B. P., Hyare, H., & Lee, S. (1998). Selective attention to food-
related stimuli in hunger: Are attentional biases specific to emotional and
psychopathological states, or are they also found in normal drive states?
Behaviour Research and Therapy, 36(2), 227-237. doi: 10.1016/S0005-
7967(97)00062-4
Mogg, K., Field, M., & Bradley, B. P. (2005). Attentional and approach biases for
smoking cues in smokers: An investigation of competing theoretical views of
addiction. Psychopharmacology, 180(2), 333-341. doi: 10.1007/s00213-005-
2158-x
ATTENTION BIAS FOR FOOD IN CHILDREN
26
Nederkoorn, C., Coelho, J. S., Guerrieri, R., Houben, K., & Jansen, A. (2012).
Specificity of the failure to inhibit responses in overweight children. Appetite,
59(2), 409-413. doi: 10.1016/j.appet.2012.05.028
Nijs, I. M. T., Franken, I. H., & Muris, P. (2008). Food cue-elicited brain potentials in
obese and healthy-weight individuals. Eat Behav, 9(4), 462-470.
Nummenmaa, L., Hietanen, J. K., Calvo, M. G., & Hyona, J. (2011). Food catches the
eye but not for everyone: a BMI-contingent attentional bias in rapid detection
of nutriments. PLoS One, 6(5), 16.
Ogden, C. L., Carroll, M. D., Kit, B. K., & Flegal, K. M. (2014). Prevalence of
childhood and adult obesity in the United States, 2011-2012. Jama, 311(8),
806-814.
Pulgaron, E. R. (2013). Childhood obesity: a review of increased risk for physical and
psychological comorbidities. Clin Ther, 35(1), 014.
Roefs, A., Quaedackers, L., Werrij, M. Q., Wolters, G., Havermans, R., Nederkoorn,
C., . . . Jansen, A. (2006). The environment influences whether high-fat foods
are associated with palatable or with unhealthy. Behaviour Research and
Therapy, 44, 715-736.
Soetens, B., & Braet, C. (2007). Information processing of food cues in overweight
and normal weight adolescents. British Journal Of Health Psychology, 12(Pt
2), 285-304.
Van Winckel, M., & Van Mil, E. (2001). Wanneer is dik te dik? . In C. Braet & M.
Van Winckel (Eds.), Behandelingsstrategieen Bij Kinderen Met Overgewicht
(pp. 11–26). Houten: Bohn Stafleu Van Loghum.
ATTENTION BIAS FOR FOOD IN CHILDREN
27
Wang, Y., & Lim, H. (2012). The global childhood obesity epidemic and the
association between socio-economic status and childhood obesity. Int Rev
Psychiatry, 24(3), 176-188.
Werthmann, J., Field, M., Roefs, A., Nederkoorn, C., & Jansen, A. (2013). Attention
bias for chocolate increases chocolate consumption - An attention bias
modification study. J Behav Ther Exp Psychiatry, 45(1), 136-143.
Werthmann, J., Jansen, A., & Roefs, A. (2014). Worry or craving? A selective review
of evidence for food-related attention biases in obese individuals, eating-
disorder patients, restrained eaters and healthy samples. Proc Nutr Soc, 14, 1-
16.
Werthmann, J., Roefs, A., Nederkoorn, C., & Jansen, A. (2013). Desire lies in the
eyes: Attention bias for chocolate is related to craving and self-endorsed eating
permission. Appetite, 1(13), 00313-00319.
Werthmann, J., Roefs, A., Nederkoorn, C., Mogg, K., Bradley, B. P., & Jansen, A.
(2011). Can(not) take my eyes off it: Attention bias for food in overweight
participants. Health Psychology, 30, 561-569. doi: 10.1037/a0024291
Werthmann, J., Roefs, A., Nederkoorn, C., Mogg, K., Bradley, B. P., & Jansen, A.
(2013). Attention bias for food is independent of restraint in healthy weight
individuals—an eye tracking study. Eating Behaviors. doi:
10.1016/j.eatbeh.2013.06.005
Wilcox, R. R. (2011). Fundamentals of modern statistical methods: Substantially
improving power and accuracy. New York: Springer.
, 25(3), 259-273. doi: 10.1080/10615806.2011.581278
ATTENTION BIAS FOR FOOD IN CHILDREN
28
World Health Organization. (2013). Obesity and overweight. Fact Sheet 311.
Retrieved 02.07.2013, 2013 from
http://amro.who.int/common/Display.asp?Lang=E&RecID=10203
Yokum, S., Ng, J., & Stice, E. (2011). Attentional bias to food images associated with
elevated weight and future weight gain: an fMRI study. Obesity, 19(9), 1775-
1783.
ATTENTION BIAS FOR FOOD IN CHILDREN
29
Table 1: Overview of direct attention bias scores, their definition and calculation. Attention component Attentional bias Definition Calculation Interpretation Early attention process Initial orientation
bias/Direction bias The preferential orientation of the first (initial) gaze towards the critical versus the non-critical stimulus.
N of first gaze at critical stimulus/(N of first gaze at critical stimulus + N of first gaze at non-critical stimulus).
Score > 50% indicates bias to first look towards critical stimulus
Early maintained attention Initial duration bias/Initial gaze duration bias
The preferential initial attention maintenance of the first gaze on one versus the other stimulus.
Mean duration of initial gaze at critical stimulus (in ms, summed over all initial gazes on the critical stimulus before gaze shift) – Mean duration of initial gaze at non-critical stimulus.
Score > 0 indicates a bias towards critical stimulus
Later attention process/maintained attention
Dwell time/duration bias The overall preference of attention maintenance on one versus the other stimulus.
Mean total duration of gaze on critical stimulus (in ms, summed up over the total trial presentation time) – Mean total duration of gaze on non-critical stimulus.
Score > 0 indicates a bias towards critical stimulus
ATTENTION BIAS FOR FOOD IN CHILDREN
30
Table 2. Participants characteristics and mean attentional bias scores statistical tests of group differences between healthy-weight and children with obesity Healthy-weight children
(n = 30)
Children with obesity
(n = 30)
Test statistic
M SD M SD t(df) X2(df) P (two-tailed)
Age 11.82 2.99 11.91 2.93 t(58) = 0.12, p = 0.91
Gender 13 boys/17 girls 13 boys/17 girls χ2(1) = 0.00 p = 1
BMI 17.16 1.85 30.61 4.81 t(58) = 14.28 p < 0.001
Adjusted BMI ª 97.49 8.95 176.05 23.05 t(58) = 17.40 p < 0.001 LMS-based BMI z-score -0.42 0.92 2.26 0.31 t(35.26)c = 15.04 p < 0.001 Percentile for BMI 39.16 25.25 98.45 1.25 t(29.14)c = 12.85 p <0.001 School type 15 primary/15 secondary 19 primary/11 secondary χ2 (1) = 1.09 p = 0.29 Initial orientation bias ª 53.51 9.85 52.90 7.23 t(58) = 0.27 p = 0.79 Initial gaze duration biasb 94.26 271.66 53.65 273.35 t(58) = 0.58 p = 0.56 Dwell time biasb 123.27 338.46 -10.68 354.38 t(58) = 1.50 p = 0.14 Response latency biasb 20.52 52.95 -1.64 57.76 t(58) = 1.55 p = 0.13 Note. RS = Restraint Scale (Herman & Polivy, 1980), BMI = Body Mass Index, adjusted BMI = body mass index (BMI) divided by the national (Dutch) norm BMI (Van Winckel & Van Mil, 2001), adjusted for gender and age, × 100. Initial orientation bias = N of first fixations on high-calorie food stimuli / (N of first fixations on high-calorie food stimuli + N of first fixations on non-food stimuli) * 100. Initial gaze duration bias = mean duration of the sum of initial fixations occurring within region of high-calorie food stimuli when initially fixated on - mean duration of the sum of initial fixations occurring within region of non-food stimuli when initially fixated on. Dwell time bias = mean total dwell time on high-calorie food stimuli – mean total dwell time on non-food stimuli. Response latency bias = Mean response latency in congruent trials – mean response latency in incongruent trials. ª in %,b in ms, c unequal variances: df were corrected; t and p are reported accordingly.
ATTENTION BIAS FOR FOOD IN CHILDREN
31
Table 3. Examples of critical picture pairs depicted in the visual probe task.
Note. Pictures are depicted here with watermark due to copy-right. However, in our study, pictures were displayed without watermark.
ATTENTION BIAS FOR FOOD IN CHILDREN
32
Figure 1. Correlation of adjusted BMI change after 6 months (in %) in children with obesity (n = 32) and initial orientation bias scores (in %, a percentage above 50 indicates a bias towards food).
ATTENTION BIAS FOR FOOD IN CHILDREN
33