Embed Size (px)
Citation preview
1 (105)
COMVEC (AMF Annex 49) final report October 2016
2 (105)
Disclaimer
The work in this project has been carried out within the Technology CollaborationProgramme on Advanced Motor Fuels (AMF TCP). The AMF TCP functions within aframework created by the International Energy Agency (IEA). Views, findings andpublications of the AMF TCP do not necessarily represent the views or policies of the IEASecretariat or of all its individual member countries.
COMVEC (AMF Annex 49) final report October 2016
3 (105)
Abstract
In the “COMVEC” project, eight partners from four continents teamed up to generate newperformance data (energy efficiency, exhaust emissions) for commercial vehicles. The workstarted with the development of a common test procedure. It was decided to use the WorldHarmonized Vehicle Cycle (WHVC) for vehicle testing and the World Harmonized TransientCycle (WHTS) for engine testing.
Altogether, 35 different vehicles were tested on chassis dynamometers, with vehicles rangingfrom light commercial vehicles (vans) to heavy-duty tractors for semi-trailers. In addition, oneengine, installed in an engine dynamometer, was tested. The test programme coveredseveral fuel options: diesel, diesel substitute fuels, natural gas, ethanol and even electricity inthe category of light commercial vehicles.
With the exception of electricity, the variations in specific energy consumption (relative tovehicle weight) with different fuels were rather small, as were the variations in tailpipe carbondioxide emissions. There were, however, significant differences in regulated emissions. Inthe case of regulated emissions, the emission control technology used on the vehicle isdecisive for performance, and not primarily the fuel.
The measurements showed that Euro VI vehicles, on an average, deliver really lowemissions of nitrogen oxides and particulates, whereas most Euro IV and Euro V vehicleshad emissions higher than expected. This leads to the recommendation that countries withless stringent emission legislation in place, when considering tightening requirements, shouldnot go for Euro IV or Euro V, but rather leapfrog to Euro VI, on the condition that high qualityfuel is available. The project findings can also be used when setting up requirements forprocurement of transport services, such that, whenever possible, they favour servicesprovided by Euro VI (or US 2010) certified vehicles.
Well-to-wheel carbon dioxide emissions depend, first and foremost, on the energy used, notthe vehicle itself. Low carbon electricity and the best of biofuels deliver very low well-to-wheelcarbon dioxide emissions. A petrol vehicle running on fossil fuel and an electric vehiclerunning on electricity generated with coal, deliver equally high emissions. In summary, it canbe said that vehicle technology determines regulated emissions, whereas overall carbondioxide emissions are determined by the type of energy carrier (fossil vs. renewable). Euro VI(or US 2010) vehicles, in combination with high quality renewable fuels, are a good choicefor local air quality, as well as the climate.
COMVEC (AMF Annex 49) final report October 2016
4 (105)
Preface
Commercial goods vehicles, light-, medium- and heavy-duty vehicles together, representapproximately 25 % of the total energy use in transport, and are the second largest segmentafter passenger cars.
The goals of the “COMVEC” project (Fuel and Technology Alternatives for CommercialVehicles) were twofold:
1. To agree upon common test procedures for testing and comparing different types ofcommercial vehicles.
2. To generate performance data specific to commercial vehicles (goods vehicles), thusadding to the information on alternative fuels and vehicle technologies generated inprevious AMF activities (Annex 37 on buses, Annexes 38 and 39 on trucks, Annex 43on passenger cars).
With data covering all road vehicle classes, it will eventually be possible to evaluate the bestfit for alternative fuels and new vehicle technologies for road transport, meaning thatalternative technologies can be allocated in the most effective way.
The COMVEC project was set up as a task-shared activity within the IEA TechnologyCollaboration Programme Advanced Motor Fuels. Task-sharing means that all participatingcountries covered their own contribution and participation costs for the project.
The VTT Technical Research Centre of Finland Ltd acted as the Operating Agent for theproject.The other partners in COMVEC were:
Canada, through the Environment and Climate Change Canada (ECCC), TransportCanada’s ecoTECHNOLOGY for Vehicles Program (eTV) and Natural ResourcesCanada’s Program of Energy Research and Development (PERD) Advanced Fuelsand Technologies for Emissions Reduction (AFTER 8).
Chile, through the Centro Mario Molina Chile (CMMCh). China, through the China Automotive Technology and Research Center (CATARC). Denmark, through the Danish Technological Institute (DTI). Japan, through the Organization for the promotion of low emission vehicles (LEVO). Korea, through the Korea Institute of Energy Technology Evaluation and Planning
(KETEP). Sweden, through the Swedish Transport Administration (STA). Thailand, through the PTT Research and Technology Institute.
All in all, COMVEC put together test data from 35 vehicles, ranging from light-dutycommercial vehicles (vans) to heavy-duty tractors for semi-trailers, and one test engine.Some tests were carried out, in parallel, with multiple fuel options.
Special thanks go to Debbie Rosenblatt of Environment and Climate Change Canada fortechnical support and proofreading a major part of the report.
Espoo October 2016
Nils-Olof Nylund, Editor
COMVEC (AMF Annex 49) final report October 2016
5 (105)
Contents
Disclaimer .............................................................................................................................. 2
Abstract .................................................................................................................................. 3
Preface ................................................................................................................................... 4
Contents ................................................................................................................................. 5
Abbreviations ......................................................................................................................... 7
Extended summary ................................................................................................................ 9
1. Introduction ..................................................................................................................... 21
1.1 General ................................................................................................................... 211.2 Vehicle categories and their share of transport energy ........................................... 211.3 Technology options for commercial vehicles ........................................................... 23
2. Goal ................................................................................................................................ 29
3. Partners and sponsors .................................................................................................... 30
4. Structure of the project .................................................................................................... 31
5. Methods .......................................................................................................................... 32
5.1 General ................................................................................................................... 325.2 Well-to-tank data ..................................................................................................... 325.3 Vehicle and engine measurements ......................................................................... 345.4 Calculation of energy consumption ......................................................................... 35
6. Test program - vehicle and engine tests ......................................................................... 37
6.1 General ................................................................................................................... 376.2 Overview of vehicles and engines measured by the project partners ...................... 38
6.2.1 General ....................................................................................................... 386.2.2 Canada ....................................................................................................... 386.2.3 Chile ........................................................................................................... 396.2.4 China .......................................................................................................... 396.2.5 Denmark ..................................................................................................... 396.2.6 Finland ........................................................................................................ 396.2.7 Japan .......................................................................................................... 396.2.8 Sweden ....................................................................................................... 396.2.9 Thailand ...................................................................................................... 40
7. Results and discussion – vehicle tests ............................................................................ 41
7.1 Presentation of results ............................................................................................ 417.2 Canada ................................................................................................................... 41
7.2.1 General ....................................................................................................... 417.2.2 Category 1 .................................................................................................. 417.2.3 Category 3 .................................................................................................. 46
7.3 Chile ....................................................................................................................... 497.3.1 General ....................................................................................................... 497.3.2 Test results ................................................................................................. 497.3.3 Discussion .................................................................................................. 50
COMVEC (AMF Annex 49) final report October 2016
6 (105)
7.4 China ...................................................................................................................... 507.4.1 General ....................................................................................................... 507.4.2 Test results ................................................................................................. 517.4.3 Discussion .................................................................................................. 52
7.5 Denmark ................................................................................................................. 527.5.1 General ....................................................................................................... 527.5.2 Test results ................................................................................................. 527.5.3 Discussion .................................................................................................. 54
7.6 Finland .................................................................................................................... 557.6.1 General ....................................................................................................... 557.6.2 Results ........................................................................................................ 557.6.3 Discussion .................................................................................................. 64
7.7 Sweden .................................................................................................................. 657.7.1 General ....................................................................................................... 657.7.2 Results ........................................................................................................ 667.7.3 Discussion .................................................................................................. 66
7.8 Thailand .................................................................................................................. 677.8.1 General ....................................................................................................... 677.8.2 Results ........................................................................................................ 677.8.3 Discussion .................................................................................................. 68
7.9 Collated chassis dynamometer results .................................................................... 687.9.1 General ....................................................................................................... 687.9.2 Collated results ........................................................................................... 707.9.3 Discussion .................................................................................................. 78
8. Effects of substitute fuels ................................................................................................ 82
8.1 General ................................................................................................................... 828.2 Finland .................................................................................................................... 828.3 Japan ...................................................................................................................... 838.4 Sweden .................................................................................................................. 848.5 Thailand .................................................................................................................. 908.6 Discussion .............................................................................................................. 90
9. Full fuel cycle evaluation ................................................................................................. 92
9.1 General ................................................................................................................... 929.2 WTW results ........................................................................................................... 939.3 Discussion .............................................................................................................. 95
10.Cost estimates for alternative technologies ..................................................................... 97
10.1 General ................................................................................................................... 9710.2 Finnish study on costs of emission reductions in road transport .............................. 9810.3 Roland Berger’s “Integrated Fuels and Vehicles Roadmap to 2030+” ................... 100
11.Conclusions and key messages .................................................................................... 103
COMVEC (AMF Annex 49) final report October 2016
7 (105)
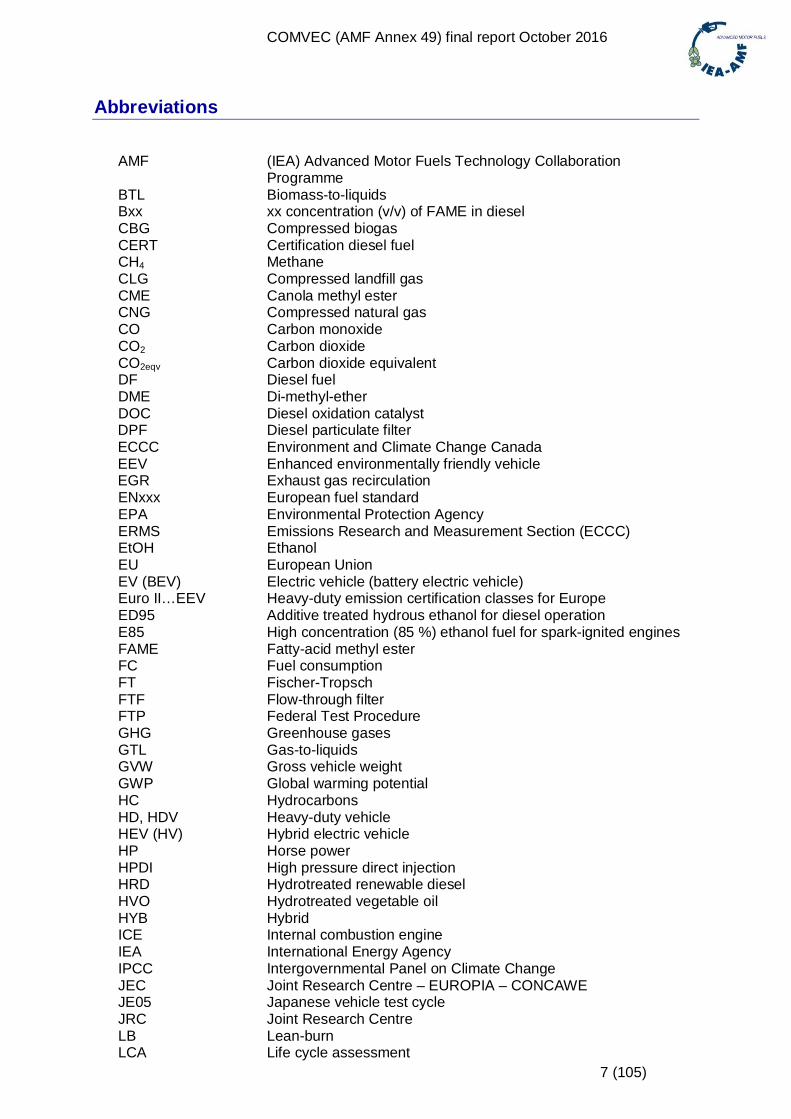
Abbreviations
AMF (IEA) Advanced Motor Fuels Technology CollaborationProgramme
BTL Biomass-to-liquidsBxx xx concentration (v/v) of FAME in dieselCBG Compressed biogasCERT Certification diesel fuelCH4 MethaneCLG Compressed landfill gasCME Canola methyl esterCNG Compressed natural gasCO Carbon monoxideCO2 Carbon dioxideCO2eqv Carbon dioxide equivalentDF Diesel fuelDME Di-methyl-etherDOC Diesel oxidation catalystDPF Diesel particulate filterECCC Environment and Climate Change CanadaEEV Enhanced environmentally friendly vehicleEGR Exhaust gas recirculationENxxx European fuel standardEPA Environmental Protection AgencyERMS Emissions Research and Measurement Section (ECCC)EtOH EthanolEU European UnionEV (BEV) Electric vehicle (battery electric vehicle)Euro II…EEV Heavy-duty emission certification classes for EuropeED95 Additive treated hydrous ethanol for diesel operationE85 High concentration (85 %) ethanol fuel for spark-ignited enginesFAME Fatty-acid methyl esterFC Fuel consumptionFT Fischer-TropschFTF Flow-through filterFTP Federal Test ProcedureGHG Greenhouse gasesGTL Gas-to-liquidsGVW Gross vehicle weightGWP Global warming potentialHC HydrocarbonsHD, HDV Heavy-duty vehicleHEV (HV) Hybrid electric vehicleHP Horse powerHPDI High pressure direct injectionHRD Hydrotreated renewable dieselHVO Hydrotreated vegetable oilHYB HybridICE Internal combustion engineIEA International Energy AgencyIPCC Intergovernmental Panel on Climate ChangeJEC Joint Research Centre – EUROPIA – CONCAWEJE05 Japanese vehicle test cycleJRC Joint Research CentreLB Lean-burnLCA Life cycle assessment
COMVEC (AMF Annex 49) final report October 2016
8 (105)
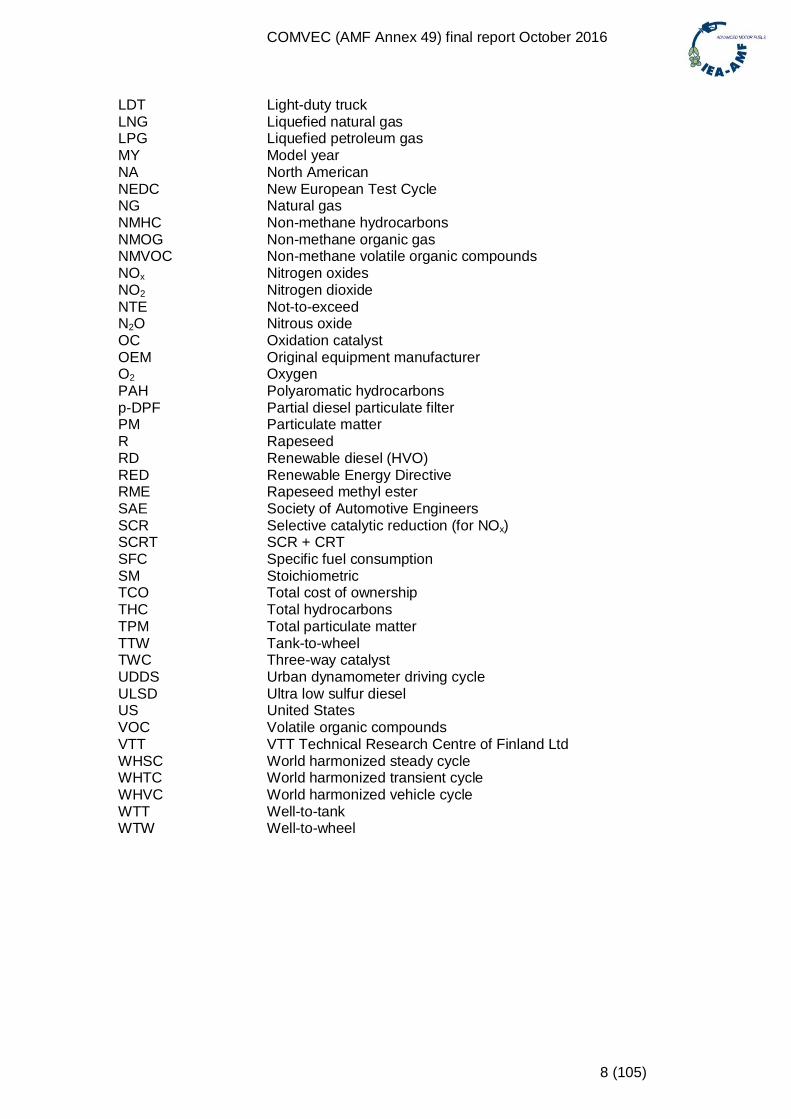
LDT Light-duty truckLNG Liquefied natural gasLPG Liquefied petroleum gasMY Model yearNA North AmericanNEDC New European Test CycleNG Natural gasNMHC Non-methane hydrocarbonsNMOG Non-methane organic gasNMVOC Non-methane volatile organic compoundsNOx Nitrogen oxidesNO2 Nitrogen dioxideNTE Not-to-exceedN2O Nitrous oxideOC Oxidation catalystOEM Original equipment manufacturerO2 OxygenPAH Polyaromatic hydrocarbonsp-DPF Partial diesel particulate filterPM Particulate matterR RapeseedRD Renewable diesel (HVO)RED Renewable Energy DirectiveRME Rapeseed methyl esterSAE Society of Automotive EngineersSCR Selective catalytic reduction (for NOx)SCRT SCR + CRTSFC Specific fuel consumptionSM StoichiometricTCO Total cost of ownershipTHC Total hydrocarbonsTPM Total particulate matterTTW Tank-to-wheelTWC Three-way catalystUDDS Urban dynamometer driving cycleULSD Ultra low sulfur dieselUS United StatesVOC Volatile organic compoundsVTT VTT Technical Research Centre of Finland LtdWHSC World harmonized steady cycleWHTC World harmonized transient cycleWHVC World harmonized vehicle cycleWTT Well-to-tankWTW Well-to-wheel
COMVEC (AMF Annex 49) final report October 2016
9 (105)
Extended summary
General
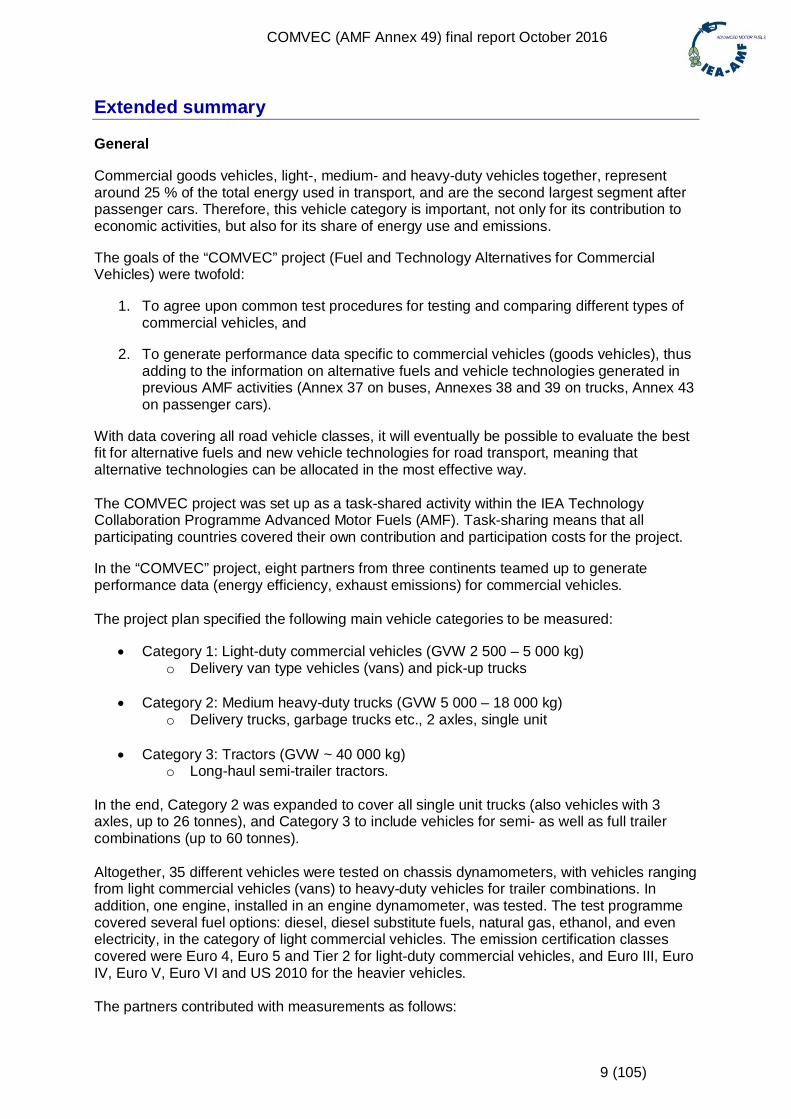
Commercial goods vehicles, light-, medium- and heavy-duty vehicles together, representaround 25 % of the total energy used in transport, and are the second largest segment afterpassenger cars. Therefore, this vehicle category is important, not only for its contribution toeconomic activities, but also for its share of energy use and emissions.
The goals of the “COMVEC” project (Fuel and Technology Alternatives for CommercialVehicles) were twofold:
1. To agree upon common test procedures for testing and comparing different types ofcommercial vehicles, and
2. To generate performance data specific to commercial vehicles (goods vehicles), thusadding to the information on alternative fuels and vehicle technologies generated inprevious AMF activities (Annex 37 on buses, Annexes 38 and 39 on trucks, Annex 43on passenger cars).
With data covering all road vehicle classes, it will eventually be possible to evaluate the bestfit for alternative fuels and new vehicle technologies for road transport, meaning thatalternative technologies can be allocated in the most effective way.
The COMVEC project was set up as a task-shared activity within the IEA TechnologyCollaboration Programme Advanced Motor Fuels (AMF). Task-sharing means that allparticipating countries covered their own contribution and participation costs for the project.
In the “COMVEC” project, eight partners from three continents teamed up to generateperformance data (energy efficiency, exhaust emissions) for commercial vehicles.
The project plan specified the following main vehicle categories to be measured:
Category 1: Light-duty commercial vehicles (GVW 2 500 – 5 000 kg)o Delivery van type vehicles (vans) and pick-up trucks
Category 2: Medium heavy-duty trucks (GVW 5 000 – 18 000 kg)o Delivery trucks, garbage trucks etc., 2 axles, single unit
Category 3: Tractors (GVW ~ 40 000 kg)o Long-haul semi-trailer tractors.
In the end, Category 2 was expanded to cover all single unit trucks (also vehicles with 3axles, up to 26 tonnes), and Category 3 to include vehicles for semi- as well as full trailercombinations (up to 60 tonnes).
Altogether, 35 different vehicles were tested on chassis dynamometers, with vehicles rangingfrom light commercial vehicles (vans) to heavy-duty vehicles for trailer combinations. Inaddition, one engine, installed in an engine dynamometer, was tested. The test programmecovered several fuel options: diesel, diesel substitute fuels, natural gas, ethanol, and evenelectricity, in the category of light commercial vehicles. The emission certification classescovered were Euro 4, Euro 5 and Tier 2 for light-duty commercial vehicles, and Euro III, EuroIV, Euro V, Euro VI and US 2010 for the heavier vehicles.
The partners contributed with measurements as follows:
COMVEC (AMF Annex 49) final report October 2016
10 (105)
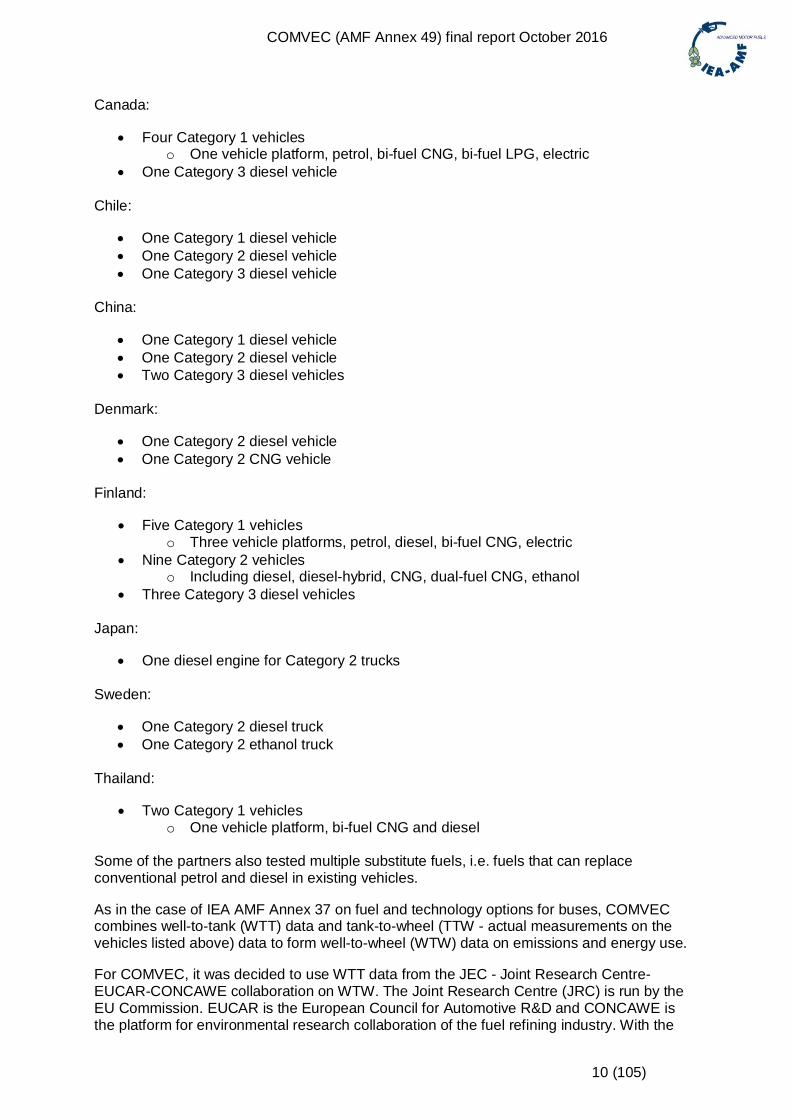
Canada:
Four Category 1 vehicleso One vehicle platform, petrol, bi-fuel CNG, bi-fuel LPG, electric
One Category 3 diesel vehicle
Chile:
One Category 1 diesel vehicle One Category 2 diesel vehicle One Category 3 diesel vehicle
China:
One Category 1 diesel vehicle One Category 2 diesel vehicle Two Category 3 diesel vehicles
Denmark:
One Category 2 diesel vehicle One Category 2 CNG vehicle
Finland:
Five Category 1 vehicleso Three vehicle platforms, petrol, diesel, bi-fuel CNG, electric
Nine Category 2 vehicleso Including diesel, diesel-hybrid, CNG, dual-fuel CNG, ethanol
Three Category 3 diesel vehicles
Japan:
One diesel engine for Category 2 trucks
Sweden:
One Category 2 diesel truck One Category 2 ethanol truck
Thailand:
Two Category 1 vehicleso One vehicle platform, bi-fuel CNG and diesel
Some of the partners also tested multiple substitute fuels, i.e. fuels that can replaceconventional petrol and diesel in existing vehicles.
As in the case of IEA AMF Annex 37 on fuel and technology options for buses, COMVECcombines well-to-tank (WTT) data and tank-to-wheel (TTW - actual measurements on thevehicles listed above) data to form well-to-wheel (WTW) data on emissions and energy use.
For COMVEC, it was decided to use WTT data from the JEC - Joint Research Centre-EUCAR-CONCAWE collaboration on WTW. The Joint Research Centre (JRC) is run by theEU Commission. EUCAR is the European Council for Automotive R&D and CONCAWE isthe platform for environmental research collaboration of the fuel refining industry. With the
COMVEC (AMF Annex 49) final report October 2016
11 (105)
participation of JRC, one could state that the JEC work is sanctioned by the EuropeanCommission.
The experimental work started with the development of a common test procedure. It wasdecided to use the World Harmonized Vehicle Cycle (WHVC) for vehicle testing and theWorld Harmonized Transient Cycle (WHTS) for engine testing. For the chassis dynamometermeasurements, the recommended load was set at 50 % of the full load. All tests were carriedout with fully warmed-up engines.
The test protocol was a recommendation, and the participants were not forced to follow itexactly. The individual participants are responsible for the quality and the relevance ofthe supplied data.
In the report, the results are presented partner by partner, and then the results are collated.Separate chapters on the effects of substitute fuels, full-fuel-cycle evaluations and costassessments are presented.
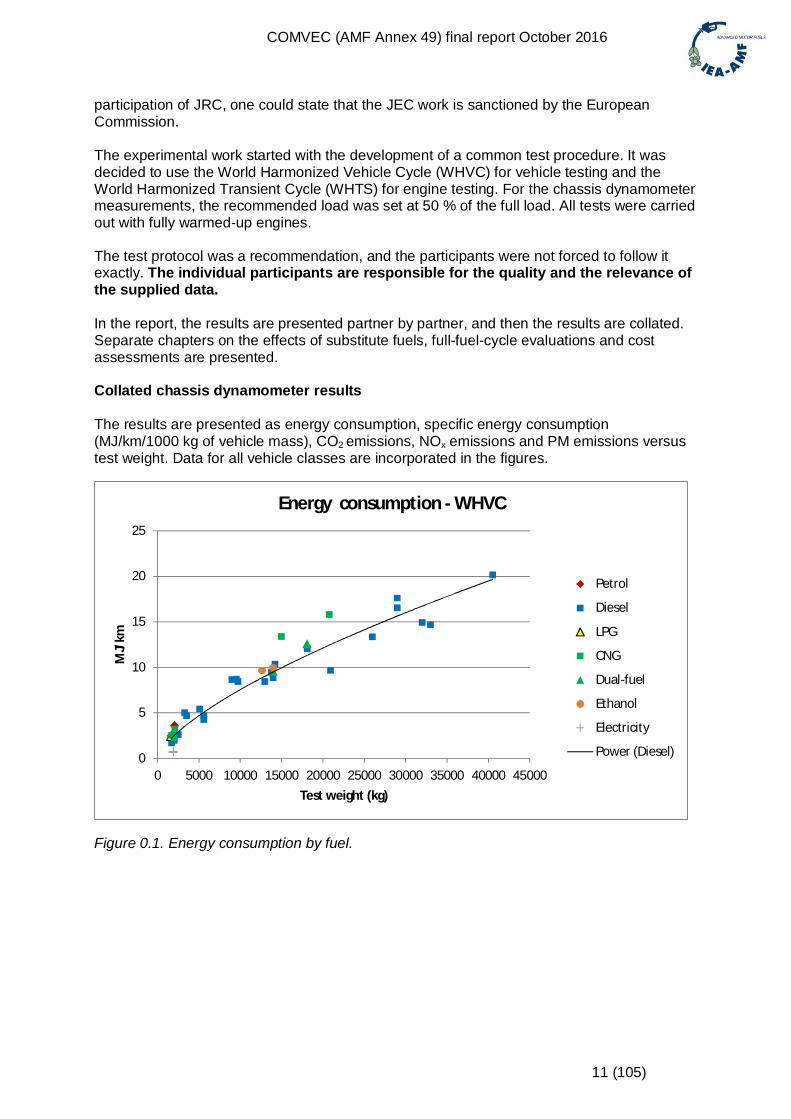
Collated chassis dynamometer results
The results are presented as energy consumption, specific energy consumption(MJ/km/1000 kg of vehicle mass), CO2 emissions, NOx emissions and PM emissions versustest weight. Data for all vehicle classes are incorporated in the figures.
Figure 0.1. Energy consumption by fuel.
0
5
10
15
20
25
0 5000 10000 15000 20000 25000 30000 35000 40000 45000
MJ/
km
Test weight (kg)
Energy consumption - WHVC
Petrol
Diesel
LPG
CNG
Dual-fuel
Ethanol
Electricity
Power (Diesel)
COMVEC (AMF Annex 49) final report October 2016
12 (105)
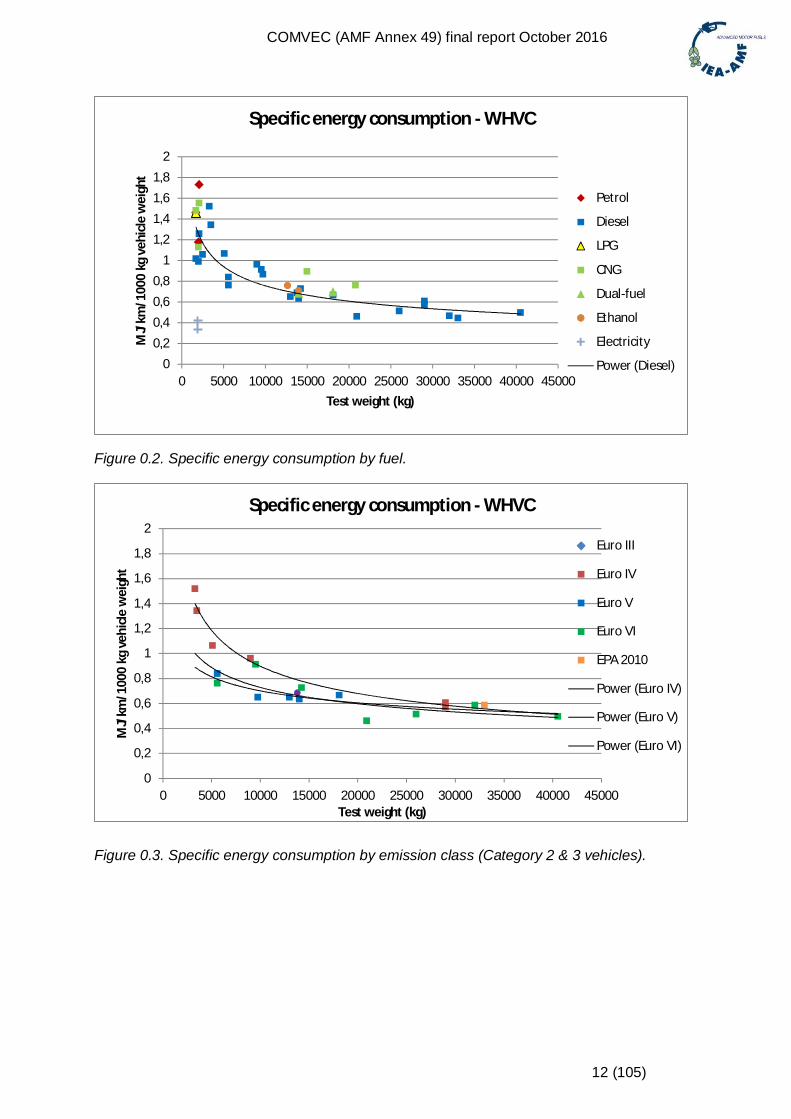
Figure 0.2. Specific energy consumption by fuel.
Figure 0.3. Specific energy consumption by emission class (Category 2 & 3 vehicles).
00,20,40,60,8
11,21,41,61,8
2
0 5000 10000 15000 20000 25000 30000 35000 40000 45000
MJ/
km/1
000
kgve
hicl
ew
eigh
t
Test weight (kg)
Specific energy consumption - WHVC
Petrol
Diesel
LPG
CNG
Dual-fuel
Ethanol
Electricity
Power (Diesel)
0
0,2
0,4
0,6
0,8
1
1,2
1,4
1,6
1,8
2
0 5000 10000 15000 20000 25000 30000 35000 40000 45000
MJ/
km/1
000
kgve
hicl
ew
eigh
t
Test weight (kg)
Specific energy consumption - WHVC
Euro III
Euro IV
Euro V
Euro VI
EPA 2010
Power (Euro IV)
Power (Euro V)
Power (Euro VI)
COMVEC (AMF Annex 49) final report October 2016
13 (105)
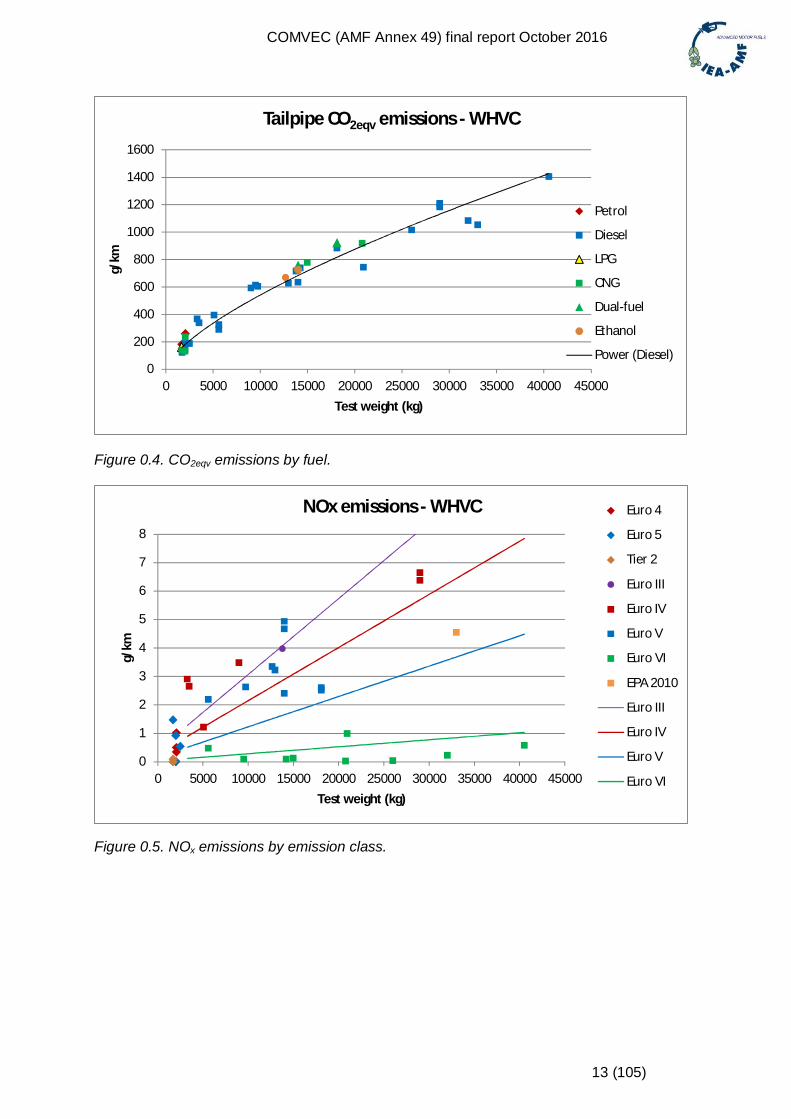
Figure 0.4. CO2eqv emissions by fuel.
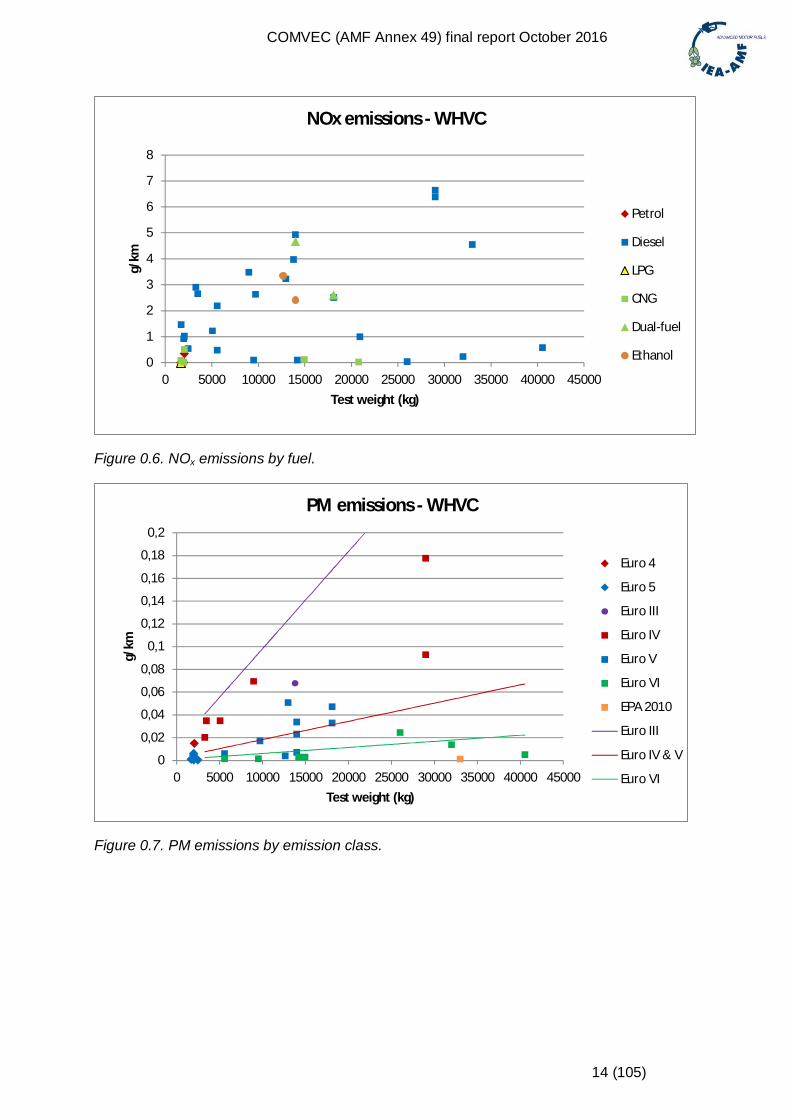
Figure 0.5. NOx emissions by emission class.
0
200
400
600
800
1000
1200
1400
1600
0 5000 10000 15000 20000 25000 30000 35000 40000 45000
g/km
Test weight (kg)
Tailpipe CO2eqv emissions - WHVC
Petrol
Diesel
LPG
CNG
Dual-fuel
Ethanol
Power (Diesel)
0
1
2
3
4
5
6
7
8
0 5000 10000 15000 20000 25000 30000 35000 40000 45000
g/km
Test weight (kg)
NOx emissions - WHVC Euro 4
Euro 5
Tier 2
Euro III
Euro IV
Euro V
Euro VI
EPA 2010
Euro III
Euro IV
Euro V
Euro VI
COMVEC (AMF Annex 49) final report October 2016
14 (105)
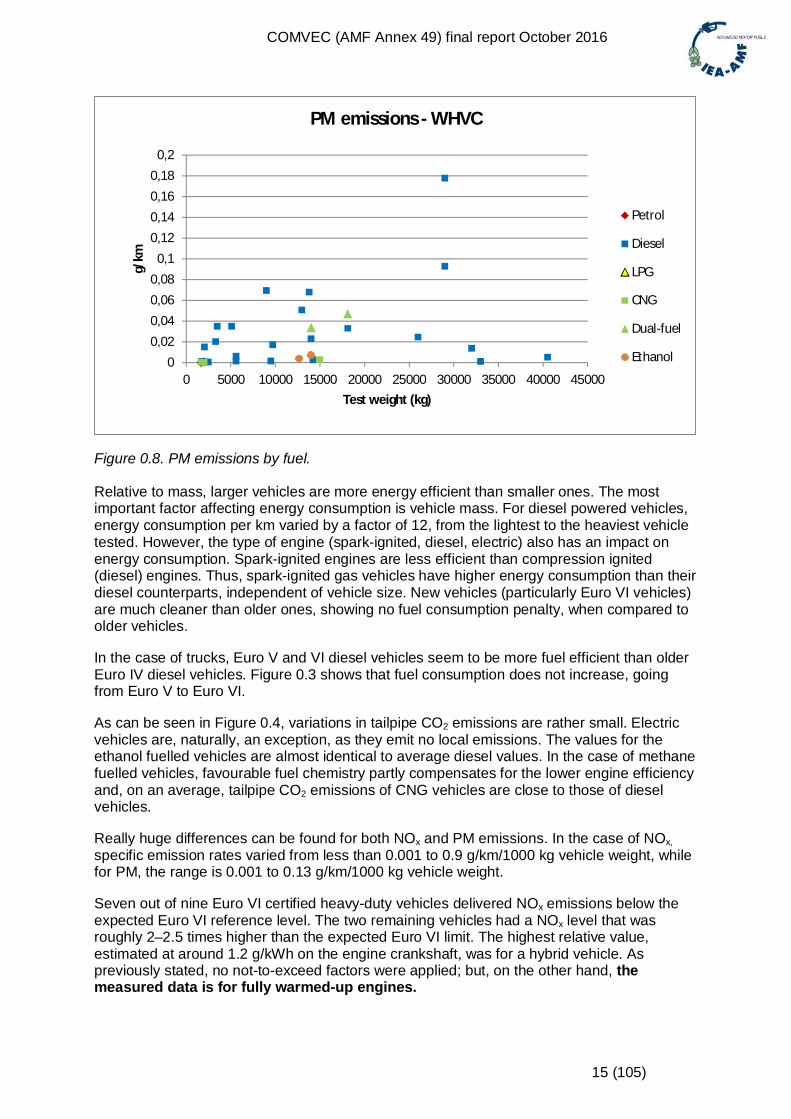
Figure 0.6. NOx emissions by fuel.
Figure 0.7. PM emissions by emission class.
0
1
2
3
4
5
6
7
8
0 5000 10000 15000 20000 25000 30000 35000 40000 45000
g/km
Test weight (kg)
NOx emissions - WHVC
Petrol
Diesel
LPG
CNG
Dual-fuel
Ethanol
0
0,02
0,04
0,06
0,08
0,1
0,12
0,14
0,16
0,18
0,2
0 5000 10000 15000 20000 25000 30000 35000 40000 45000
g/km
Test weight (kg)
PM emissions - WHVC
Euro 4
Euro 5
Euro III
Euro IV
Euro V
Euro VI
EPA 2010
Euro III
Euro IV & V
Euro VI
COMVEC (AMF Annex 49) final report October 2016
15 (105)
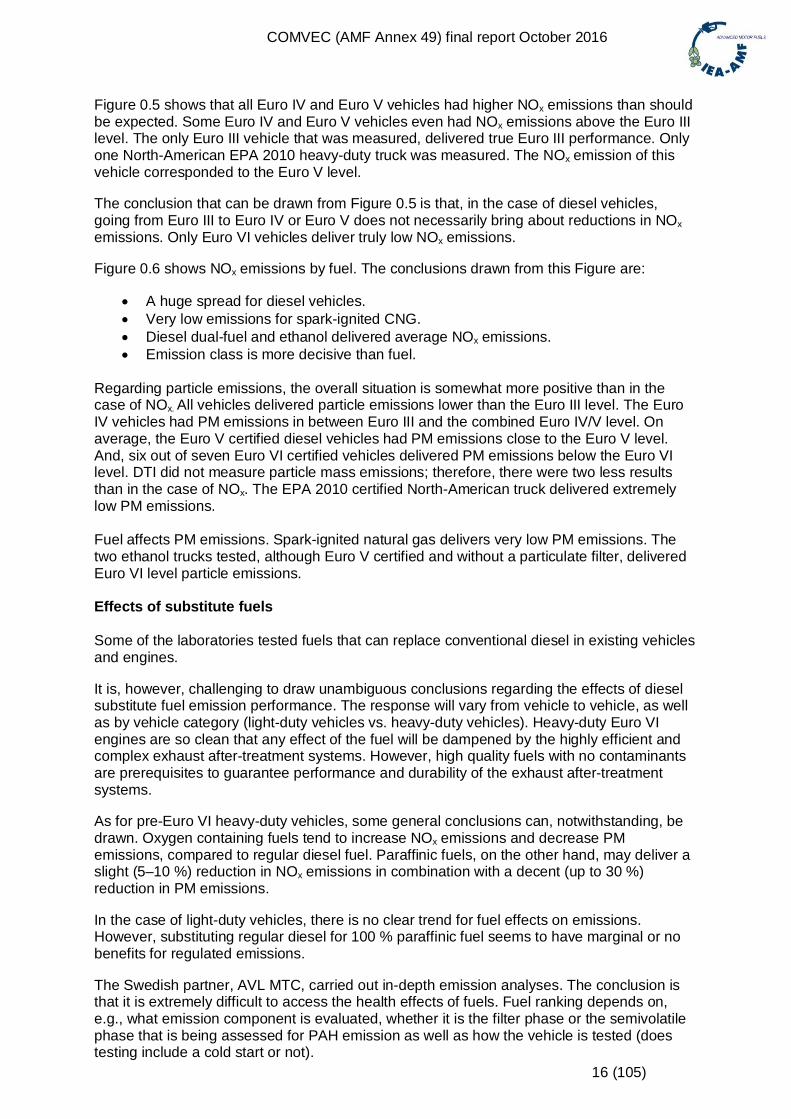
Figure 0.8. PM emissions by fuel.
Relative to mass, larger vehicles are more energy efficient than smaller ones. The mostimportant factor affecting energy consumption is vehicle mass. For diesel powered vehicles,energy consumption per km varied by a factor of 12, from the lightest to the heaviest vehicletested. However, the type of engine (spark-ignited, diesel, electric) also has an impact onenergy consumption. Spark-ignited engines are less efficient than compression ignited(diesel) engines. Thus, spark-ignited gas vehicles have higher energy consumption than theirdiesel counterparts, independent of vehicle size. New vehicles (particularly Euro VI vehicles)are much cleaner than older ones, showing no fuel consumption penalty, when compared toolder vehicles.
In the case of trucks, Euro V and VI diesel vehicles seem to be more fuel efficient than olderEuro IV diesel vehicles. Figure 0.3 shows that fuel consumption does not increase, goingfrom Euro V to Euro VI.
As can be seen in Figure 0.4, variations in tailpipe CO2 emissions are rather small. Electricvehicles are, naturally, an exception, as they emit no local emissions. The values for theethanol fuelled vehicles are almost identical to average diesel values. In the case of methanefuelled vehicles, favourable fuel chemistry partly compensates for the lower engine efficiencyand, on an average, tailpipe CO2 emissions of CNG vehicles are close to those of dieselvehicles.
Really huge differences can be found for both NOx and PM emissions. In the case of NOx,specific emission rates varied from less than 0.001 to 0.9 g/km/1000 kg vehicle weight, whilefor PM, the range is 0.001 to 0.13 g/km/1000 kg vehicle weight.
Seven out of nine Euro VI certified heavy-duty vehicles delivered NOx emissions below theexpected Euro VI reference level. The two remaining vehicles had a NOx level that wasroughly 2–2.5 times higher than the expected Euro VI limit. The highest relative value,estimated at around 1.2 g/kWh on the engine crankshaft, was for a hybrid vehicle. Aspreviously stated, no not-to-exceed factors were applied; but, on the other hand, themeasured data is for fully warmed-up engines.
00,020,040,060,08
0,10,120,140,160,18
0,2
0 5000 10000 15000 20000 25000 30000 35000 40000 45000
g/km
Test weight (kg)
PM emissions - WHVC
Petrol
Diesel
LPG
CNG
Dual-fuel
Ethanol
COMVEC (AMF Annex 49) final report October 2016
16 (105)
Figure 0.5 shows that all Euro IV and Euro V vehicles had higher NOx emissions than shouldbe expected. Some Euro IV and Euro V vehicles even had NOx emissions above the Euro IIIlevel. The only Euro III vehicle that was measured, delivered true Euro III performance. Onlyone North-American EPA 2010 heavy-duty truck was measured. The NOx emission of thisvehicle corresponded to the Euro V level.
The conclusion that can be drawn from Figure 0.5 is that, in the case of diesel vehicles,going from Euro III to Euro IV or Euro V does not necessarily bring about reductions in NOxemissions. Only Euro VI vehicles deliver truly low NOx emissions.
Figure 0.6 shows NOx emissions by fuel. The conclusions drawn from this Figure are:
A huge spread for diesel vehicles. Very low emissions for spark-ignited CNG. Diesel dual-fuel and ethanol delivered average NOx emissions. Emission class is more decisive than fuel.
Regarding particle emissions, the overall situation is somewhat more positive than in thecase of NOx. All vehicles delivered particle emissions lower than the Euro III level. The EuroIV vehicles had PM emissions in between Euro III and the combined Euro IV/V level. Onaverage, the Euro V certified diesel vehicles had PM emissions close to the Euro V level.And, six out of seven Euro VI certified vehicles delivered PM emissions below the Euro VIlevel. DTI did not measure particle mass emissions; therefore, there were two less resultsthan in the case of NOx. The EPA 2010 certified North-American truck delivered extremelylow PM emissions.
Fuel affects PM emissions. Spark-ignited natural gas delivers very low PM emissions. Thetwo ethanol trucks tested, although Euro V certified and without a particulate filter, deliveredEuro VI level particle emissions.
Effects of substitute fuels
Some of the laboratories tested fuels that can replace conventional diesel in existing vehiclesand engines.
It is, however, challenging to draw unambiguous conclusions regarding the effects of dieselsubstitute fuel emission performance. The response will vary from vehicle to vehicle, as wellas by vehicle category (light-duty vehicles vs. heavy-duty vehicles). Heavy-duty Euro VIengines are so clean that any effect of the fuel will be dampened by the highly efficient andcomplex exhaust after-treatment systems. However, high quality fuels with no contaminantsare prerequisites to guarantee performance and durability of the exhaust after-treatmentsystems.
As for pre-Euro VI heavy-duty vehicles, some general conclusions can, notwithstanding, bedrawn. Oxygen containing fuels tend to increase NOx emissions and decrease PMemissions, compared to regular diesel fuel. Paraffinic fuels, on the other hand, may deliver aslight (5–10 %) reduction in NOx emissions in combination with a decent (up to 30 %)reduction in PM emissions.
In the case of light-duty vehicles, there is no clear trend for fuel effects on emissions.However, substituting regular diesel for 100 % paraffinic fuel seems to have marginal or nobenefits for regulated emissions.
The Swedish partner, AVL MTC, carried out in-depth emission analyses. The conclusion isthat it is extremely difficult to access the health effects of fuels. Fuel ranking depends on,e.g., what emission component is evaluated, whether it is the filter phase or the semivolatilephase that is being assessed for PAH emission as well as how the vehicle is tested (doestesting include a cold start or not).
COMVEC (AMF Annex 49) final report October 2016
17 (105)
Going from old Euro I vehicles to Euro VI vehicles will reduce regulated emissions by morethan 95 %. It is clear that such a massive reduction in emissions from efficient exhaust after-treatment systems will erase most of the effects of fuel on exhaust emissions. However, inthe case of less sophisticated engines, a switch from conventional diesel fuel to chemicallysimple fuels, such as methane and paraffinic diesel, may still bring about emission benefits.
Full fuel cycle analysis
As previously mentioned, it was decided to use WTT data from the JEC - Joint ResearchCentre-EUCAR-CONCAWE collaboration on WTW.
The well-to-wheel evaluation is done for two vehicle categories:
Category 1 vehicles (vans, test weight approximately 2 000 kg) Category 2 vehicles (2-axle trucks, test weight approximately 14 000 kg)
The TTW data (energy consumption) is based on VTT’s measurements for COMVEC.
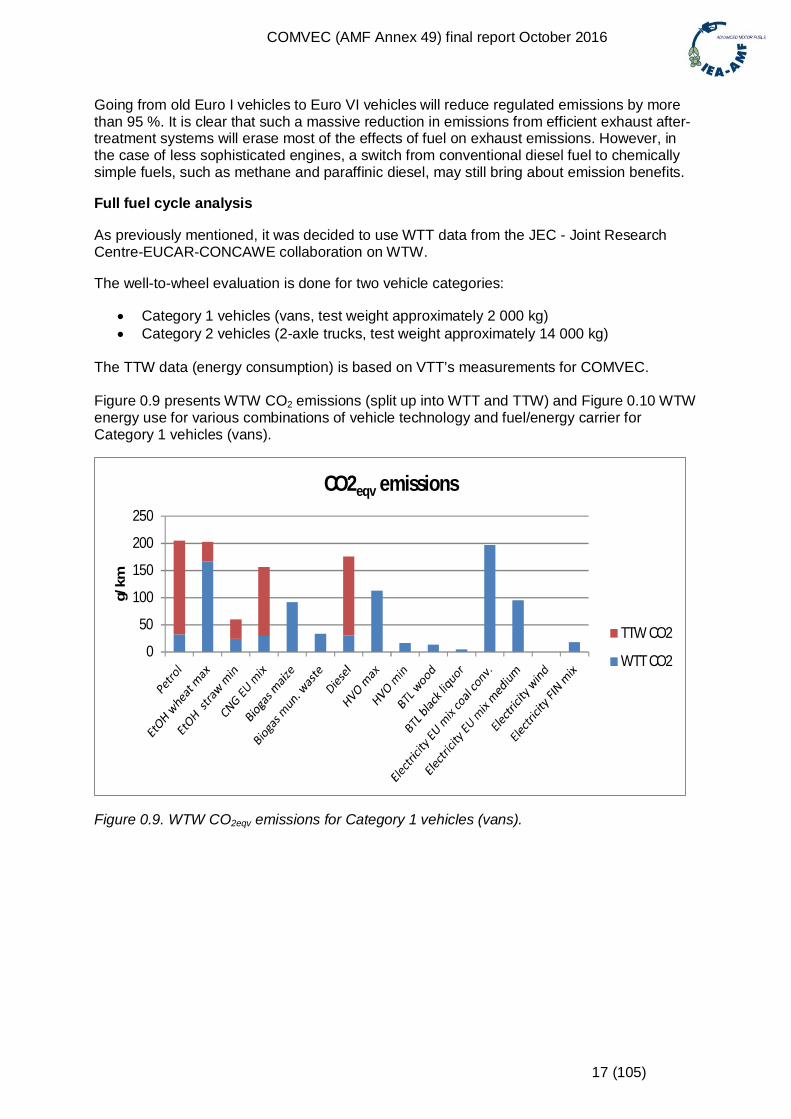
Figure 0.9 presents WTW CO2 emissions (split up into WTT and TTW) and Figure 0.10 WTWenergy use for various combinations of vehicle technology and fuel/energy carrier forCategory 1 vehicles (vans).
Figure 0.9. WTW CO2eqv emissions for Category 1 vehicles (vans).
0
50
100
150
200
250
g/km
CO2eqv emissions
TTW CO2
WTT CO2
COMVEC (AMF Annex 49) final report October 2016
18 (105)
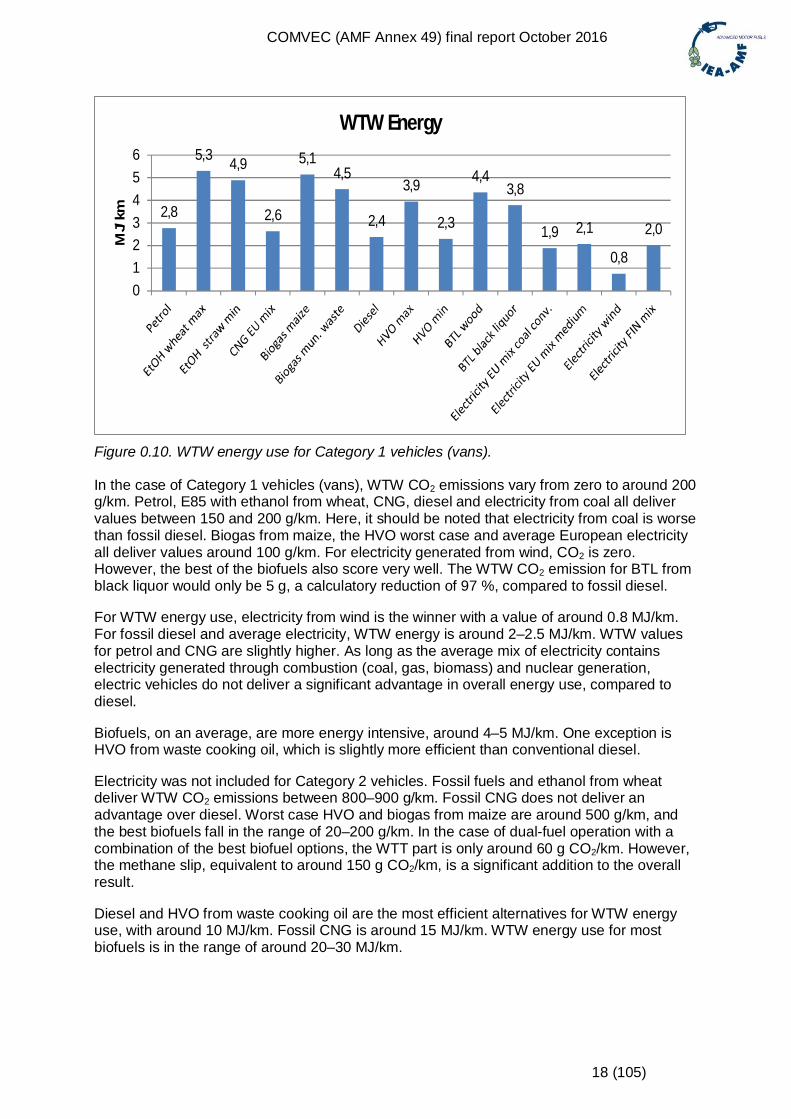
Figure 0.10. WTW energy use for Category 1 vehicles (vans).
In the case of Category 1 vehicles (vans), WTW CO2 emissions vary from zero to around 200g/km. Petrol, E85 with ethanol from wheat, CNG, diesel and electricity from coal all delivervalues between 150 and 200 g/km. Here, it should be noted that electricity from coal is worsethan fossil diesel. Biogas from maize, the HVO worst case and average European electricityall deliver values around 100 g/km. For electricity generated from wind, CO2 is zero.However, the best of the biofuels also score very well. The WTW CO2 emission for BTL fromblack liquor would only be 5 g, a calculatory reduction of 97 %, compared to fossil diesel.
For WTW energy use, electricity from wind is the winner with a value of around 0.8 MJ/km.For fossil diesel and average electricity, WTW energy is around 2–2.5 MJ/km. WTW valuesfor petrol and CNG are slightly higher. As long as the average mix of electricity containselectricity generated through combustion (coal, gas, biomass) and nuclear generation,electric vehicles do not deliver a significant advantage in overall energy use, compared todiesel.
Biofuels, on an average, are more energy intensive, around 4–5 MJ/km. One exception isHVO from waste cooking oil, which is slightly more efficient than conventional diesel.
Electricity was not included for Category 2 vehicles. Fossil fuels and ethanol from wheatdeliver WTW CO2 emissions between 800–900 g/km. Fossil CNG does not deliver anadvantage over diesel. Worst case HVO and biogas from maize are around 500 g/km, andthe best biofuels fall in the range of 20–200 g/km. In the case of dual-fuel operation with acombination of the best biofuel options, the WTT part is only around 60 g CO2/km. However,the methane slip, equivalent to around 150 g CO2/km, is a significant addition to the overallresult.
Diesel and HVO from waste cooking oil are the most efficient alternatives for WTW energyuse, with around 10 MJ/km. Fossil CNG is around 15 MJ/km. WTW energy use for mostbiofuels is in the range of around 20–30 MJ/km.
2,8
5,3 4,9
2,6
5,14,5
2,4
3,9
2,3
4,43,8
1,9 2,1
0,8
2,0
0123456
MJ/
kmWTW Energy
COMVEC (AMF Annex 49) final report October 2016
19 (105)
Several conclusions can be drawn:
Fossil CNG does not deliver significant advantages over diesel for WTW CO2 andenergy use.
Biofuels are, in general, more energy intensive than fossil fuels. Notwithstanding, the best biofuels can deliver significant reductions in WTW CO2
emissions. Renewable electricity (hydro, wind, photovoltaic) is the best option for WTW CO2
and energy use. The average European electricity for EVs is roughly equivalent to fossil diesel for
both WTW CO2 emissions and energy use.
Cost estimates for alternative technologies
In the previous Annex 37 on fuel and technology alternatives for buses, cost assessmentswere carried out. Crude oil prices, and consequently fuel prices, have been very low in 2016.Therefore, it was decided not to repeat the same kind of detailed cost assessments as thosethat were carried out in Annex 37. Moving towards the year 2030, with increasinglychallenging climate targets and increasing prices on CO2 emissions, will naturally improvethe competitiveness of low-carbon fuels dramatically.
For costs of alternative technologies, the report makes references to two recent studiesregarding the costs for CO2 abatement in road transport, one Finnish (VTT TechnicalResearch Centre of Finland Ltd & VATT Institute for Economic Research, 2015) and oneGerman study (Roland Berger, 2016). Both reports conclude that biofuels seem to be a cost-effective way of reducing CO2 emissions from road transport, relative to electric vehicles andfuel cell vehicles. Roland Berger found that fossil natural gas is not cost effective for CO2emission reductions. The COMVEC measurements show that spark-ignited heavy-dutyvehicles deliver tailpipe CO2 emissions equivalent to those of diesel vehicles.
Key messages
Going from Euro III to Euro IV or Euro V vehicles does not necessarily deliver realemission benefits, one should leapfrog directly to Euro VI or US 2010 regulations toobtain real-life low emissions.
o This has implications for those regions that are contemplating more stringentemission regulations, as well as for tendering of transport services.
o One should keep in mind that Euro VI vehicles require high-quality sulphur-free fuels (S > 15 ppm).
The regulated emissions of a vehicle are, first and foremost, determined by theemission control technology, not the fuel.
The response to substitute fuels (fuels that can replace conventional diesel in existingvehicles) varies from vehicle to vehicle, as well as by vehicle category (light-dutyvehicles vs. heavy-duty vehicles).
o Heavy-duty Euro VI engines are so clean that any effect of the fuel will bedampened by the highly efficient and complex exhaust after-treatmentsystems.
o Older vehicles, e.g. using paraffinic diesel, can deliver up to a 30 % reductionin regulated emissions, depending on the exhaust component.
The carbon intensity of the fuel or the energy carrier is decisive for well-to-wheel CO2emissions, not vehicle technology.
CO2 assessment should be carried out on a well-to-wheel basis, not only by lookingat tailpipe CO2 emissions.
Electrification, with low-carbon electricity, is a good option for local emissions as wellas WTW CO2 emissions.

COMVEC (AMF Annex 49) final report October 2016
20 (105)
o One should keep in mind that not all applications are suitable forelectrification.
Euro VI (alternatively US 2010) in combination with a renewable fuel is a good optionfor the local environment, as well as the climate.
Recent reports conclude that biofuels seem to be a cost-effective way of reducingCO2 emissions from road transport, relative to electric vehicles and fuel cell vehicles.
o Fossil natural gas is not a cost-effective option for reducing CO2 emissionsfrom heavy-duty vehicles.
COMVEC (AMF Annex 49) final report October 2016
21 (105)
1. Introduction
1.1 General
Within the IEA Technology Collaboration Programme (formerly Implementing Agreement) onAdvanced Motor Fuels (AMF, www.iea-amf.org), fuel and technology options for buses andpassenger cars have been evaluated in two previous projects (Annexes), namely:
Annex 37: Fuel and Technology Alternatives for Buses (http://www.iea-amf.org/app/webroot/files/file/Annex%20Reports/AMF_Annex_37.pdf)
Annex 43: Performance Evaluation of Passenger Car Fuel and Powerplant Options(http://www.iea-amf.org/content/projects/annexes/43)
Annex 37, which was carried out in cooperation with the IEA Bioenergy ImplementingAgreement, generated well-to-wheel assessment of various fuel alternatives for buses. Inpractise this meant assessing the upfront (well-to-tank) energy use and emissions of fuelsusing Canadian, European and U.S. methodology, and combining this data with actualmeasured vehicle data (tank-to-wheel) to produce overall well-to-wheel figures on emissionsand energy use.
As a follow-up to Annexes 37 and 43, some members of AMF took the decisions that alsocommercial vehicles, meaning vehicles from the van category all the way up to heavy-dutycombination vehicles, should be addressed.
In addition, two Annexes have looked at specific technologies:
Annex 38: Evaluation of Environmental Impact of Biodiesel Vehicles in Real TrafficConditions (http://www.iea-amf.org/app/webroot/files/file/Annex%20Reports/AMF_Annex_38-2.pdf)
Annex 39: Enhanced emission performance and fuel efficiency for HD methaneengines (http://www.iea-amf.org/app/webroot/files/file/Annex%20Reports/AMF_Annex_39-2.pdf)
1.2 Vehicle categories and their share of transport energy
In Europe, road vehicles are split up into four main classes according to Table 1.1. Vehiclesfor the carriage of goods are again split into three main classes, basically light commercialvehicles (vans), medium-duty trucks and heavy-duty trucks (Table 1.2). Heavy-duty truckscan then be split up into single unit trucks and trucks with trailers. Globally the most commoncombined goods vehicle is a semi-trailer truck. Finland and Sweden are characterised by ahigh share of trucks with full trailers and high total weight, in Finland up to 76 metric tonnes.
In Asia, three-wheelers are quite common both in passenger and goods transport, but thesevehicles are not covered in this report.
COMVEC (AMF Annex 49) final report October 2016
22 (105)
Table 1.1. Main categories of road vehicles according to EU definitions.http://www.transportpolicy.net/index.php?title=EU:_Vehicle_Definitions
Table 1.2. Main categories of Category N road vehicles according to EU definitions.http://www.transportpolicy.net/index.php?title=EU:_Vehicle_Definitions
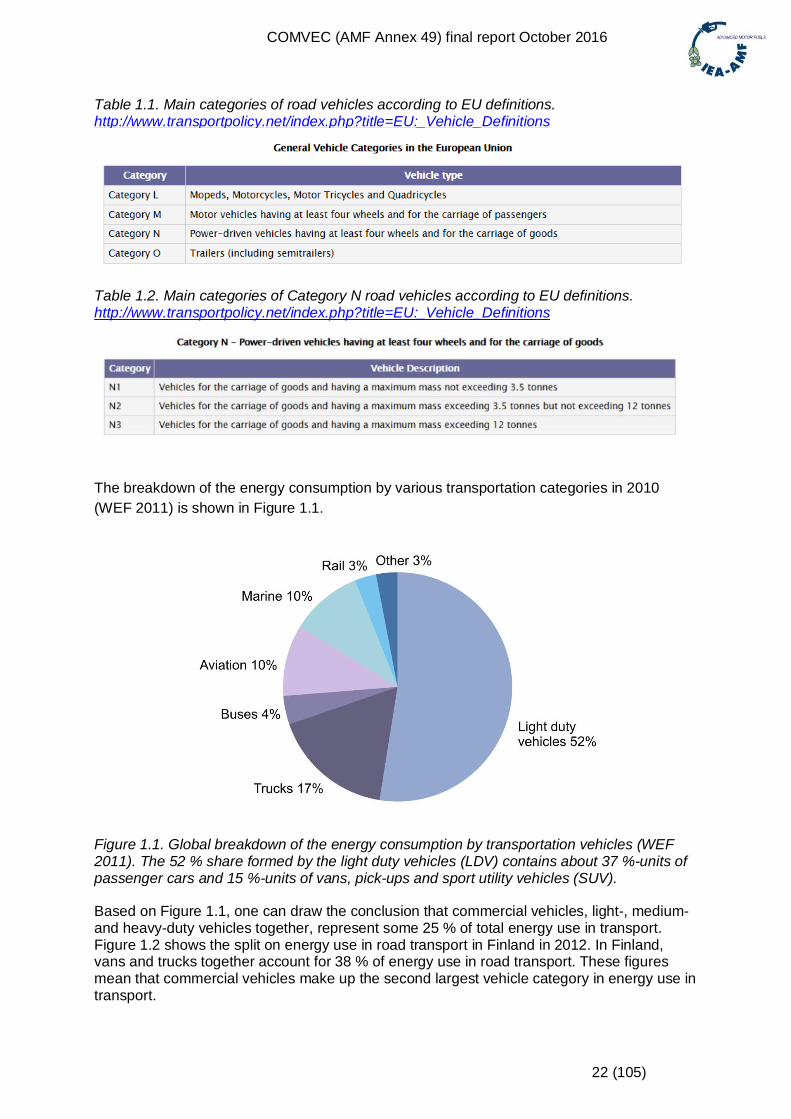
The breakdown of the energy consumption by various transportation categories in 2010(WEF 2011) is shown in Figure 1.1.
Figure 1.1. Global breakdown of the energy consumption by transportation vehicles (WEF2011). The 52 % share formed by the light duty vehicles (LDV) contains about 37 %-units ofpassenger cars and 15 %-units of vans, pick-ups and sport utility vehicles (SUV).
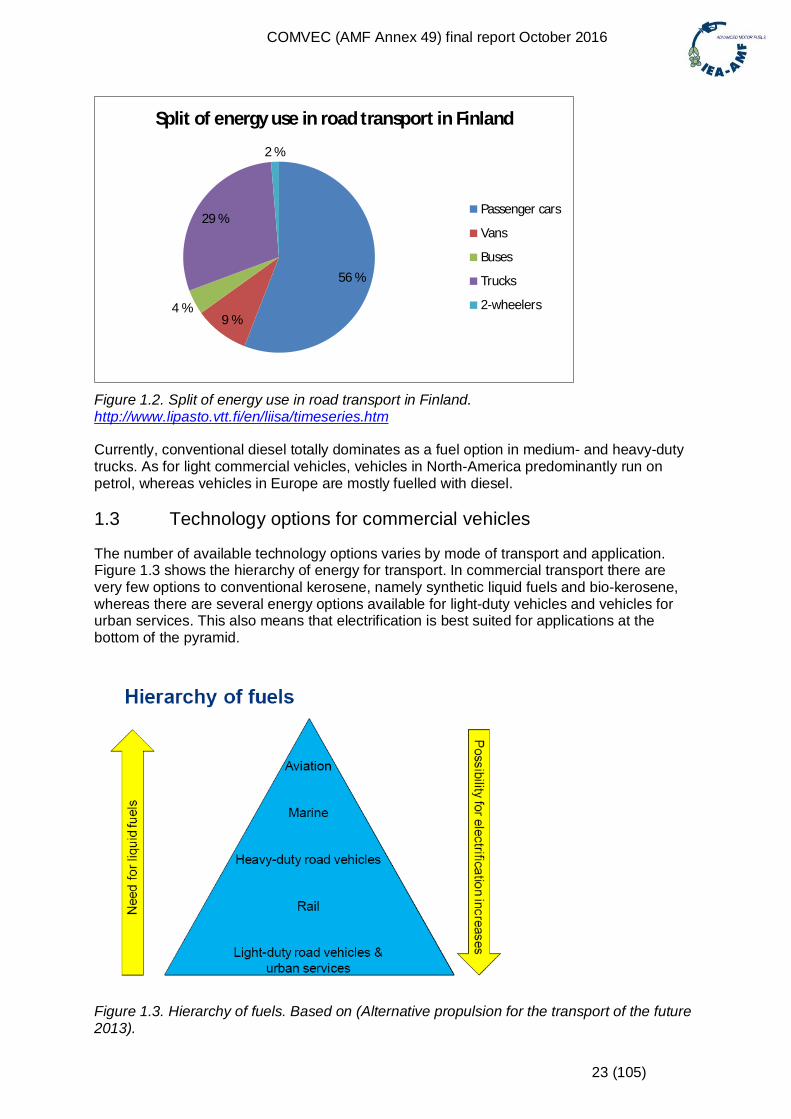
Based on Figure 1.1, one can draw the conclusion that commercial vehicles, light-, medium-and heavy-duty vehicles together, represent some 25 % of total energy use in transport.Figure 1.2 shows the split on energy use in road transport in Finland in 2012. In Finland,vans and trucks together account for 38 % of energy use in road transport. These figuresmean that commercial vehicles make up the second largest vehicle category in energy use intransport.
COMVEC (AMF Annex 49) final report October 2016
23 (105)
Figure 1.2. Split of energy use in road transport in Finland.http://www.lipasto.vtt.fi/en/liisa/timeseries.htm
Currently, conventional diesel totally dominates as a fuel option in medium- and heavy-dutytrucks. As for light commercial vehicles, vehicles in North-America predominantly run onpetrol, whereas vehicles in Europe are mostly fuelled with diesel.
1.3 Technology options for commercial vehicles
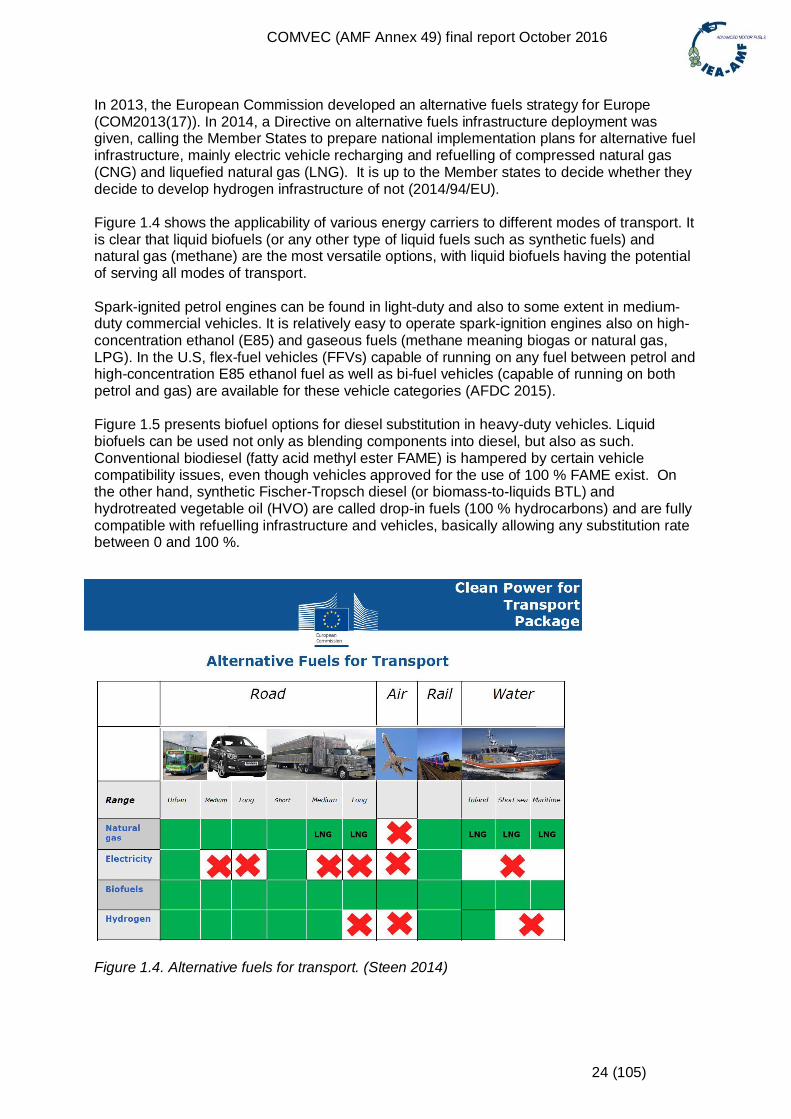
The number of available technology options varies by mode of transport and application.Figure 1.3 shows the hierarchy of energy for transport. In commercial transport there arevery few options to conventional kerosene, namely synthetic liquid fuels and bio-kerosene,whereas there are several energy options available for light-duty vehicles and vehicles forurban services. This also means that electrification is best suited for applications at thebottom of the pyramid.
Figure 1.3. Hierarchy of fuels. Based on (Alternative propulsion for the transport of the future2013).
56 %
9 %4 %
29 %
2 %
Split of energy use in road transport in Finland
Passenger cars
Vans
Buses
Trucks
2-wheelers
COMVEC (AMF Annex 49) final report October 2016
24 (105)
In 2013, the European Commission developed an alternative fuels strategy for Europe(COM2013(17)). In 2014, a Directive on alternative fuels infrastructure deployment wasgiven, calling the Member States to prepare national implementation plans for alternative fuelinfrastructure, mainly electric vehicle recharging and refuelling of compressed natural gas(CNG) and liquefied natural gas (LNG). It is up to the Member states to decide whether theydecide to develop hydrogen infrastructure of not (2014/94/EU).
Figure 1.4 shows the applicability of various energy carriers to different modes of transport. Itis clear that liquid biofuels (or any other type of liquid fuels such as synthetic fuels) andnatural gas (methane) are the most versatile options, with liquid biofuels having the potentialof serving all modes of transport.
Spark-ignited petrol engines can be found in light-duty and also to some extent in medium-duty commercial vehicles. It is relatively easy to operate spark-ignition engines also on high-concentration ethanol (E85) and gaseous fuels (methane meaning biogas or natural gas,LPG). In the U.S, flex-fuel vehicles (FFVs) capable of running on any fuel between petrol andhigh-concentration E85 ethanol fuel as well as bi-fuel vehicles (capable of running on bothpetrol and gas) are available for these vehicle categories (AFDC 2015).
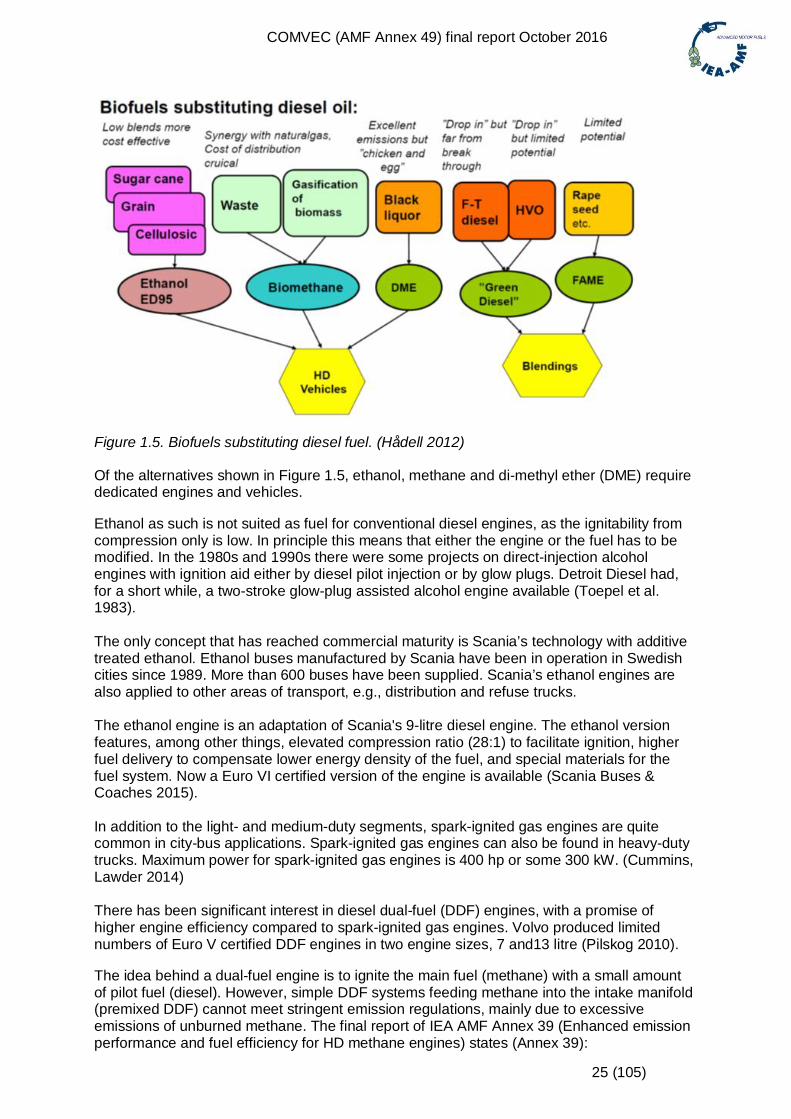
Figure 1.5 presents biofuel options for diesel substitution in heavy-duty vehicles. Liquidbiofuels can be used not only as blending components into diesel, but also as such.Conventional biodiesel (fatty acid methyl ester FAME) is hampered by certain vehiclecompatibility issues, even though vehicles approved for the use of 100 % FAME exist. Onthe other hand, synthetic Fischer-Tropsch diesel (or biomass-to-liquids BTL) andhydrotreated vegetable oil (HVO) are called drop-in fuels (100 % hydrocarbons) and are fullycompatible with refuelling infrastructure and vehicles, basically allowing any substitution ratebetween 0 and 100 %.
Figure 1.4. Alternative fuels for transport. (Steen 2014)
COMVEC (AMF Annex 49) final report October 2016
25 (105)
Figure 1.5. Biofuels substituting diesel fuel. (Hådell 2012)
Of the alternatives shown in Figure 1.5, ethanol, methane and di-methyl ether (DME) requirededicated engines and vehicles.
Ethanol as such is not suited as fuel for conventional diesel engines, as the ignitability fromcompression only is low. In principle this means that either the engine or the fuel has to bemodified. In the 1980s and 1990s there were some projects on direct-injection alcoholengines with ignition aid either by diesel pilot injection or by glow plugs. Detroit Diesel had,for a short while, a two-stroke glow-plug assisted alcohol engine available (Toepel et al.1983).
The only concept that has reached commercial maturity is Scania’s technology with additivetreated ethanol. Ethanol buses manufactured by Scania have been in operation in Swedishcities since 1989. More than 600 buses have been supplied. Scania’s ethanol engines arealso applied to other areas of transport, e.g., distribution and refuse trucks.
The ethanol engine is an adaptation of Scania's 9-litre diesel engine. The ethanol versionfeatures, among other things, elevated compression ratio (28:1) to facilitate ignition, higherfuel delivery to compensate lower energy density of the fuel, and special materials for thefuel system. Now a Euro VI certified version of the engine is available (Scania Buses &Coaches 2015).
In addition to the light- and medium-duty segments, spark-ignited gas engines are quitecommon in city-bus applications. Spark-ignited gas engines can also be found in heavy-dutytrucks. Maximum power for spark-ignited gas engines is 400 hp or some 300 kW. (Cummins,Lawder 2014)
There has been significant interest in diesel dual-fuel (DDF) engines, with a promise ofhigher engine efficiency compared to spark-ignited gas engines. Volvo produced limitednumbers of Euro V certified DDF engines in two engine sizes, 7 and13 litre (Pilskog 2010).
The idea behind a dual-fuel engine is to ignite the main fuel (methane) with a small amountof pilot fuel (diesel). However, simple DDF systems feeding methane into the intake manifold(premixed DDF) cannot meet stringent emission regulations, mainly due to excessiveemissions of unburned methane. The final report of IEA AMF Annex 39 (Enhanced emissionperformance and fuel efficiency for HD methane engines) states (Annex 39):
COMVEC (AMF Annex 49) final report October 2016
26 (105)
“It could be questioned whether dual fuel technology commercial available on the markettoday (January 2014) can reach emission requirements for Euro V and later emissionrequirements.”
Consequently, there are currently (December 2015) no Euro VI or US 2010 certified enginesavailable. However, there are simple retrofitted dual-fuel technologies on older engines whichdo not have to meet stringent emission regulations (so-called end-of-life engines).
Direct injection of pilot (diesel) fuel as well as main fuel (gas) has the promise to overcomethe problems with excessive emissions. At one point the Canadian technology companyWestport point provided a DDF engine with direct injection of gas. Westport called thistechnology HPDI (high-pressure direct injection). The engine was based on the 15-litreCummins ISX 15 engine, and the DDF version was claimed to provide equivalentperformance compared to the diesel. However, at the end of 2013 the Westport HPDI enginewas discontinued (Fleets & Fuels 2013). Afterwards it has been reported that Westport andVolvo Trucks are cooperating to bring the HPDI concept back on the market again (Fleets &Fuels 2015).
Di-methyl-ether (DME) is clean-burning and sulfur-free, with extremely low particulateemissions. DME resembles LPG in many ways. DME, however, has good ignition quality,and is therefore suited for diesel combustion. A dedicated DME vehicle might not require aparticulate filter but would need a purpose-designed fuel handling and injection system, aswell as a lubricating additive (Green Car Congress 2006).
Originally DME was used as a propellant for aerosols. DME is a rather difficult-to-use motorfuel because of the extremely low viscosity, low lubricity, and high volatility. For a dieselengine, special high-pressure injection systems with anti-leak systems have to be designed.Low lubricity and cavitation in various parts of the fuel system may also cause problems.
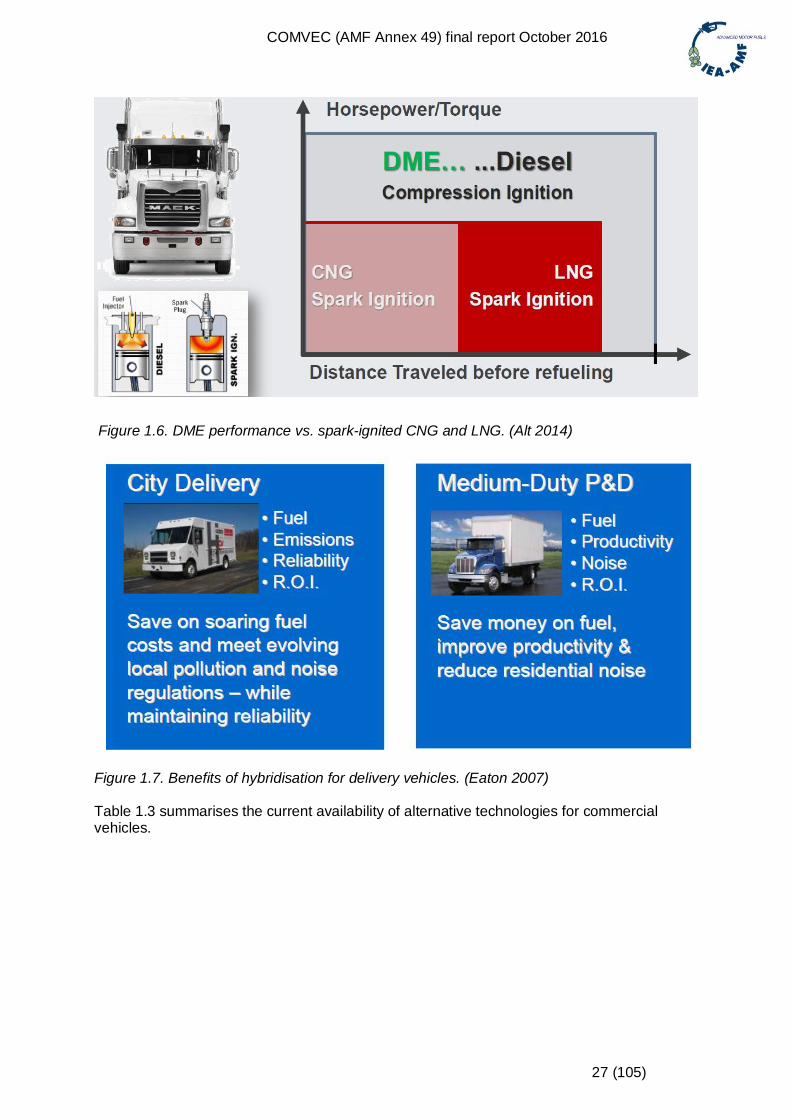
At least the following companies have been involved in the development of DME engines orequipment for DME engines: AVL (Austria), Denso, Nissan Diesel (UD Trucks), TNO(Holland), and Volvo. Now an ISO standard on DME for vehicle applications is in place(partly as a result of the activities of IEA AMF Annex 48 (Reconsideration of DME FuelSpecifications for Vehicles, operating agent AIST, Japan)). Volvo has repeatedly stated thatDME is its preferred alternative fuel. In 2013, Volvo announced its ambition to launch a DMEengine. With its DME development Volvo has been targeting especially the North-Americantruck market (Alt 2014). Figure 1.6 positions DME versus spark-ignition CNG and LNG withrespect to range and need for power/torque.
Hybrid systems are available for passenger cars and buses, as well as for commercialvehicles. However, supply for commercial vehicles is rather limited, focused on medium-dutytrucks and heavy-duty trucks without a trailer. Both electric and hydraulic hybrids have beenimplemented. Figure 1.7 shows the benefits of hybridisation for delivery vehicles.
There has been significant progress in electric vehicles over the past years. According toIEA, the world vehicle fleet at the end of 2014 was some 665 000 units. This is, however, stillonly 0.08 % of the total world vehicle fleet (EVI 2015). The focus of electric vehicles hasbeen on passenger cars and lately also on urban buses. As for commercial vehicles, withonly a few exceptions, the available electric vehicles are light-duty commercial vehicles, i.e.vans.
The focus in fuel cells for vehicles is on passenger cars, buses and mobile machinery, notcommercial vehicles.
COMVEC (AMF Annex 49) final report October 2016
27 (105)
Figure 1.6. DME performance vs. spark-ignited CNG and LNG. (Alt 2014)
Figure 1.7. Benefits of hybridisation for delivery vehicles. (Eaton 2007)
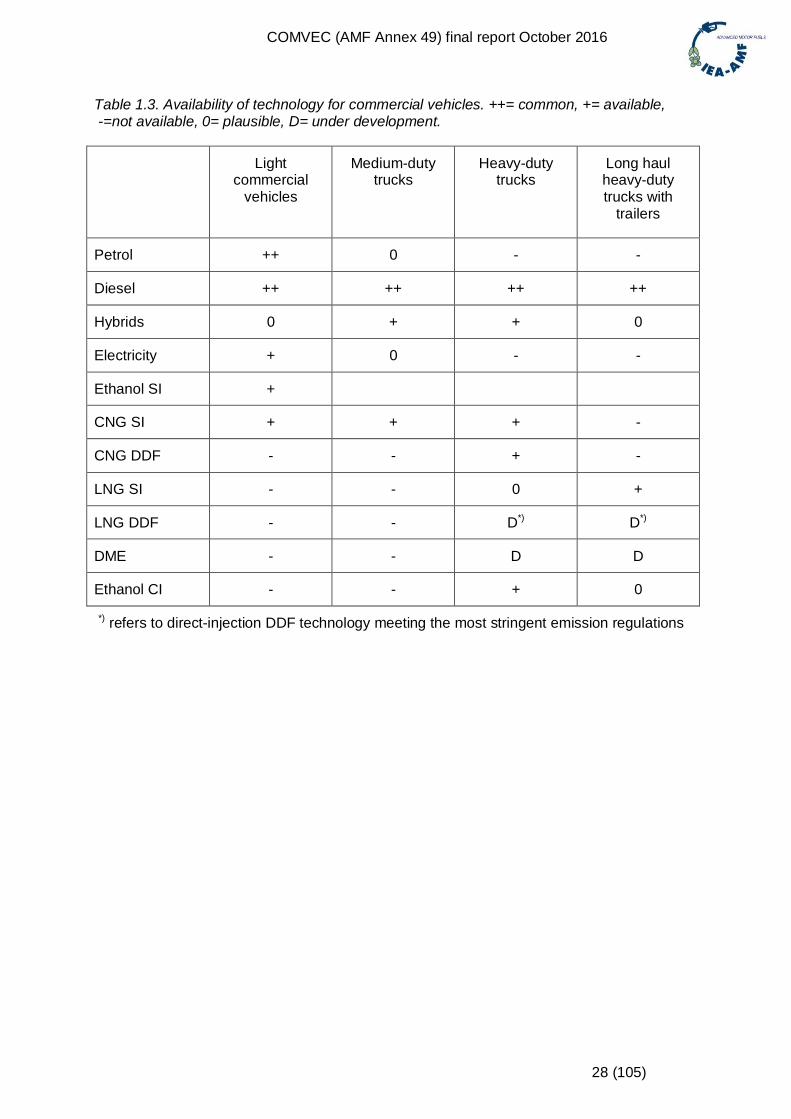
Table 1.3 summarises the current availability of alternative technologies for commercialvehicles.
COMVEC (AMF Annex 49) final report October 2016
28 (105)
Table 1.3. Availability of technology for commercial vehicles. ++= common, += available, -=not available, 0= plausible, D= under development.
Lightcommercial
vehicles
Medium-dutytrucks
Heavy-dutytrucks
Long haulheavy-dutytrucks with
trailers
Petrol ++ 0 - -
Diesel ++ ++ ++ ++
Hybrids 0 + + 0
Electricity + 0 - -
Ethanol SI +
CNG SI + + + -
CNG DDF - - + -
LNG SI - - 0 +
LNG DDF - - D*) D*)
DME - - D D
Ethanol CI - - + 0
*) refers to direct-injection DDF technology meeting the most stringent emission regulations
COMVEC (AMF Annex 49) final report October 2016
29 (105)
2. Goal
The goals of the “COMVEC” were twofold:
3. To agree upon common test procedures for testing and comparing different types ofcommercial vehicles. As far as possible, the common methodology shall then beapplied by the laboratories contributing test data for COMVEC.
4. Generate performance data specific to commercial vehicles (goods vehicles), thusadding to the information on alternative fuels and vehicle technologies generated inprevious AMF activities (Annex 37 on buses, Annexes 38 and 39 on trucks, Annex 43on passenger cars).
With data covering all road vehicle classes it will eventually be possible to evaluate best fit ofalternative fuels and new vehicle technologies road transport, meaning that alternativetechnologies can be allocated in the most effective way.
COMVEC (AMF Annex 49) final report October 2016
30 (105)
3. Partners and sponsors
The COMVEC project was set up as a task shared activity within IEA AMF. Task sharingmeans that all participating countries covered their own costs for participating andcontributing to the project.
VTT Technical Research Centre of Finland Ltd, with the support from Tekes – the FinnishFunding Agency for Innovation, acted as Operating Agent for the project. The COMVECproject also received support from national Finnish projects, i.e. a project called “Pilot studyof 2nd generation biofuels for transport (BioPilot)”, and the continuous activity to generateexhaust emission and fuel consumption data for commercial vehicles, supported by theFinnish Transport Safety Agency (Trafi). The partners in the “BioPilot” project include City ofHelsinki and Posti (the Finnish postal service) as vehicle operators and the energycompanies Gasum, Neste, St1 and UPM.
The other partners in COMVEC were:
Canada, through Environment and Climate Change Canada (ECCC), TransportCanada’s ecoTECHNOLOGY for Vehicles Program (eTV) and Natural ResourcesCanada’s Program of Energy Research and Development (PERD) Advanced Fuelsand Technologies for Emissions Reduction (AFTER 8)
Chile, through Centro Mario Molina Chile (CMMCh) China, through China Automotive Technology and Research Center (CATARC) Denmark, through Danish Technological Institute (DTI) Japan, through Organization for the promotion of low emission vehicles (LEVO) Korea, through Korea Institute of Energy Technology Evaluation and Planning
(KETEP) Sweden, through Swedish Transport Administration (STA) Thailand, through PTT Research and Technology Institute
Chile was not a member of AMF from the beginning, but joined AMF officially as ofNovember 2015.
The Norwegian Institute of Transport Economics (TØI) contributed to the project by coveringthe costs of measuring one natural gas truck at VTT.
The institutes that carried out measurements or provided data were:
Canada: Emissions Research and Measurement Section (ERMS) of ECCC Chile: Center for Control and Vehicle Certification (3CV), Ministry of Transport and
Telecommunications of Chile China: CATARC Denmark: DTI Finland: VTT Japan: National Traffic Safety and Environment Laboratory (NTSEL) Sweden: AVL MTC Thailand: PTT Research and Technology Institute
Korea Automotive Technology Institute (KATECH) provided general technical support to theproject.
COMVEC (AMF Annex 49) final report October 2016
31 (105)
4. Structure of the project
In the original plan of the project, in total eight work packages were listed:
WP 0: Collection and consolidation of the existing data WP 1: Development of common test procedures and protocols WP 2: Vehicle testing
o Three different vehicle categories including several alternative fuel and vehicletechnologies
o Parameters to be varied: fuel composition, driving cycle, payload (0, 50 and100 %), environmental conditions (ambient temperature)
WP 3: Aggregation of well-to-tank informationo based on test fuel matrix and information gathered in Annexes 37 and 43
WP 4: Regional information on transportation sectors energy optionso Information from project participants on regional challenges and opportunities
that drive the development of energy options in transportation sectors andaffects the available fuel selection. This regional information will also shedlight on various alternative technology options potential in different regions.
WP 5: Full fuel-cycle evaluation (integration of WP2 & WP3)o Well-to-wheel fuel consumption, energy efficiency and emissions
WP 6: Life-cycle cost analysiso How alternative fuel and vehicle technology, together with the operation of the
vehicle, influences life-cycle costs. The objective is to find a cost-effective wayto reduce emissions and energy consumption in a given vehicle use.
WP 7: Co-ordination of the project, synthesis and reportingo Administrative co-ordination, communication with the IEA AMF ExCo,
synthesis of the data, compilation of the Final Report and dissemination of theresults
However, during the course of the project some concessions to the scope of the work had tobe made. In the end it turned out that it was not possible to obtain coherent regionalinformation on transport energy and technology policies or on fuel and vehicle costs.Therefore the scope of the project changed and focused on three work packages, namely:
Development of common test procedures and protocols (WP1) Vehicle testing (WP2) Full fuel-cycle evaluation (WP5, integration of WP2 & WP3)
As for the test programme and testing parameters, most of the tests were carried out usingone specific test cycle, 50 % load and normal ambient temperature (25 +5 oC).
COMVEC (AMF Annex 49) final report October 2016
32 (105)
5. Methods
5.1 General
As in the case of Annex 37 on fuel and technology options for buses, Annex 49 oncommercial vehicles (COMVEC) combines well-to-tank (WTT) data and tank-to-wheel (TTW)data to form well-to-wheel (WTW) data on emissions and energy use.
5.2 Well-to-tank data
In Annex 37, three different methodologies to assess the WTT part, namely:
GREET (United States) GHGenius (Canada) Renewable Energy Directive (European Union)
For COMVEC, it was decided to use WTT data from the JEC - Joint Research Centre-EUCAR-CONCAWE collaboration on WTW1. The Joint Research Centre (JRC) is run by theEU Commission. EUCAR is the European Council for Automotive R&D2 and CONCAWE isthe platform for environmental research collaboration of the fuel refining industry3. With theparticipation of JRC, one could state that the JEC work is sanctioned by the EuropeanCommission.
The JEC reports contain data on fuel properties as well as detailed analysis of multiple fueland energy pathways. Included are fossil petrol and diesel, natural gas, a wide range ofbiofuels and also electricity. The most recent JEC WTW report (Version 4.a) is from February2014. The WTT part and its appendices were launched in March 2014:
WTT Report (Version 4.a) WTT Appendix 1 (Version 4.a) – Conversion factors and fuel properties WTT Appendix 2 (Version 4.a) – Summary of energy and GHG balance of individual
pathways WTT Appendix 4 (Version 4.a) – Description, results and input data per pathway
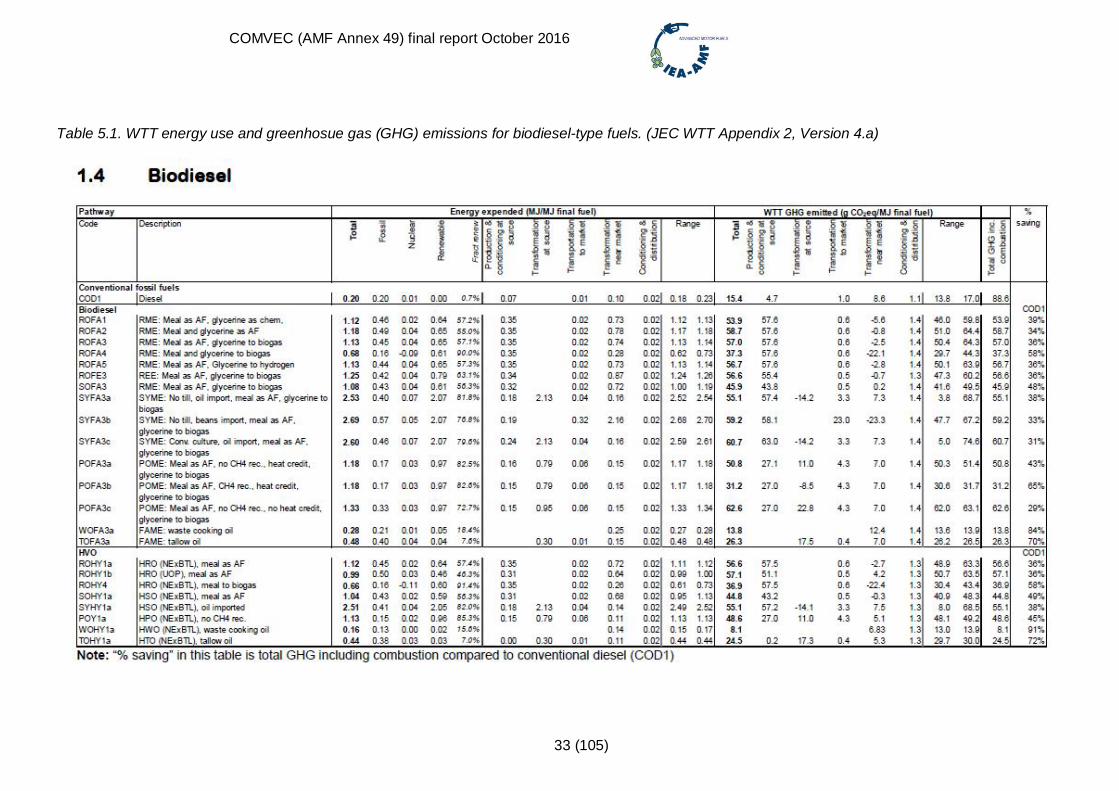
Table 5.1 presents an example of data found in WTT Appendix 2 (case biodiesel andhydrotreated vegetable oil (HVO)).
When needed, the TTW data generated by COMVEC can be combined with other, locallyavailable WTT data.
1 http://iet.jrc.ec.europa.eu/about-jec/downloads2 http://www.eucar.be/3 https://www.concawe.eu/
COMVEC (AMF Annex 49) final report October 2016
33 (105)
Table 5.1. WTT energy use and greenhosue gas (GHG) emissions for biodiesel-type fuels. (JEC WTT Appendix 2, Version 4.a)
COMVEC (AMF Annex 49) final report October 2016
34 (105)
5.3 Vehicle and engine measurements
The recommended test protocol for COMVEC (Appendix 1) was developed in cooperationbetween the Swedish Transport Administration and VTT within WP1. The basic idea was thatthe partners in COMVEC should use the common protocol to guarantee comparability of testresults.
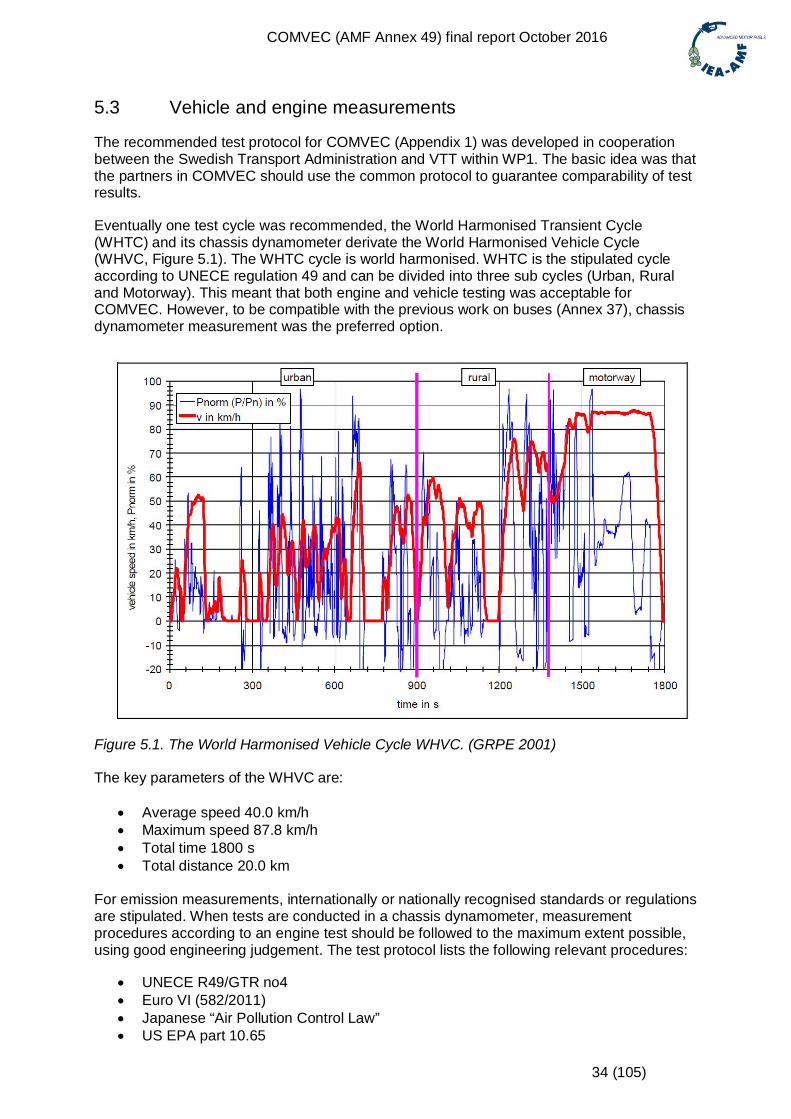
Eventually one test cycle was recommended, the World Harmonised Transient Cycle(WHTC) and its chassis dynamometer derivate the World Harmonised Vehicle Cycle(WHVC, Figure 5.1). The WHTC cycle is world harmonised. WHTC is the stipulated cycleaccording to UNECE regulation 49 and can be divided into three sub cycles (Urban, Ruraland Motorway). This meant that both engine and vehicle testing was acceptable forCOMVEC. However, to be compatible with the previous work on buses (Annex 37), chassisdynamometer measurement was the preferred option.
Figure 5.1. The World Harmonised Vehicle Cycle WHVC. (GRPE 2001)
The key parameters of the WHVC are:
Average speed 40.0 km/h Maximum speed 87.8 km/h Total time 1800 s Total distance 20.0 km
For emission measurements, internationally or nationally recognised standards or regulationsare stipulated. When tests are conducted in a chassis dynamometer, measurementprocedures according to an engine test should be followed to the maximum extent possible,using good engineering judgement. The test protocol lists the following relevant procedures:
UNECE R49/GTR no4 Euro VI (582/2011) Japanese “Air Pollution Control Law” US EPA part 10.65
COMVEC (AMF Annex 49) final report October 2016
35 (105)
SAE recommended practice, SAE J2711
In addition to defining the test cycle and analytical equipment, the test protocol speaks outon, e.g.:
Test temperature (25 ±5 °C) Preconditioning Test fuels Vehicle load Emission components to be reported Vehicle data to be reported
The recommended load was set at 50 % of full load. This was considered to representaverage load for commercial vehicles. The participants were free to add additional test cyclesand loads.
The test protocol was a recommendation, and the participants were not forced to follow itexactly. The individual participants are responsible for the quality and the relevance ofthe supplied data.
The Euro VI regulation stipulates measurements with both a cold and a warmed-up engine,and a system for calculation of aggregate emission values using weighting factors. However,the results presented in this report are for fully warmed-up engines and vehicles. TheCOMVEC test protocol stipulates a soak period of maximum 10 minutes betweenconditioning and actual testing.
5.4 Calculation of energy consumption
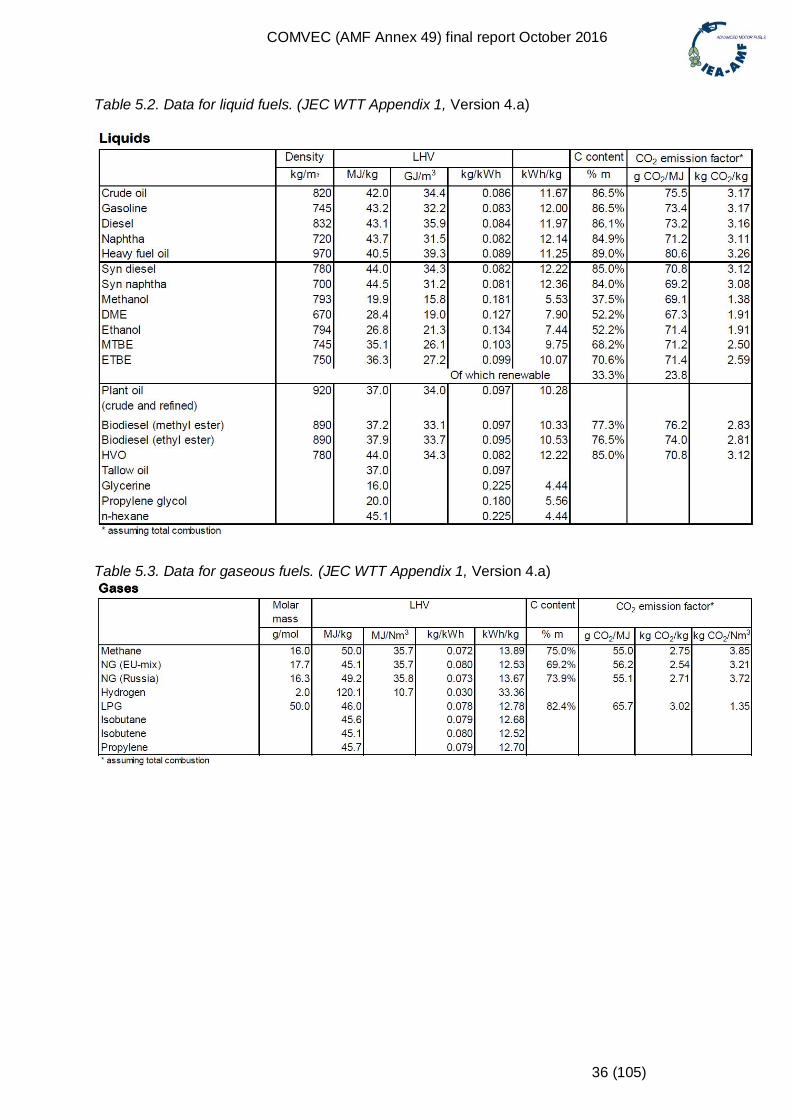
Some partners reported values for energy consumption, some fuel consumption incombination with data for the test fuels (e.g. density and heating value) and some only fuelconsumption. In the cases where only fuel consumption was reported, fuel consumption wasconverted into energy consumption using heating values presented in the JEC WTW study.Tables 5.2 (liquid fuels) and 5.3 (gases) present heating values and CO2 emission factors forvarious fuels. Alternatively, energy consumption was calculated from measured CO2emissions and specific CO2 emissions. LNG was considered to be pure methane.
COMVEC (AMF Annex 49) final report October 2016
36 (105)
Table 5.2. Data for liquid fuels. (JEC WTT Appendix 1, Version 4.a)
Table 5.3. Data for gaseous fuels. (JEC WTT Appendix 1, Version 4.a)
COMVEC (AMF Annex 49) final report October 2016
37 (105)
6. Test program - vehicle and engine tests
6.1 General
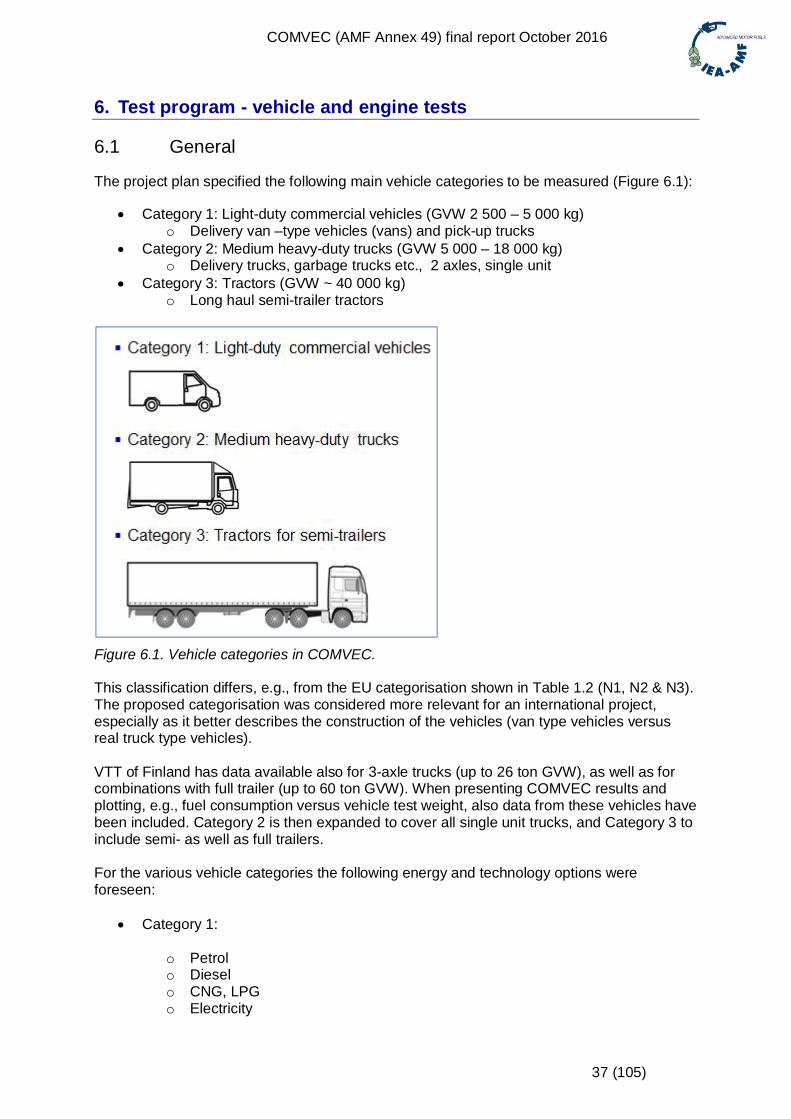
The project plan specified the following main vehicle categories to be measured (Figure 6.1):
Category 1: Light-duty commercial vehicles (GVW 2 500 – 5 000 kg)o Delivery van –type vehicles (vans) and pick-up trucks
Category 2: Medium heavy-duty trucks (GVW 5 000 – 18 000 kg)o Delivery trucks, garbage trucks etc., 2 axles, single unit
Category 3: Tractors (GVW ~ 40 000 kg)o Long haul semi-trailer tractors
Figure 6.1. Vehicle categories in COMVEC.
This classification differs, e.g., from the EU categorisation shown in Table 1.2 (N1, N2 & N3).The proposed categorisation was considered more relevant for an international project,especially as it better describes the construction of the vehicles (van type vehicles versusreal truck type vehicles).
VTT of Finland has data available also for 3-axle trucks (up to 26 ton GVW), as well as forcombinations with full trailer (up to 60 ton GVW). When presenting COMVEC results andplotting, e.g., fuel consumption versus vehicle test weight, also data from these vehicles havebeen included. Category 2 is then expanded to cover all single unit trucks, and Category 3 toinclude semi- as well as full trailers.
For the various vehicle categories the following energy and technology options wereforeseen:
Category 1:
o Petrolo Dieselo CNG, LPGo Electricity
COMVEC (AMF Annex 49) final report October 2016
38 (105)
Category 2:
o Dieselo CNG (spark-ignited and dual-fuel)o Compression-ignited ethanol (Scania’s concept)o Hybrid powertrain
Category 3:
o Dieselo LNG (dual-fuel and HPDI)o DME
Drop-in type alternative diesel fuels (e.g. natural gas based GTL or HVO) can substituteconventional diesel in all vehicle categories without any modifications to the vehicle fleet.
6.2 Overview of vehicles and engines measured by the projectpartners
6.2.1 General
The partners of COMVEC represent four different continents (Asia, Europe, North America,South America). Consequently, the vehicles and engines measured for COMVEC representa variety of technologies and emission certification classes.
Some partners also provided test data on multiple fuels for individual vehicles. In somecases, the partners added additional test cycles and multiple loads (the test protocol definedbaseline as the WHVC cycle at 50 % load).
In addition, some partners also provided performance data on buses. However, althoughtrucks and buses to some extent use similar power trains, it was eventually decided thatCOMVEC will report on commercial vehicles only, and no results for buses were included.
All in all the partners made data available from 35 different vehicles and three differenttestbed engines.
The following paragraphs present a short summary of the contributions from the COMVECpartners. Appendix 2 presents key technical data for the tested vehicles and engines.
It was not possible to include HPDI LNG vehicles or DME vehicles in the testing forCOMVEC. Data on HPDI LNG can be found in the final report of IEA AMF Annex 39 and onDME in the final report of IEA AMF Annex 37.
6.2.2 Canada
ERMS provided chassis dynamometer data:
Four Category 1 vehicleso One vehicle platform, petrol, bi-fuel CNG, bi-fuel LPG, electric
One Category 3 diesel vehicle
ERMS tested the vehicles using multiple cycles, and in addition, the Category 1vehicles atmultiple temperatures and the Category 3 vehicle on two loads.
COMVEC (AMF Annex 49) final report October 2016
39 (105)
6.2.3 Chile
CMM provided chassis dynamometer data:
One Category 1 diesel vehicle One Category 2 diesel vehicle One Category 3 diesel vehicle
6.2.4 China
CATARC provided chassis dynamometer data:
One Category 1 diesel vehicle One Category 2 diesel vehicle Two Category 3 diesel vehicles
CATARC also provided data for three natural gas buses, but this data is not included in thisreport.
6.2.5 Denmark
DTI provided chassis dynamometer data:
One Category 2 diesel vehicle One Category 2 CNG vehicle
DTI conducted the testing using multiple driving cycles. In addition DTI provided data on onediesel bus and two natural gas buses, but again, bus data was not included.
6.2.6 Finland
VTT provided chassis dynamometer data:
Five Category 1 vehicleso Three vehicle platforms, petrol, diesel, bi-fuel CNG, electric
Nine Category 2 vehicleso Including diesel, diesel-hybrid, CNG, dual-fuel CNG, ethanol
Three Category 3 diesel vehicles
VTT tested one dual-fuel CNG truck with several pilot fuels (different diesel qualities).
6.2.7 Japan
NTSEL provided engine dynamometer data:
One diesel engine for Category 2 trucks
NTSEL ran the engine on three different fuels.
6.2.8 Sweden
AVL MTC provided chassis dynamometer data:
One Category 2 diesel truck One Category 2 ethanol truck
AVL MTC ran the diesel vehicle on five different fuels.

COMVEC (AMF Annex 49) final report October 2016
40 (105)
6.2.9 Thailand
PTT provided chassis dynamometer data:
Two Category 1 vehicles
o One vehicle platform, bi-fuel CNG and diesel
PTT also provided data from engine testing, from one diesel and one natural gas engine, butthis data was not included in this report, as the data could not be fully verified.
COMVEC (AMF Annex 49) final report October 2016
41 (105)
7. Results and discussion – vehicle tests
7.1 Presentation of results
The vehicle test results are presented in the following way:
Results from the individual partnerso Petrol, diesel, alternative fuel vehicleso Diesel vehicles tested on regular diesel fuel
Collated resultso Energy consumption and emissions versus vehicle test weighto Comparison of results from different laboratories
Fuel effectso Results from “drop-in” fuel substitution (various diesel alternatives, petrol with
varying ethanol content)
“Baseline” reporting for the vehicle testing entails regulated exhaust emissions and energyconsumption for the WHVC at 50 % load.
CO2 emissions are, in most cases, reported as direct tailpipe CO2 emissions only, withoutconsidering N2O or CH4. However, for methane vehicles, the figures presented include CH4.CH4 in included calculation of CO2eqv using a factor of 21 compared to CO2
4.
When presenting results, focus is on energy consumption, tailpipe CO2 emissions, NOxemissions and PM emissions.
7.2 Canada
7.2.1 General
Canada provided test results for four Category 1 vehicles (vans, GVW 2 270 kg, test weights1 700 – 1 900 kg,) and one Category 3 vehicle (GVW 36 000 kg, test weights 24 000 and33 000 kg), representing current emission regulations (Tier 2, EPA 2010).
7.2.2 Category 1
General
Four vans of the same vehicle platform (test weight some 1 700 kg for the ICE vehicles andsome 1 900 kg for the EV) were tested with the following fuels/propulsion systems:
Port Fuel Injection (PFI), petrol (Tier 2) Vapour Sequential Ignition (VSI) bi-fuel gasoline/LPG (propane), after-market
conversion Compressed Natural Gas (CNG) bi-fuel, after-market conversion Converted electric vehicle
Four test cycles were used representing city driving and cold-start (FTP-75), aggressive highspeed driving (US06), free flow highway driving (HWFCT), and the world harmonised vehiclecycle (WHVC). The most extensive testing was carried out using the FTP test cycle. Testswere performed at temperatures of 22°C, with select tests at -7oC and -18°C.
4 http://unfccc.int/ghg_data/items/3825.php
COMVEC (AMF Annex 49) final report October 2016
42 (105)
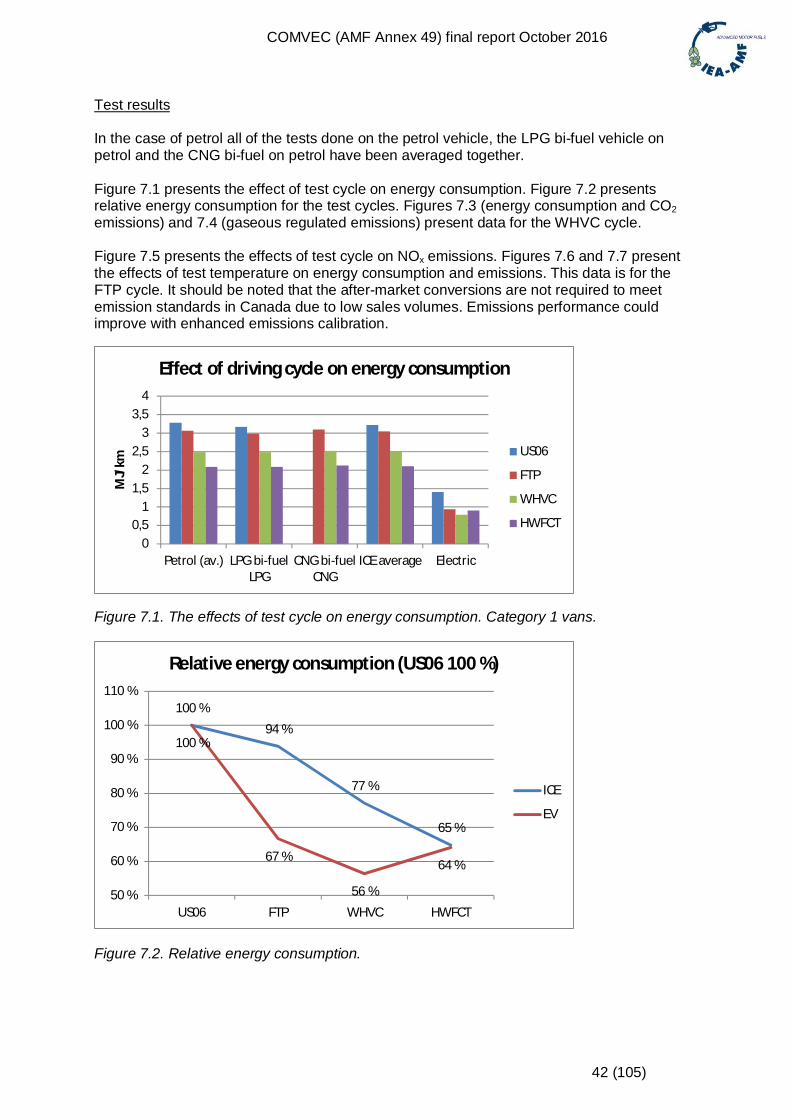
Test results
In the case of petrol all of the tests done on the petrol vehicle, the LPG bi-fuel vehicle onpetrol and the CNG bi-fuel on petrol have been averaged together.
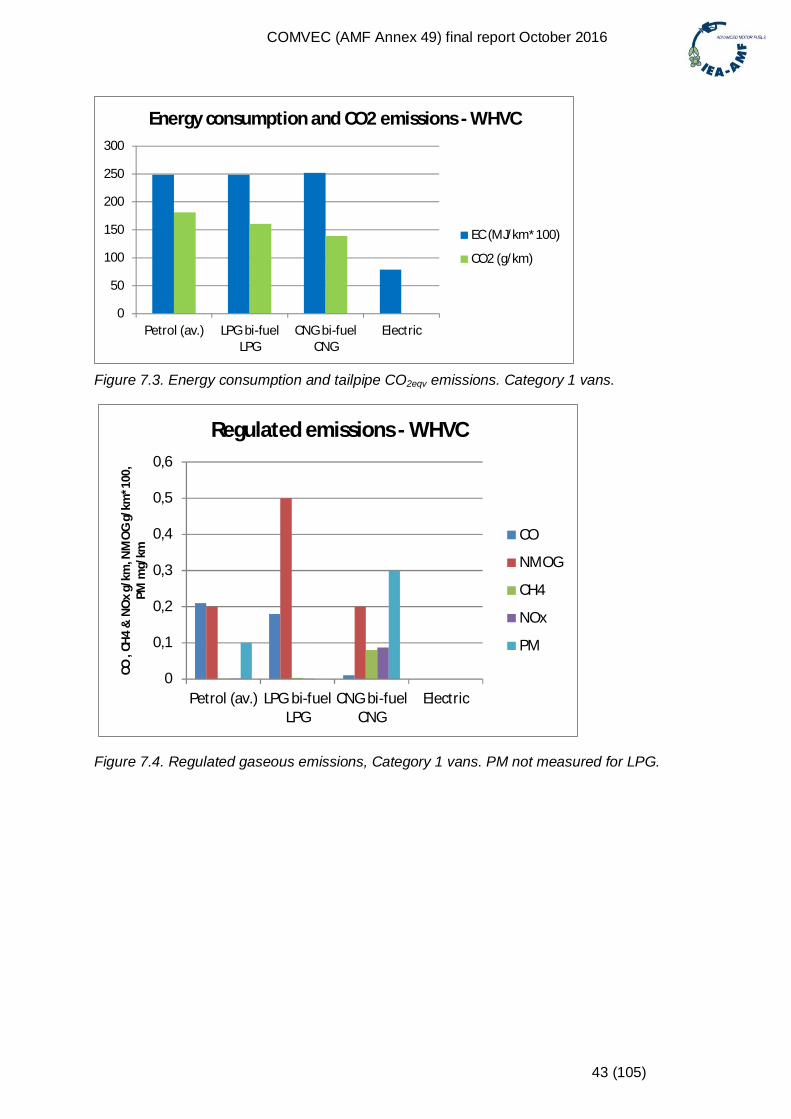
Figure 7.1 presents the effect of test cycle on energy consumption. Figure 7.2 presentsrelative energy consumption for the test cycles. Figures 7.3 (energy consumption and CO2emissions) and 7.4 (gaseous regulated emissions) present data for the WHVC cycle.
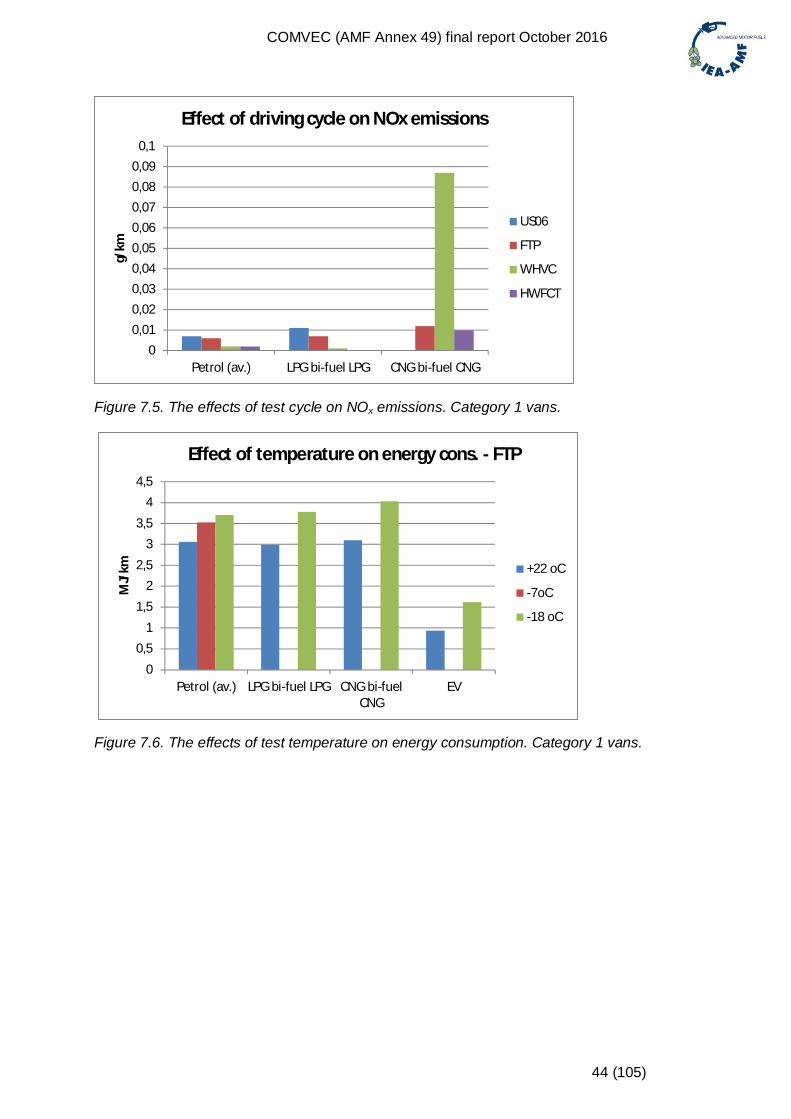
Figure 7.5 presents the effects of test cycle on NOx emissions. Figures 7.6 and 7.7 presentthe effects of test temperature on energy consumption and emissions. This data is for theFTP cycle. It should be noted that the after-market conversions are not required to meetemission standards in Canada due to low sales volumes. Emissions performance couldimprove with enhanced emissions calibration.
Figure 7.1. The effects of test cycle on energy consumption. Category 1 vans.
Figure 7.2. Relative energy consumption.
00,5
11,5
22,5
33,5
4
Petrol (av.) LPG bi-fuelLPG
CNG bi-fuelCNG
ICE average Electric
MJ/
km
Effect of driving cycle on energy consumption
US06
FTP
WHVC
HWFCT
100 %
94 %
77 %
65 %
100 %
67 %
56 %
64 %
50 %
60 %
70 %
80 %
90 %
100 %
110 %
US06 FTP WHVC HWFCT
Relative energy consumption (US06 100 %)
ICE
EV
COMVEC (AMF Annex 49) final report October 2016
43 (105)
Figure 7.3. Energy consumption and tailpipe CO2eqv emissions. Category 1 vans.
Figure 7.4. Regulated gaseous emissions, Category 1 vans. PM not measured for LPG.
0
50
100
150
200
250
300
Petrol (av.) LPG bi-fuelLPG
CNG bi-fuelCNG
Electric
Energy consumption and CO2 emissions - WHVC
EC (MJ/km*100)
CO2 (g/km)
0
0,1
0,2
0,3
0,4
0,5
0,6
Petrol (av.) LPG bi-fuelLPG
CNG bi-fuelCNG
Electric
CO,C
H4
&N
Ox
g/km
,NM
OG
g/km
*100
,PM
mg/
km
Regulated emissions - WHVC
CO
NMOG
CH4
NOx
PM
COMVEC (AMF Annex 49) final report October 2016
44 (105)
Figure 7.5. The effects of test cycle on NOx emissions. Category 1 vans.
Figure 7.6. The effects of test temperature on energy consumption. Category 1 vans.
00,010,020,030,040,050,060,070,080,09
0,1
Petrol (av.) LPG bi-fuel LPG CNG bi-fuel CNG
g/km
Effect of driving cycle on NOx emissions
US06
FTP
WHVC
HWFCT
0
0,51
1,52
2,5
33,5
44,5
Petrol (av.) LPG bi-fuel LPG CNG bi-fuelCNG
EV
MJ/
km
Effect of temperature on energy cons. - FTP
+22 oC
-7oC
-18 oC
COMVEC (AMF Annex 49) final report October 2016
45 (105)
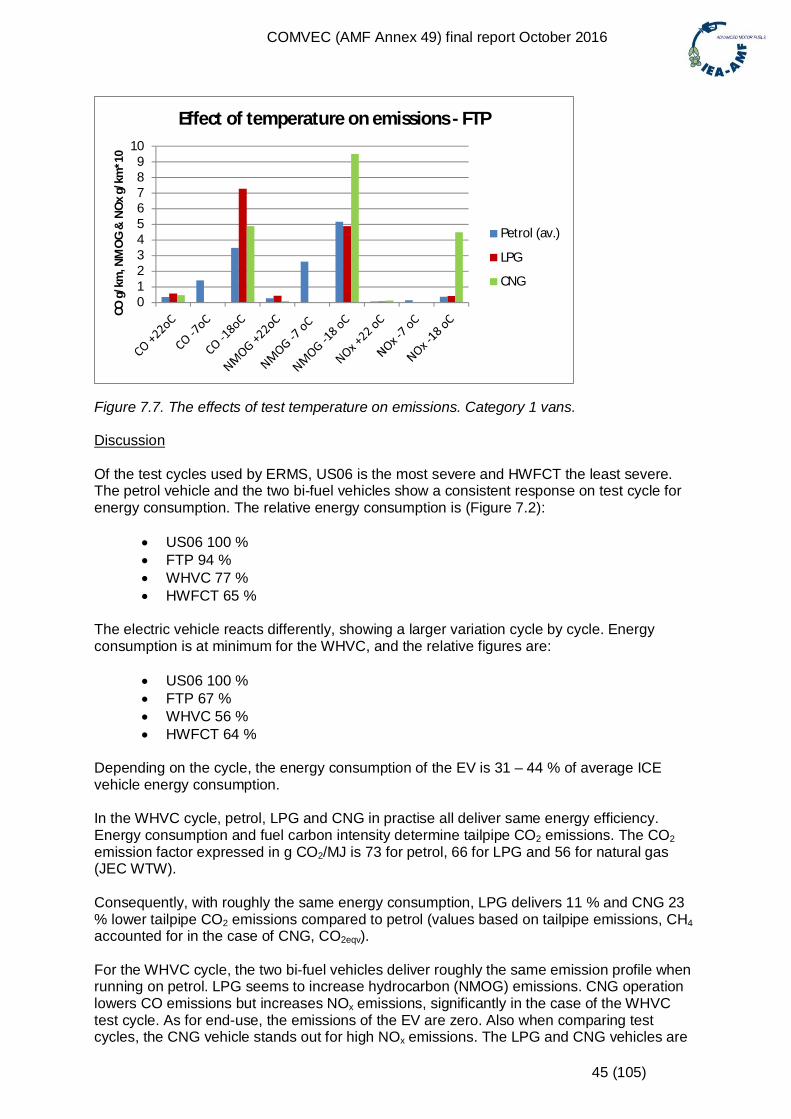
Figure 7.7. The effects of test temperature on emissions. Category 1 vans.
Discussion
Of the test cycles used by ERMS, US06 is the most severe and HWFCT the least severe.The petrol vehicle and the two bi-fuel vehicles show a consistent response on test cycle forenergy consumption. The relative energy consumption is (Figure 7.2):
US06 100 % FTP 94 % WHVC 77 % HWFCT 65 %
The electric vehicle reacts differently, showing a larger variation cycle by cycle. Energyconsumption is at minimum for the WHVC, and the relative figures are:
US06 100 % FTP 67 % WHVC 56 % HWFCT 64 %
Depending on the cycle, the energy consumption of the EV is 31 – 44 % of average ICEvehicle energy consumption.
In the WHVC cycle, petrol, LPG and CNG in practise all deliver same energy efficiency.Energy consumption and fuel carbon intensity determine tailpipe CO2 emissions. The CO2emission factor expressed in g CO2/MJ is 73 for petrol, 66 for LPG and 56 for natural gas(JEC WTW).
Consequently, with roughly the same energy consumption, LPG delivers 11 % and CNG 23% lower tailpipe CO2 emissions compared to petrol (values based on tailpipe emissions, CH4accounted for in the case of CNG, CO2eqv).
For the WHVC cycle, the two bi-fuel vehicles deliver roughly the same emission profile whenrunning on petrol. LPG seems to increase hydrocarbon (NMOG) emissions. CNG operationlowers CO emissions but increases NOx emissions, significantly in the case of the WHVCtest cycle. As for end-use, the emissions of the EV are zero. Also when comparing testcycles, the CNG vehicle stands out for high NOx emissions. The LPG and CNG vehicles are
0123456789
10
COg/
km,N
MO
G&
NO
xg/
km*1
0Effect of temperature on emissions - FTP
Petrol (av.)
LPG
CNG
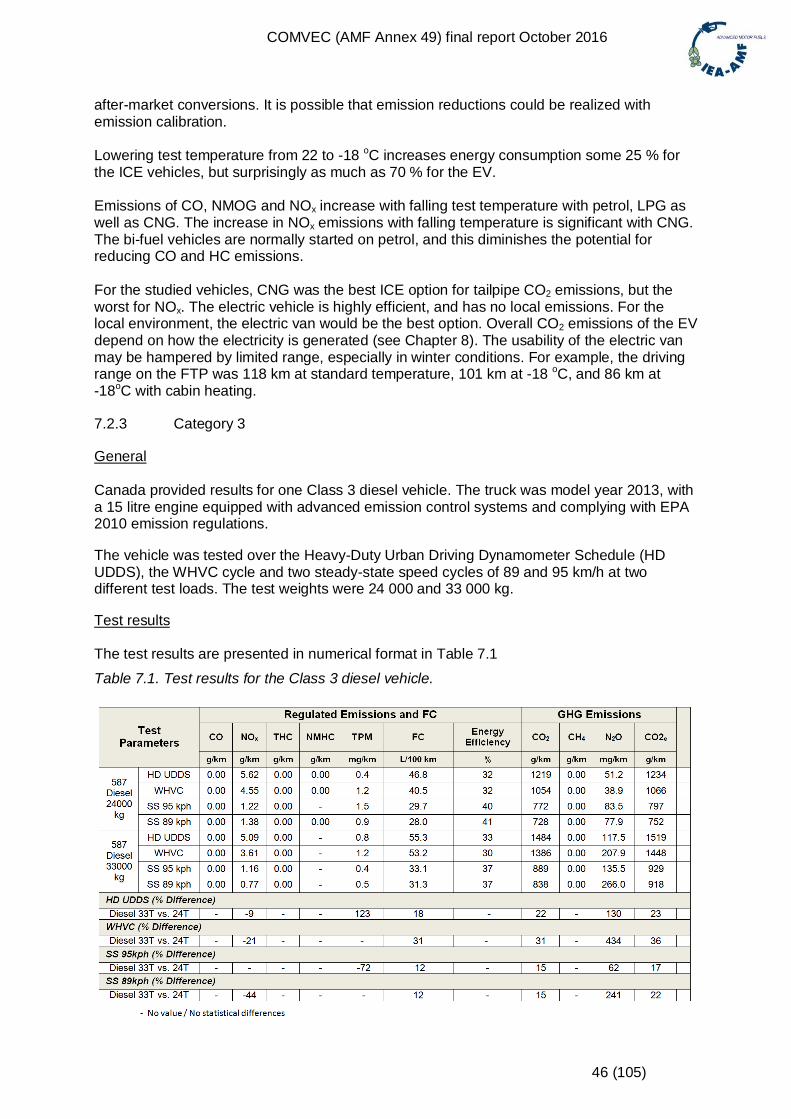
COMVEC (AMF Annex 49) final report October 2016
46 (105)
after-market conversions. It is possible that emission reductions could be realized withemission calibration.
Lowering test temperature from 22 to -18 oC increases energy consumption some 25 % forthe ICE vehicles, but surprisingly as much as 70 % for the EV.
Emissions of CO, NMOG and NOx increase with falling test temperature with petrol, LPG aswell as CNG. The increase in NOx emissions with falling temperature is significant with CNG.The bi-fuel vehicles are normally started on petrol, and this diminishes the potential forreducing CO and HC emissions.
For the studied vehicles, CNG was the best ICE option for tailpipe CO2 emissions, but theworst for NOx. The electric vehicle is highly efficient, and has no local emissions. For thelocal environment, the electric van would be the best option. Overall CO2 emissions of the EVdepend on how the electricity is generated (see Chapter 8). The usability of the electric vanmay be hampered by limited range, especially in winter conditions. For example, the drivingrange on the FTP was 118 km at standard temperature, 101 km at -18 oC, and 86 km at-18oC with cabin heating.
7.2.3 Category 3
General
Canada provided results for one Class 3 diesel vehicle. The truck was model year 2013, witha 15 litre engine equipped with advanced emission control systems and complying with EPA2010 emission regulations.
The vehicle was tested over the Heavy-Duty Urban Driving Dynamometer Schedule (HDUDDS), the WHVC cycle and two steady-state speed cycles of 89 and 95 km/h at twodifferent test loads. The test weights were 24 000 and 33 000 kg.
Test results
The test results are presented in numerical format in Table 7.1
Table 7.1. Test results for the Class 3 diesel vehicle.
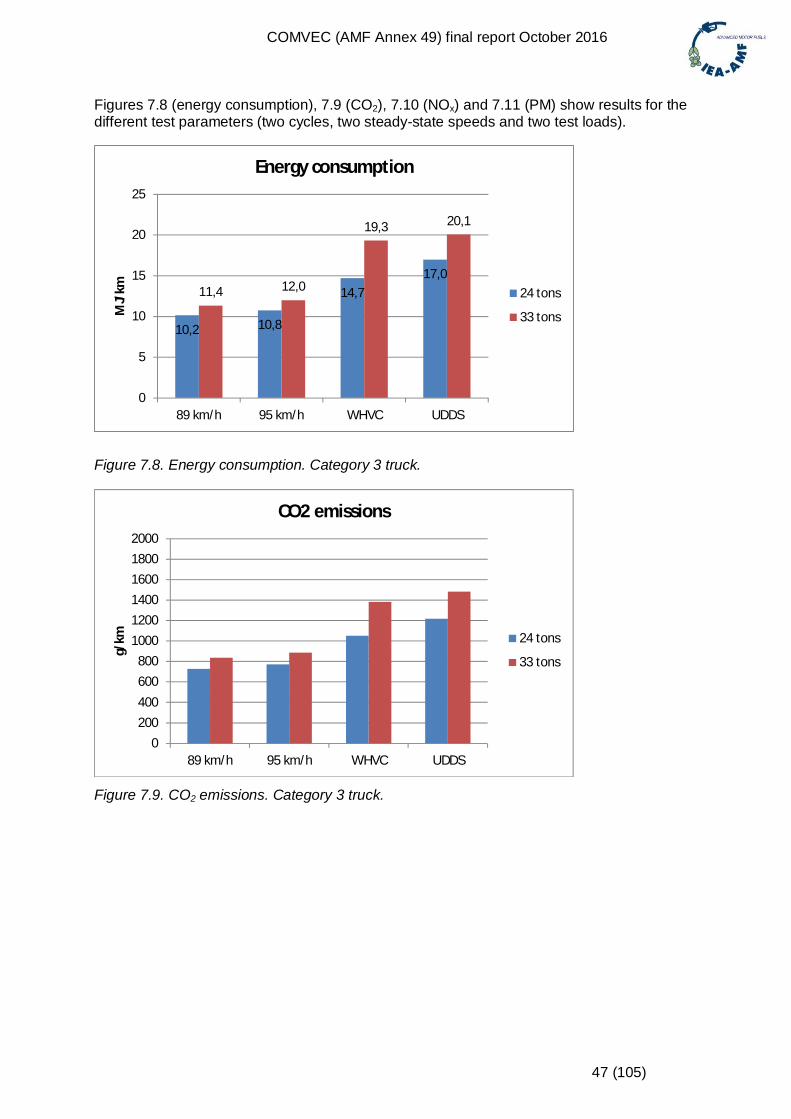
COMVEC (AMF Annex 49) final report October 2016
47 (105)
Figures 7.8 (energy consumption), 7.9 (CO2), 7.10 (NOx) and 7.11 (PM) show results for thedifferent test parameters (two cycles, two steady-state speeds and two test loads).
Figure 7.8. Energy consumption. Category 3 truck.
Figure 7.9. CO2 emissions. Category 3 truck.
10,2 10,8
14,717,0
11,4 12,0
19,3 20,1
0
5
10
15
20
25
89 km/h 95 km/h WHVC UDDS
MJ/
km
Energy consumption
24 tons
33 tons
0200400600800
100012001400160018002000
89 km/h 95 km/h WHVC UDDS
g/km
CO2 emissions
24 tons
33 tons
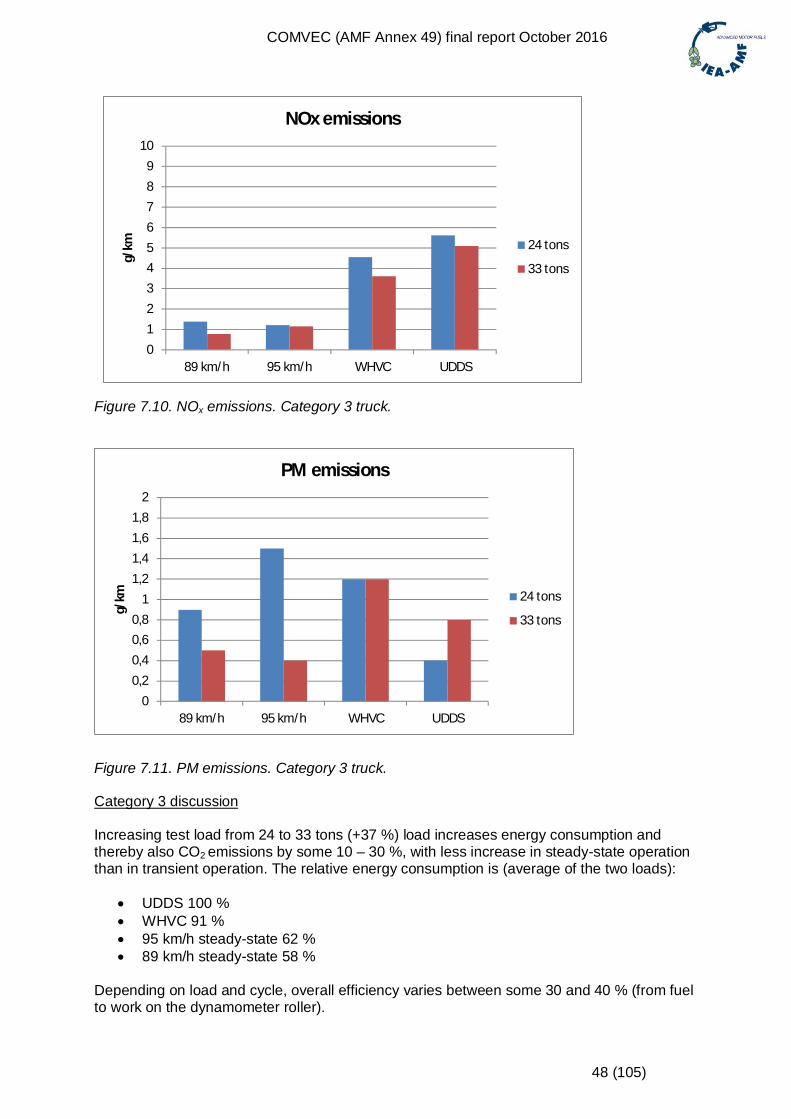
COMVEC (AMF Annex 49) final report October 2016
48 (105)
Figure 7.10. NOx emissions. Category 3 truck.
Figure 7.11. PM emissions. Category 3 truck.
Category 3 discussion
Increasing test load from 24 to 33 tons (+37 %) load increases energy consumption andthereby also CO2 emissions by some 10 – 30 %, with less increase in steady-state operationthan in transient operation. The relative energy consumption is (average of the two loads):
UDDS 100 % WHVC 91 % 95 km/h steady-state 62 % 89 km/h steady-state 58 %
Depending on load and cycle, overall efficiency varies between some 30 and 40 % (from fuelto work on the dynamometer roller).
0123456789
10
89 km/h 95 km/h WHVC UDDS
g/km
NOx emissions
24 tons
33 tons
00,20,40,60,8
11,21,41,61,8
2
89 km/h 95 km/h WHVC UDDS
g/km
PM emissions
24 tons
33 tons
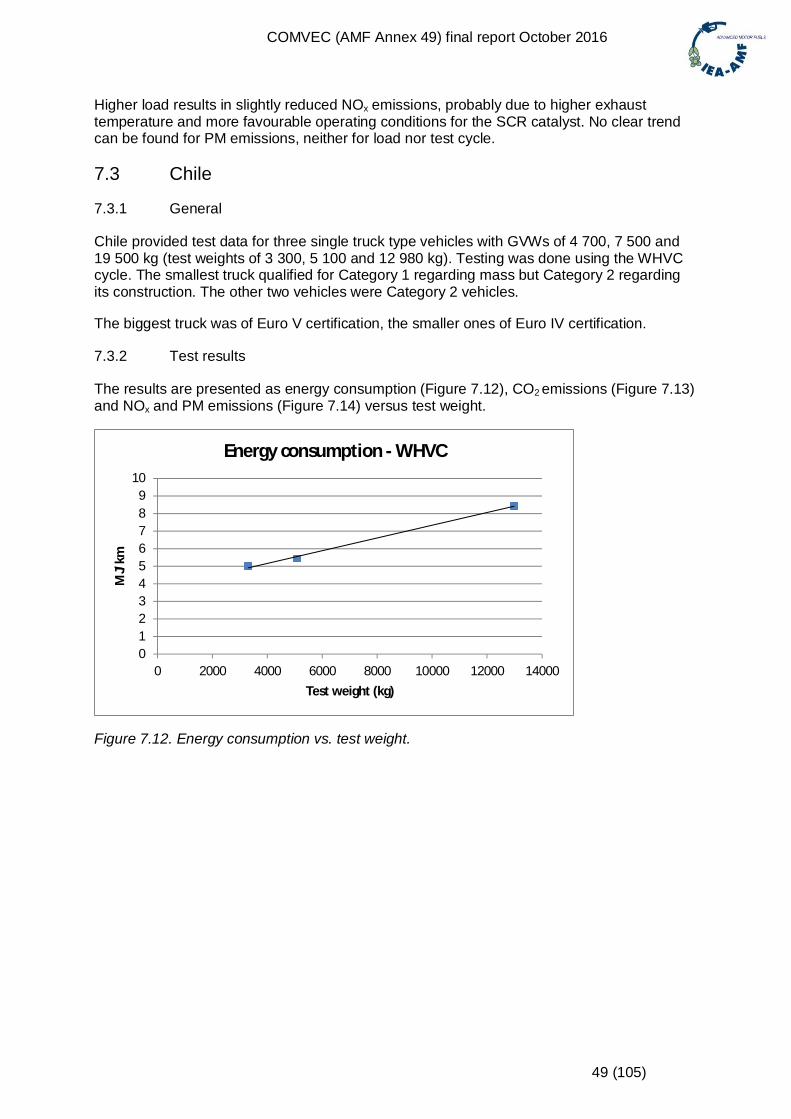
COMVEC (AMF Annex 49) final report October 2016
49 (105)
Higher load results in slightly reduced NOx emissions, probably due to higher exhausttemperature and more favourable operating conditions for the SCR catalyst. No clear trendcan be found for PM emissions, neither for load nor test cycle.
7.3 Chile
7.3.1 General
Chile provided test data for three single truck type vehicles with GVWs of 4 700, 7 500 and19 500 kg (test weights of 3 300, 5 100 and 12 980 kg). Testing was done using the WHVCcycle. The smallest truck qualified for Category 1 regarding mass but Category 2 regardingits construction. The other two vehicles were Category 2 vehicles.
The biggest truck was of Euro V certification, the smaller ones of Euro IV certification.
7.3.2 Test results
The results are presented as energy consumption (Figure 7.12), CO2 emissions (Figure 7.13)and NOx and PM emissions (Figure 7.14) versus test weight.
Figure 7.12. Energy consumption vs. test weight.
0123456789
10
0 2000 4000 6000 8000 10000 12000 14000
MJ/
km
Test weight (kg)
Energy consumption - WHVC
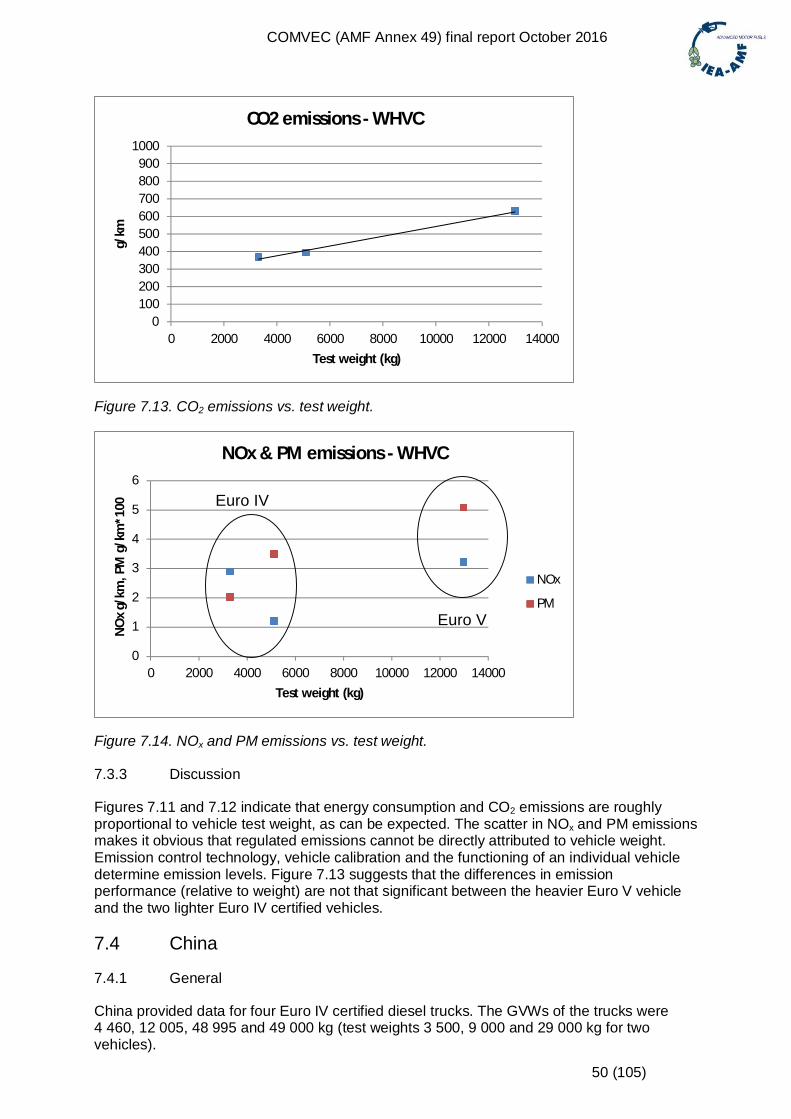
COMVEC (AMF Annex 49) final report October 2016
50 (105)
Figure 7.13. CO2 emissions vs. test weight.
Figure 7.14. NOx and PM emissions vs. test weight.
7.3.3 Discussion
Figures 7.11 and 7.12 indicate that energy consumption and CO2 emissions are roughlyproportional to vehicle test weight, as can be expected. The scatter in NOx and PM emissionsmakes it obvious that regulated emissions cannot be directly attributed to vehicle weight.Emission control technology, vehicle calibration and the functioning of an individual vehicledetermine emission levels. Figure 7.13 suggests that the differences in emissionperformance (relative to weight) are not that significant between the heavier Euro V vehicleand the two lighter Euro IV certified vehicles.
7.4 China
7.4.1 General
China provided data for four Euro IV certified diesel trucks. The GVWs of the trucks were4 460, 12 005, 48 995 and 49 000 kg (test weights 3 500, 9 000 and 29 000 kg for twovehicles).
0100200300400500600700800900
1000
0 2000 4000 6000 8000 10000 12000 14000
g/km
Test weight (kg)
CO2 emissions - WHVC
0
1
2
3
4
5
6
0 2000 4000 6000 8000 10000 12000 14000
NO
xg/
km,P
Mg/
km*1
00
Test weight (kg)
NOx & PM emissions - WHVC
NOx
PM
Euro IV
Euro V
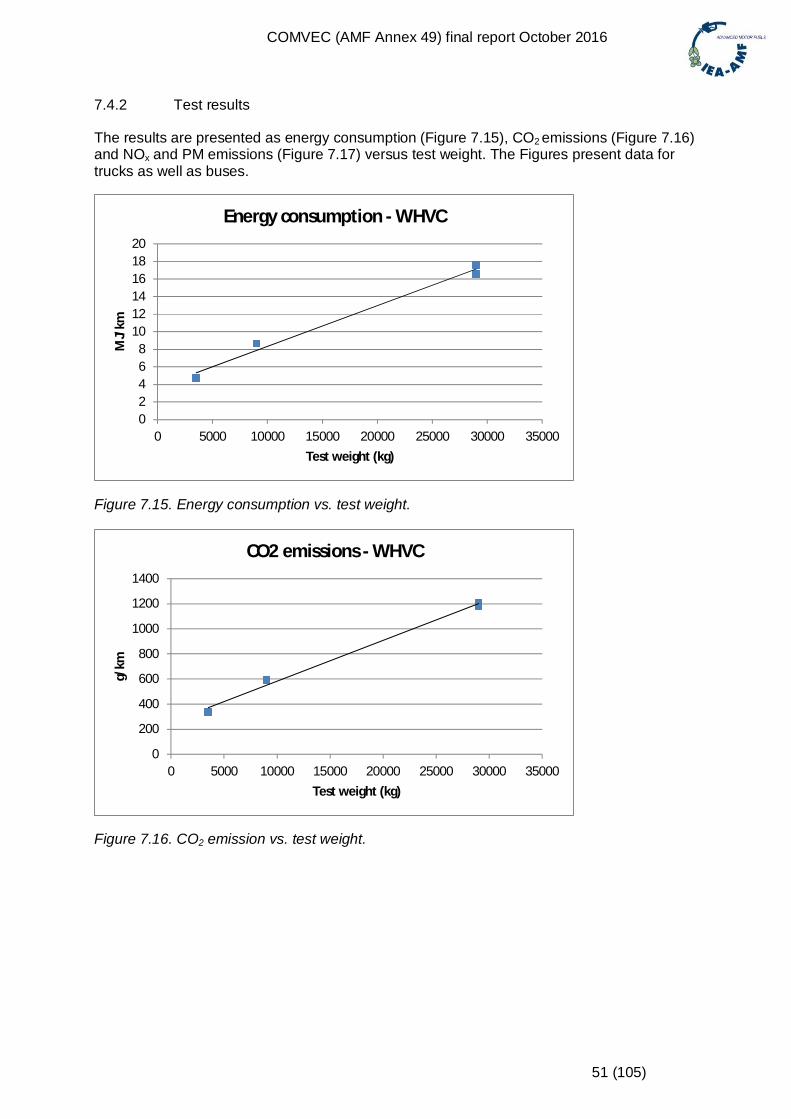
COMVEC (AMF Annex 49) final report October 2016
51 (105)
7.4.2 Test results
The results are presented as energy consumption (Figure 7.15), CO2 emissions (Figure 7.16)and NOx and PM emissions (Figure 7.17) versus test weight. The Figures present data fortrucks as well as buses.
Figure 7.15. Energy consumption vs. test weight.
Figure 7.16. CO2 emission vs. test weight.
02468
101214161820
0 5000 10000 15000 20000 25000 30000 35000
MJ/
km
Test weight (kg)
Energy consumption - WHVC
0
200
400
600
800
1000
1200
1400
0 5000 10000 15000 20000 25000 30000 35000
g/km
Test weight (kg)
CO2 emissions - WHVC
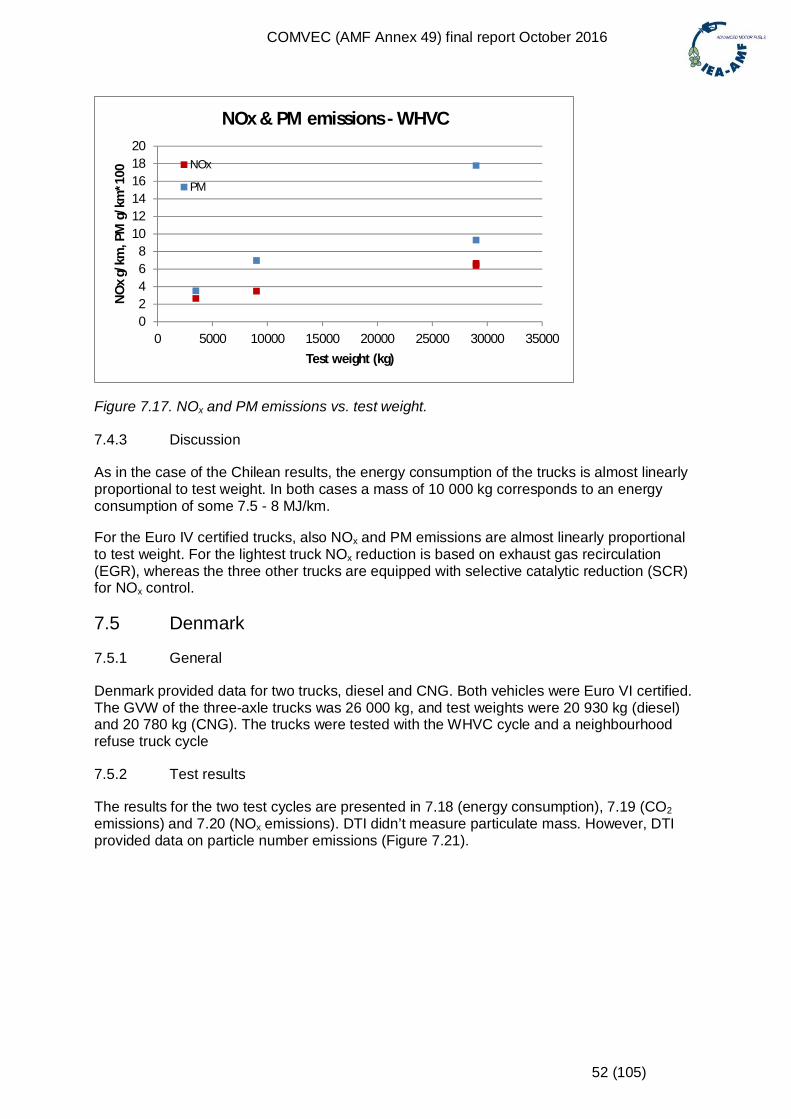
COMVEC (AMF Annex 49) final report October 2016
52 (105)
Figure 7.17. NOx and PM emissions vs. test weight.
7.4.3 Discussion
As in the case of the Chilean results, the energy consumption of the trucks is almost linearlyproportional to test weight. In both cases a mass of 10 000 kg corresponds to an energyconsumption of some 7.5 - 8 MJ/km.
For the Euro IV certified trucks, also NOx and PM emissions are almost linearly proportionalto test weight. For the lightest truck NOx reduction is based on exhaust gas recirculation(EGR), whereas the three other trucks are equipped with selective catalytic reduction (SCR)for NOx control.
7.5 Denmark
7.5.1 General
Denmark provided data for two trucks, diesel and CNG. Both vehicles were Euro VI certified.The GVW of the three-axle trucks was 26 000 kg, and test weights were 20 930 kg (diesel)and 20 780 kg (CNG). The trucks were tested with the WHVC cycle and a neighbourhoodrefuse truck cycle
7.5.2 Test results
The results for the two test cycles are presented in 7.18 (energy consumption), 7.19 (CO2emissions) and 7.20 (NOx emissions). DTI didn’t measure particulate mass. However, DTIprovided data on particle number emissions (Figure 7.21).
02468
101214161820
0 5000 10000 15000 20000 25000 30000 35000
NO
xg/
km,P
Mg/
km*1
00
Test weight (kg)
NOx & PM emissions - WHVC
NOx
PM
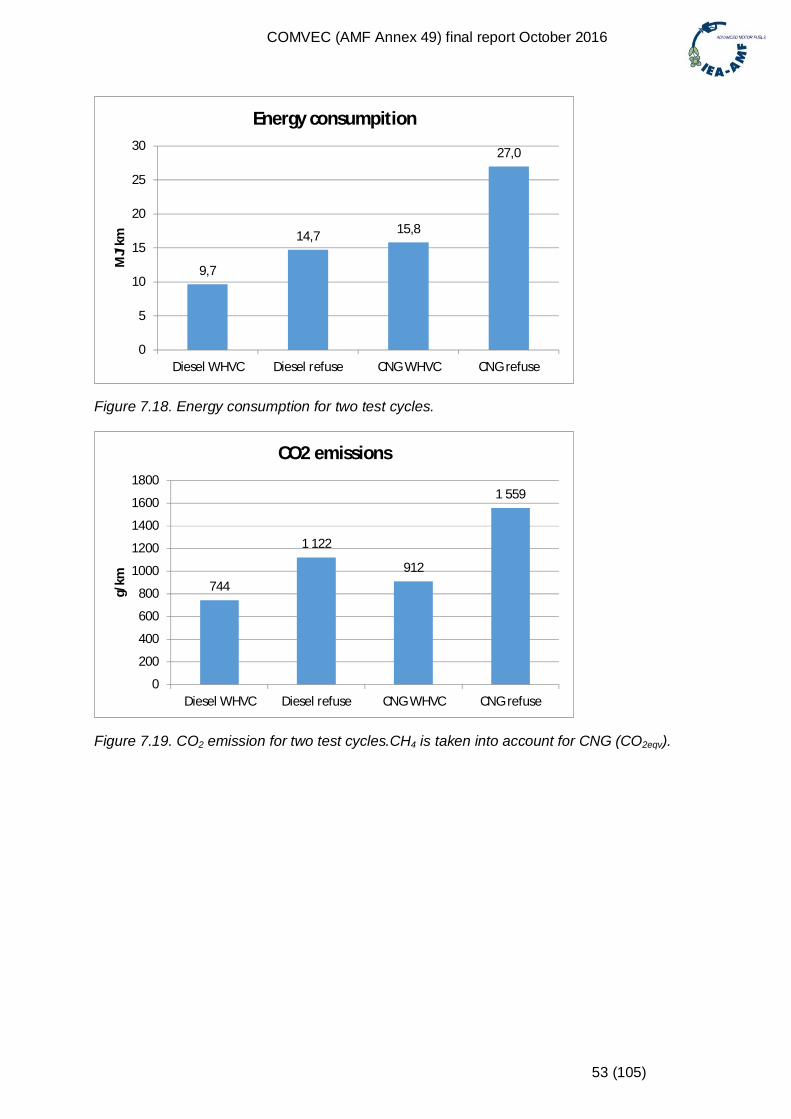
COMVEC (AMF Annex 49) final report October 2016
53 (105)
Figure 7.18. Energy consumption for two test cycles.
Figure 7.19. CO2 emission for two test cycles.CH4 is taken into account for CNG (CO2eqv).
9,7
14,7 15,8
27,0
0
5
10
15
20
25
30
Diesel WHVC Diesel refuse CNG WHVC CNG refuse
MJ/
kmEnergy consumpition
744
1 122
912
1 559
0
200
400
600
800
1000
1200
1400
1600
1800
Diesel WHVC Diesel refuse CNG WHVC CNG refuse
g/km
CO2 emissions
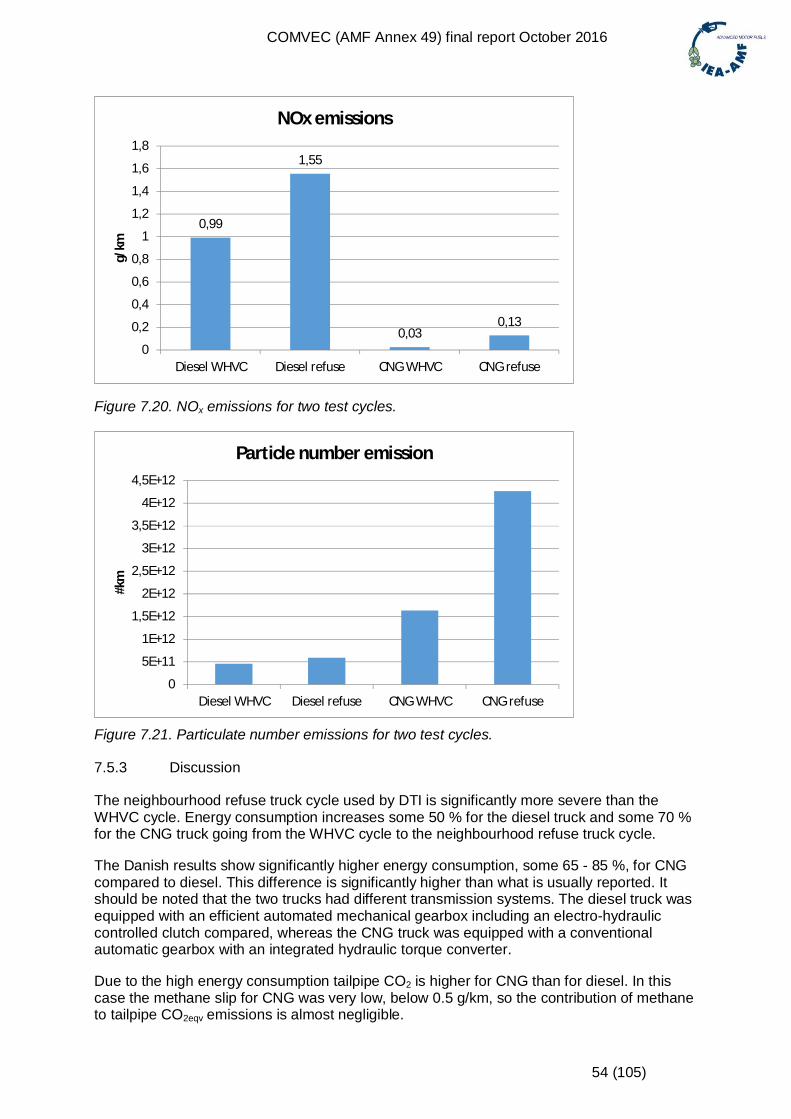
COMVEC (AMF Annex 49) final report October 2016
54 (105)
Figure 7.20. NOx emissions for two test cycles.
Figure 7.21. Particulate number emissions for two test cycles.
7.5.3 Discussion
The neighbourhood refuse truck cycle used by DTI is significantly more severe than theWHVC cycle. Energy consumption increases some 50 % for the diesel truck and some 70 %for the CNG truck going from the WHVC cycle to the neighbourhood refuse truck cycle.
The Danish results show significantly higher energy consumption, some 65 - 85 %, for CNGcompared to diesel. This difference is significantly higher than what is usually reported. Itshould be noted that the two trucks had different transmission systems. The diesel truck wasequipped with an efficient automated mechanical gearbox including an electro-hydrauliccontrolled clutch compared, whereas the CNG truck was equipped with a conventionalautomatic gearbox with an integrated hydraulic torque converter.
Due to the high energy consumption tailpipe CO2 is higher for CNG than for diesel. In thiscase the methane slip for CNG was very low, below 0.5 g/km, so the contribution of methaneto tailpipe CO2eqv emissions is almost negligible.
0,99
1,55
0,030,13
0
0,2
0,4
0,6
0,8
1
1,2
1,4
1,6
1,8
Diesel WHVC Diesel refuse CNG WHVC CNG refuse
g/km
NOx emissions
0
5E+11
1E+12
1,5E+12
2E+12
2,5E+12
3E+12
3,5E+12
4E+12
4,5E+12
Diesel WHVC Diesel refuse CNG WHVC CNG refuse
#km
Particle number emission
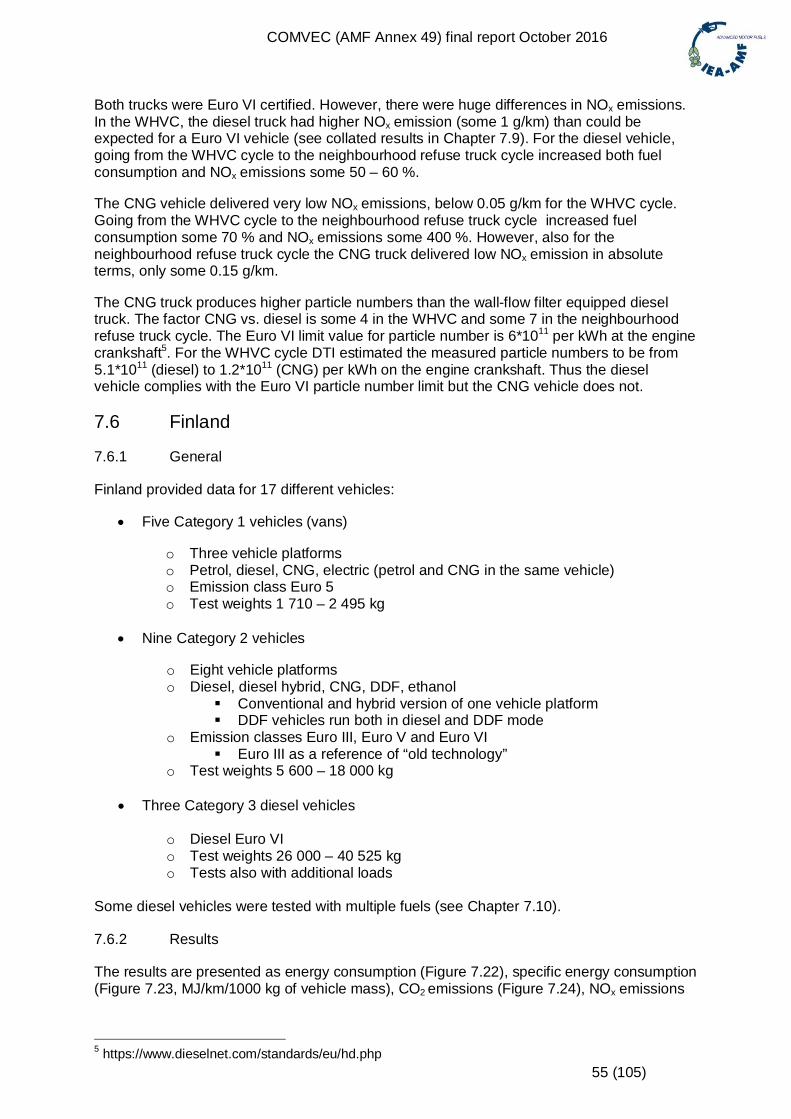
COMVEC (AMF Annex 49) final report October 2016
55 (105)
Both trucks were Euro VI certified. However, there were huge differences in NOx emissions.In the WHVC, the diesel truck had higher NOx emission (some 1 g/km) than could beexpected for a Euro VI vehicle (see collated results in Chapter 7.9). For the diesel vehicle,going from the WHVC cycle to the neighbourhood refuse truck cycle increased both fuelconsumption and NOx emissions some 50 – 60 %.
The CNG vehicle delivered very low NOx emissions, below 0.05 g/km for the WHVC cycle.Going from the WHVC cycle to the neighbourhood refuse truck cycle increased fuelconsumption some 70 % and NOx emissions some 400 %. However, also for theneighbourhood refuse truck cycle the CNG truck delivered low NOx emission in absoluteterms, only some 0.15 g/km.
The CNG truck produces higher particle numbers than the wall-flow filter equipped dieseltruck. The factor CNG vs. diesel is some 4 in the WHVC and some 7 in the neighbourhoodrefuse truck cycle. The Euro VI limit value for particle number is 6*1011 per kWh at the enginecrankshaft5. For the WHVC cycle DTI estimated the measured particle numbers to be from5.1*1011 (diesel) to 1.2*1011 (CNG) per kWh on the engine crankshaft. Thus the dieselvehicle complies with the Euro VI particle number limit but the CNG vehicle does not.
7.6 Finland
7.6.1 General
Finland provided data for 17 different vehicles:
Five Category 1 vehicles (vans)
o Three vehicle platformso Petrol, diesel, CNG, electric (petrol and CNG in the same vehicle)o Emission class Euro 5o Test weights 1 710 – 2 495 kg
Nine Category 2 vehicles
o Eight vehicle platformso Diesel, diesel hybrid, CNG, DDF, ethanol
Conventional and hybrid version of one vehicle platform DDF vehicles run both in diesel and DDF mode
o Emission classes Euro III, Euro V and Euro VI Euro III as a reference of “old technology”
o Test weights 5 600 – 18 000 kg
Three Category 3 diesel vehicles
o Diesel Euro VIo Test weights 26 000 – 40 525 kgo Tests also with additional loads
Some diesel vehicles were tested with multiple fuels (see Chapter 7.10).
7.6.2 Results
The results are presented as energy consumption (Figure 7.22), specific energy consumption(Figure 7.23, MJ/km/1000 kg of vehicle mass), CO2 emissions (Figure 7.24), NOx emissions
5 https://www.dieselnet.com/standards/eu/hd.php
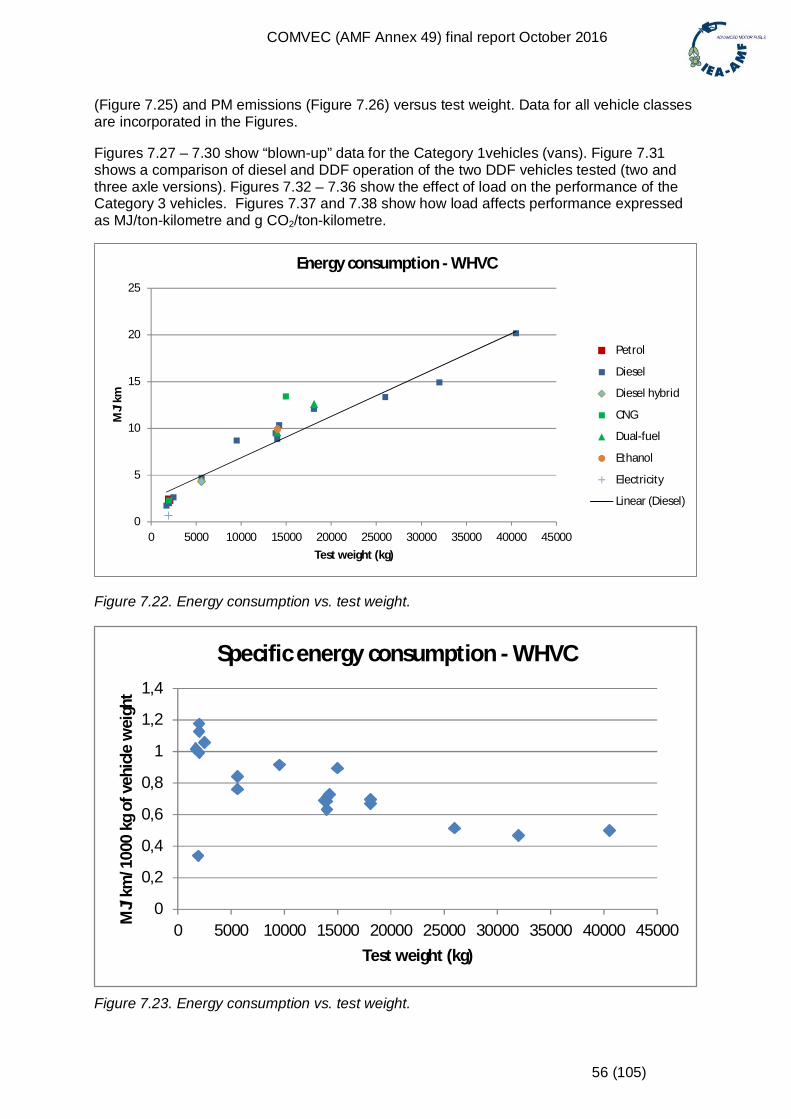
COMVEC (AMF Annex 49) final report October 2016
56 (105)
(Figure 7.25) and PM emissions (Figure 7.26) versus test weight. Data for all vehicle classesare incorporated in the Figures.
Figures 7.27 – 7.30 show “blown-up” data for the Category 1vehicles (vans). Figure 7.31shows a comparison of diesel and DDF operation of the two DDF vehicles tested (two andthree axle versions). Figures 7.32 – 7.36 show the effect of load on the performance of theCategory 3 vehicles. Figures 7.37 and 7.38 show how load affects performance expressedas MJ/ton-kilometre and g CO2/ton-kilometre.
Figure 7.22. Energy consumption vs. test weight.
Figure 7.23. Energy consumption vs. test weight.
0
5
10
15
20
25
0 5000 10000 15000 20000 25000 30000 35000 40000 45000
MJ/
km
Test weight (kg)
Energy consumption - WHVC
Petrol
Diesel
Diesel hybrid
CNG
Dual-fuel
Ethanol
Electricity
Linear (Diesel)
0
0,2
0,4
0,6
0,8
1
1,2
1,4
0 5000 10000 15000 20000 25000 30000 35000 40000 45000
MJ/
km/1
000
kgof
vehi
cle
wei
ght
Test weight (kg)
Specific energy consumption - WHVC
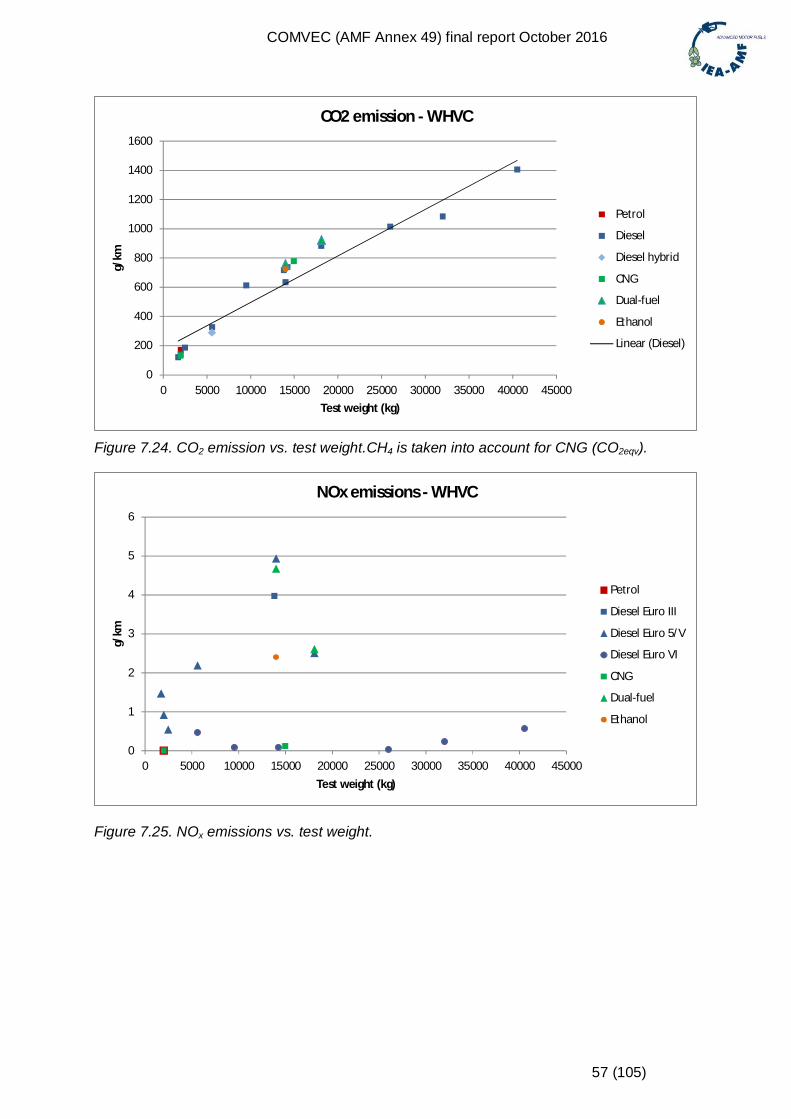
COMVEC (AMF Annex 49) final report October 2016
57 (105)
Figure 7.24. CO2 emission vs. test weight.CH4 is taken into account for CNG (CO2eqv).
Figure 7.25. NOx emissions vs. test weight.
0
200
400
600
800
1000
1200
1400
1600
0 5000 10000 15000 20000 25000 30000 35000 40000 45000
g/km
Test weight (kg)
CO2 emission - WHVC
Petrol
Diesel
Diesel hybrid
CNG
Dual-fuel
Ethanol
Linear (Diesel)
0
1
2
3
4
5
6
0 5000 10000 15000 20000 25000 30000 35000 40000 45000
g/km
Test weight (kg)
NOx emissions - WHVC
Petrol
Diesel Euro III
Diesel Euro 5/V
Diesel Euro VI
CNG
Dual-fuel
Ethanol
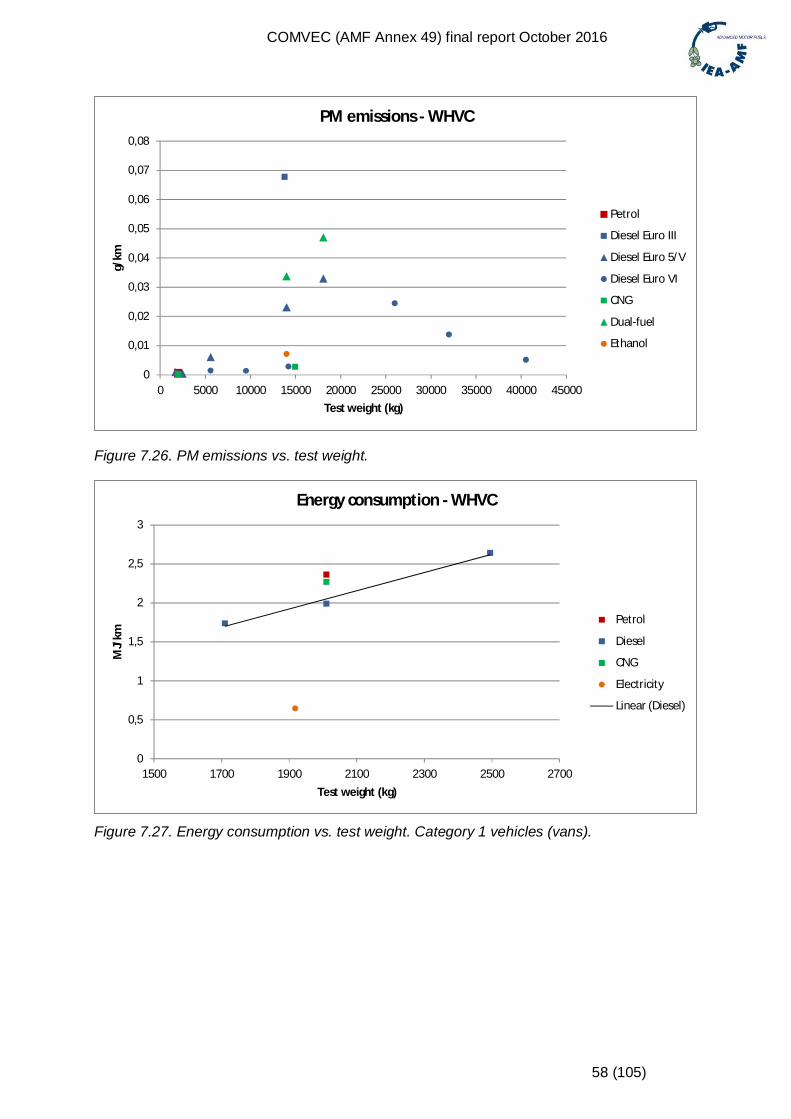
COMVEC (AMF Annex 49) final report October 2016
58 (105)
Figure 7.26. PM emissions vs. test weight.
Figure 7.27. Energy consumption vs. test weight. Category 1 vehicles (vans).
0
0,01
0,02
0,03
0,04
0,05
0,06
0,07
0,08
0 5000 10000 15000 20000 25000 30000 35000 40000 45000
g/km
Test weight (kg)
PM emissions - WHVC
Petrol
Diesel Euro III
Diesel Euro 5/V
Diesel Euro VI
CNG
Dual-fuel
Ethanol
0
0,5
1
1,5
2
2,5
3
1500 1700 1900 2100 2300 2500 2700
MJ/
km
Test weight (kg)
Energy consumption - WHVC
Petrol
Diesel
CNG
Electricity
Linear (Diesel)
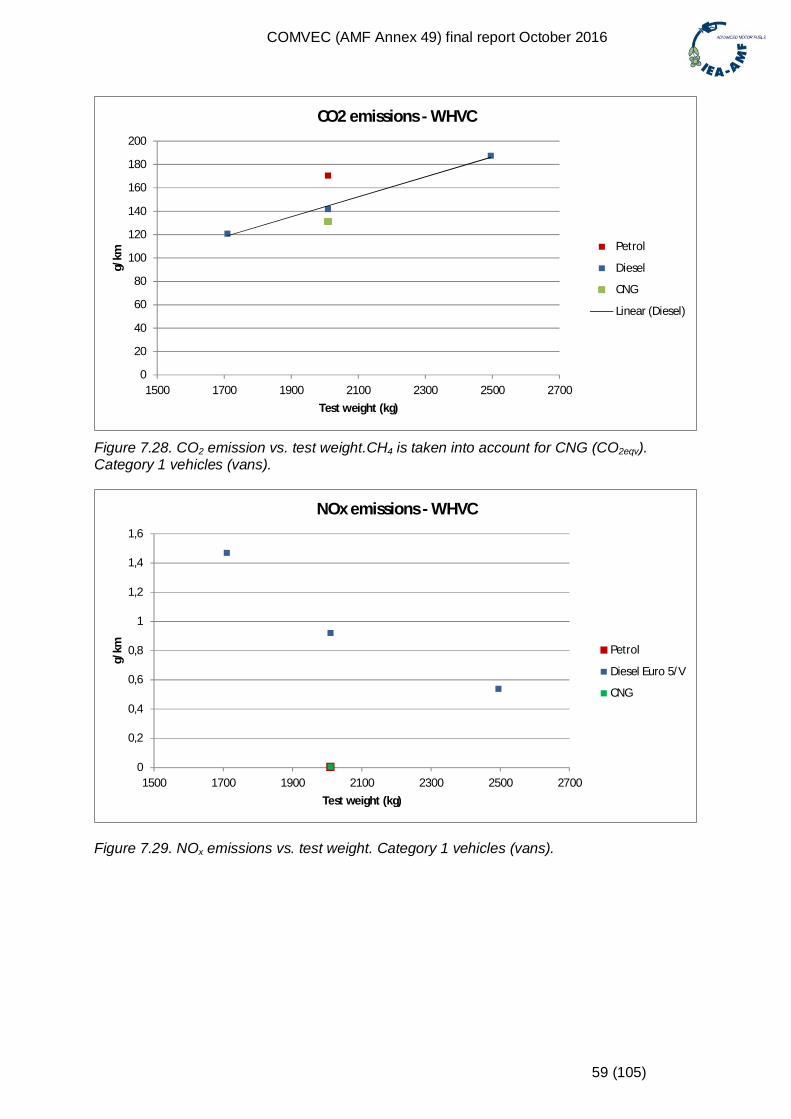
COMVEC (AMF Annex 49) final report October 2016
59 (105)
Figure 7.28. CO2 emission vs. test weight.CH4 is taken into account for CNG (CO2eqv).Category 1 vehicles (vans).
Figure 7.29. NOx emissions vs. test weight. Category 1 vehicles (vans).
0
20
40
60
80
100
120
140
160
180
200
1500 1700 1900 2100 2300 2500 2700
g/km
Test weight (kg)
CO2 emissions - WHVC
Petrol
Diesel
CNG
Linear (Diesel)
0
0,2
0,4
0,6
0,8
1
1,2
1,4
1,6
1500 1700 1900 2100 2300 2500 2700
g/km
Test weight (kg)
NOx emissions - WHVC
Petrol
Diesel Euro 5/V
CNG
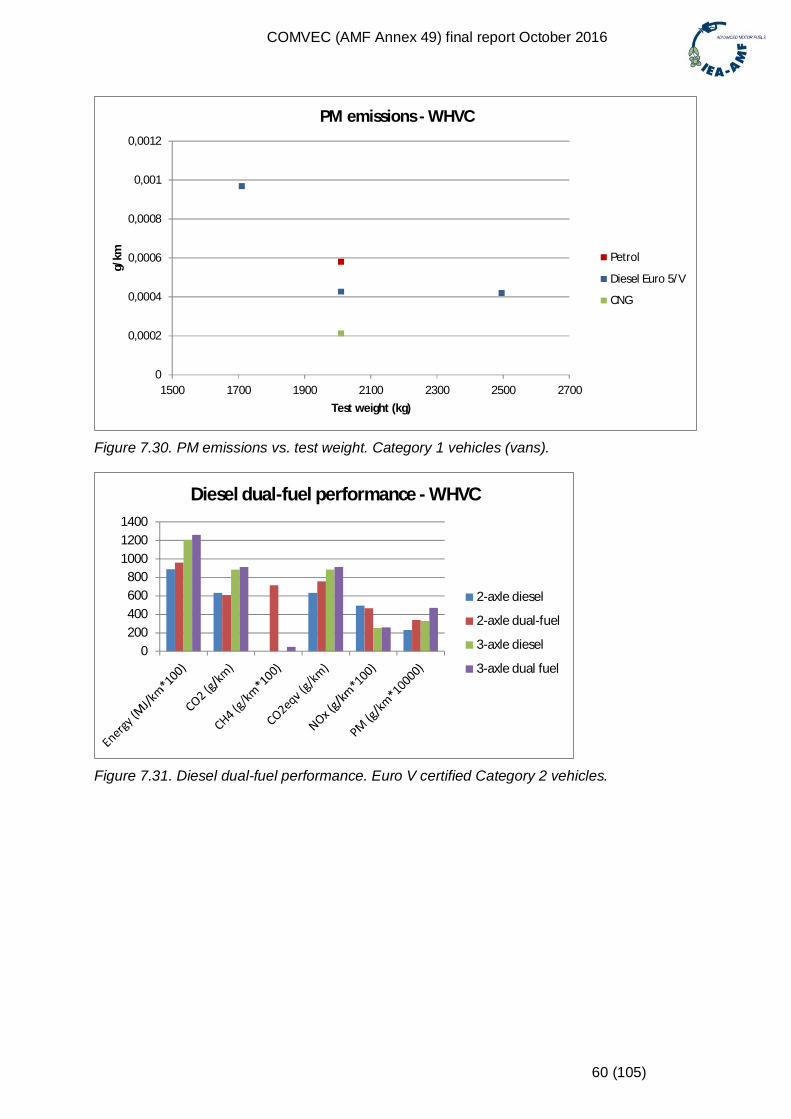
COMVEC (AMF Annex 49) final report October 2016
60 (105)
Figure 7.30. PM emissions vs. test weight. Category 1 vehicles (vans).
Figure 7.31. Diesel dual-fuel performance. Euro V certified Category 2 vehicles.
0
0,0002
0,0004
0,0006
0,0008
0,001
0,0012
1500 1700 1900 2100 2300 2500 2700
g/km
Test weight (kg)
PM emissions - WHVC
Petrol
Diesel Euro 5/V
CNG
0200400600800
100012001400
Diesel dual-fuel performance - WHVC
2-axle diesel
2-axle dual-fuel
3-axle diesel
3-axle dual fuel
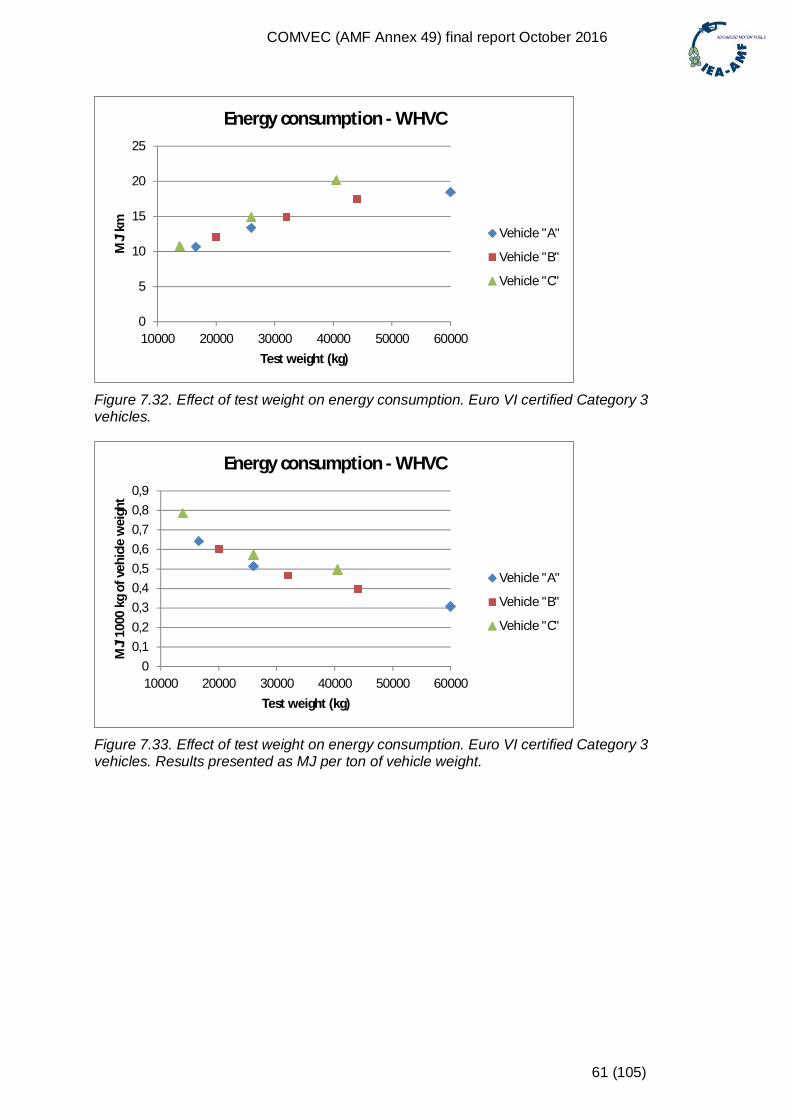
COMVEC (AMF Annex 49) final report October 2016
61 (105)
Figure 7.32. Effect of test weight on energy consumption. Euro VI certified Category 3vehicles.
Figure 7.33. Effect of test weight on energy consumption. Euro VI certified Category 3vehicles. Results presented as MJ per ton of vehicle weight.
0
5
10
15
20
25
10000 20000 30000 40000 50000 60000
MJ/
km
Test weight (kg)
Energy consumption - WHVC
Vehicle "A"
Vehicle "B"
Vehicle "C"
00,10,20,30,40,50,60,70,80,9
10000 20000 30000 40000 50000 60000
MJ/
1000
kgof
vehi
cle
wei
ght
Test weight (kg)
Energy consumption - WHVC
Vehicle "A"
Vehicle "B"
Vehicle "C"
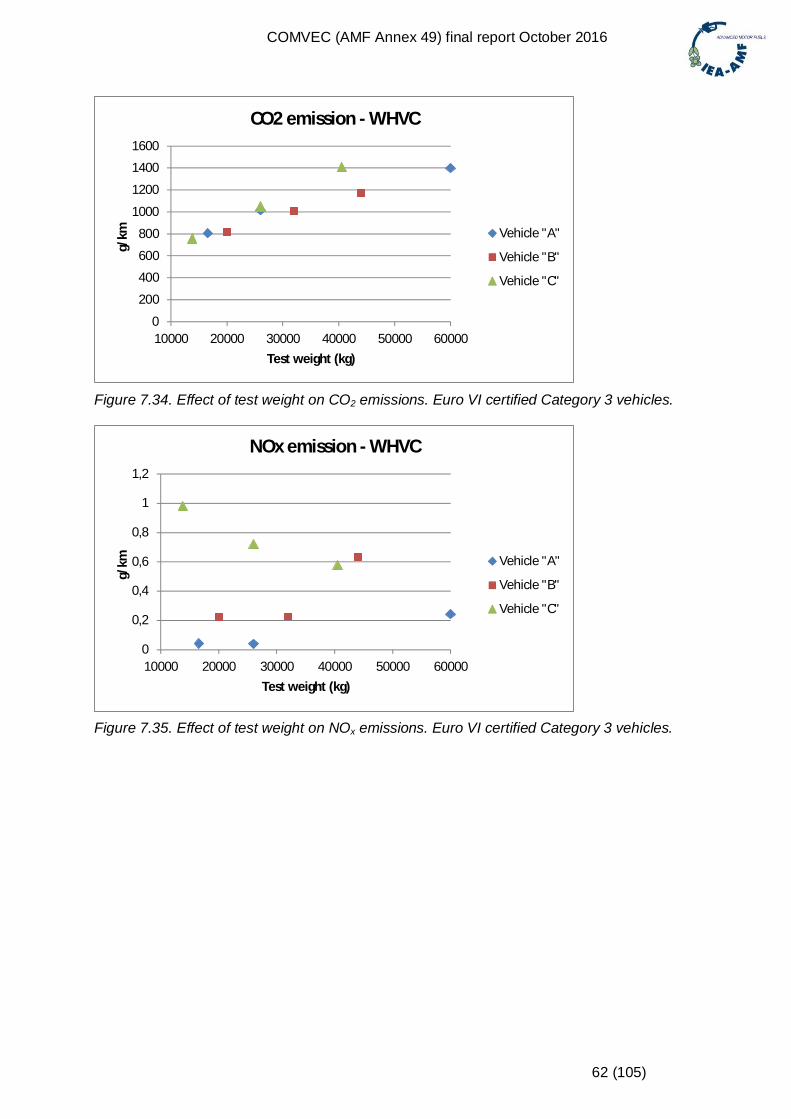
COMVEC (AMF Annex 49) final report October 2016
62 (105)
Figure 7.34. Effect of test weight on CO2 emissions. Euro VI certified Category 3 vehicles.
Figure 7.35. Effect of test weight on NOx emissions. Euro VI certified Category 3 vehicles.
0
200
400
600
800
1000
1200
1400
1600
10000 20000 30000 40000 50000 60000
g/km
Test weight (kg)
CO2 emission - WHVC
Vehicle "A"
Vehicle "B"
Vehicle "C"
0
0,2
0,4
0,6
0,8
1
1,2
10000 20000 30000 40000 50000 60000
g/km
Test weight (kg)
NOx emission - WHVC
Vehicle "A"
Vehicle "B"
Vehicle "C"
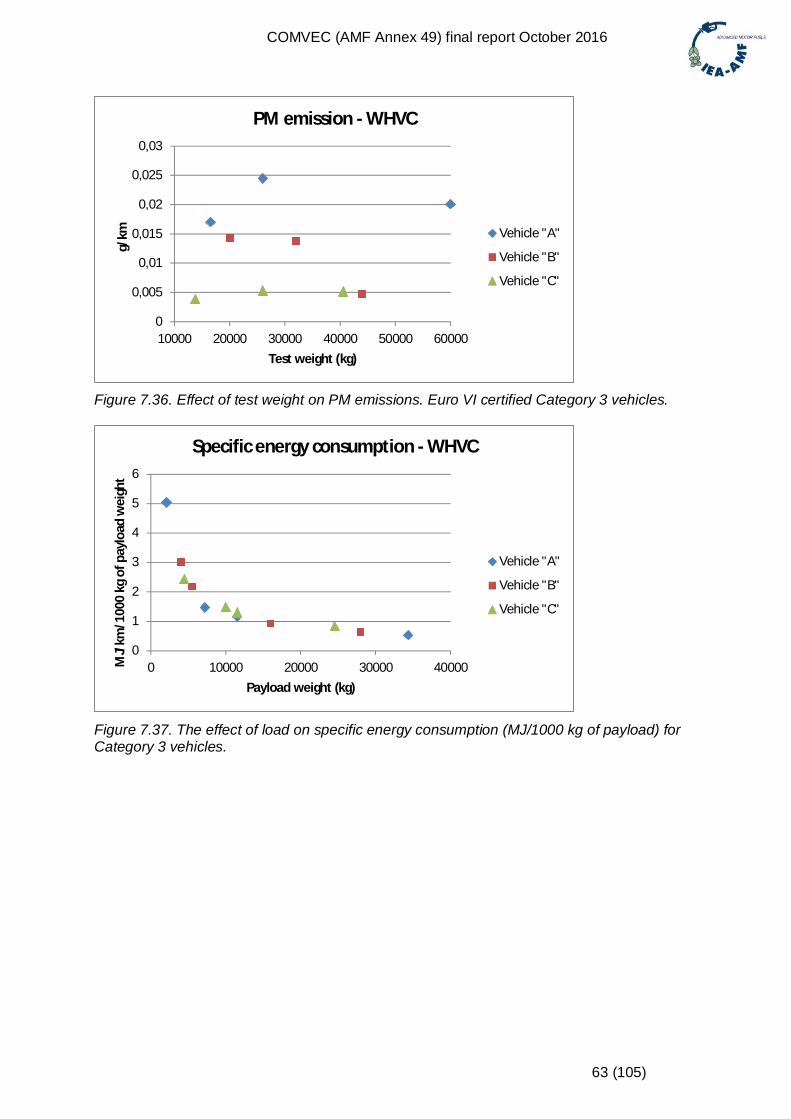
COMVEC (AMF Annex 49) final report October 2016
63 (105)
Figure 7.36. Effect of test weight on PM emissions. Euro VI certified Category 3 vehicles.
Figure 7.37. The effect of load on specific energy consumption (MJ/1000 kg of payload) forCategory 3 vehicles.
0
0,005
0,01
0,015
0,02
0,025
0,03
10000 20000 30000 40000 50000 60000
g/km
Test weight (kg)
PM emission - WHVC
Vehicle "A"
Vehicle "B"
Vehicle "C"
0
1
2
3
4
5
6
0 10000 20000 30000 40000MJ/
km/1
000
kgof
payl
oad
wei
ght
Payload weight (kg)
Specific energy consumption - WHVC
Vehicle "A"
Vehicle "B"
Vehicle "C"
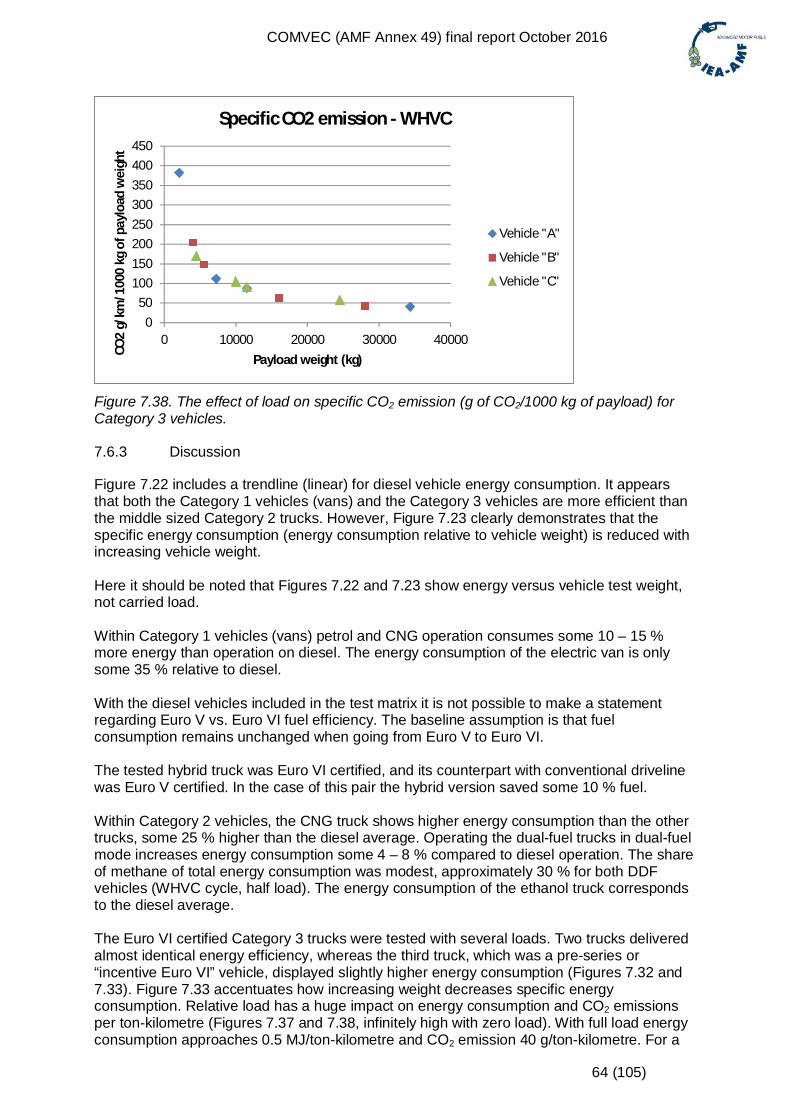
COMVEC (AMF Annex 49) final report October 2016
64 (105)
Figure 7.38. The effect of load on specific CO2 emission (g of CO2/1000 kg of payload) forCategory 3 vehicles.
7.6.3 Discussion
Figure 7.22 includes a trendline (linear) for diesel vehicle energy consumption. It appearsthat both the Category 1 vehicles (vans) and the Category 3 vehicles are more efficient thanthe middle sized Category 2 trucks. However, Figure 7.23 clearly demonstrates that thespecific energy consumption (energy consumption relative to vehicle weight) is reduced withincreasing vehicle weight.
Here it should be noted that Figures 7.22 and 7.23 show energy versus vehicle test weight,not carried load.
Within Category 1 vehicles (vans) petrol and CNG operation consumes some 10 – 15 %more energy than operation on diesel. The energy consumption of the electric van is onlysome 35 % relative to diesel.
With the diesel vehicles included in the test matrix it is not possible to make a statementregarding Euro V vs. Euro VI fuel efficiency. The baseline assumption is that fuelconsumption remains unchanged when going from Euro V to Euro VI.
The tested hybrid truck was Euro VI certified, and its counterpart with conventional drivelinewas Euro V certified. In the case of this pair the hybrid version saved some 10 % fuel.
Within Category 2 vehicles, the CNG truck shows higher energy consumption than the othertrucks, some 25 % higher than the diesel average. Operating the dual-fuel trucks in dual-fuelmode increases energy consumption some 4 – 8 % compared to diesel operation. The shareof methane of total energy consumption was modest, approximately 30 % for both DDFvehicles (WHVC cycle, half load). The energy consumption of the ethanol truck correspondsto the diesel average.
The Euro VI certified Category 3 trucks were tested with several loads. Two trucks deliveredalmost identical energy efficiency, whereas the third truck, which was a pre-series or“incentive Euro VI” vehicle, displayed slightly higher energy consumption (Figures 7.32 and7.33). Figure 7.33 accentuates how increasing weight decreases specific energyconsumption. Relative load has a huge impact on energy consumption and CO2 emissionsper ton-kilometre (Figures 7.37 and 7.38, infinitely high with zero load). With full load energyconsumption approaches 0.5 MJ/ton-kilometre and CO2 emission 40 g/ton-kilometre. For a
050
100150200250300350400450
0 10000 20000 30000 40000
CO2
g/km
/100
0kg
ofpa
yloa
dw
eigh
t
Payload weight (kg)
Specific CO2 emission - WHVC
Vehicle "A"
Vehicle "B"
Vehicle "C"
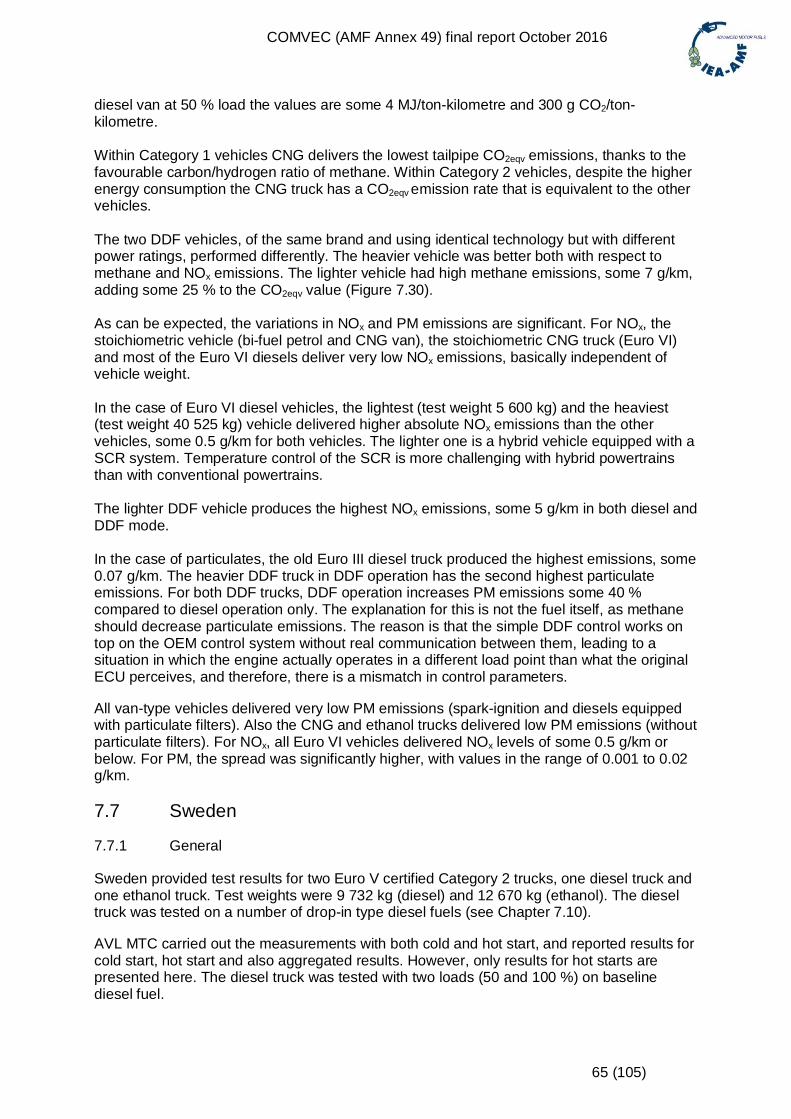
COMVEC (AMF Annex 49) final report October 2016
65 (105)
diesel van at 50 % load the values are some 4 MJ/ton-kilometre and 300 g CO2/ton-kilometre.
Within Category 1 vehicles CNG delivers the lowest tailpipe CO2eqv emissions, thanks to thefavourable carbon/hydrogen ratio of methane. Within Category 2 vehicles, despite the higherenergy consumption the CNG truck has a CO2eqv emission rate that is equivalent to the othervehicles.
The two DDF vehicles, of the same brand and using identical technology but with differentpower ratings, performed differently. The heavier vehicle was better both with respect tomethane and NOx emissions. The lighter vehicle had high methane emissions, some 7 g/km,adding some 25 % to the CO2eqv value (Figure 7.30).
As can be expected, the variations in NOx and PM emissions are significant. For NOx, thestoichiometric vehicle (bi-fuel petrol and CNG van), the stoichiometric CNG truck (Euro VI)and most of the Euro VI diesels deliver very low NOx emissions, basically independent ofvehicle weight.
In the case of Euro VI diesel vehicles, the lightest (test weight 5 600 kg) and the heaviest(test weight 40 525 kg) vehicle delivered higher absolute NOx emissions than the othervehicles, some 0.5 g/km for both vehicles. The lighter one is a hybrid vehicle equipped with aSCR system. Temperature control of the SCR is more challenging with hybrid powertrainsthan with conventional powertrains.
The lighter DDF vehicle produces the highest NOx emissions, some 5 g/km in both diesel andDDF mode.
In the case of particulates, the old Euro III diesel truck produced the highest emissions, some0.07 g/km. The heavier DDF truck in DDF operation has the second highest particulateemissions. For both DDF trucks, DDF operation increases PM emissions some 40 %compared to diesel operation only. The explanation for this is not the fuel itself, as methaneshould decrease particulate emissions. The reason is that the simple DDF control works ontop on the OEM control system without real communication between them, leading to asituation in which the engine actually operates in a different load point than what the originalECU perceives, and therefore, there is a mismatch in control parameters.
All van-type vehicles delivered very low PM emissions (spark-ignition and diesels equippedwith particulate filters). Also the CNG and ethanol trucks delivered low PM emissions (withoutparticulate filters). For NOx, all Euro VI vehicles delivered NOx levels of some 0.5 g/km orbelow. For PM, the spread was significantly higher, with values in the range of 0.001 to 0.02g/km.
7.7 Sweden
7.7.1 General
Sweden provided test results for two Euro V certified Category 2 trucks, one diesel truck andone ethanol truck. Test weights were 9 732 kg (diesel) and 12 670 kg (ethanol). The dieseltruck was tested on a number of drop-in type diesel fuels (see Chapter 7.10).
AVL MTC carried out the measurements with both cold and hot start, and reported results forcold start, hot start and also aggregated results. However, only results for hot starts arepresented here. The diesel truck was tested with two loads (50 and 100 %) on baselinediesel fuel.
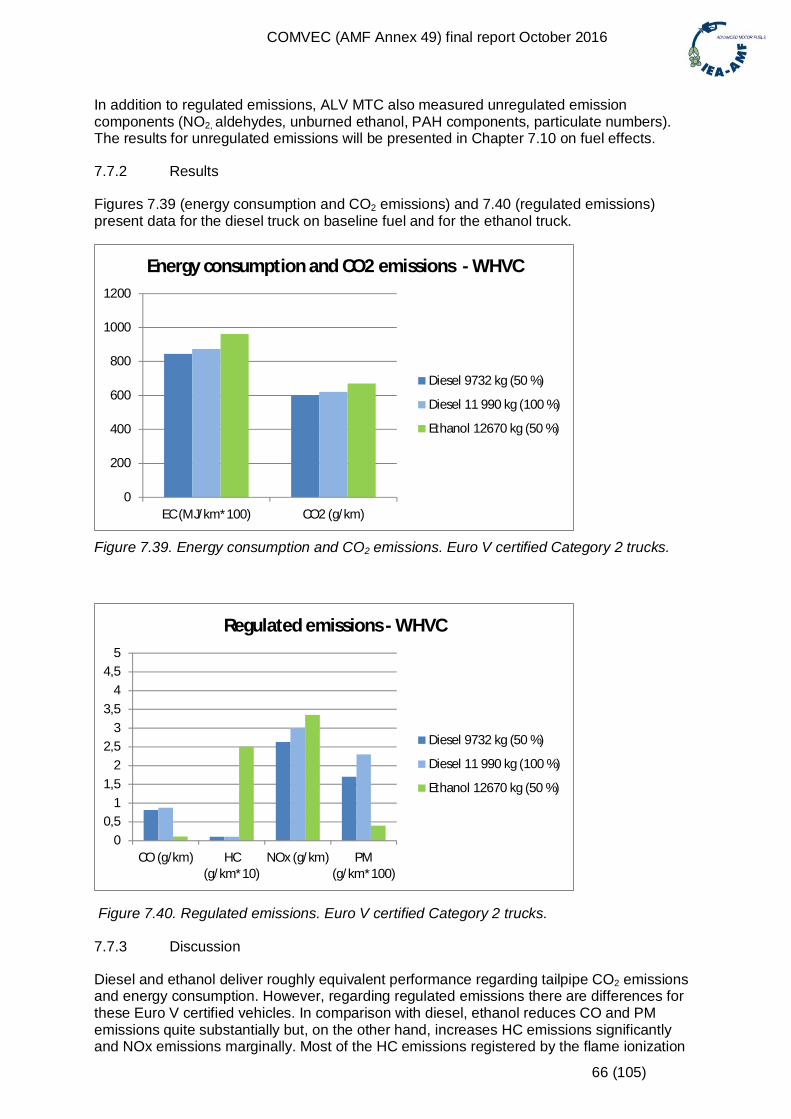
COMVEC (AMF Annex 49) final report October 2016
66 (105)
In addition to regulated emissions, ALV MTC also measured unregulated emissioncomponents (NO2, aldehydes, unburned ethanol, PAH components, particulate numbers).The results for unregulated emissions will be presented in Chapter 7.10 on fuel effects.
7.7.2 Results
Figures 7.39 (energy consumption and CO2 emissions) and 7.40 (regulated emissions)present data for the diesel truck on baseline fuel and for the ethanol truck.
Figure 7.39. Energy consumption and CO2 emissions. Euro V certified Category 2 trucks.
Figure 7.40. Regulated emissions. Euro V certified Category 2 trucks.
7.7.3 Discussion
Diesel and ethanol deliver roughly equivalent performance regarding tailpipe CO2 emissionsand energy consumption. However, regarding regulated emissions there are differences forthese Euro V certified vehicles. In comparison with diesel, ethanol reduces CO and PMemissions quite substantially but, on the other hand, increases HC emissions significantlyand NOx emissions marginally. Most of the HC emissions registered by the flame ionization
0
200
400
600
800
1000
1200
EC (MJ/km*100) CO2 (g/km)
Energy consumption and CO2 emissions - WHVC
Diesel 9732 kg (50 %)
Diesel 11 990 kg (100 %)
Ethanol 12670 kg (50 %)
00,5
11,5
22,5
33,5
44,5
5
CO (g/km) HC(g/km*10)
NOx (g/km) PM(g/km*100)
Regulated emissions - WHVC
Diesel 9732 kg (50 %)
Diesel 11 990 kg (100 %)
Ethanol 12670 kg (50 %)
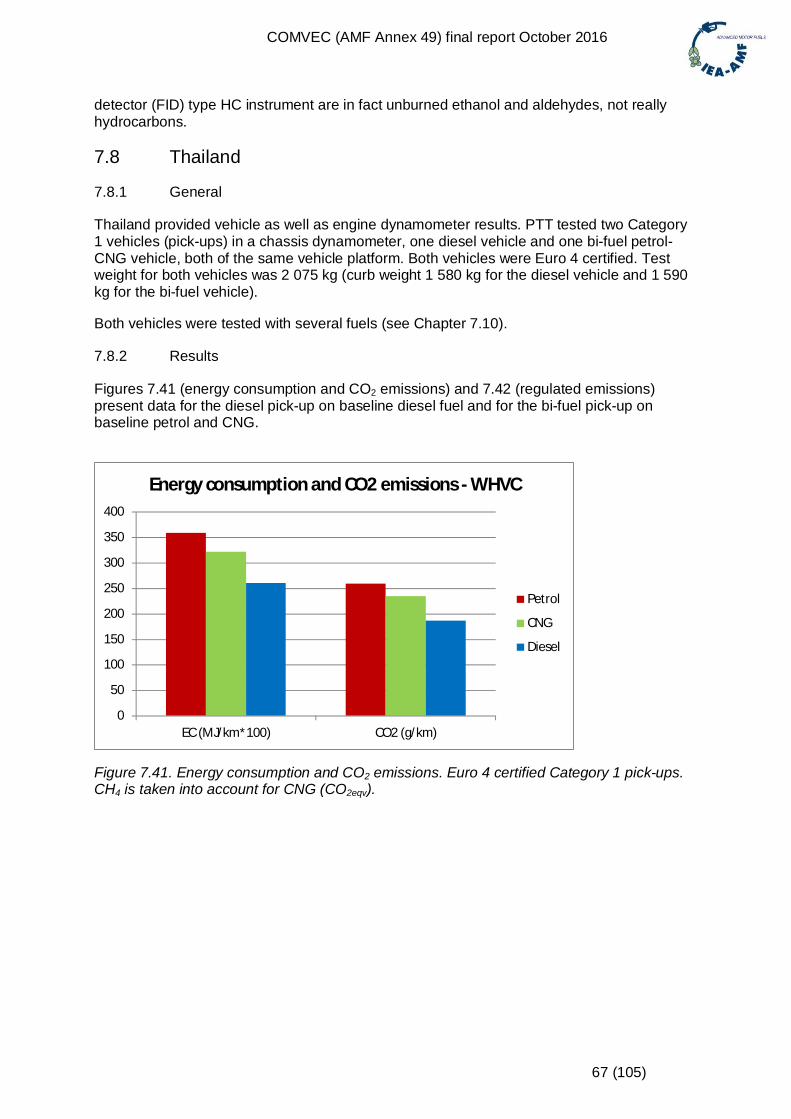
COMVEC (AMF Annex 49) final report October 2016
67 (105)
detector (FID) type HC instrument are in fact unburned ethanol and aldehydes, not reallyhydrocarbons.
7.8 Thailand
7.8.1 General
Thailand provided vehicle as well as engine dynamometer results. PTT tested two Category1 vehicles (pick-ups) in a chassis dynamometer, one diesel vehicle and one bi-fuel petrol-CNG vehicle, both of the same vehicle platform. Both vehicles were Euro 4 certified. Testweight for both vehicles was 2 075 kg (curb weight 1 580 kg for the diesel vehicle and 1 590kg for the bi-fuel vehicle).
Both vehicles were tested with several fuels (see Chapter 7.10).
7.8.2 Results
Figures 7.41 (energy consumption and CO2 emissions) and 7.42 (regulated emissions)present data for the diesel pick-up on baseline diesel fuel and for the bi-fuel pick-up onbaseline petrol and CNG.
Figure 7.41. Energy consumption and CO2 emissions. Euro 4 certified Category 1 pick-ups.CH4 is taken into account for CNG (CO2eqv).
0
50
100
150
200
250
300
350
400
EC (MJ/km*100) CO2 (g/km)
Energy consumption and CO2 emissions - WHVC
Petrol
CNG
Diesel
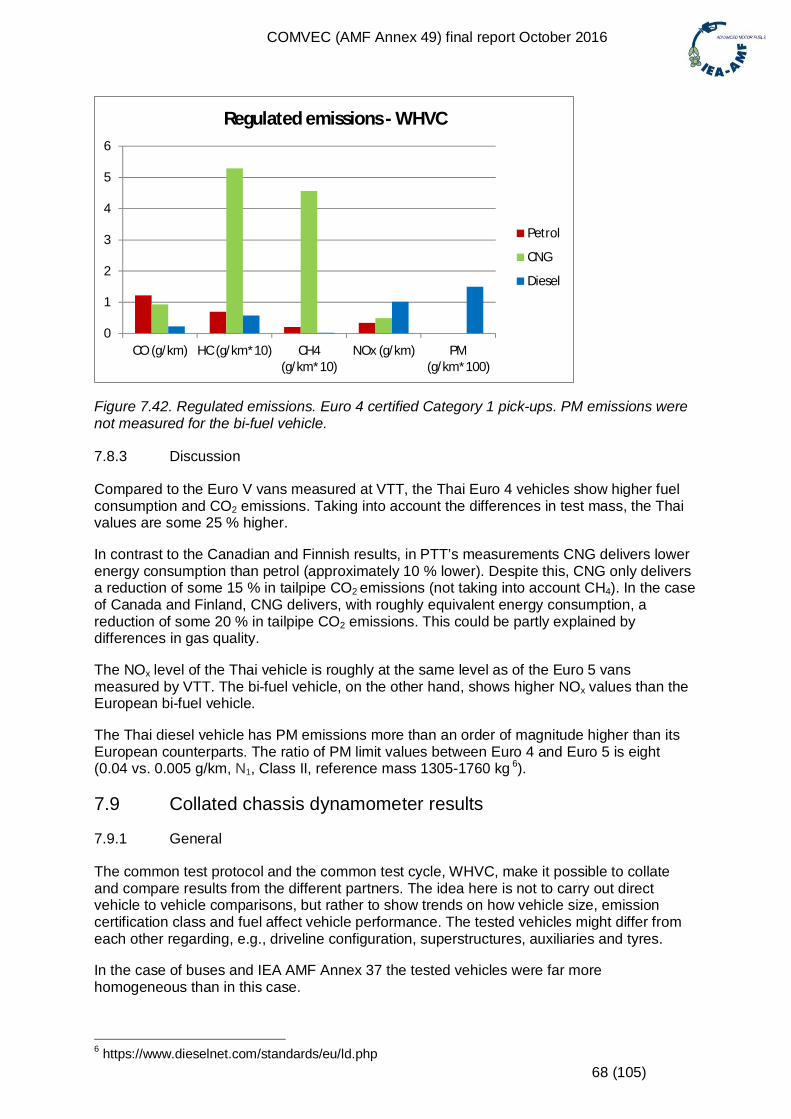
COMVEC (AMF Annex 49) final report October 2016
68 (105)
Figure 7.42. Regulated emissions. Euro 4 certified Category 1 pick-ups. PM emissions werenot measured for the bi-fuel vehicle.
7.8.3 Discussion
Compared to the Euro V vans measured at VTT, the Thai Euro 4 vehicles show higher fuelconsumption and CO2 emissions. Taking into account the differences in test mass, the Thaivalues are some 25 % higher.
In contrast to the Canadian and Finnish results, in PTT’s measurements CNG delivers lowerenergy consumption than petrol (approximately 10 % lower). Despite this, CNG only deliversa reduction of some 15 % in tailpipe CO2 emissions (not taking into account CH4). In the caseof Canada and Finland, CNG delivers, with roughly equivalent energy consumption, areduction of some 20 % in tailpipe CO2 emissions. This could be partly explained bydifferences in gas quality.
The NOx level of the Thai vehicle is roughly at the same level as of the Euro 5 vansmeasured by VTT. The bi-fuel vehicle, on the other hand, shows higher NOx values than theEuropean bi-fuel vehicle.
The Thai diesel vehicle has PM emissions more than an order of magnitude higher than itsEuropean counterparts. The ratio of PM limit values between Euro 4 and Euro 5 is eight(0.04 vs. 0.005 g/km, N1, Class II, reference mass 1305-1760 kg 6).
7.9 Collated chassis dynamometer results
7.9.1 General
The common test protocol and the common test cycle, WHVC, make it possible to collateand compare results from the different partners. The idea here is not to carry out directvehicle to vehicle comparisons, but rather to show trends on how vehicle size, emissioncertification class and fuel affect vehicle performance. The tested vehicles might differ fromeach other regarding, e.g., driveline configuration, superstructures, auxiliaries and tyres.
In the case of buses and IEA AMF Annex 37 the tested vehicles were far morehomogeneous than in this case.
6 https://www.dieselnet.com/standards/eu/ld.php
0
1
2
3
4
5
6
CO (g/km) HC (g/km*10) CH4(g/km*10)
NOx (g/km) PM(g/km*100)
Regulated emissions - WHVC
Petrol
CNG
Diesel
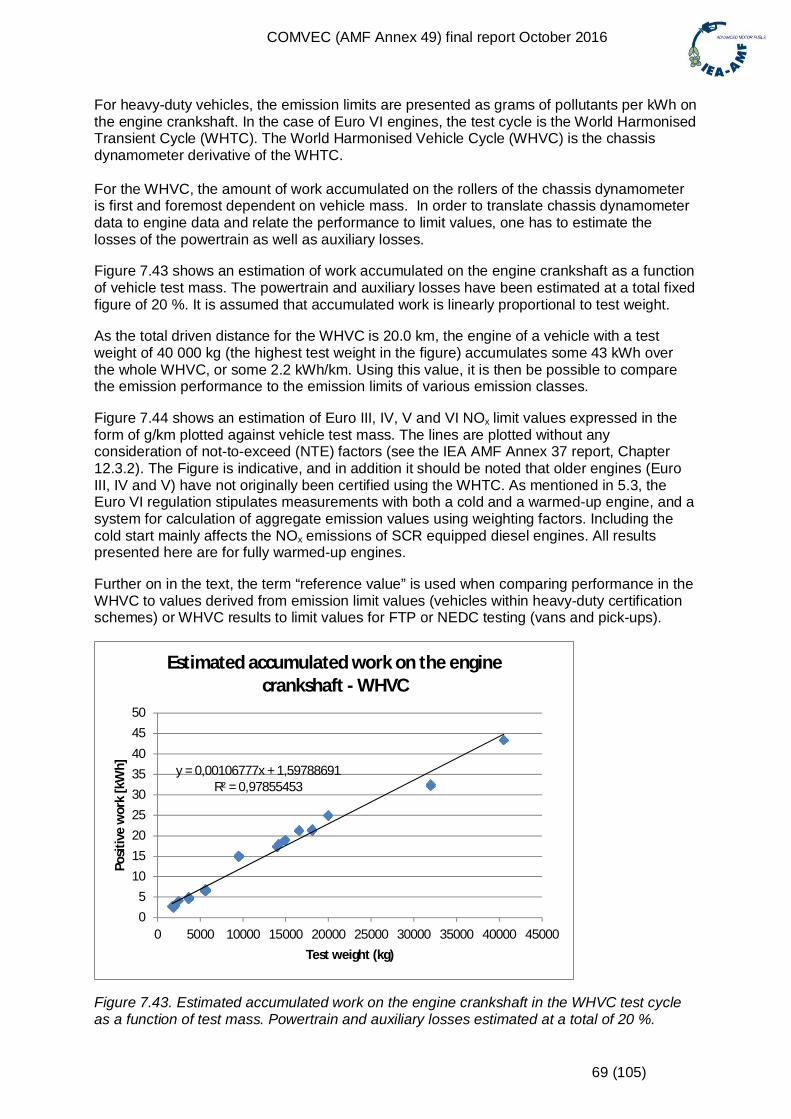
COMVEC (AMF Annex 49) final report October 2016
69 (105)
For heavy-duty vehicles, the emission limits are presented as grams of pollutants per kWh onthe engine crankshaft. In the case of Euro VI engines, the test cycle is the World HarmonisedTransient Cycle (WHTC). The World Harmonised Vehicle Cycle (WHVC) is the chassisdynamometer derivative of the WHTC.
For the WHVC, the amount of work accumulated on the rollers of the chassis dynamometeris first and foremost dependent on vehicle mass. In order to translate chassis dynamometerdata to engine data and relate the performance to limit values, one has to estimate thelosses of the powertrain as well as auxiliary losses.
Figure 7.43 shows an estimation of work accumulated on the engine crankshaft as a functionof vehicle test mass. The powertrain and auxiliary losses have been estimated at a total fixedfigure of 20 %. It is assumed that accumulated work is linearly proportional to test weight.
As the total driven distance for the WHVC is 20.0 km, the engine of a vehicle with a testweight of 40 000 kg (the highest test weight in the figure) accumulates some 43 kWh overthe whole WHVC, or some 2.2 kWh/km. Using this value, it is then be possible to comparethe emission performance to the emission limits of various emission classes.
Figure 7.44 shows an estimation of Euro III, IV, V and VI NOx limit values expressed in theform of g/km plotted against vehicle test mass. The lines are plotted without anyconsideration of not-to-exceed (NTE) factors (see the IEA AMF Annex 37 report, Chapter12.3.2). The Figure is indicative, and in addition it should be noted that older engines (EuroIII, IV and V) have not originally been certified using the WHTC. As mentioned in 5.3, theEuro VI regulation stipulates measurements with both a cold and a warmed-up engine, and asystem for calculation of aggregate emission values using weighting factors. Including thecold start mainly affects the NOx emissions of SCR equipped diesel engines. All resultspresented here are for fully warmed-up engines.
Further on in the text, the term “reference value” is used when comparing performance in theWHVC to values derived from emission limit values (vehicles within heavy-duty certificationschemes) or WHVC results to limit values for FTP or NEDC testing (vans and pick-ups).
Figure 7.43. Estimated accumulated work on the engine crankshaft in the WHVC test cycleas a function of test mass. Powertrain and auxiliary losses estimated at a total of 20 %.
y = 0,00106777x + 1,59788691R² = 0,97855453
05
101520253035404550
0 5000 10000 15000 20000 25000 30000 35000 40000 45000
Posi
tive
wor
k[k
Wh]
Test weight (kg)
Estimated accumulated work on the enginecrankshaft - WHVC
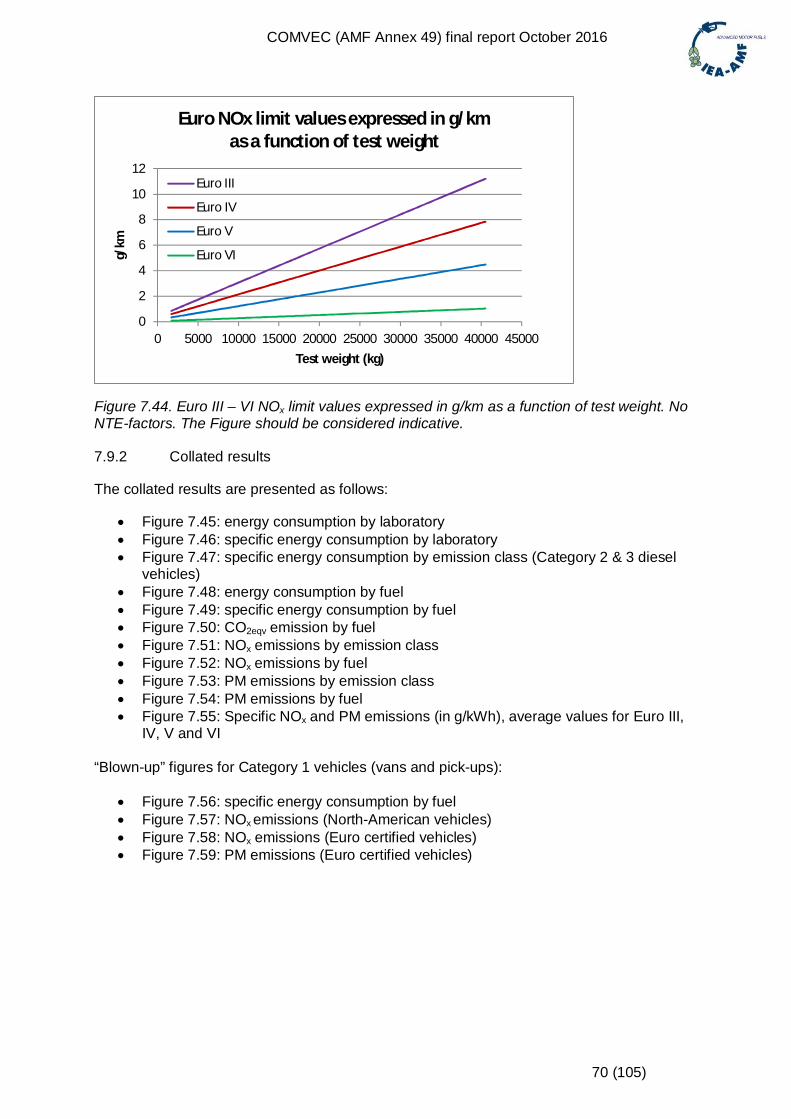
COMVEC (AMF Annex 49) final report October 2016
70 (105)
Figure 7.44. Euro III – VI NOx limit values expressed in g/km as a function of test weight. NoNTE-factors. The Figure should be considered indicative.
7.9.2 Collated results
The collated results are presented as follows:
Figure 7.45: energy consumption by laboratory Figure 7.46: specific energy consumption by laboratory Figure 7.47: specific energy consumption by emission class (Category 2 & 3 diesel
vehicles) Figure 7.48: energy consumption by fuel Figure 7.49: specific energy consumption by fuel Figure 7.50: CO2eqv emission by fuel Figure 7.51: NOx emissions by emission class Figure 7.52: NOx emissions by fuel Figure 7.53: PM emissions by emission class Figure 7.54: PM emissions by fuel Figure 7.55: Specific NOx and PM emissions (in g/kWh), average values for Euro III,
IV, V and VI
“Blown-up” figures for Category 1 vehicles (vans and pick-ups):
Figure 7.56: specific energy consumption by fuel Figure 7.57: NOx emissions (North-American vehicles) Figure 7.58: NOx emissions (Euro certified vehicles) Figure 7.59: PM emissions (Euro certified vehicles)
0
2
4
6
8
10
12
0 5000 10000 15000 20000 25000 30000 35000 40000 45000
g/km
Test weight (kg)
Euro NOx limit values expressed in g/kmas a function of test weight
Euro III
Euro IV
Euro V
Euro VI
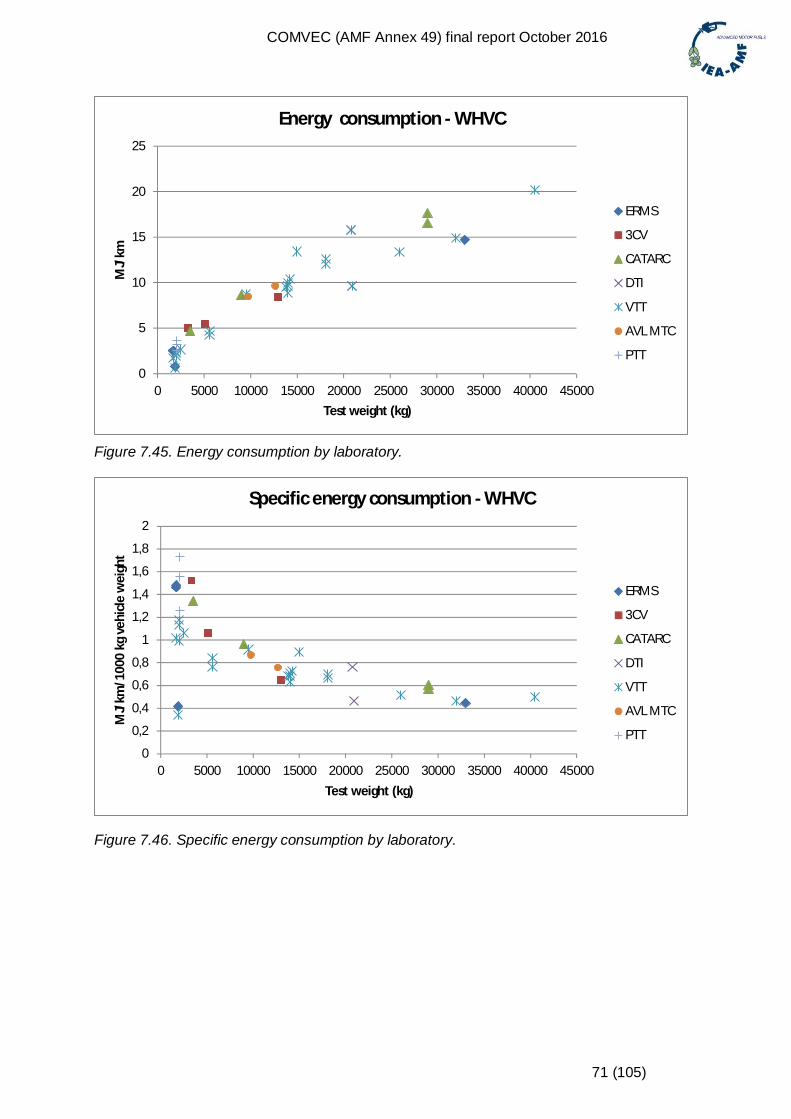
COMVEC (AMF Annex 49) final report October 2016
71 (105)
Figure 7.45. Energy consumption by laboratory.
Figure 7.46. Specific energy consumption by laboratory.
0
5
10
15
20
25
0 5000 10000 15000 20000 25000 30000 35000 40000 45000
MJ/
km
Test weight (kg)
Energy consumption - WHVC
ERMS
3CV
CATARC
DTI
VTT
AVL MTC
PTT
0
0,2
0,4
0,6
0,8
1
1,2
1,4
1,6
1,8
2
0 5000 10000 15000 20000 25000 30000 35000 40000 45000
MJ/
km/1
000
kgve
hicl
ew
eigh
t
Test weight (kg)
Specific energy consumption - WHVC
ERMS
3CV
CATARC
DTI
VTT
AVL MTC
PTT
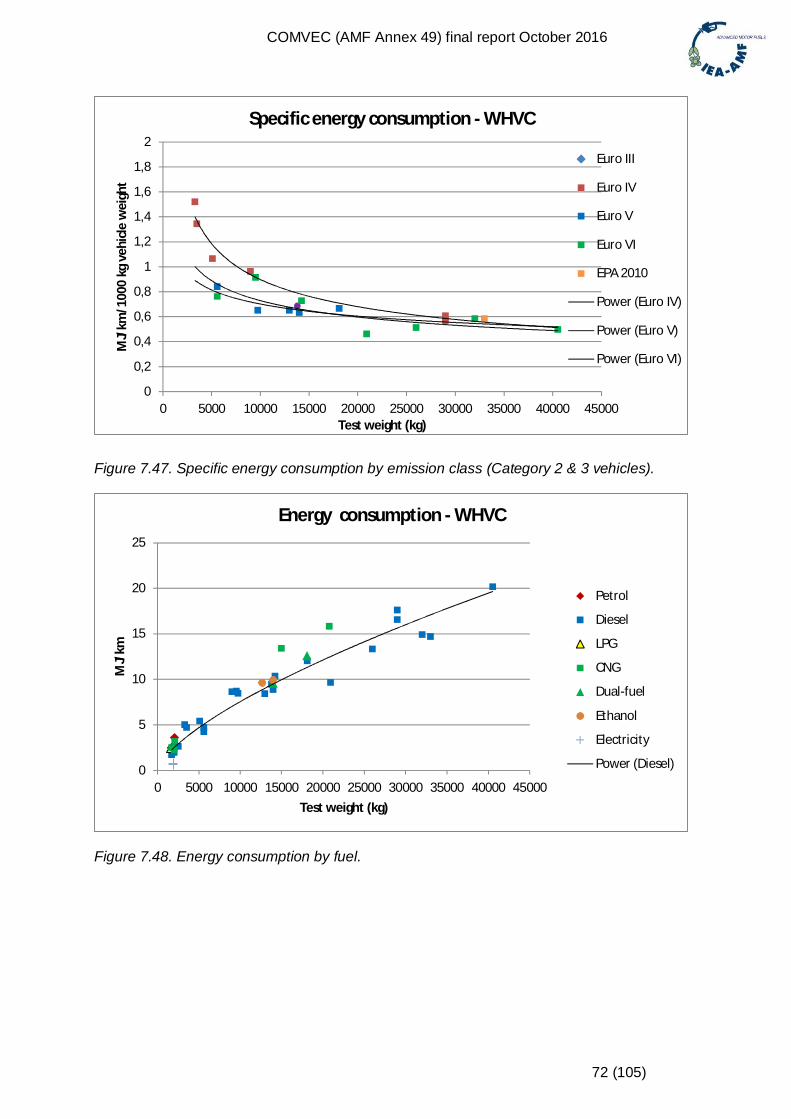
COMVEC (AMF Annex 49) final report October 2016
72 (105)
Figure 7.47. Specific energy consumption by emission class (Category 2 & 3 vehicles).
Figure 7.48. Energy consumption by fuel.
0
0,2
0,4
0,6
0,8
1
1,2
1,4
1,6
1,8
2
0 5000 10000 15000 20000 25000 30000 35000 40000 45000
MJ/
km/1
000
kgve
hicl
ew
eigh
t
Test weight (kg)
Specific energy consumption - WHVC
Euro III
Euro IV
Euro V
Euro VI
EPA 2010
Power (Euro IV)
Power (Euro V)
Power (Euro VI)
0
5
10
15
20
25
0 5000 10000 15000 20000 25000 30000 35000 40000 45000
MJ/
km
Test weight (kg)
Energy consumption - WHVC
Petrol
Diesel
LPG
CNG
Dual-fuel
Ethanol
Electricity
Power (Diesel)
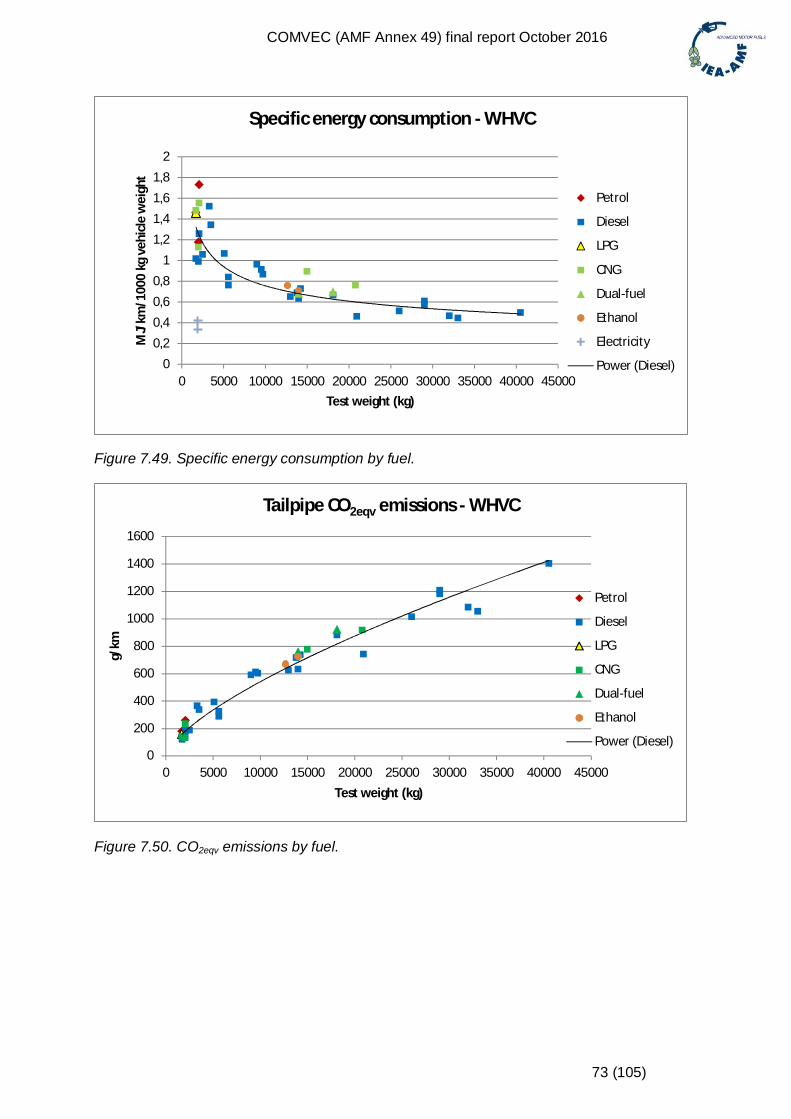
COMVEC (AMF Annex 49) final report October 2016
73 (105)
Figure 7.49. Specific energy consumption by fuel.
Figure 7.50. CO2eqv emissions by fuel.
00,20,40,60,8
11,21,41,61,8
2
0 5000 10000 15000 20000 25000 30000 35000 40000 45000
MJ/
km/1
000
kgve
hicl
ew
eigh
t
Test weight (kg)
Specific energy consumption - WHVC
Petrol
Diesel
LPG
CNG
Dual-fuel
Ethanol
Electricity
Power (Diesel)
0
200
400
600
800
1000
1200
1400
1600
0 5000 10000 15000 20000 25000 30000 35000 40000 45000
g/km
Test weight (kg)
Tailpipe CO2eqv emissions - WHVC
Petrol
Diesel
LPG
CNG
Dual-fuel
Ethanol
Power (Diesel)
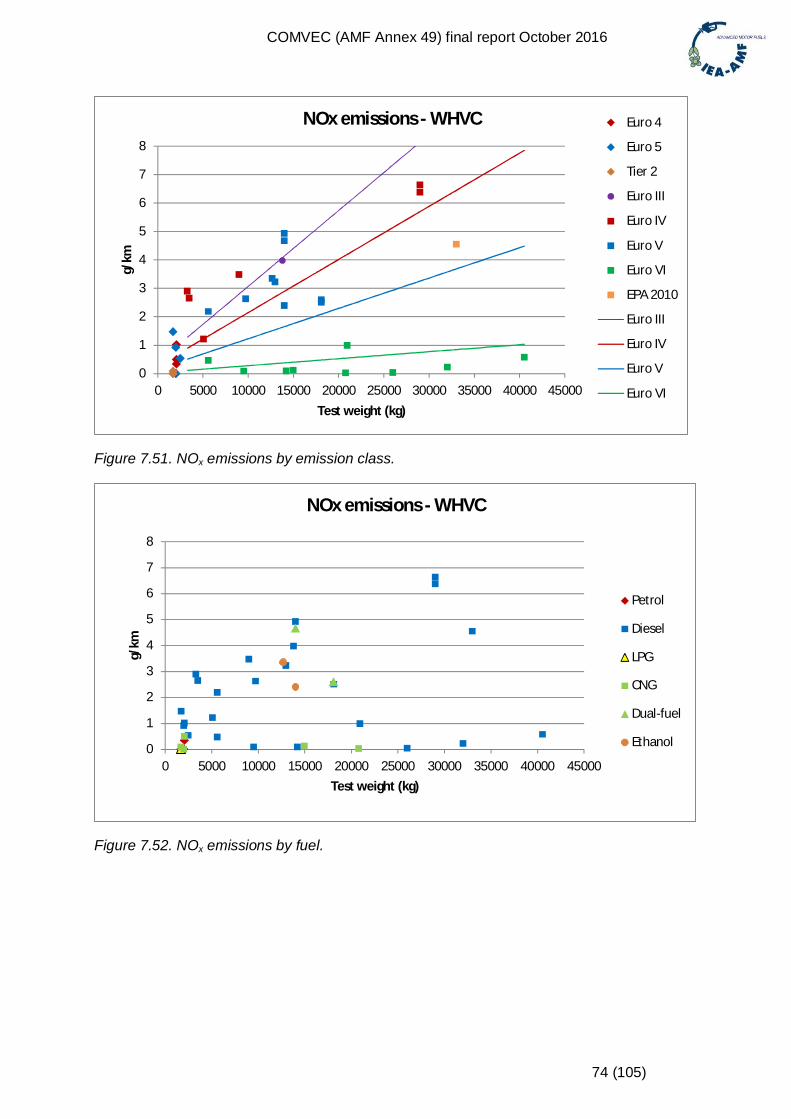
COMVEC (AMF Annex 49) final report October 2016
74 (105)
Figure 7.51. NOx emissions by emission class.
Figure 7.52. NOx emissions by fuel.
0
1
2
3
4
5
6
7
8
0 5000 10000 15000 20000 25000 30000 35000 40000 45000
g/km
Test weight (kg)
NOx emissions - WHVC Euro 4
Euro 5
Tier 2
Euro III
Euro IV
Euro V
Euro VI
EPA 2010
Euro III
Euro IV
Euro V
Euro VI
0
1
2
3
4
5
6
7
8
0 5000 10000 15000 20000 25000 30000 35000 40000 45000
g/km
Test weight (kg)
NOx emissions - WHVC
Petrol
Diesel
LPG
CNG
Dual-fuel
Ethanol
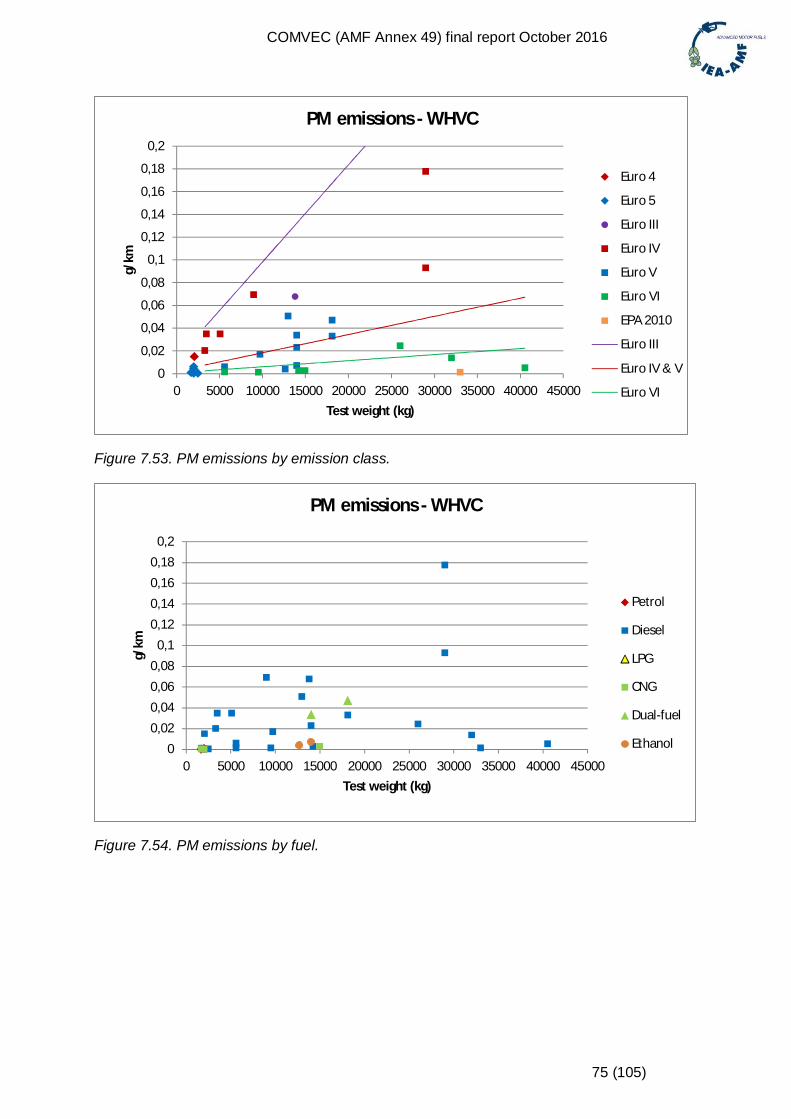
COMVEC (AMF Annex 49) final report October 2016
75 (105)
Figure 7.53. PM emissions by emission class.
Figure 7.54. PM emissions by fuel.
0
0,02
0,04
0,06
0,08
0,1
0,12
0,14
0,16
0,18
0,2
0 5000 10000 15000 20000 25000 30000 35000 40000 45000
g/km
Test weight (kg)
PM emissions - WHVC
Euro 4
Euro 5
Euro III
Euro IV
Euro V
Euro VI
EPA 2010
Euro III
Euro IV & V
Euro VI
00,020,040,060,08
0,10,120,140,160,18
0,2
0 5000 10000 15000 20000 25000 30000 35000 40000 45000
g/km
Test weight (kg)
PM emissions - WHVC
Petrol
Diesel
LPG
CNG
Dual-fuel
Ethanol
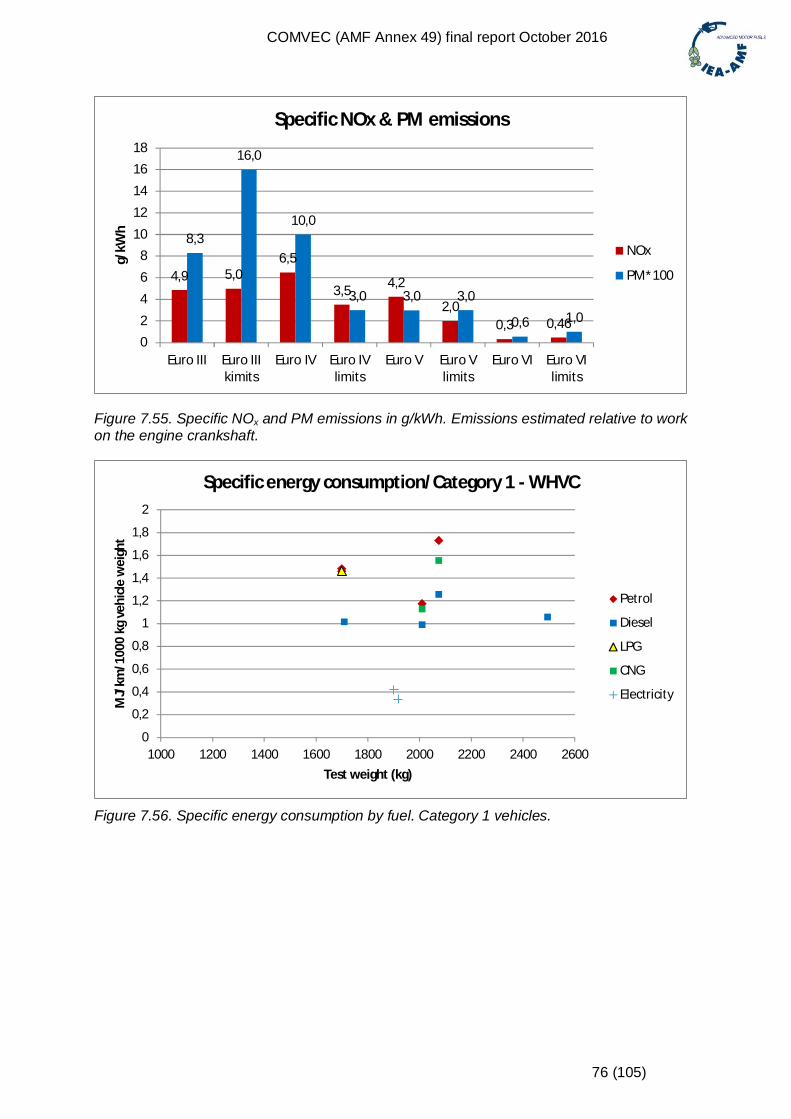
COMVEC (AMF Annex 49) final report October 2016
76 (105)
Figure 7.55. Specific NOx and PM emissions in g/kWh. Emissions estimated relative to workon the engine crankshaft.
Figure 7.56. Specific energy consumption by fuel. Category 1 vehicles.
4,9 5,06,5
3,5 4,2
2,00,3 0,46
8,3
16,0
10,0
3,0 3,0 3,0
0,6 1,0
02468
1012141618
Euro III Euro IIIkimits
Euro IV Euro IVlimits
Euro V Euro Vlimits
Euro VI Euro VIlimits
g/kW
hSpecific NOx & PM emissions
NOx
PM*100
0
0,2
0,4
0,6
0,8
1
1,2
1,4
1,6
1,8
2
1000 1200 1400 1600 1800 2000 2200 2400 2600
MJ/
km/1
000
kgve
hicl
ew
eigh
t
Test weight (kg)
Specific energy consumption/Category 1 - WHVC
Petrol
Diesel
LPG
CNG
Electricity
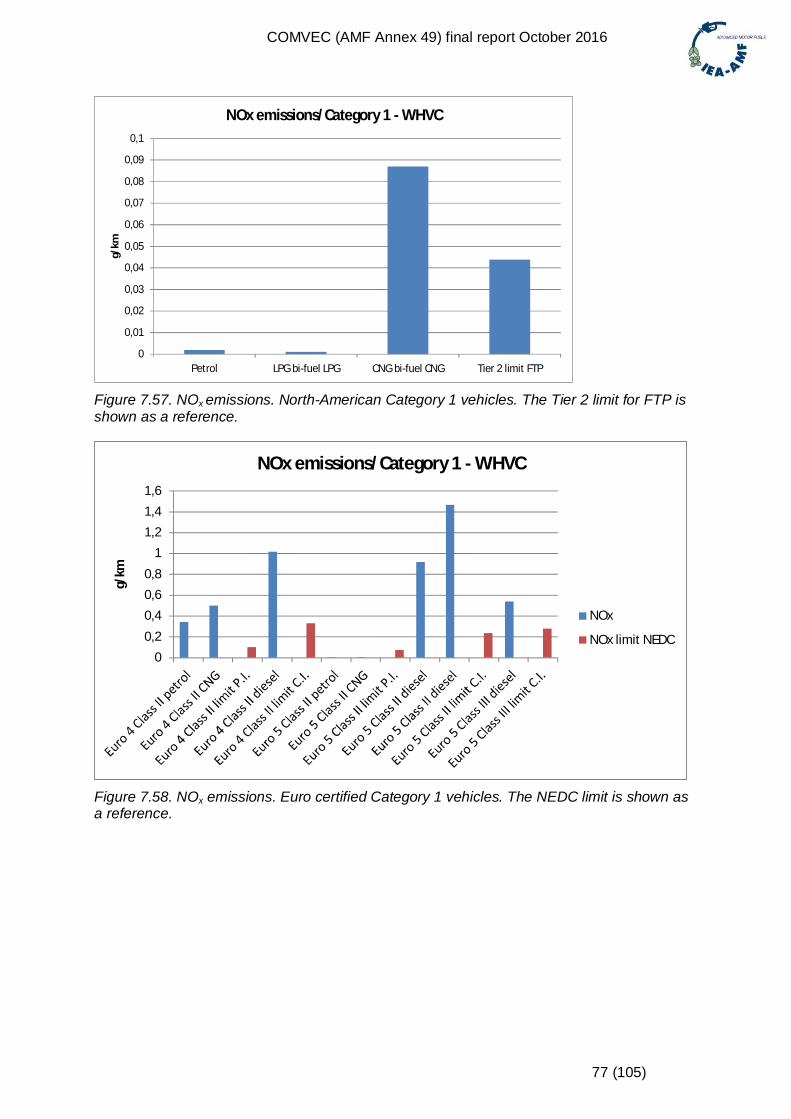
COMVEC (AMF Annex 49) final report October 2016
77 (105)
Figure 7.57. NOx emissions. North-American Category 1 vehicles. The Tier 2 limit for FTP isshown as a reference.
Figure 7.58. NOx emissions. Euro certified Category 1 vehicles. The NEDC limit is shown asa reference.
0
0,01
0,02
0,03
0,04
0,05
0,06
0,07
0,08
0,09
0,1
Petrol LPG bi-fuel LPG CNG bi-fuel CNG Tier 2 limit FTP
g/km
NOx emissions/Category 1 - WHVC
00,2
0,40,60,8
11,21,41,6
g/km
NOx emissions/Category 1 - WHVC
NOx
NOx limit NEDC
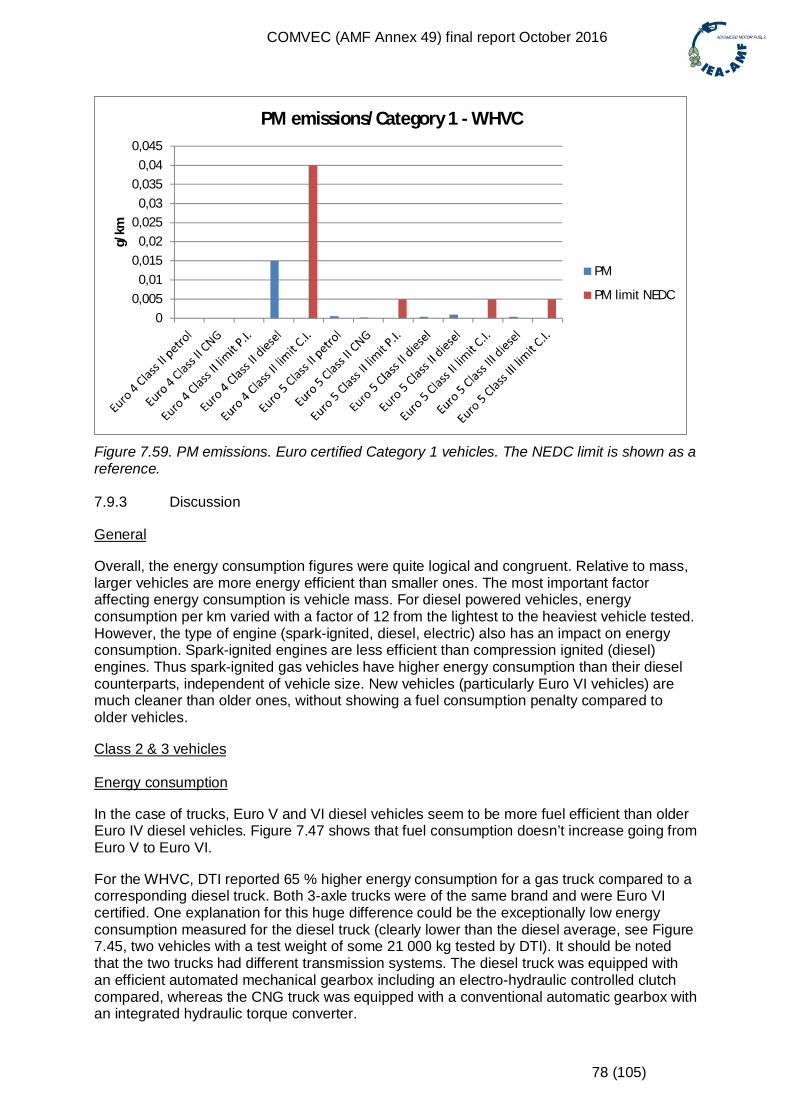
COMVEC (AMF Annex 49) final report October 2016
78 (105)
Figure 7.59. PM emissions. Euro certified Category 1 vehicles. The NEDC limit is shown as areference.
7.9.3 Discussion
General
Overall, the energy consumption figures were quite logical and congruent. Relative to mass,larger vehicles are more energy efficient than smaller ones. The most important factoraffecting energy consumption is vehicle mass. For diesel powered vehicles, energyconsumption per km varied with a factor of 12 from the lightest to the heaviest vehicle tested.However, the type of engine (spark-ignited, diesel, electric) also has an impact on energyconsumption. Spark-ignited engines are less efficient than compression ignited (diesel)engines. Thus spark-ignited gas vehicles have higher energy consumption than their dieselcounterparts, independent of vehicle size. New vehicles (particularly Euro VI vehicles) aremuch cleaner than older ones, without showing a fuel consumption penalty compared toolder vehicles.
Class 2 & 3 vehicles
Energy consumption
In the case of trucks, Euro V and VI diesel vehicles seem to be more fuel efficient than olderEuro IV diesel vehicles. Figure 7.47 shows that fuel consumption doesn’t increase going fromEuro V to Euro VI.
For the WHVC, DTI reported 65 % higher energy consumption for a gas truck compared to acorresponding diesel truck. Both 3-axle trucks were of the same brand and were Euro VIcertified. One explanation for this huge difference could be the exceptionally low energyconsumption measured for the diesel truck (clearly lower than the diesel average, see Figure7.45, two vehicles with a test weight of some 21 000 kg tested by DTI). It should be notedthat the two trucks had different transmission systems. The diesel truck was equipped withan efficient automated mechanical gearbox including an electro-hydraulic controlled clutchcompared, whereas the CNG truck was equipped with a conventional automatic gearbox withan integrated hydraulic torque converter.
00,005
0,010,015
0,020,025
0,030,035
0,040,045
g/km
PM emissions/Category 1 - WHVC
PM
PM limit NEDC
COMVEC (AMF Annex 49) final report October 2016
79 (105)
VTT tested a similar pair of vehicles (same manufacturer as in the case of DTI, Euro VIcertification, but in VTT’s case two-axle vehicles). According to VTT’s measurements, thegas vehicle consumed 23 % more energy than its diesel counterpart.
In VTT’s measurements for IEA AMF Annex 37, gas buses consumed 32 – 39 % moreenergy than their diesel counterparts in the Braunschweig cycle. The Braunschweig cycle ismore challenging than the WHVC and accentuates differences between spark-ignition anddiesel operation. For COMVEC, CATARC provided data for four diesel trucks and in additionfor three gas buses. Average specific energy consumption of the three gas buses tested with16 000 kg was 0.88 MJ/km/1000 kg vehicle weight. Average value for diesel vehicles at16 000 kg is 0.65 MJ/km/1000 kg vehicle weight, meaning that the Chinese gas buses on anaverage consume 35 % more energy in the WHVC than diesel vehicles.
Electric vehicles, on the other hand, are much more efficient than vehicles with internalcombustion engines. The energy consumption of EVs is some 30 - 40 % of that of ICEequipped vehicles.
Compression ignited ethanol and diesel dual fuel vehicles deliver energy efficiency that isequivalent to diesel.
Tailpipe CO2 emissions
As can be seen in Figure 7.50, variations in tailpipe CO2 emissions are rather small. Electricvehicles are naturally an exception, as they emit no local emissions. The values for theethanol fuelled vehicles are almost identical to average diesel values. In the case of methanefuelled vehicles, favourable fuel chemistry partly compensates for the lower engine efficiencyand, on an average, tailpipe CO2 emissions of CNG vehicles are close to those of dieselvehicles.
NOx emissions
Really huge differences can be found for both NOx and PM emissions. In the case of NOx,specific emission rates varied from less than 0.001 to 0.9 g/km/1000 kg vehicle weight, forPM the range is 0.001 to 0.13 g/km/1000 kg vehicle weight.
Seven out of nine Euro VI certified heavy-duty vehicles delivered NOx emissions below theexpected Euro VI reference level. The two remaining vehicles had a NOx level that wasroughly 2 – 2.5 higher than the expected Euro VI limit. The highest relative value, estimatedat some 1.2 g/kWh on the engine crankshaft, was for a hybrid vehicle. As stated previously,no not-to-exceed factors were applied but, on the other hand, the measured data is forfully warmed-up engines.
Figure 7.51 shows that all Euro IV and Euro V vehicles had higher NOx emissions thanshould be expected. Some Euro IV and Euro V vehicles even had NOx emissions above theEuro III level. The only Euro III vehicle that was measured delivered true Euro IIIperformance. Only one North-American EPA 2010 heavy-duty truck was measured. The NOxemission of this vehicle corresponded to Euro V level.
The conclusion that can be drawn from Figure 7.50 is that in the case of diesel vehicles,going from Euro III to Euro IV or Euro V doesn’t necessarily bring about reductions in NOxemissions. Only Euro VI vehicles deliver truly low NOx emissions.
Figure 7.52 shows NOx emissions by fuel. The conclusions drawn from this Figure are:
Huge spread for diesel vehicles Very low emissions for spark-ignited CNG Diesel dual-fuel and ethanol delivered average NOx emissions Emission class is more decisive than fuel
COMVEC (AMF Annex 49) final report October 2016
80 (105)
Particle emissions
Regarding particle emissions, the overall situation is somewhat more positive than in thecase of NOx. All vehicles delivered particle emissions lower than the Euro III level. The EuroIV vehicles had PM emissions in between Euro III and the combined Euro IV/V level. On anaverage, the Euro V certified diesel vehicles had PM emissions close to the Euro V level. Sixout of seven Euro VI certified vehicles delivered PM emissions below the Euro VI level. DTIdidn’t measure particle mass emissions, therefore two results less than in the case of NOx.The EPA 2010 certified North-American truck delivered extremely low PM emissions.
Fuel affects PM emissions. Spark-ignited natural gas delivers very low PM emissions. Thetwo ethanol trucks tested, although Euro V certified and without a particulate filter, deliveredEuro VI level particle emissions. As noted in 7.6, for both diesel dual-fuel trucks tested byVTT dual-fuel operation increased particle emissions. This phenomenon can be related to anunsophisticated DDF control system, not the fuel itself.
Summary of NOx and PM emissions
Figure 7.55 presents average NOx and PM emissions for Euro III, IV, V and VI relative towork on the engine crankshaft. The only Euro III truck measured delivered NOx at just belowthe reference value and PM emissions at some 50 % of the reference value. On an average,the Euro IV trucks measured had a NOx emission rate roughly two times higher than thereference value and a PM emissions three times higher than the reference value. Theaverage emissions of the Euro IV vehicles were higher than for the old Euro III truck. Asstated above for Euro V, the outcome is slightly better. Average NOx emission rate is stilltwice the reference values, but average PM emissions, on the other hand, equals the PMreference value. The average NOx and PM values of the Euro VI certified trucks were, on anaverage, some 60 - 70 % of the reference values.
Class 1 vehicles
General
The test matrix included four vehicle platforms with multiple fuel options:
ERMS of Canada tested petrol, LPG, CNG and electricity in the same vehicleplatform
VTT and PTT both tested one vehicle platform each with petrol, CNG and diesel In addition, VTT tested one platform with diesel and electricity
Energy consumption
For energy consumption (Figure 7.56) the following observations can be made:
The energy consumption of electric vehicles is some 30 – 40 % of that of ICEequipped vehicles
The measurements by ERMS showed equivalent energy consumption for petrol, LPGand CNG
The measurements by VTT and PTT showed a small efficiency benefit for CNG incomparison with petrol
Diesel is the most efficient option within ICE vehicles (15 – 30 % lower energyconsumption compared to petrol)
The vehicles for the European market seem to be more energy efficient than thevehicles for the Canadian and the Thai markets
COMVEC (AMF Annex 49) final report October 2016
81 (105)
NOx and PM emissions
In this case, the emission results obtained using the WHVC cycle are compared against Tier2 (FTP test cycle) and Euro (NEDC test cycle) limit values, which are used as referencecycles. One cannot draw direct conclusions regarding compliance from this comparison.Nevertheless, this gives some reference for the emission levels.
In general, spark-ignited engines deliver very low NOx and PM emissions. However, theCanadian measurements showed elevated NOx emissions for CNG operation in a bi-fuelvehicle, roughly two times higher than the Tier 2 limit value.
Thailand uses Euro emission regulations. The pick-ups tested by PTT had Euro 4certification. Both the spark-ignited bi-fuel pick-up and the diesel pick-up had NOx emissionssurpassing the Euro 4 level. However, the PM emission of the diesel vehicle was rather low,well below the Euro 4 reference level.
In the case of the Euro 5 certified vehicles for the European market, the outcome is divided.The one spark-ignited vehicle tested on both petrol and CNG delivers NOx values well belowthe reference value. However, all tested diesel vehicles (three vehicle platforms) have NOxemissions well above the reference level (six times higher in the worst case). However, thePM emissions of all measured Euro 5 vehicles were well below the reference value.
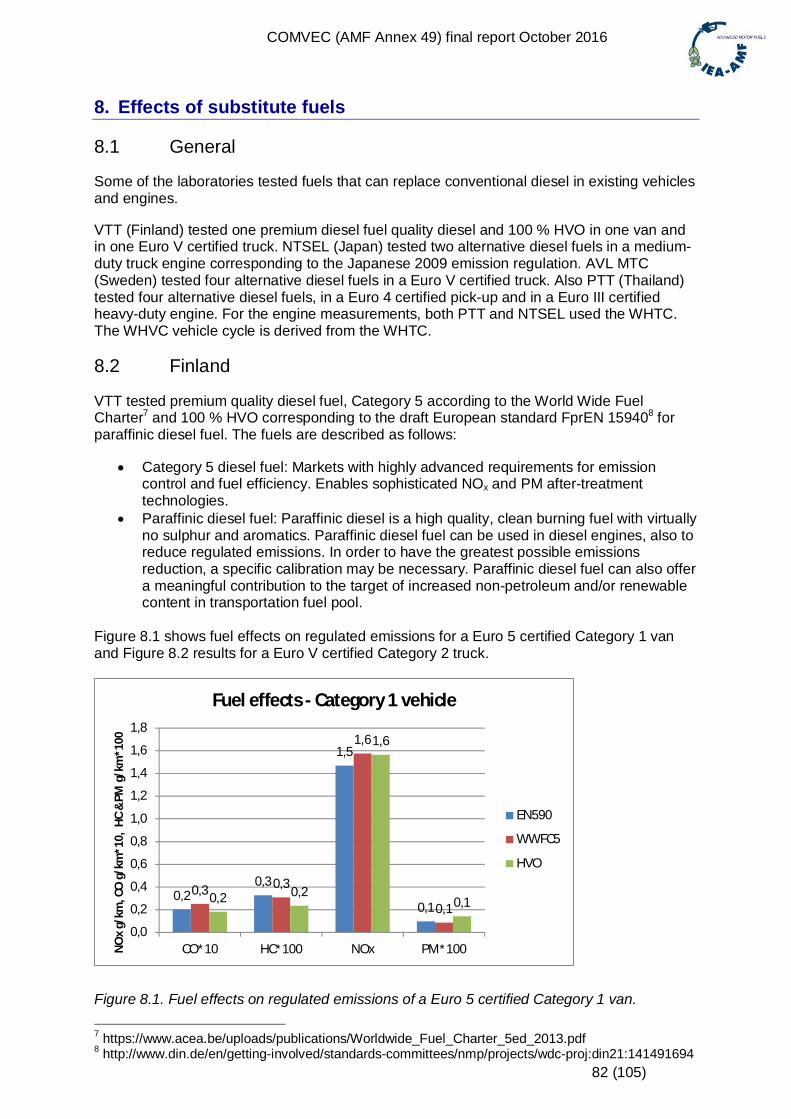
COMVEC (AMF Annex 49) final report October 2016
82 (105)
8. Effects of substitute fuels
8.1 General
Some of the laboratories tested fuels that can replace conventional diesel in existing vehiclesand engines.
VTT (Finland) tested one premium diesel fuel quality diesel and 100 % HVO in one van andin one Euro V certified truck. NTSEL (Japan) tested two alternative diesel fuels in a medium-duty truck engine corresponding to the Japanese 2009 emission regulation. AVL MTC(Sweden) tested four alternative diesel fuels in a Euro V certified truck. Also PTT (Thailand)tested four alternative diesel fuels, in a Euro 4 certified pick-up and in a Euro III certifiedheavy-duty engine. For the engine measurements, both PTT and NTSEL used the WHTC.The WHVC vehicle cycle is derived from the WHTC.
8.2 Finland
VTT tested premium quality diesel fuel, Category 5 according to the World Wide FuelCharter7 and 100 % HVO corresponding to the draft European standard FprEN 159408 forparaffinic diesel fuel. The fuels are described as follows:
Category 5 diesel fuel: Markets with highly advanced requirements for emissioncontrol and fuel efficiency. Enables sophisticated NOx and PM after-treatmenttechnologies.
Paraffinic diesel fuel: Paraffinic diesel is a high quality, clean burning fuel with virtuallyno sulphur and aromatics. Paraffinic diesel fuel can be used in diesel engines, also toreduce regulated emissions. In order to have the greatest possible emissionsreduction, a specific calibration may be necessary. Paraffinic diesel fuel can also offera meaningful contribution to the target of increased non-petroleum and/or renewablecontent in transportation fuel pool.
Figure 8.1 shows fuel effects on regulated emissions for a Euro 5 certified Category 1 vanand Figure 8.2 results for a Euro V certified Category 2 truck.
Figure 8.1. Fuel effects on regulated emissions of a Euro 5 certified Category 1 van.
7 https://www.acea.be/uploads/publications/Worldwide_Fuel_Charter_5ed_2013.pdf8 http://www.din.de/en/getting-involved/standards-committees/nmp/projects/wdc-proj:din21:141491694
0,20,3
1,5
0,10,3 0,3
1,6
0,10,2 0,2
1,6
0,1
0,0
0,2
0,4
0,6
0,8
1,0
1,2
1,4
1,6
1,8
CO*10 HC*100 NOx PM*100NO
xg/
km,C
Og/
km*1
0,H
C&
PMg/
km*1
00
Fuel effects - Category 1 vehicle
EN590
WWFC5
HVO
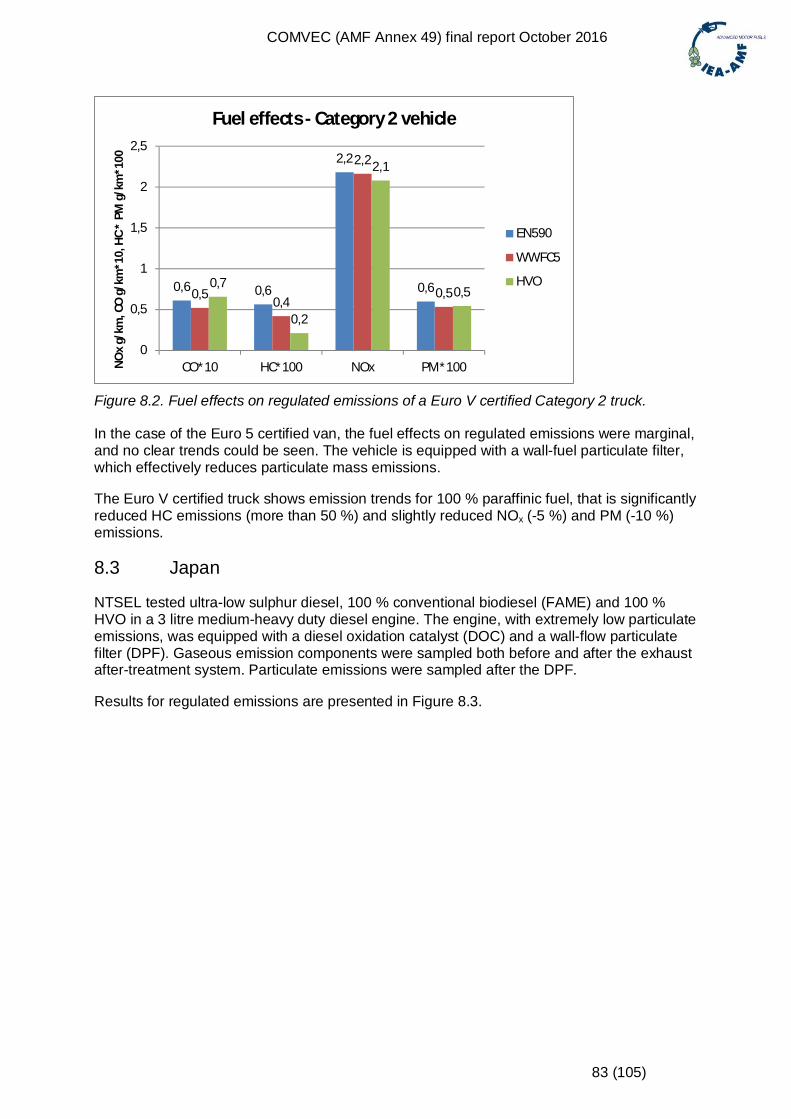
COMVEC (AMF Annex 49) final report October 2016
83 (105)
Figure 8.2. Fuel effects on regulated emissions of a Euro V certified Category 2 truck.
In the case of the Euro 5 certified van, the fuel effects on regulated emissions were marginal,and no clear trends could be seen. The vehicle is equipped with a wall-fuel particulate filter,which effectively reduces particulate mass emissions.
The Euro V certified truck shows emission trends for 100 % paraffinic fuel, that is significantlyreduced HC emissions (more than 50 %) and slightly reduced NOx (-5 %) and PM (-10 %)emissions.
8.3 Japan
NTSEL tested ultra-low sulphur diesel, 100 % conventional biodiesel (FAME) and 100 %HVO in a 3 litre medium-heavy duty diesel engine. The engine, with extremely low particulateemissions, was equipped with a diesel oxidation catalyst (DOC) and a wall-flow particulatefilter (DPF). Gaseous emission components were sampled both before and after the exhaustafter-treatment system. Particulate emissions were sampled after the DPF.
Results for regulated emissions are presented in Figure 8.3.
0,6 0,6
2,2
0,60,5 0,4
2,2
0,50,7
0,2
2,1
0,5
0
0,5
1
1,5
2
2,5
CO*10 HC*100 NOx PM*100NO
xg/
km,C
Og/
km*1
0,H
C*
PMg/
km*1
00Fuel effects - Category 2 vehicle
EN590
WWFC5
HVO
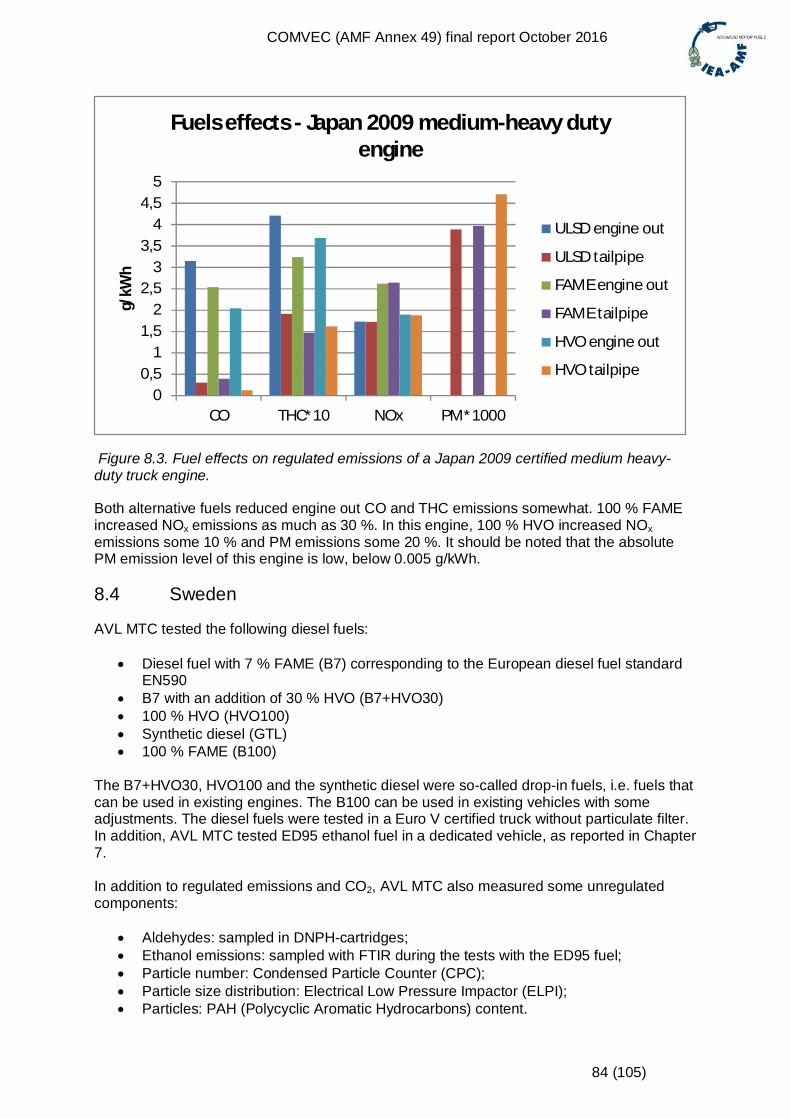
COMVEC (AMF Annex 49) final report October 2016
84 (105)
Figure 8.3. Fuel effects on regulated emissions of a Japan 2009 certified medium heavy-duty truck engine.
Both alternative fuels reduced engine out CO and THC emissions somewhat. 100 % FAMEincreased NOx emissions as much as 30 %. In this engine, 100 % HVO increased NOxemissions some 10 % and PM emissions some 20 %. It should be noted that the absolutePM emission level of this engine is low, below 0.005 g/kWh.
8.4 Sweden
AVL MTC tested the following diesel fuels:
Diesel fuel with 7 % FAME (B7) corresponding to the European diesel fuel standardEN590
B7 with an addition of 30 % HVO (B7+HVO30) 100 % HVO (HVO100) Synthetic diesel (GTL) 100 % FAME (B100)
The B7+HVO30, HVO100 and the synthetic diesel were so-called drop-in fuels, i.e. fuels thatcan be used in existing engines. The B100 can be used in existing vehicles with someadjustments. The diesel fuels were tested in a Euro V certified truck without particulate filter.In addition, AVL MTC tested ED95 ethanol fuel in a dedicated vehicle, as reported in Chapter7.
In addition to regulated emissions and CO2, AVL MTC also measured some unregulatedcomponents:
Aldehydes: sampled in DNPH-cartridges; Ethanol emissions: sampled with FTIR during the tests with the ED95 fuel; Particle number: Condensed Particle Counter (CPC); Particle size distribution: Electrical Low Pressure Impactor (ELPI); Particles: PAH (Polycyclic Aromatic Hydrocarbons) content.
00,5
11,5
22,5
33,5
44,5
5
CO THC*10 NOx PM*1000
g/kW
hFuels effects - Japan 2009 medium-heavy duty
engine
ULSD engine out
ULSD tailpipe
FAME engine out
FAME tailpipe
HVO engine out
HVO tailpipe
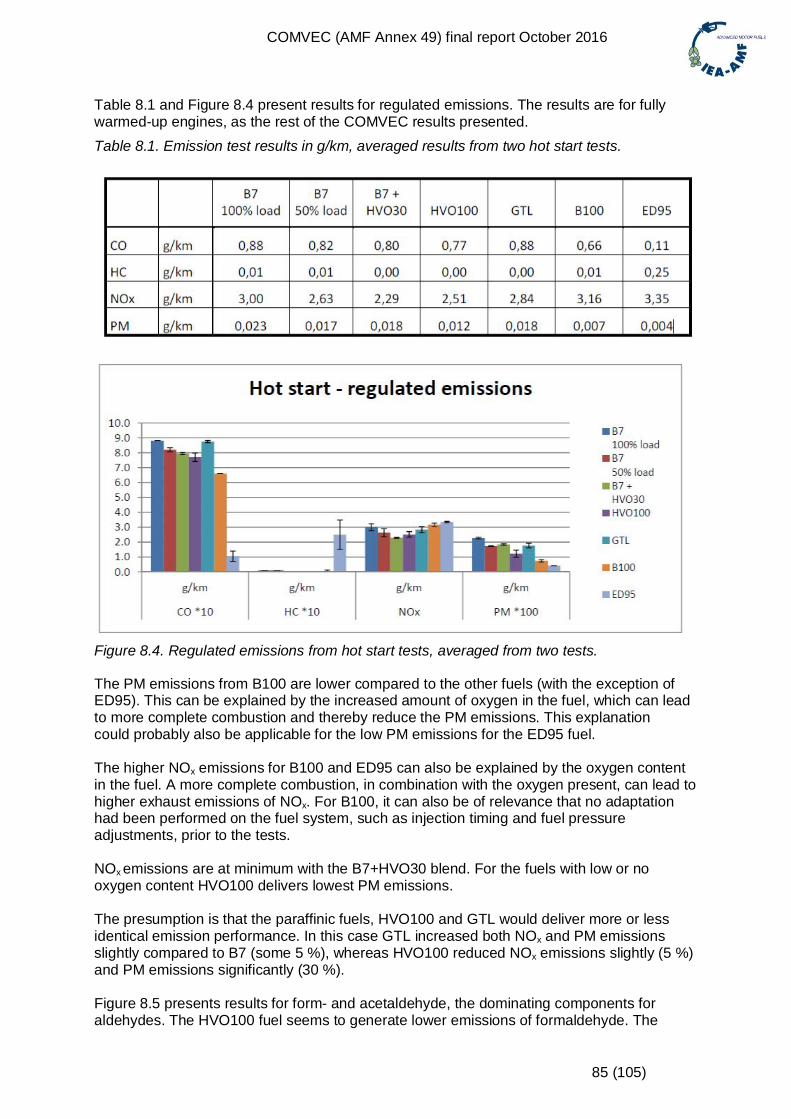
COMVEC (AMF Annex 49) final report October 2016
85 (105)
Table 8.1 and Figure 8.4 present results for regulated emissions. The results are for fullywarmed-up engines, as the rest of the COMVEC results presented.Table 8.1. Emission test results in g/km, averaged results from two hot start tests.
Figure 8.4. Regulated emissions from hot start tests, averaged from two tests.
The PM emissions from B100 are lower compared to the other fuels (with the exception ofED95). This can be explained by the increased amount of oxygen in the fuel, which can leadto more complete combustion and thereby reduce the PM emissions. This explanationcould probably also be applicable for the low PM emissions for the ED95 fuel.
The higher NOx emissions for B100 and ED95 can also be explained by the oxygen contentin the fuel. A more complete combustion, in combination with the oxygen present, can lead tohigher exhaust emissions of NOx. For B100, it can also be of relevance that no adaptationhad been performed on the fuel system, such as injection timing and fuel pressureadjustments, prior to the tests.
NOx emissions are at minimum with the B7+HVO30 blend. For the fuels with low or nooxygen content HVO100 delivers lowest PM emissions.
The presumption is that the paraffinic fuels, HVO100 and GTL would deliver more or lessidentical emission performance. In this case GTL increased both NOx and PM emissionsslightly compared to B7 (some 5 %), whereas HVO100 reduced NOx emissions slightly (5 %)and PM emissions significantly (30 %).
Figure 8.5 presents results for form- and acetaldehyde, the dominating components foraldehydes. The HVO100 fuel seems to generate lower emissions of formaldehyde. The
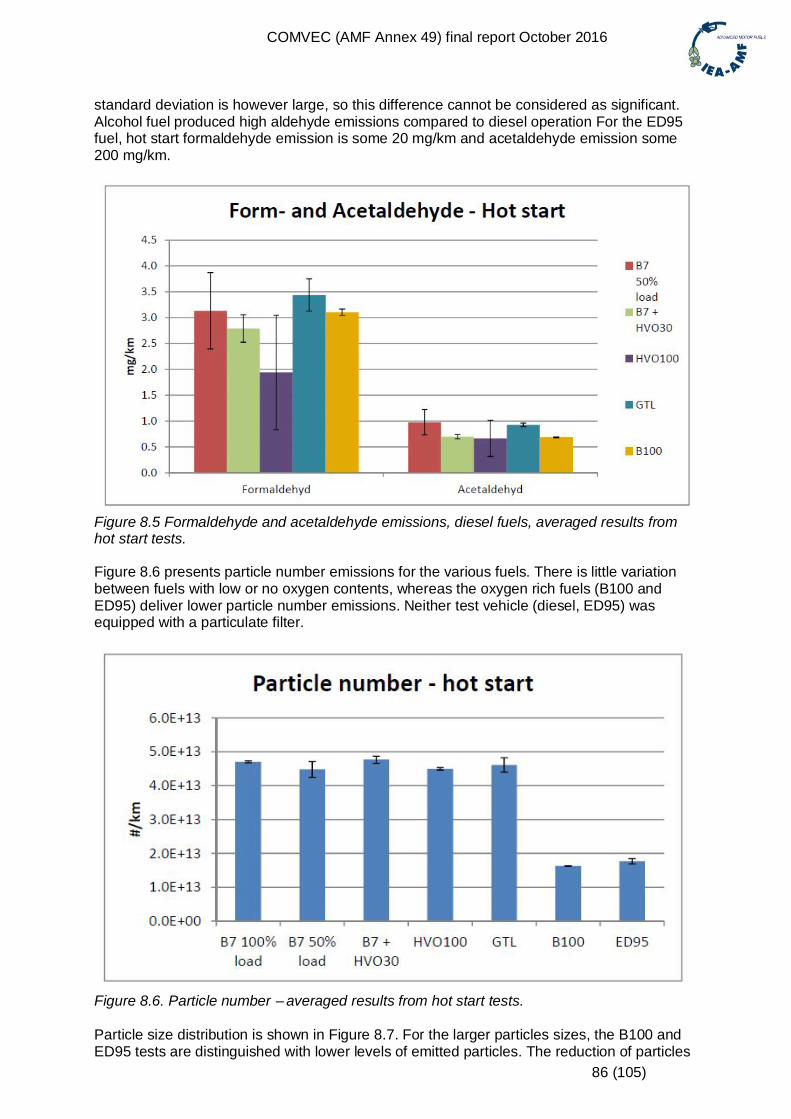
COMVEC (AMF Annex 49) final report October 2016
86 (105)
standard deviation is however large, so this difference cannot be considered as significant.Alcohol fuel produced high aldehyde emissions compared to diesel operation For the ED95fuel, hot start formaldehyde emission is some 20 mg/km and acetaldehyde emission some200 mg/km.
Figure 8.5 Formaldehyde and acetaldehyde emissions, diesel fuels, averaged results fromhot start tests.
Figure 8.6 presents particle number emissions for the various fuels. There is little variationbetween fuels with low or no oxygen contents, whereas the oxygen rich fuels (B100 andED95) deliver lower particle number emissions. Neither test vehicle (diesel, ED95) wasequipped with a particulate filter.
Figure 8.6. Particle number – averaged results from hot start tests.
Particle size distribution is shown in Figure 8.7. For the larger particles sizes, the B100 andED95 tests are distinguished with lower levels of emitted particles. The reduction of particles
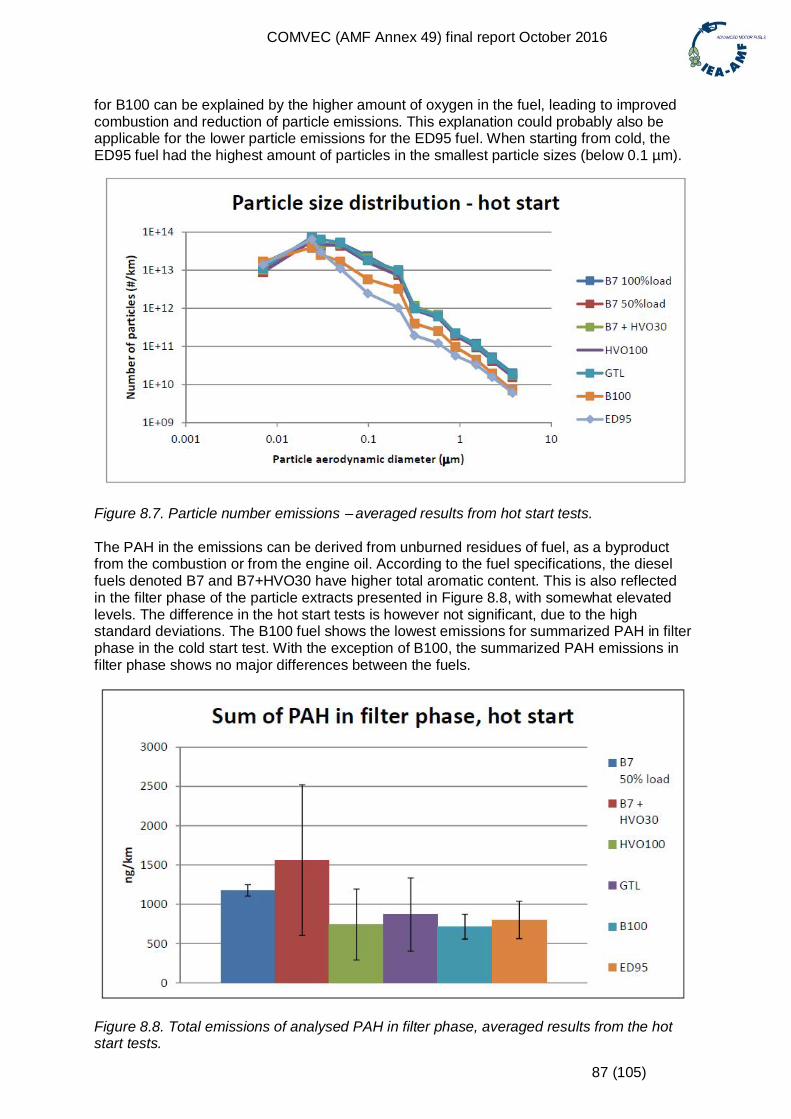
COMVEC (AMF Annex 49) final report October 2016
87 (105)
for B100 can be explained by the higher amount of oxygen in the fuel, leading to improvedcombustion and reduction of particle emissions. This explanation could probably also beapplicable for the lower particle emissions for the ED95 fuel. When starting from cold, theED95 fuel had the highest amount of particles in the smallest particle sizes (below 0.1 µm).
Figure 8.7. Particle number emissions – averaged results from hot start tests.
The PAH in the emissions can be derived from unburned residues of fuel, as a byproductfrom the combustion or from the engine oil. According to the fuel specifications, the dieselfuels denoted B7 and B7+HVO30 have higher total aromatic content. This is also reflectedin the filter phase of the particle extracts presented in Figure 8.8, with somewhat elevatedlevels. The difference in the hot start tests is however not significant, due to the highstandard deviations. The B100 fuel shows the lowest emissions for summarized PAH in filterphase in the cold start test. With the exception of B100, the summarized PAH emissions infilter phase shows no major differences between the fuels.
Figure 8.8. Total emissions of analysed PAH in filter phase, averaged results from the hotstart tests.
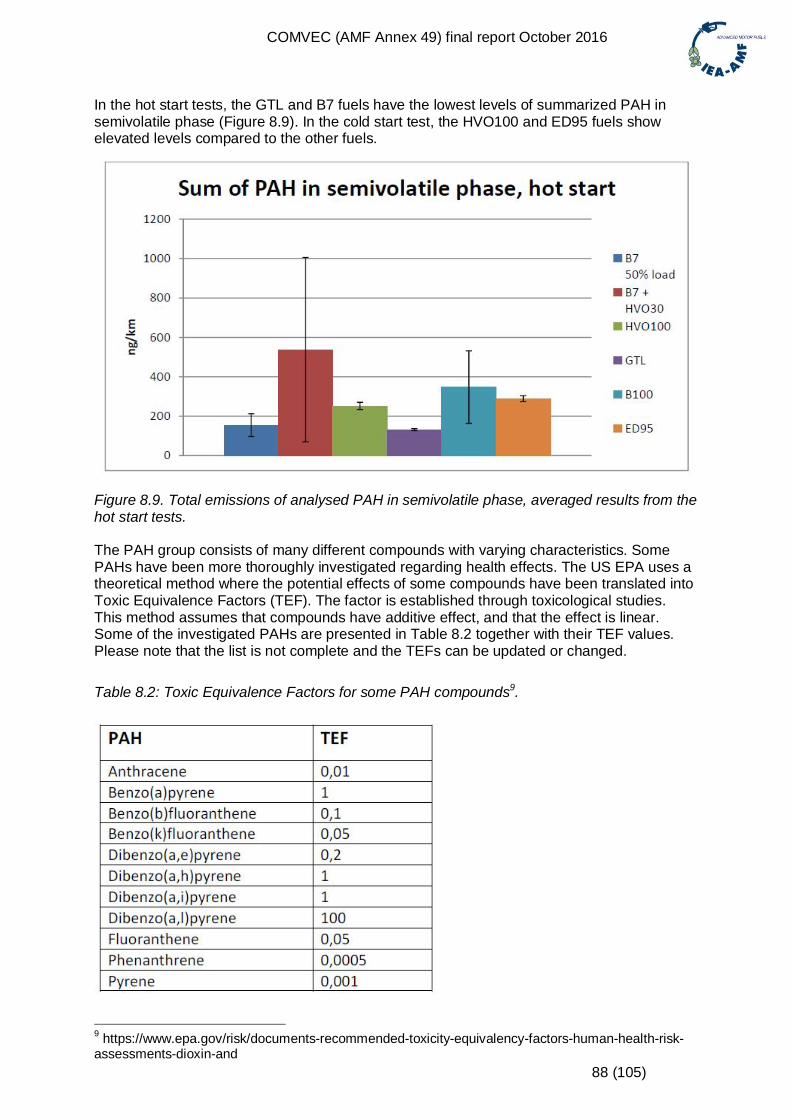
COMVEC (AMF Annex 49) final report October 2016
88 (105)
In the hot start tests, the GTL and B7 fuels have the lowest levels of summarized PAH insemivolatile phase (Figure 8.9). In the cold start test, the HVO100 and ED95 fuels showelevated levels compared to the other fuels.
Figure 8.9. Total emissions of analysed PAH in semivolatile phase, averaged results from thehot start tests.
The PAH group consists of many different compounds with varying characteristics. SomePAHs have been more thoroughly investigated regarding health effects. The US EPA uses atheoretical method where the potential effects of some compounds have been translated intoToxic Equivalence Factors (TEF). The factor is established through toxicological studies.This method assumes that compounds have additive effect, and that the effect is linear.Some of the investigated PAHs are presented in Table 8.2 together with their TEF values.Please note that the list is not complete and the TEFs can be updated or changed.
Table 8.2: Toxic Equivalence Factors for some PAH compounds9.
9 https://www.epa.gov/risk/documents-recommended-toxicity-equivalency-factors-human-health-risk-assessments-dioxin-and
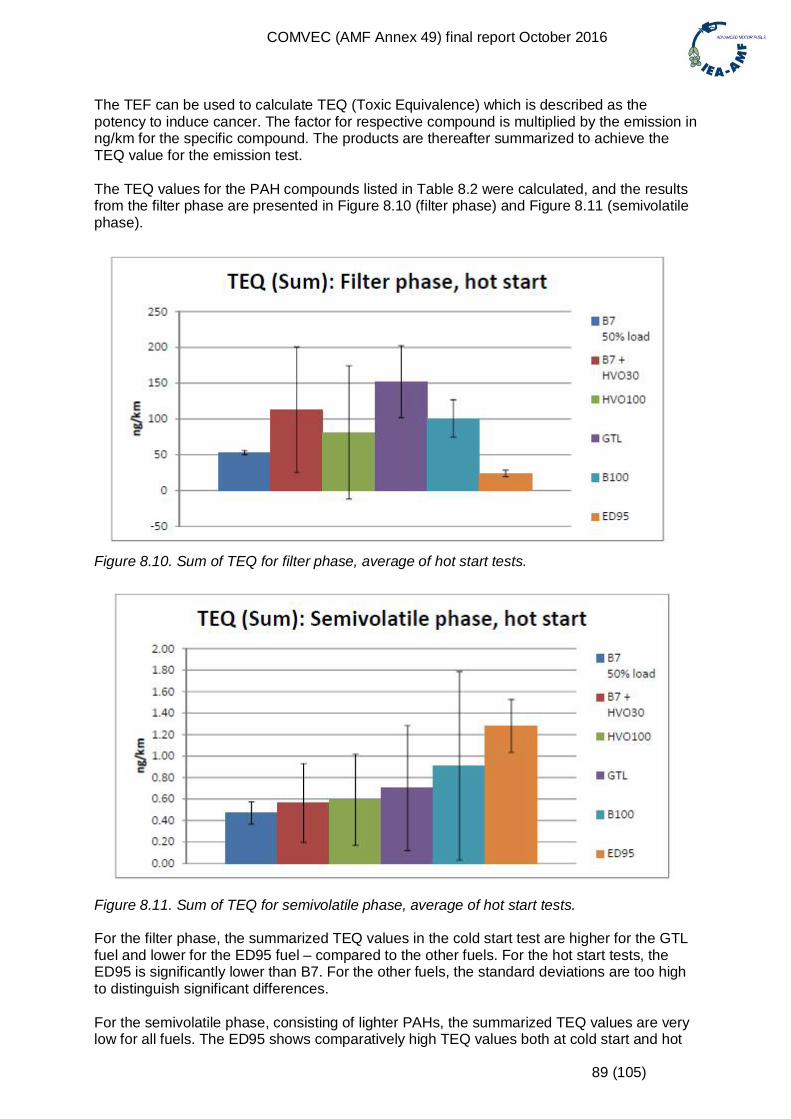
COMVEC (AMF Annex 49) final report October 2016
89 (105)
The TEF can be used to calculate TEQ (Toxic Equivalence) which is described as thepotency to induce cancer. The factor for respective compound is multiplied by the emission inng/km for the specific compound. The products are thereafter summarized to achieve theTEQ value for the emission test.
The TEQ values for the PAH compounds listed in Table 8.2 were calculated, and the resultsfrom the filter phase are presented in Figure 8.10 (filter phase) and Figure 8.11 (semivolatilephase).
Figure 8.10. Sum of TEQ for filter phase, average of hot start tests.
Figure 8.11. Sum of TEQ for semivolatile phase, average of hot start tests.
For the filter phase, the summarized TEQ values in the cold start test are higher for the GTLfuel and lower for the ED95 fuel – compared to the other fuels. For the hot start tests, theED95 is significantly lower than B7. For the other fuels, the standard deviations are too highto distinguish significant differences.
For the semivolatile phase, consisting of lighter PAHs, the summarized TEQ values are verylow for all fuels. The ED95 shows comparatively high TEQ values both at cold start and hot
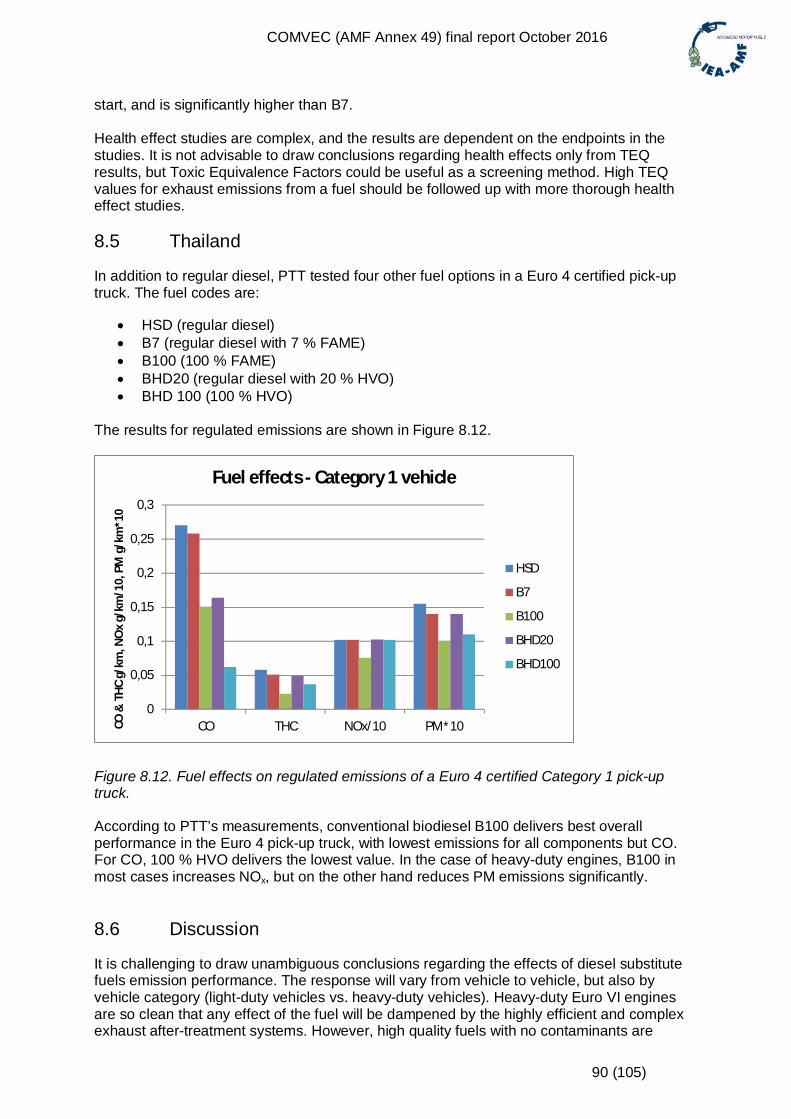
COMVEC (AMF Annex 49) final report October 2016
90 (105)
start, and is significantly higher than B7.
Health effect studies are complex, and the results are dependent on the endpoints in thestudies. It is not advisable to draw conclusions regarding health effects only from TEQresults, but Toxic Equivalence Factors could be useful as a screening method. High TEQvalues for exhaust emissions from a fuel should be followed up with more thorough healtheffect studies.
8.5 Thailand
In addition to regular diesel, PTT tested four other fuel options in a Euro 4 certified pick-uptruck. The fuel codes are:
HSD (regular diesel) B7 (regular diesel with 7 % FAME) B100 (100 % FAME) BHD20 (regular diesel with 20 % HVO) BHD 100 (100 % HVO)
The results for regulated emissions are shown in Figure 8.12.
Figure 8.12. Fuel effects on regulated emissions of a Euro 4 certified Category 1 pick-uptruck.
According to PTT’s measurements, conventional biodiesel B100 delivers best overallperformance in the Euro 4 pick-up truck, with lowest emissions for all components but CO.For CO, 100 % HVO delivers the lowest value. In the case of heavy-duty engines, B100 inmost cases increases NOx, but on the other hand reduces PM emissions significantly.
8.6 Discussion
It is challenging to draw unambiguous conclusions regarding the effects of diesel substitutefuels emission performance. The response will vary from vehicle to vehicle, but also byvehicle category (light-duty vehicles vs. heavy-duty vehicles). Heavy-duty Euro VI enginesare so clean that any effect of the fuel will be dampened by the highly efficient and complexexhaust after-treatment systems. However, high quality fuels with no contaminants are
0
0,05
0,1
0,15
0,2
0,25
0,3
CO THC NOx/10 PM*10CO&
THC
g/km
,NO
xg/
km/1
0,PM
g/km
*10
Fuel effects - Category 1 vehicle
HSD
B7
B100
BHD20
BHD100
COMVEC (AMF Annex 49) final report October 2016
91 (105)
prerequisites to guarantee performance and durability of the exhaust after-treatmentsystems.
As for pre-Euro VI heavy-duty vehicles, some general conclusions can notwithstanding bedrawn. Oxygen containing fuels tend to increase NOx emissions and decrease PM emissionscompared to regular diesel fuel. Paraffinic fuels, on the other hand, may deliver a slight (5 –10 %) reduction in NOx emissions in combination with a decent (up to 30 %) reduction in PMemissions.
In the case of light-duty vehicles, there is no clear trend for fuel effects on emissions.However, substituting regular diesel for 100 % paraffinic fuel seem to have marginal or nobenefits for regulated emissions.
The results from AVL MTC highlight that it is extremely difficult to access the health effects offuels. The ranking of the fuels depend on, e.g., what emission component is evaluated, forPAH emission whether it is the filter phase or the semivolatile phase which is being assessedand in addition how the vehicle is tested, does testing include cold start or not.
Going from old Euro I vehicles to Euro VI vehicles will reduce regulated emissions by morethan 95 %. It is clear that such massive reduction in emissions from efficient exhaust after-treatment systems will fade out most of the effects of fuel on exhaust emissions. However, inthe case of less sophisticated engines, a switch from conventional diesel fuel to chemicallysimple fuels like methane and paraffinic diesel may still bring about emission benefits.
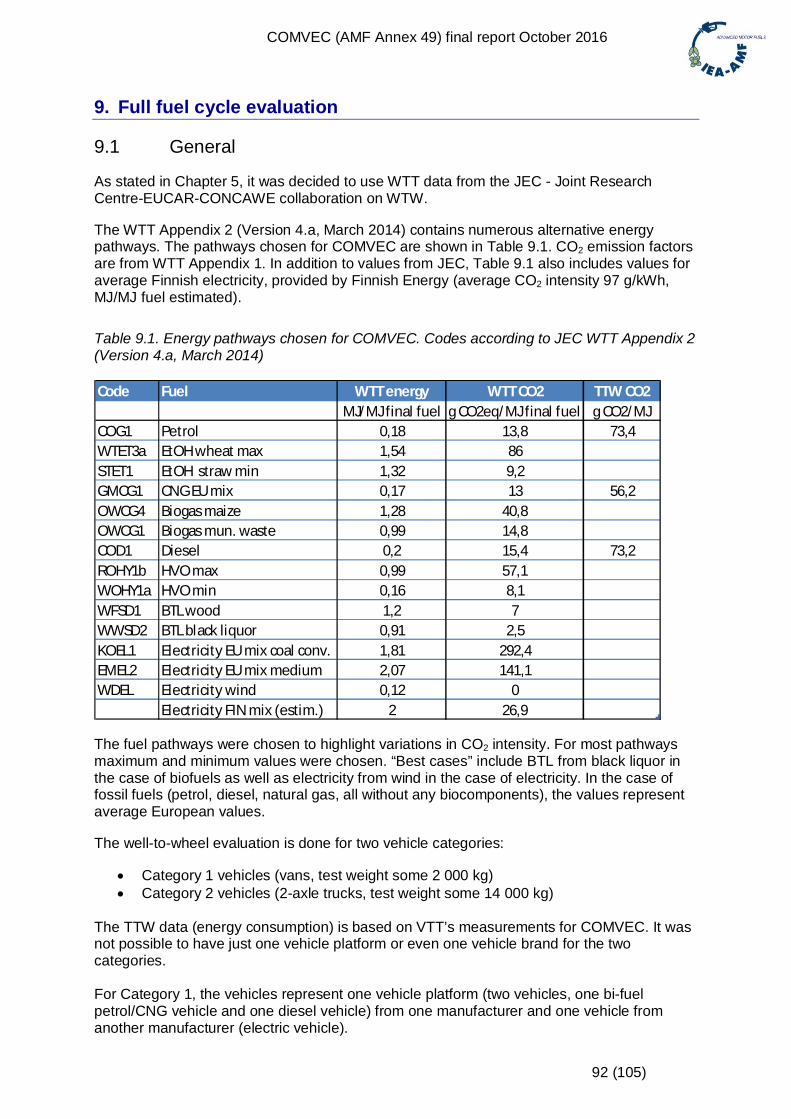
COMVEC (AMF Annex 49) final report October 2016
92 (105)
9. Full fuel cycle evaluation
9.1 General
As stated in Chapter 5, it was decided to use WTT data from the JEC - Joint ResearchCentre-EUCAR-CONCAWE collaboration on WTW.
The WTT Appendix 2 (Version 4.a, March 2014) contains numerous alternative energypathways. The pathways chosen for COMVEC are shown in Table 9.1. CO2 emission factorsare from WTT Appendix 1. In addition to values from JEC, Table 9.1 also includes values foraverage Finnish electricity, provided by Finnish Energy (average CO2 intensity 97 g/kWh,MJ/MJ fuel estimated).
Table 9.1. Energy pathways chosen for COMVEC. Codes according to JEC WTT Appendix 2(Version 4.a, March 2014)
The fuel pathways were chosen to highlight variations in CO2 intensity. For most pathwaysmaximum and minimum values were chosen. “Best cases” include BTL from black liquor inthe case of biofuels as well as electricity from wind in the case of electricity. In the case offossil fuels (petrol, diesel, natural gas, all without any biocomponents), the values representaverage European values.
The well-to-wheel evaluation is done for two vehicle categories:
Category 1 vehicles (vans, test weight some 2 000 kg) Category 2 vehicles (2-axle trucks, test weight some 14 000 kg)
The TTW data (energy consumption) is based on VTT’s measurements for COMVEC. It wasnot possible to have just one vehicle platform or even one vehicle brand for the twocategories.
For Category 1, the vehicles represent one vehicle platform (two vehicles, one bi-fuelpetrol/CNG vehicle and one diesel vehicle) from one manufacturer and one vehicle fromanother manufacturer (electric vehicle).
Code Fuel WTT energy WTT CO2 TTW CO2MJ/MJ final fuel g CO2eq/MJ final fuel g CO2/MJ
COG1 Petrol 0,18 13,8 73,4WTET3a EtOH wheat max 1,54 86STET1 EtOH straw min 1,32 9,2GMCG1 CNG EU mix 0,17 13 56,2OWCG4 Biogas maize 1,28 40,8OWCG1 Biogas mun. waste 0,99 14,8COD1 Diesel 0,2 15,4 73,2ROHY1b HVO max 0,99 57,1WOHY1a HVO min 0,16 8,1WFSD1 BTL wood 1,2 7WWSD2 BTL black liquor 0,91 2,5KOEL1 Electricity EU mix coal conv. 1,81 292,4EMEL2 Electricity EU mix medium 2,07 141,1WDEL Electricity wind 0,12 0
Electricity FIN mix (estim.) 2 26,9
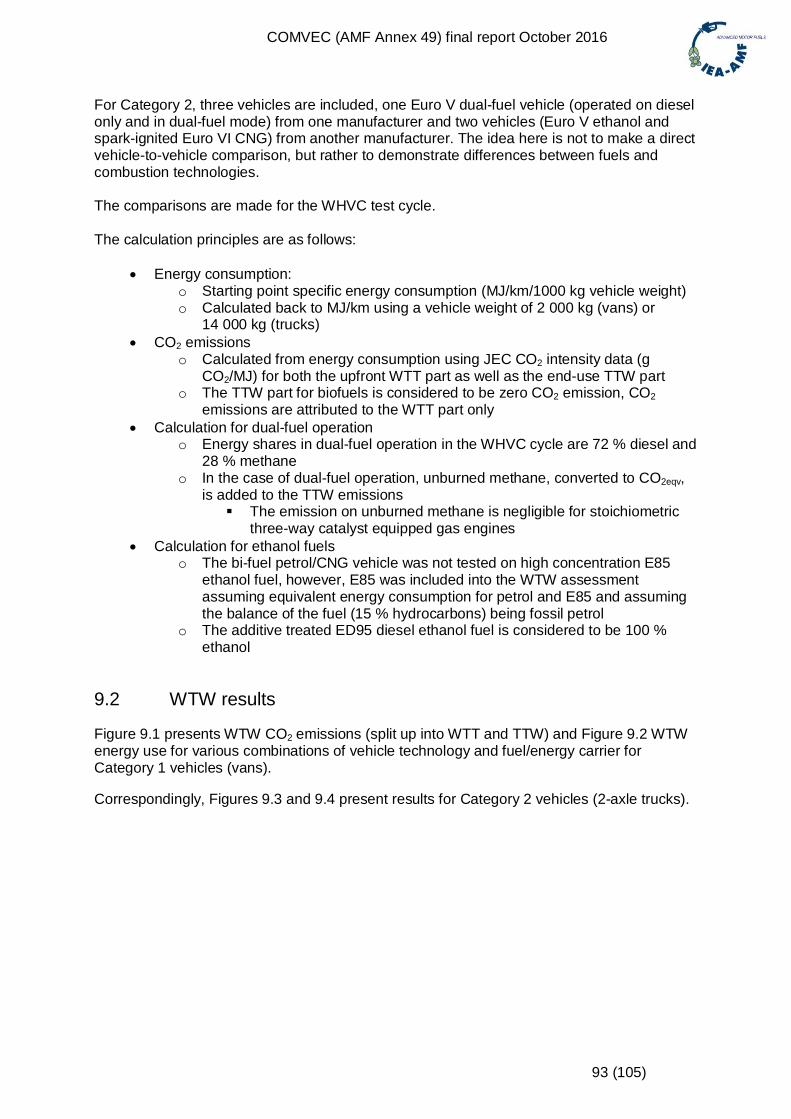
COMVEC (AMF Annex 49) final report October 2016
93 (105)
For Category 2, three vehicles are included, one Euro V dual-fuel vehicle (operated on dieselonly and in dual-fuel mode) from one manufacturer and two vehicles (Euro V ethanol andspark-ignited Euro VI CNG) from another manufacturer. The idea here is not to make a directvehicle-to-vehicle comparison, but rather to demonstrate differences between fuels andcombustion technologies.
The comparisons are made for the WHVC test cycle.
The calculation principles are as follows:
Energy consumption:o Starting point specific energy consumption (MJ/km/1000 kg vehicle weight)o Calculated back to MJ/km using a vehicle weight of 2 000 kg (vans) or
14 000 kg (trucks) CO2 emissions
o Calculated from energy consumption using JEC CO2 intensity data (gCO2/MJ) for both the upfront WTT part as well as the end-use TTW part
o The TTW part for biofuels is considered to be zero CO2 emission, CO2emissions are attributed to the WTT part only
Calculation for dual-fuel operationo Energy shares in dual-fuel operation in the WHVC cycle are 72 % diesel and
28 % methaneo In the case of dual-fuel operation, unburned methane, converted to CO2eqv,
is added to the TTW emissions The emission on unburned methane is negligible for stoichiometric
three-way catalyst equipped gas engines Calculation for ethanol fuels
o The bi-fuel petrol/CNG vehicle was not tested on high concentration E85ethanol fuel, however, E85 was included into the WTW assessmentassuming equivalent energy consumption for petrol and E85 and assumingthe balance of the fuel (15 % hydrocarbons) being fossil petrol
o The additive treated ED95 diesel ethanol fuel is considered to be 100 %ethanol
9.2 WTW results
Figure 9.1 presents WTW CO2 emissions (split up into WTT and TTW) and Figure 9.2 WTWenergy use for various combinations of vehicle technology and fuel/energy carrier forCategory 1 vehicles (vans).
Correspondingly, Figures 9.3 and 9.4 present results for Category 2 vehicles (2-axle trucks).
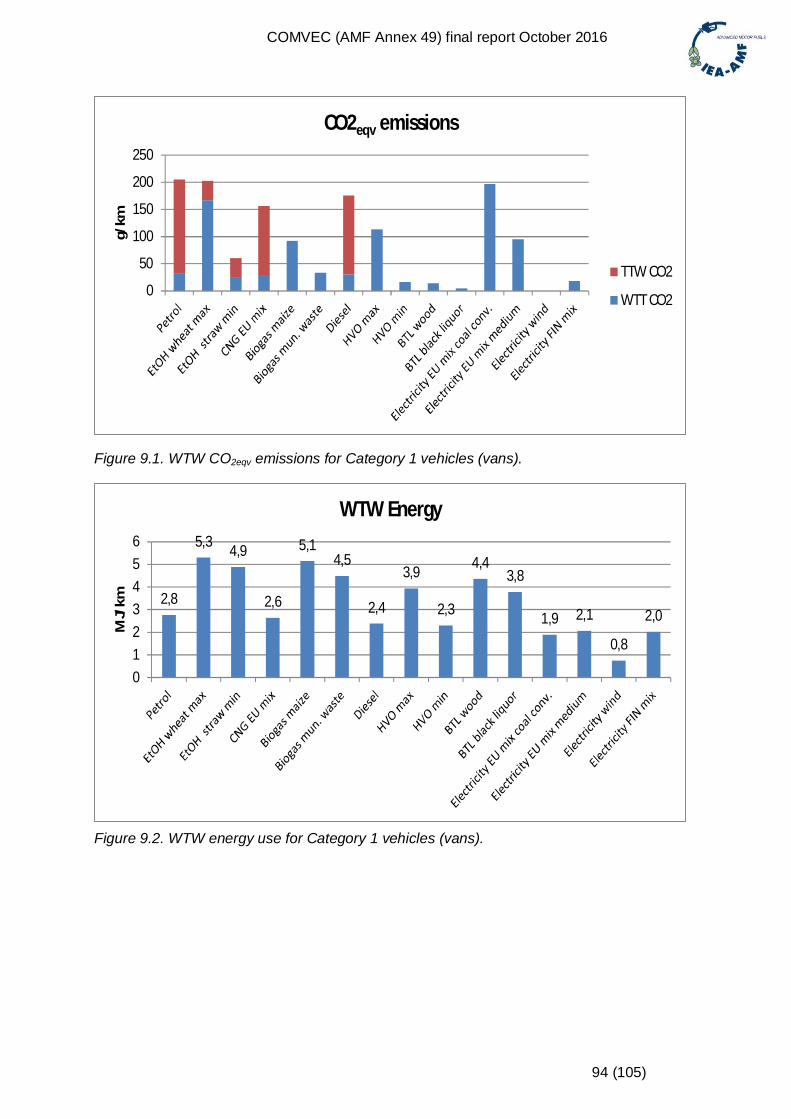
COMVEC (AMF Annex 49) final report October 2016
94 (105)
Figure 9.1. WTW CO2eqv emissions for Category 1 vehicles (vans).
Figure 9.2. WTW energy use for Category 1 vehicles (vans).
0
50
100
150
200
250
g/km
CO2eqv emissions
TTW CO2
WTT CO2
2,8
5,3 4,9
2,6
5,14,5
2,4
3,9
2,3
4,43,8
1,9 2,1
0,8
2,0
0123456
MJ/
km
WTW Energy
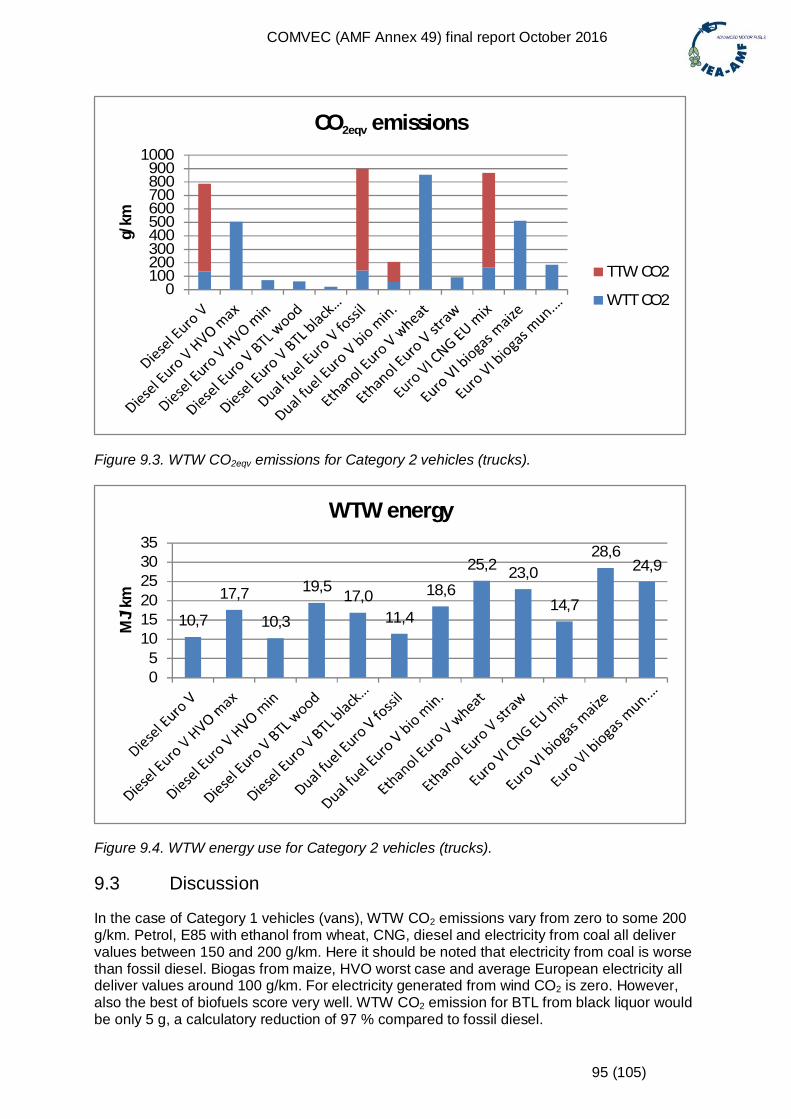
COMVEC (AMF Annex 49) final report October 2016
95 (105)
Figure 9.3. WTW CO2eqv emissions for Category 2 vehicles (trucks).
Figure 9.4. WTW energy use for Category 2 vehicles (trucks).
9.3 Discussion
In the case of Category 1 vehicles (vans), WTW CO2 emissions vary from zero to some 200g/km. Petrol, E85 with ethanol from wheat, CNG, diesel and electricity from coal all delivervalues between 150 and 200 g/km. Here it should be noted that electricity from coal is worsethan fossil diesel. Biogas from maize, HVO worst case and average European electricity alldeliver values around 100 g/km. For electricity generated from wind CO2 is zero. However,also the best of biofuels score very well. WTW CO2 emission for BTL from black liquor wouldbe only 5 g, a calculatory reduction of 97 % compared to fossil diesel.
0100200300400500600700800900
1000
g/km
CO2eqv emissions
TTW CO2
WTT CO2
10,7
17,7
10,3
19,5 17,011,4
18,6
25,2 23,0
14,7
28,624,9
05
101520253035
MJ/
km
WTW energy
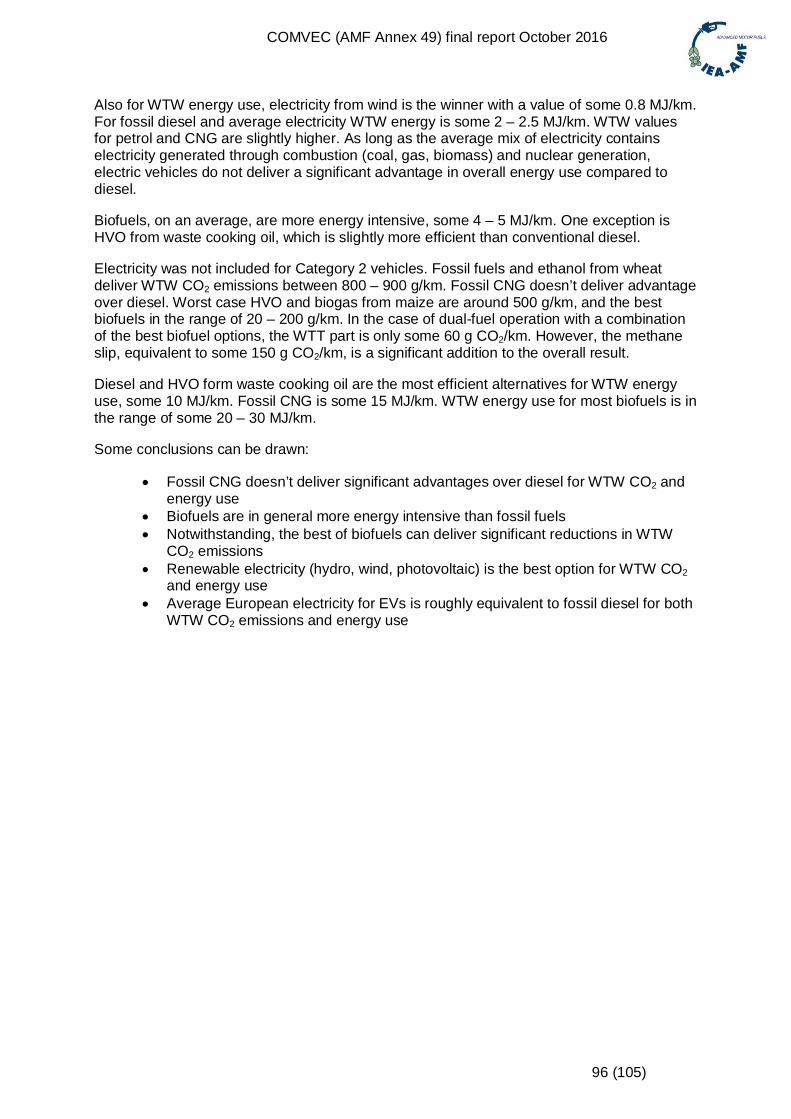
COMVEC (AMF Annex 49) final report October 2016
96 (105)
Also for WTW energy use, electricity from wind is the winner with a value of some 0.8 MJ/km.For fossil diesel and average electricity WTW energy is some 2 – 2.5 MJ/km. WTW valuesfor petrol and CNG are slightly higher. As long as the average mix of electricity containselectricity generated through combustion (coal, gas, biomass) and nuclear generation,electric vehicles do not deliver a significant advantage in overall energy use compared todiesel.
Biofuels, on an average, are more energy intensive, some 4 – 5 MJ/km. One exception isHVO from waste cooking oil, which is slightly more efficient than conventional diesel.
Electricity was not included for Category 2 vehicles. Fossil fuels and ethanol from wheatdeliver WTW CO2 emissions between 800 – 900 g/km. Fossil CNG doesn’t deliver advantageover diesel. Worst case HVO and biogas from maize are around 500 g/km, and the bestbiofuels in the range of 20 – 200 g/km. In the case of dual-fuel operation with a combinationof the best biofuel options, the WTT part is only some 60 g CO2/km. However, the methaneslip, equivalent to some 150 g CO2/km, is a significant addition to the overall result.
Diesel and HVO form waste cooking oil are the most efficient alternatives for WTW energyuse, some 10 MJ/km. Fossil CNG is some 15 MJ/km. WTW energy use for most biofuels is inthe range of some 20 – 30 MJ/km.
Some conclusions can be drawn:
Fossil CNG doesn’t deliver significant advantages over diesel for WTW CO2 andenergy use
Biofuels are in general more energy intensive than fossil fuels Notwithstanding, the best of biofuels can deliver significant reductions in WTW
CO2 emissions Renewable electricity (hydro, wind, photovoltaic) is the best option for WTW CO2
and energy use Average European electricity for EVs is roughly equivalent to fossil diesel for both
WTW CO2 emissions and energy use
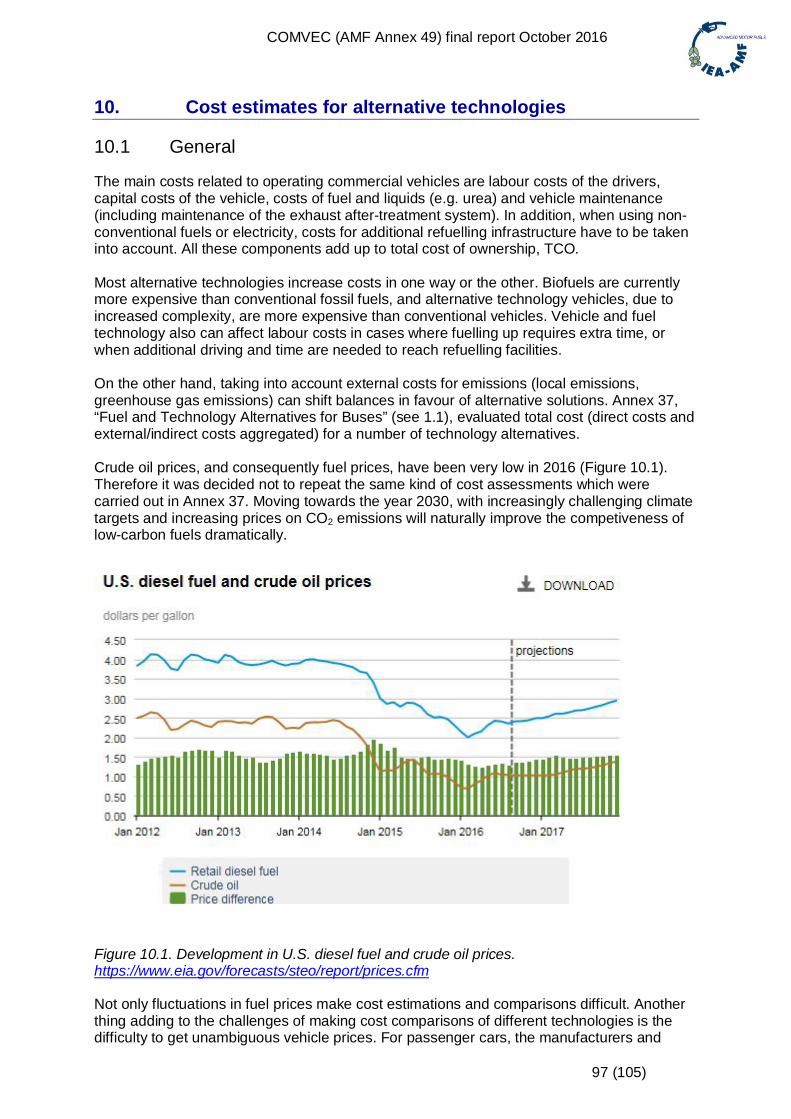
COMVEC (AMF Annex 49) final report October 2016
97 (105)
10. Cost estimates for alternative technologies
10.1 General
The main costs related to operating commercial vehicles are labour costs of the drivers,capital costs of the vehicle, costs of fuel and liquids (e.g. urea) and vehicle maintenance(including maintenance of the exhaust after-treatment system). In addition, when using non-conventional fuels or electricity, costs for additional refuelling infrastructure have to be takeninto account. All these components add up to total cost of ownership, TCO.
Most alternative technologies increase costs in one way or the other. Biofuels are currentlymore expensive than conventional fossil fuels, and alternative technology vehicles, due toincreased complexity, are more expensive than conventional vehicles. Vehicle and fueltechnology also can affect labour costs in cases where fuelling up requires extra time, orwhen additional driving and time are needed to reach refuelling facilities.
On the other hand, taking into account external costs for emissions (local emissions,greenhouse gas emissions) can shift balances in favour of alternative solutions. Annex 37,“Fuel and Technology Alternatives for Buses” (see 1.1), evaluated total cost (direct costs andexternal/indirect costs aggregated) for a number of technology alternatives.
Crude oil prices, and consequently fuel prices, have been very low in 2016 (Figure 10.1).Therefore it was decided not to repeat the same kind of cost assessments which werecarried out in Annex 37. Moving towards the year 2030, with increasingly challenging climatetargets and increasing prices on CO2 emissions will naturally improve the competiveness oflow-carbon fuels dramatically.
Figure 10.1. Development in U.S. diesel fuel and crude oil prices.https://www.eia.gov/forecasts/steo/report/prices.cfm
Not only fluctuations in fuel prices make cost estimations and comparisons difficult. Anotherthing adding to the challenges of making cost comparisons of different technologies is thedifficulty to get unambiguous vehicle prices. For passenger cars, the manufacturers and
COMVEC (AMF Annex 49) final report October 2016
98 (105)
vehicle vendors provide price lists of vehicles. This is also the case for light-duty commercialvehicles such as vans. However, in the case of heavy-duty trucks, price lists are rare, asmost vehicles are tailored according to the needs of the individual customers.
In the following text, two studies regarding the costs for CO2 abatement in road transport arereferred to, one Finnish and one German study.
10.2 Finnish study on costs of emission reductions in road transport
In 2015, VTT Technical Research Centre of Finland Ltd and VATT Institute for EconomicResearch carried out the study “40% Reduction of Carbon Dioxide Emissions from Transportby 2030: Propulsion Options and Their Impacts on National Economy10”. The study was donewith funding from the Finnish Ministry for Employment and the Economy. The report states,among other things:
Based on the economic impacts, the most cost-efficient way to reduce emissions is toinvest in the production and uptake of domestic, advanced drop-in biofuels. Their usewill not require changes in the vehicle fleet or on the fuel distribution system.Biogas is also a relatively cost-efficient option for reducing transport related CO2
emissions, but would require a significant increase in the number of gas-poweredvehicles. However, it is not possible to set obligations for fleet renewal or powertrainchoice.Because of the high price of electric cars at present, their large-scale uptake will notbe cost-effective based on their impact on GDP until technology advancements bringdown their price significantly.
These conclusions are valid for Finland, with its industrial structure (significant pulp andpaper industry, no major vehicle industry) and its large biomass resources. The conclusionscould be quite different for other countries.
For the study, VTT gathered data in 2013 – 2014 on alternative vehicle prices as well as onrefuelling infrastrucure prices. Table 10.1 shows rough estimates for vehicle prices (not alltechnologies are commercially available) and their development towards 2030.
10
http://www.transsmart.fi/files/297/Tieliikenteen_40_hiilidioksidipaastojen_vahentaminen_vuoteen_2030_Kayttovoimavaihtoehdot_ja_niiden_kansantaloudelliset_vaikutukset._VTT-R-00752-15.pdf (withextended summary in English)
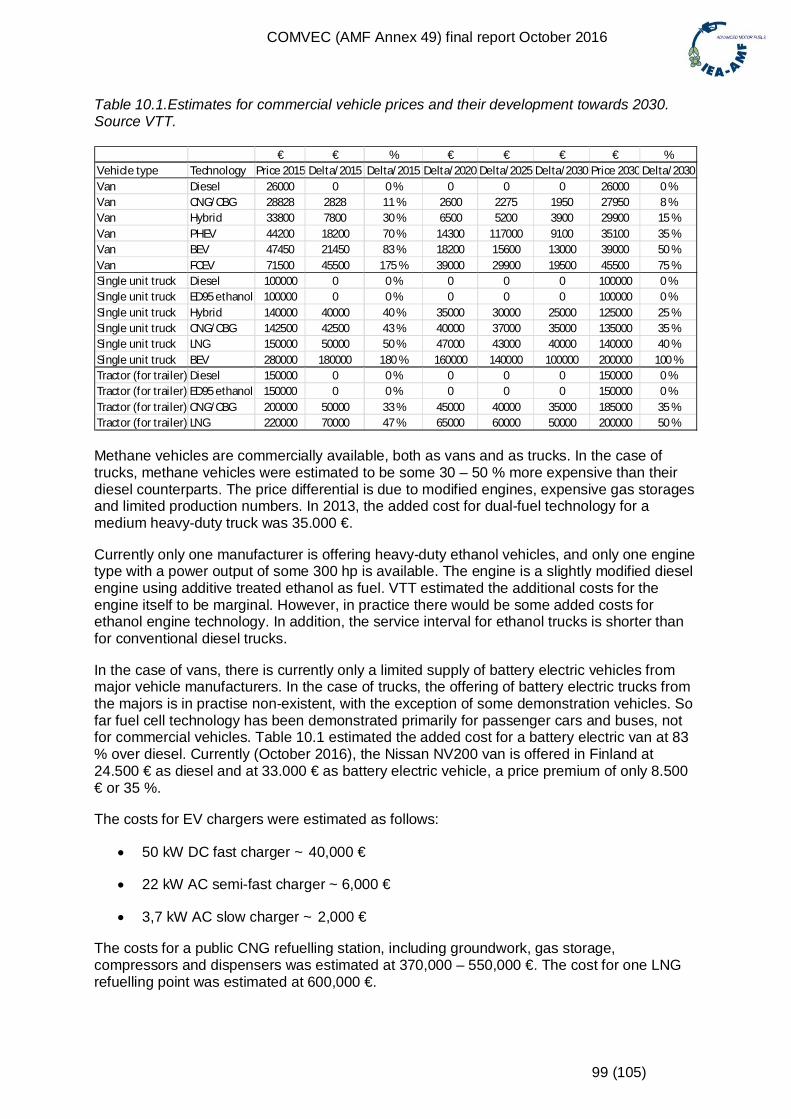
COMVEC (AMF Annex 49) final report October 2016
99 (105)
Table 10.1.Estimates for commercial vehicle prices and their development towards 2030.Source VTT.
Methane vehicles are commercially available, both as vans and as trucks. In the case oftrucks, methane vehicles were estimated to be some 30 – 50 % more expensive than theirdiesel counterparts. The price differential is due to modified engines, expensive gas storagesand limited production numbers. In 2013, the added cost for dual-fuel technology for amedium heavy-duty truck was 35.000 €.
Currently only one manufacturer is offering heavy-duty ethanol vehicles, and only one enginetype with a power output of some 300 hp is available. The engine is a slightly modified dieselengine using additive treated ethanol as fuel. VTT estimated the additional costs for theengine itself to be marginal. However, in practice there would be some added costs forethanol engine technology. In addition, the service interval for ethanol trucks is shorter thanfor conventional diesel trucks.
In the case of vans, there is currently only a limited supply of battery electric vehicles frommajor vehicle manufacturers. In the case of trucks, the offering of battery electric trucks fromthe majors is in practise non-existent, with the exception of some demonstration vehicles. Sofar fuel cell technology has been demonstrated primarily for passenger cars and buses, notfor commercial vehicles. Table 10.1 estimated the added cost for a battery electric van at 83% over diesel. Currently (October 2016), the Nissan NV200 van is offered in Finland at24.500 € as diesel and at 33.000 € as battery electric vehicle, a price premium of only 8.500€ or 35 %.
The costs for EV chargers were estimated as follows:
50 kW DC fast charger ~ 40,000 €
22 kW AC semi-fast charger ~ 6,000 €
3,7 kW AC slow charger ~ 2,000 €
The costs for a public CNG refuelling station, including groundwork, gas storage,compressors and dispensers was estimated at 370,000 – 550,000 €. The cost for one LNGrefuelling point was estimated at 600,000 €.
€ € % € € € € %Vehicle type Technology Price 2015 Delta/2015 Delta/2015 Delta/2020 Delta/2025 Delta/2030 Price 2030 Delta/2030Van Diesel 26000 0 0 % 0 0 0 26000 0 %Van CNG/CBG 28828 2828 11 % 2600 2275 1950 27950 8 %Van Hybrid 33800 7800 30 % 6500 5200 3900 29900 15 %Van PHEV 44200 18200 70 % 14300 117000 9100 35100 35 %Van BEV 47450 21450 83 % 18200 15600 13000 39000 50 %Van FCEV 71500 45500 175 % 39000 29900 19500 45500 75 %Single unit truck Diesel 100000 0 0 % 0 0 0 100000 0 %Single unit truck ED95 ethanol 100000 0 0 % 0 0 0 100000 0 %Single unit truck Hybrid 140000 40000 40 % 35000 30000 25000 125000 25 %Single unit truck CNG/CBG 142500 42500 43 % 40000 37000 35000 135000 35 %Single unit truck LNG 150000 50000 50 % 47000 43000 40000 140000 40 %Single unit truck BEV 280000 180000 180 % 160000 140000 100000 200000 100 %Tractor (for trailer) Diesel 150000 0 0 % 0 0 0 150000 0 %Tractor (for trailer) ED95 ethanol 150000 0 0 % 0 0 0 150000 0 %Tractor (for trailer) CNG/CBG 200000 50000 33 % 45000 40000 35000 185000 35 %Tractor (for trailer) LNG 220000 70000 47 % 65000 60000 50000 200000 50 %
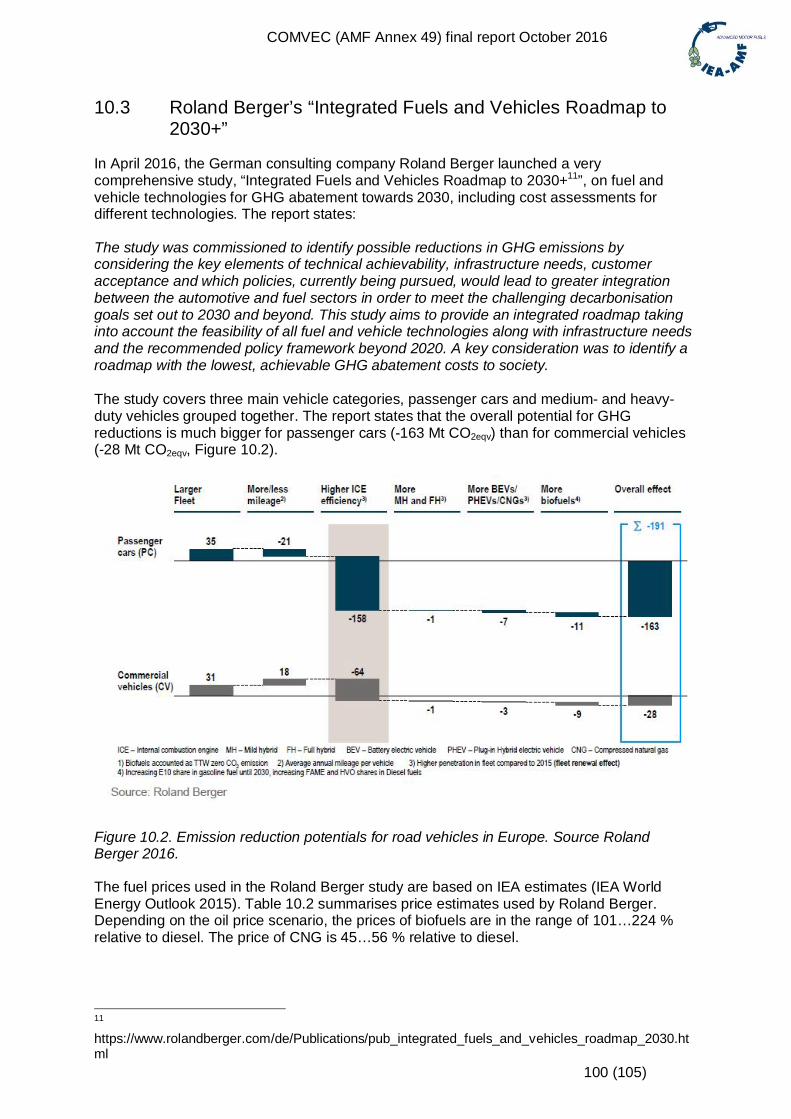
COMVEC (AMF Annex 49) final report October 2016
100 (105)
10.3 Roland Berger’s “Integrated Fuels and Vehicles Roadmap to2030+”
In April 2016, the German consulting company Roland Berger launched a verycomprehensive study, “Integrated Fuels and Vehicles Roadmap to 2030+11”, on fuel andvehicle technologies for GHG abatement towards 2030, including cost assessments fordifferent technologies. The report states:
The study was commissioned to identify possible reductions in GHG emissions byconsidering the key elements of technical achievability, infrastructure needs, customeracceptance and which policies, currently being pursued, would lead to greater integrationbetween the automotive and fuel sectors in order to meet the challenging decarbonisationgoals set out to 2030 and beyond. This study aims to provide an integrated roadmap takinginto account the feasibility of all fuel and vehicle technologies along with infrastructure needsand the recommended policy framework beyond 2020. A key consideration was to identify aroadmap with the lowest, achievable GHG abatement costs to society.
The study covers three main vehicle categories, passenger cars and medium- and heavy-duty vehicles grouped together. The report states that the overall potential for GHGreductions is much bigger for passenger cars (-163 Mt CO2eqv) than for commercial vehicles(-28 Mt CO2eqv, Figure 10.2).
Figure 10.2. Emission reduction potentials for road vehicles in Europe. Source RolandBerger 2016.
The fuel prices used in the Roland Berger study are based on IEA estimates (IEA WorldEnergy Outlook 2015). Table 10.2 summarises price estimates used by Roland Berger.Depending on the oil price scenario, the prices of biofuels are in the range of 101…224 %relative to diesel. The price of CNG is 45…56 % relative to diesel.
11
https://www.rolandberger.com/de/Publications/pub_integrated_fuels_and_vehicles_roadmap_2030.html
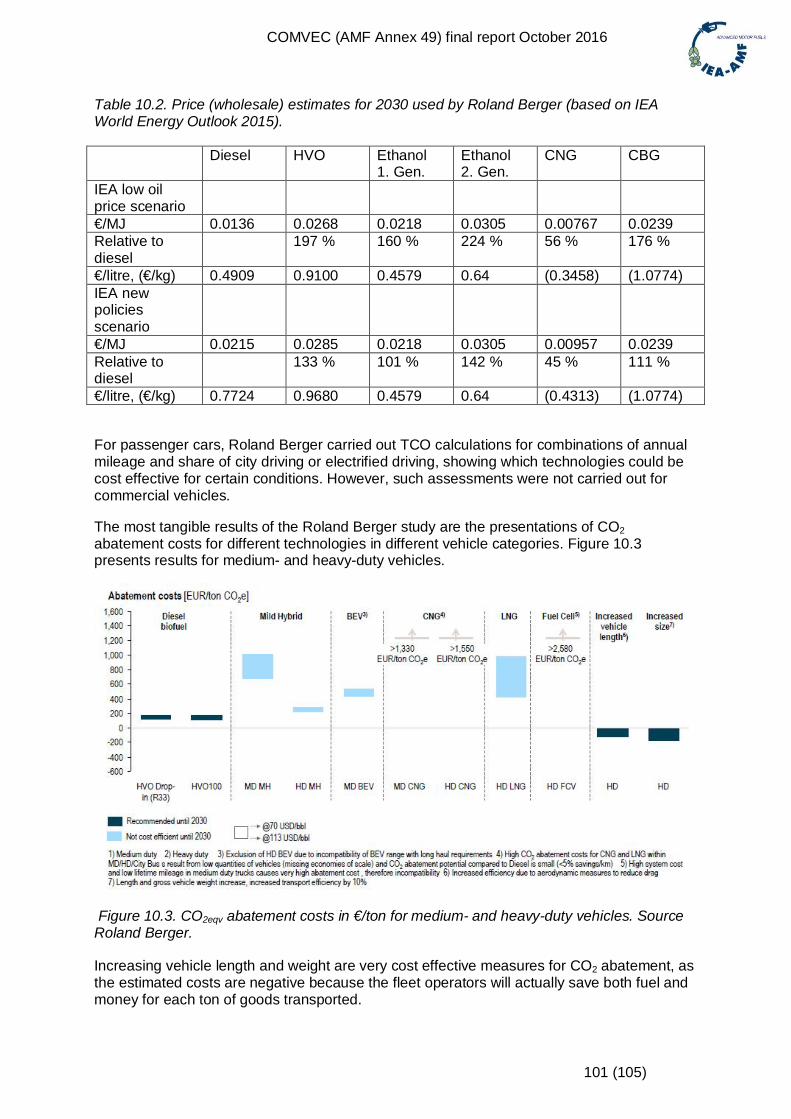
COMVEC (AMF Annex 49) final report October 2016
101 (105)
Table 10.2. Price (wholesale) estimates for 2030 used by Roland Berger (based on IEAWorld Energy Outlook 2015).
Diesel HVO Ethanol1. Gen.
Ethanol2. Gen.
CNG CBG
IEA low oilprice scenario€/MJ 0.0136 0.0268 0.0218 0.0305 0.00767 0.0239Relative todiesel
197 % 160 % 224 % 56 % 176 %
€/litre, (€/kg) 0.4909 0.9100 0.4579 0.64 (0.3458) (1.0774)IEA newpoliciesscenario€/MJ 0.0215 0.0285 0.0218 0.0305 0.00957 0.0239Relative todiesel
133 % 101 % 142 % 45 % 111 %
€/litre, (€/kg) 0.7724 0.9680 0.4579 0.64 (0.4313) (1.0774)
For passenger cars, Roland Berger carried out TCO calculations for combinations of annualmileage and share of city driving or electrified driving, showing which technologies could becost effective for certain conditions. However, such assessments were not carried out forcommercial vehicles.
The most tangible results of the Roland Berger study are the presentations of CO2abatement costs for different technologies in different vehicle categories. Figure 10.3presents results for medium- and heavy-duty vehicles.
Figure 10.3. CO2eqv abatement costs in €/ton for medium- and heavy-duty vehicles. SourceRoland Berger.
Increasing vehicle length and weight are very cost effective measures for CO2 abatement, asthe estimated costs are negative because the fleet operators will actually save both fuel andmoney for each ton of goods transported.
COMVEC (AMF Annex 49) final report October 2016
102 (105)
The cost on emission reduction using biofuels is around 150 €/ton, all other technologies(hybridisation, electrification, natural gas, fuel cells) are more expensive, according to RolandBerger.
Roland Berger makes specific comments regarding paraffinic diesel fuels:
“Paraffinic fuels are totally fungible and can be used as drop-in blending components forconventional diesel fuels.
Advantages of paraffinic fuels:
Opportunity to increase the share non-mineral oil based fuelsPositive impact on particulate matter and NOx emissions compared to conventionaldiesel fuelsCompatibility with existing conventional diesel enginesCO2 emission reduction is possible without technical adaptions on vehicles
Technology maturity to ensure cost competitiveness compared to conventional fuels is acurrent challenge for paraffinic fuels, in particular for BTL.” (Editor’s comment: biomass-to-liquids, synthetic fuels from solid biomass).
The CNG vehicles are considered to be equipped with spark-ignition engines. Also themeasurements within the COMVEC project show very limited benefits for spark-ignited CNGover diesel regarding CO2eqv emissions, and consequently the abatement costs for thistechnology are very high, above 1,330 €/ton. LNG is more cost effective than CNG, some500…1000 €/ton. Roland Berger most probably assumes the LNG vehicles to be equippedwith advanced dual-fuel engines, delivering higher engine efficiency than spark-ignitedengines. Roland Berger only shows results for fossil natural gas. Biogas would deliver morefavourable results, probably close to those of liquid biofuels.
According to Roland Berger, the most expensive technology for CO2 abatement for 2030 isfuel cell technology, with a cost of more than 2,500 €/ton.
COMVEC (AMF Annex 49) final report October 2016
103 (105)
11. Conclusions and key messages
In the “COMVEC” project, eight partners from four continents teamed up to generateperformance data (energy efficiency, exhaust emissions) for commercial vehicles. The workstarted with the development of a common test procedure, The World Harmonized VehicleCycle (WHVC) was used for vehicle testing and the World Harmonized Transient Cycle(WHTS) for engine testing.
Altogether, 35 different vehicles were tested on chassis dynamometers, with vehicles rangingfrom light commercial vehicles (vans) to heavy-duty tractors for semi-trailers. In addition, oneengine, installed in an engine dynamometer, was tested. The test programme coveredseveral fuel options: diesel, diesel substitute fuels, natural gas, ethanol and even electricity inthe category of light commercial vehicles.
Key messages - overall
Going from Euro III to Euro IV or Euro V vehicles does not necessarily deliver realemission benefits; one should leapfrog directly to Euro VI or US 2010 regulations toobtain real-life low emissions.
o This has implications for those regions that are contemplating more stringentemission regulations, as well as for tendering of transport services.
o One should keep in mind that Euro VI vehicles require high-quality sulphur-free fuels (S > 15 ppm).
The regulated emissions of a vehicle are, first and foremost, determined by theemission control technology, not the fuel.
The response to substitute fuels (fuels that can replace conventional diesel in existingvehicles) varies from vehicle to vehicle, as well as by vehicle category (light-dutyvehicles vs. heavy-duty vehicles).
o Heavy-duty Euro VI engines are so clean that any effect of the fuel will bedampened by the highly efficient and complex exhaust after-treatmentsystems.
o Older vehicles, e.g. using paraffinic diesel, can deliver reductions in regulatedemissions up to 30 %, depending on the exhaust component.
The carbon intensity of the fuel or the energy carrier is decisive for well-to-wheel CO2emissions, not vehicle technology.
CO2 assessment should be carried out on a well-to-wheel basis, not only by lookingat tailpipe CO2 emissions.
Electrification with low-carbon electricity is a good option for local emissions as wellas WTW CO2 emissions.
o One should keep in mind that not all applications are suitable forelectrification.
Euro VI (alternatively US 2010) in combination with a renewable fuel is a good optionfor the local environment as well as the climate.
Recent reports conclude that biofuels seem to be a cost-effective way of reducingCO2 emissions from road transport; this, relative to electric vehicles and fuel cellvehicles.
o Fossil natural gas is not a cost-effective option for reducing CO2 emissionsfrom heavy-duty vehicles.
Key findings – energy consumption
The most important factor affecting energy consumption is vehicle mass.o For diesel powered vehicles, energy consumption per km varied by a factor of
12, from the lightest to the heaviest vehicle tested.o Relative to mass, larger vehicles are more energy efficient than smaller ones.o Specific energy consumption varied by a factor of 3.
COMVEC (AMF Annex 49) final report October 2016
104 (105)
However, the type of engine (spark-ignited, diesel, electric) also has an impact onenergy consumption.
o Spark-ignited engines are less efficient than compression ignited (diesel)engines.
o Thus, spark-ignited gas vehicles have higher energy consumption than theirdiesel counterparts, independent of vehicle size.
o The energy consumption of electric vehicles is around 30–40 % of that of ICEequipped vehicles.
New diesel vehicles (particularly Euro VI vehicles) are much cleaner than older ones,showing no fuel consumption penalty, when compared to older vehicles.
Key findings – regulated emissions
Really huge differences can be found for both NOx and PM emissions.o In the case of NOx, specific emission rates varied from less than 0.001 to 0.9
g/km/1000 kg vehicle weight.o For PM, the range is 0.001 to 0.13 g/km/1000 kg vehicle weight.
All Euro IV and Euro V diesel vehicles had higher NOx emissions than should beexpected.
o The conclusion that can be drawn is that, in the case of diesel vehicles, goingfrom Euro III to Euro IV or Euro V does not necessarily bring about reductionsin NOx emissions; only Euro VI vehicles deliver truly low NOx emissions.
Regarding particle emissions, the overall situation is somewhat more positive than inthe case of NOx.
o Particulate filters effectively reduce PM emissions.
NOx emissions by fuel:
Huge spread for diesel vehicles. Very low emissions for spark-ignited CNG. Diesel dual-fuel and ethanol delivered average NOx emissions. Emission class is more decisive than fuel.
PM emissions by fuel:
Fuel type has an impact on PM emissions. Spark-ignited natural gas delivers very low PM emissions. The two ethanol trucks tested, although Euro V certified and without a particulate
filter, delivered Euro VI level particle emissions. Dual-fuel operation increased particle emissions, this phenomenon can be related to
an unsophisticated DDF control system, not the fuel itself.
Key findings – substitute fuels
It is challenging to draw unambiguous conclusions regarding the effects of dieselsubstitute fuels on emission performance.
The response varies from vehicle to vehicle, as well as by vehicle category (light-dutyvehicles vs. heavy-duty vehicles).
o Heavy-duty Euro VI engines are so clean that any effect of the fuel will bedampened by the highly efficient and complex exhaust after-treatmentsystems.
o However, high quality fuels, with no contaminants, are prerequisites toguarantee performance and durability of the exhaust after-treatment systems.
COMVEC (AMF Annex 49) final report October 2016
105 (105)
As for pre-Euro VI heavy-duty vehicles, some general conclusions can,notwithstanding, be drawn:
o Oxygen containing fuels tend to increase NOx emissions and decrease PMemissions, compared to regular diesel fuel.
o Paraffinic fuels, on the other hand, may deliver a slight (5–10 %) reduction inNOx emissions, in combination with a decent (up to 30 %) reduction in PMemissions.
In the case of light-duty vehicles, there is no clear trend for fuel effects on emissions.o However, substituting regular diesel for 100 % paraffinic fuel seems to have
marginal or no benefits for regulated emissions. The results from AVL MTC highlight that it is extremely difficult to access the health
effects of fuels.o Fuel ranking depends on, e.g., what emission component is evaluated,
whether it is the filter phase or the semivolatile phase that is being assessedfor PAH emission as well as how the vehicle is tested (does testing include acold start or not).
Going from old Euro I vehicles to Euro VI vehicles will reduce regulated emissions bymore than 95 %.
o It is clear that such a massive reduction in emissions from efficient exhaustafter-treatment systems will erase most of the effects of fuel on exhaustemissions.
o However, in the case of less sophisticated engines, a switch fromconventional diesel fuel to chemically simple fuels, such as methane andparaffinic diesel, may still bring about emission benefits.
Key findings – WTW assessment
o Fossil CNG does not deliver significant advantages over diesel for WTW CO2and energy use.
o Biofuels are, in general, more energy intensive than fossil fuels.o Notwithstanding, the best biofuels can deliver significant reductions in WTW
CO2 emissions.o Renewable electricity (hydro, wind, photovoltaic) is the best option for WTW
CO2 and energy use.o Average European electricity for EVs is roughly equivalent to fossil diesel for
both WTW CO2 emissions and energy use.


![Allied Telesis Management Framework (AMF)forum.alliedtelesis.ru/MY/Presentations/2016/AlliedTelesis_AMF_Demo_ru.pdf · Allied Telesis Management Framework (AMF) [ ] AMF Member AMF](https://img.pdfslide.us/doc/110x75/5e88bb8ee2fad2109a7792f5/allied-telesis-management-framework-amfforum-allied-telesis-management-framework.jpg)