Embed Size (px)
Citation preview

1 1
Morten D. Skogen
WP10: Hindcast and scenario studies on coastal-shelf climate and ecosystem variability and change
Overview and plans
ECOOP annual meeting, Athens 12-15/2, 2008

2 2
WP10:• PARTNERS:
• IMR (coordinator)• DMI• UiB-GFI• NERC• PML• UNIV-GDA
• ASSOCIATED:• CEFAS• SMHI• IOW• IMI
3 3
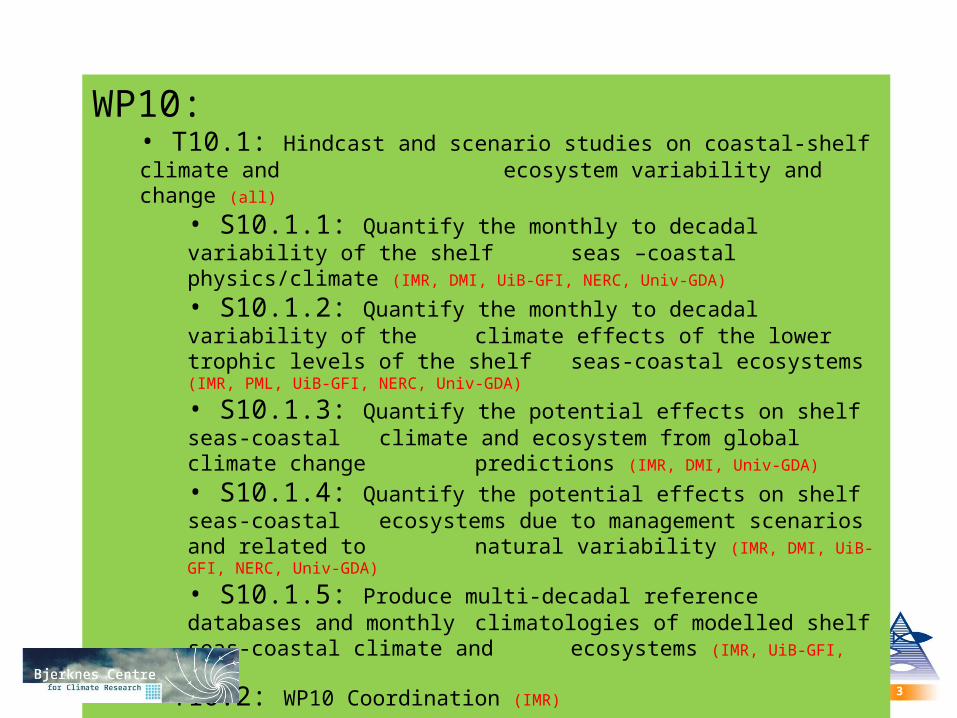
WP10:• T10.1: Hindcast and scenario studies on coastal-shelf climate and
ecosystem variability and change (all)
• S10.1.1: Quantify the monthly to decadal variability of the shelf seas –coastal physics/climate (IMR, DMI, UiB-GFI, NERC, Univ-GDA)
• S10.1.2: Quantify the monthly to decadal variability of the climate effects of the lower trophic levels of the shelf seas-coastal ecosystems (IMR, PML, UiB-GFI, NERC, Univ-GDA)
• S10.1.3: Quantify the potential effects on shelf seas-coastal climate and ecosystem from global climate
change predictions (IMR, DMI, Univ-GDA)
• S10.1.4: Quantify the potential effects on shelf seas-coastal ecosystems due to management scenarios
and related to natural variability (IMR, DMI, UiB-GFI, NERC, Univ-GDA)
• S10.1.5: Produce multi-decadal reference databases and monthly climatologies of modelled shelf seas-coastal climate and ecosystems (IMR, UiB-GFI, NERC)
• T10.2: WP10 Coordination (IMR)

4 4
WP10:• S10.1.1: Quantify the monthly to decadal variability of the shelf
seas –coastal physics/climate (IMR, DMI, UiB-GFI, NERC, Univ-GDA)
Objective: perform the first 3-dimensional simulations of the last 30-50 years of temperature, salinity, turbulence and currents. Achieve relevant observations for validation of precision and accuracy. Define analysis methodology to be performed and specific products to be delivered.
D10.1.1.1 (Mo18): First 30-50 year climate simulations ready.D10.1.1.2 (Mo30): Report on the past 30-50 years climate variability

5 5
WP10:• S10.1.1: Quantify the monthly to decadal variability of the shelf
seas –coastal physics/climate (IMR, DMI, UiB-GFI, NERC, Univ-GDA)
AREA Resolution Period Partner Comment
North Sea/Baltic 9km 1960-2001 Univ-GDA
North Sea/Baltic 2km 1960-1972 Univ-GDA Extension ongoing
North Sea/Baltic 10km 1958-2004 UiB-GFI
North Sea/Baltic 10km 1979-1993 UiB-GFI
Barents Sea 7km 1958-1997 UiB-GFI
North Sea 20km 1955-2006 IMR
North Sea 10km 1985-2007 IMR
North Sea/Baltic 6nm-1nm 1960-1990 DMI Planned

6 6
WP10:• S10.1.1: Quantify the monthly to decadal variability of the shelf
seas –coastal physics/climate (IMR, DMI, UiB-GFI, NERC, Univ-GDA)
Baltic Sea (upper) and North Sea (lower) heat content anomaly 1958-2004 as calculated by ECOSMO. Blue lines: monthly anomaly, red line: moving average annual window; mean seasonal signal removed.

7 7
WP10:• S10.1.2: Quantify the monthly to decadal variability of the climate effects of the lower trophic levels of the shelf seas-coastal
ecosystems (IMR, PML, UiB-GFI, NERC, Univ-GDA)
Objective: perform the first 3-dimensional simulations of the last 30-50 years of primary production (PP), concentration of functional groups of algae, nutrients and bottom oxygen and sedimentation. Achieve relevant observations for validation of precision and accuracy. Define analysis methodology to be performed and specific products to be delivered.
D10.1.2.1 (Mo18): First 30-50 year simulations of PP ready.D10.1.2.3 (Mo30): Model to model PP variability study.D10.1.2.2 (Mo36): Report on the past 30-50 year PP variability

8 8
WP10:• S10.1.2: Quantify the monthly to decadal variability of the climate effects of the lower trophic levels of the shelf seas-coastal
ecosystems (IMR, PML, UiB-GFI, NERC, Univ-GDA)
AREA Resolution Period Partner CommentBaltic-Gulf of Gdansk 5nm-1nm 1994-2002 Univ-GDANorth Sea/Baltic 10km 1980-2004 UiB-GFINorth Sea 10km 1985-2007 IMRNordic and Barents Seas 20km 1981-2006 IMR

9 9
WP10:• S10.1.2: Quantify the monthly to decadal variability of the climate effects of the lower trophic levels of the shelf seas-coastal
ecosystems (IMR, PML, UiB-GFI, NERC, Univ-GDA)
integral square error [Ise]
coe
ffic
ien
t o
f co
rre
latio
n [R
s]
PO4Ptot
SiO 4
O2TS
NO 3
N tot
NH 4
0.0 0.3 0.6 0.9 1.2 1.5 1.8 2.1 2.4
0.3
0.4
0.5
0.6
0.7
0.8
0.9
1.0 PO4
Ptot
SiO 4
O2
TSNO 3
N tot
NH 4
excellent
good
exc
elle
nt
go
od
station P1
satis
fied
satisfied
a) integral square error [Ise]
coe
ffic
ien
t o
f co
rre
latio
n [R
s]
PO4Ptot
SiO 4
O2 TS
NO 3
N tot
NH 4
0.0 0.3 0.6 0.9 1.2 1.5 1.8 2.1 2.4
0.3
0.4
0.5
0.6
0.7
0.8
0.9
1.0 PO4
Ptot
SiO 4
O2
TSNO 3
N tot
NH 4
excellent
good
exc
elle
nt
go
od
all stations at the Gulf of Gdańsk
satis
fied
satisfied
b)
integral square error [Ise]
coe
ffic
ien
t o
f co
rre
latio
n [R
s]
PO4
Ptot
SiO 4
O2 TS
NO 3
N tot
NH 4
0.0 0.4 0.8 1.2 1.6 2.0 2.4
0.3
0.4
0.5
0.6
0.7
0.8
0.9
1.0 PO 4
Ptot
SiO 4
O2
TSNO 3
N tot
NH 4
excellent
good
exc
elle
nt
go
od
the surface layer for 1994-2002satis
fied
satisfied
c) integral square error [Ise]
coe
ffic
ien
t o
f co
rre
latio
n [R
s]PO4
Ptot
SiO 4
O2 TS
NO 3
N tot
NH 4
0.0 0.4 0.8 1.2 1.6 2.0 2.4
0.3
0.4
0.5
0.6
0.7
0.8
0.9
1.0PO4
Ptot
SiO 4
O2
TSNO 3
N tot
NH 4
excellent
good
exc
elle
nt
go
od
the area II for 1994-2002satis
fied
satisfied
d)
Special coefficients of correlation in the function of total quadratic error for whole profiles state variables at the station P1 a), all stations b) and terms for all measurements at c) surface layer d) open boundary Gulf of Gdańsk from the period 1994-2002

10 10
WP10:• S10.1.3: Quantify the potential effects on shelf seas-coastal
climate and ecosystem from global climate change predictions (IMR, DMI, Univ-GDA)
Objective: downscale the predicted future climate to shelf seas by running the models used in Task 10.1 for several years several decades into the future with forcing from the coupled climate prediction models, and produce similar monthly averages as in Task 10.1.
D10.1.3.3 (Mo17): Spec. of potential common climate scenarios D10.1.3.1 (Mo24): Downscaling simulations of the future climate D10.1.3.2 (Mo36): Downscaling simulations of the future PP ready
and reported together with climate
11 11
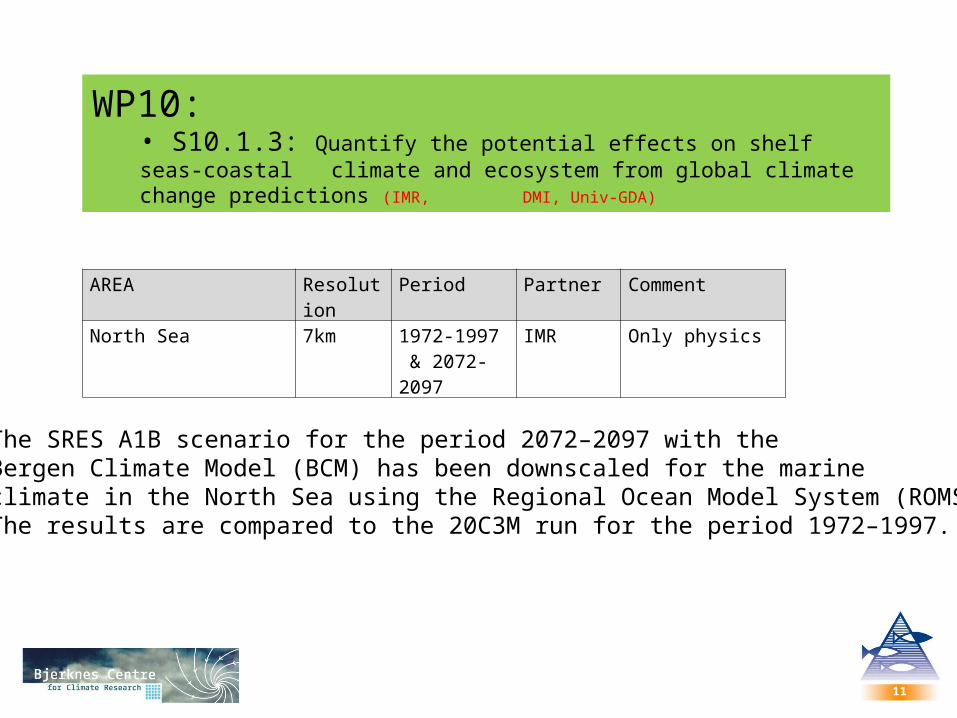
WP10:• S10.1.3: Quantify the potential effects on shelf seas-coastal
climate and ecosystem from global climate change predictions (IMR, DMI, Univ-GDA)
AREA Resolution Period Partner CommentNorth Sea 7km 1972-1997 &
2072-2097IMR Only physics
The SRES A1B scenario for the period 2072–2097 with the Bergen Climate Model (BCM) has been downscaled for the marine climate in the North Sea using the Regional Ocean Model System (ROMS). The results are compared to the 20C3M run for the period 1972–1997.

12 12
WP10:• S10.1.3: Quantify the potential effects on shelf seas-coastal
climate and ecosystem from global climate change predictions (IMR, DMI, Univ-GDA)
Seasonal cycle of averaged temperature in the North Sea for the 20C3M and A1B run respectively. The averaging periods are 1972–1997 for 20C3M and 2072–2097 for A1B. Average increase: 1.4oC.

13 13
WP10:• S10.1.4: Quantify the potential effects on shelf seas-coastal e
cosystems due to management scenarios and related to natural variability (IMR, DMI, UiB-GFI, NERC, Univ-GDA)
Objective: define what-if scenarios to be simulated, define analysis to be done and prepare for simulations.
D10.1.4.1 (Mo24): Demonstrate effects of reduced nutrient loads on PP in the North Sea
D10.1.4.2(Mo30): Model to model intercomp. of what-if scenarios
Subtask started out in month 13

14 14
WP10:• S10.1.5: Produce multi-decadal reference databases and monthly
climatologies of modelled shelf seas-coastal climate and ecosystems (IMR, UiB-GFI, NERC)
Objective: The full 3D results from the long-term simulations in S10.1 and 10.2 will be stored with an as high as practical possible time resolution in an easy accessible database. Monthly means and climatologies will also be produced and stored in the same databse
D10.1.5.2 (Mo28): Spec. of a database of long term simulationD10.1.5.1 (Mo36): Deliver a database of long term model simulations
Subtask started out in month 13

15 15
WP10: CONCLUSION
WP10 is in good progress with respect to all deliverables
Bergen seen from Mt. Ulriken