Embed Size (px)
Citation preview
Possible SMHI contributions to
EMECO North Sea Observatory
Presented at EMECO meeting, Lowestoft 2-3 June 2009
Bengt Karlson
Swedish Meteorological and Hydrological Institute
Research & development, Oceanography
Gothenburg, Sweden
R/V Argos
Headquarters, Norrköping
Gothenburg
office

Activities in the eastern North Sea
(the Skagerrak and the Kattegat)
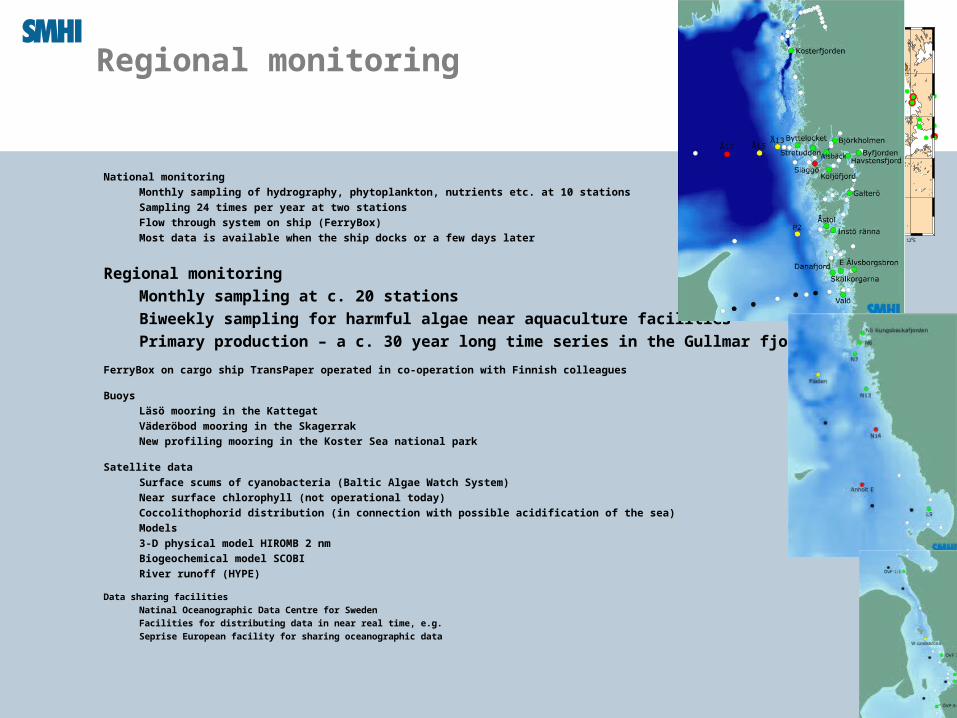
National monitoring
Monthly sampling of hydrography, phytoplankton,
nutrients etc. at 10 stations
Sampling 24 times per year at two stations
Flow through system on ship (FerryBox)
Most data is available when the ship docks or a few days
later
Regional monitoring
Monthly sampling at c. 20 stations
Biweekly sampling for harmful algae near aquaculture facilities
Primary production – one c. 30 year long time series at mouth of Gullmar fjord
FerryBox on cargo ship TransPaper operated in co-operation with Finnish colleagues
Buoys
Läsö mooring in the Kattegat
Väderöbod mooring in the Skagerrak
New profiling mooring in the Koster Sea national park
Satellite data
Surface scums of cyanobacteria (Baltic Algae Watch System)
Near surface chlorophyll (not operational today)
Coccolithophorid distribution (in connection with possible acidification of the sea)
Models
3-D physical model HIROMB 2 nm
Biogeochemical model SCOBI
River runoff (HYPE)
Data sharing facilities
Natinal Oceanographic Data Centre for Sweden
Facilities for distributing data in near real time, e.g.
Seprise European facility for sharing oceanographic data
4oW 0o 4oE 8oE 12oE 50oN
52oN
54oN
56oN
58oN
60oN
Regional monitoring
National monitoring
Monthly sampling of hydrography, phytoplankton, nutrients etc. at 10 stations
Sampling 24 times per year at two stations
Flow through system on ship (FerryBox)
Most data is available when the ship docks or a few days later
Regional monitoring
Monthly sampling at c. 20 stations
Biweekly sampling for harmful algae near aquaculture facilities
Primary production – a c. 30 year long time series in the Gullmar fjord
FerryBox on cargo ship TransPaper operated in co-operation with Finnish colleagues
Buoys
Läsö mooring in the Kattegat
Väderöbod mooring in the Skagerrak
New profiling mooring in the Koster Sea national park
Satellite data
Surface scums of cyanobacteria (Baltic Algae Watch System)
Near surface chlorophyll (not operational today)
Coccolithophorid distribution (in connection with possible acidification of the sea)
Models
3-D physical model HIROMB 2 nm
Biogeochemical model SCOBI
River runoff (HYPE)
Data sharing facilities
Natinal Oceanographic Data Centre for Sweden
Facilities for distributing data in near real time, e.g.
Seprise European facility for sharing oceanographic data
4oW 0o 4oE 8oE 12oE 50oN
52oN
54oN
56oN
58oN
60oN
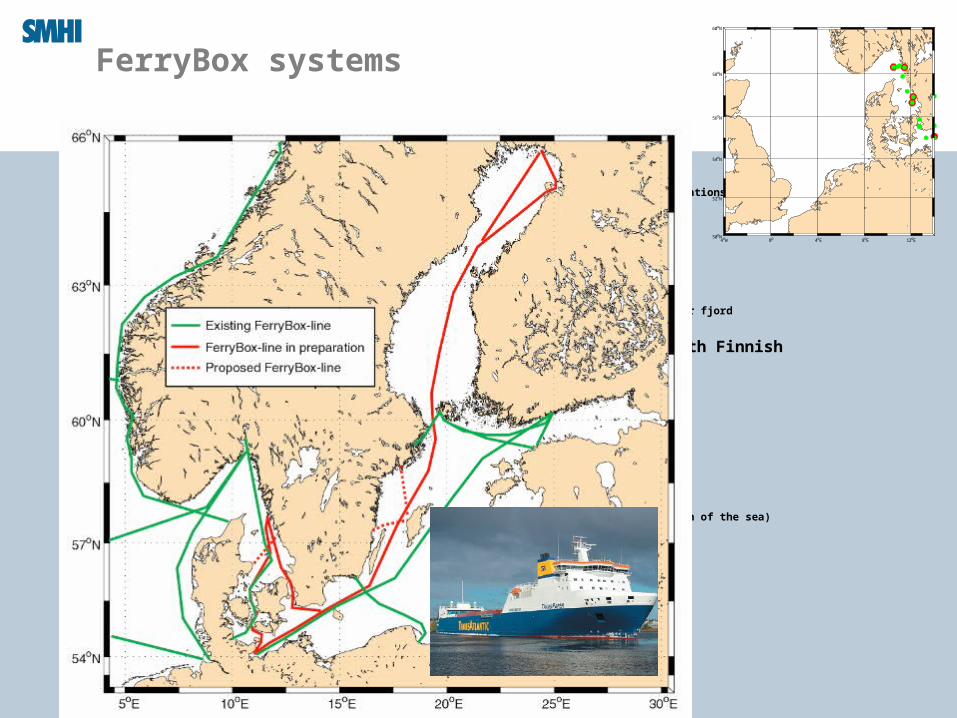
FerryBox systems
National monitoring
Monthly sampling of hydrography, phytoplankton, nutrients etc. at 10 stations
Sampling 24 times per year at two stations
Flow through system on ship (FerryBox)
Most data is available when the ship docks or a few days later
Regional monitoring
Monthly sampling at c. 20 stations
Biweekly sampling for harmful algae near aquaculture facilities
Primary production – one c. 30 year long time series at mouth of Gullmar fjord
FerryBox on cargo ship TransPaper operated in co-operation with Finnish colleagues
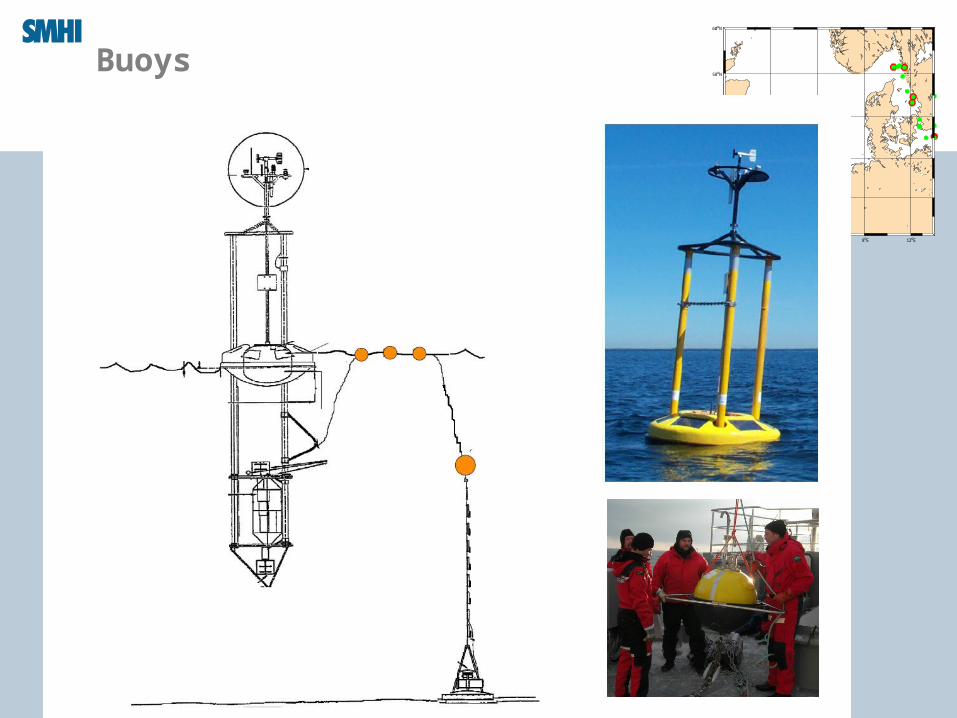
Buoys
Läsö mooring in the Kattegat
Väderöbod mooring in the Skagerrak
New profiling mooring in the Koster Sea national park
Satellite data
Surface scums of cyanobacteria (Baltic Algae Watch System)
Near surface chlorophyll (not operational today)
Coccolithophorid distribution (in connection with possible acidification of the sea)
Models
3-D physical model HIROMB 2 nm
Biogeochemical model SCOBI
River runoff (HYPE)
Data sharing facilities
Natinal Oceanographic Data Centre for Sweden
Facilities for distributing data in near real time, e.g.
Seprise European facility for sharing oceanographic data
4oW 0o 4oE 8oE 12oE 50oN
52oN
54oN
56oN
58oN
60oN
Buoys
National monitoring
Monthly sampling of hydrography, phytoplankton, nutrients etc. at 10 stations
Sampling 24 times per year at two stations
Flow through system on ship (FerryBox)
Most data is available when the ship docks or a few days later
Regional monitoring
Monthly sampling at c. 20 stations
Biweekly sampling for harmful algae near aquaculture facilities
Primary production – one c. 30 year long time series at mouth of Gullmar fjord
FerryBox on cargo ship TransPaper operated in co-operation with Finnish colleagues
Buoys
Läsö mooring in the Kattegat
Väderöbod mooring in the Skagerrak
New profiling mooring in the Koster Sea national park
Satellite data
Surface scums of cyanobacteria (Baltic Algae Watch System)
Near surface chlorophyll (not operational today)
Coccolithophorid distribution (in connection with possible acidification of the sea)
Models
3-D physical model HIROMB 2 nm
Biogeochemical model SCOBI
River runoff (HYPE)
Data sharing facilities
Natinal Oceanographic Data Centre for Sweden
Facilities for distributing data in near real time, e.g.
Seprise European facility for sharing oceanographic data
4oW 0o 4oE 8oE 12oE 50oN
52oN
54oN
56oN
58oN
60oN

Koster Sea National park
Mooring with sensors on profiling platform
max depth for system is 200 m
service interval 2-3 months
Orust
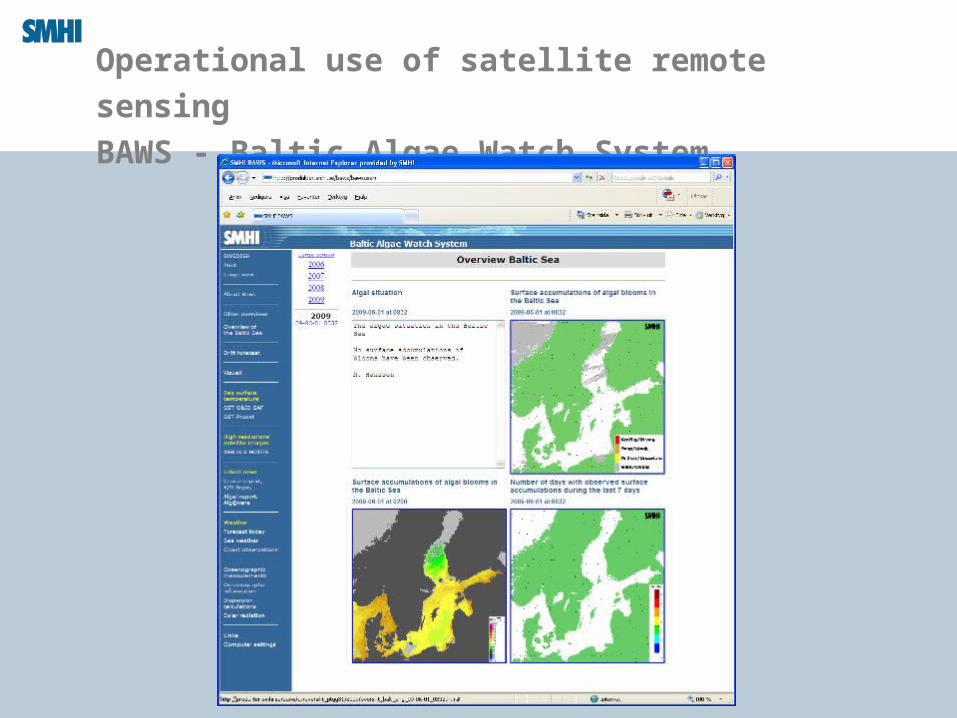
Operational use of satellite remote sensing
BAWS - Baltic Algae Watch System
Models & data sharing
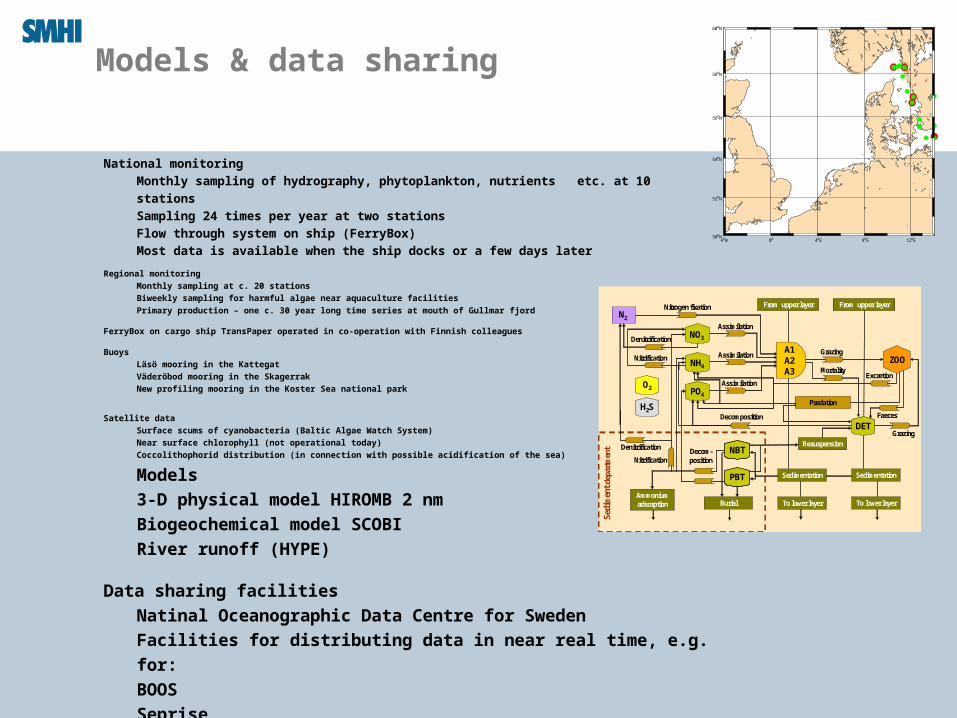
National monitoring
Monthly sampling of hydrography, phytoplankton, nutrients etc. at 10
stations
Sampling 24 times per year at two stations
Flow through system on ship (FerryBox)
Most data is available when the ship docks or a few days later
Regional monitoring
Monthly sampling at c. 20 stations
Biweekly sampling for harmful algae near aquaculture facilities
Primary production – one c. 30 year long time series at mouth of Gullmar fjord
FerryBox on cargo ship TransPaper operated in co-operation with Finnish colleagues
Buoys
Läsö mooring in the Kattegat
Väderöbod mooring in the Skagerrak
New profiling mooring in the Koster Sea national park
Satellite data
Surface scums of cyanobacteria (Baltic Algae Watch System)
Near surface chlorophyll (not operational today)
Coccolithophorid distribution (in connection with possible acidification of the sea)
Models
3-D physical model HIROMB 2 nm
Biogeochemical model SCOBI
River runoff (HYPE)
Data sharing facilities
Natinal Oceanographic Data Centre for Sweden
Facilities for distributing data in near real time, e.g. for:
BOOS
Seprise
4oW 0o 4oE 8oE 12oE 50oN
52oN
54oN
56oN
58oN
60oN
Nitrification
PBT
From upper layer
O2
DET
PO4
NO3
NH4
N2
Predation
Grazing
Mortality
Grazing
Faeces
Assimilation
Decomposition
Excretion
Nitrogen fixation
Denitrification
NBT
A1A2A3
Assimilation
Assimilation
Ammonium adsorption
Sedimentation
To lower layer To lower layer
Sedimentation
From upper layer
H2S
Denitrification
Burial
Decom-position
Resuspension
Sedi
men
tdep
artm
ent
Nitrification
ZOO

Examples of some possible EMECO products –
use of long and short term data
Phytoplankton biomass – chlorophyll maps based
on a combination of data from research
vessels, FerryBox-systems and satellites.
Weekly, monthly, yearly
5-year average for quality assessments.
Primary production (difficult)
Harmful Algal Bloom warnings
Carbonate system, e.g. pH, alkalinity, distribution
of Coccolithophorids (acidification indicator)
Hypoxia maps
Nutrients
River flow
Supporting physical oceanographic data
David Mills Questions & Answers
What are we doing?
You heard it already!
What can we bring to a North Sea Observatory?
Everything mentioned
Highlights:
Ecosystems approach by combining different types of data
Expertise regarding HABs
Data sharing and presentations at the European level
River runoff model at hte European level
In addition
Alliance for coastal technologies
- a system for recurring intercalibration exercises etc.
What are our scientific and policy requirements?
Challenge – the natural temporal and spatial variability
Our waters are strongly stratified !- phytoplankton in sub surface layers
Special needs regarding transports to and from the Baltic Sea – boundary conditions
WFD + MSFD
Thank you for your attention
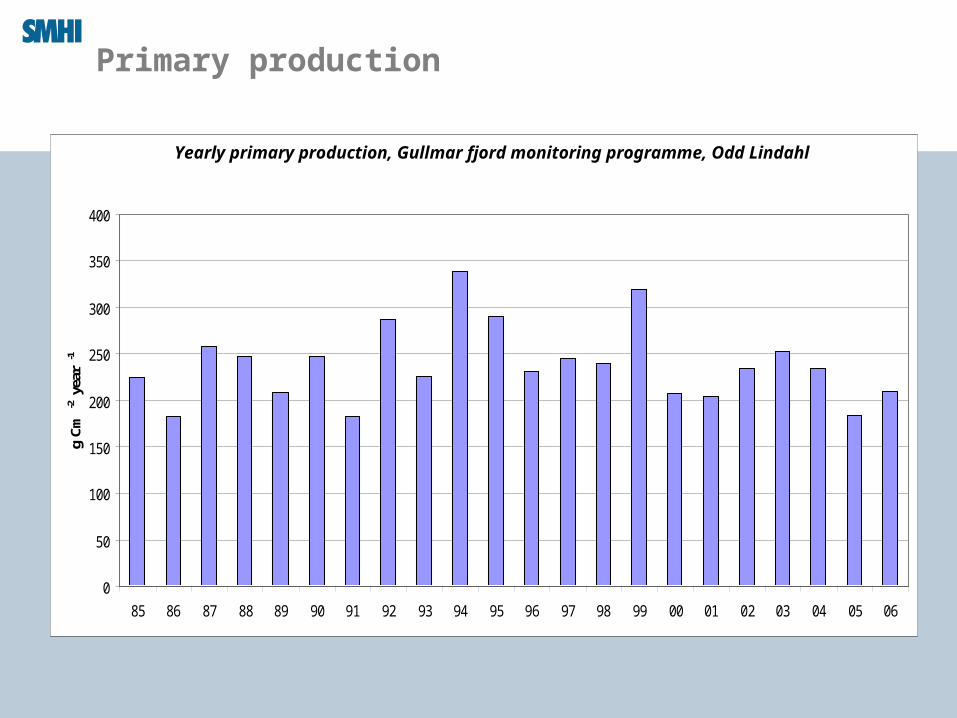
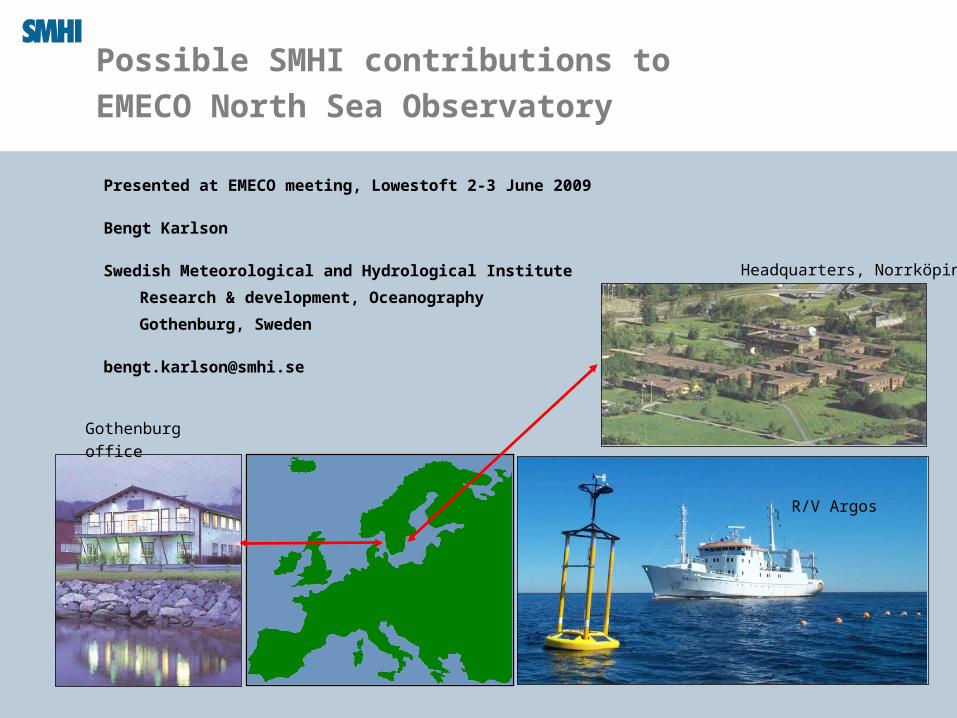
Primary production
Primärproduktion Gullmarsfjordens mynning
0
50
100
150
200
250
300
350
400
85 86 87 88 89 90 91 92 93 94 95 96 97 98 99 00 01 02 03 04 05 06
g C
m-2
yea
r-1
Yearly primary production, Gullmar fjord monitoring programme, Odd Lindahl