Embed Size (px)
Citation preview
09 / 23 / 2005 [email protected] 1
Predicting Protein Function Using Machine-Learned Hierarchical Classifiers
Roman Eisner
Supervisors: Duane Szafron and Paul Lu
09 / 23 / 2005 [email protected] 2
Outline
Introduction Predictors Evaluation in a Hierarchy Local Predictor Design Experimental Results Conclusion
09 / 23 / 2005 [email protected] 3
09 / 23 / 2005 [email protected] 4
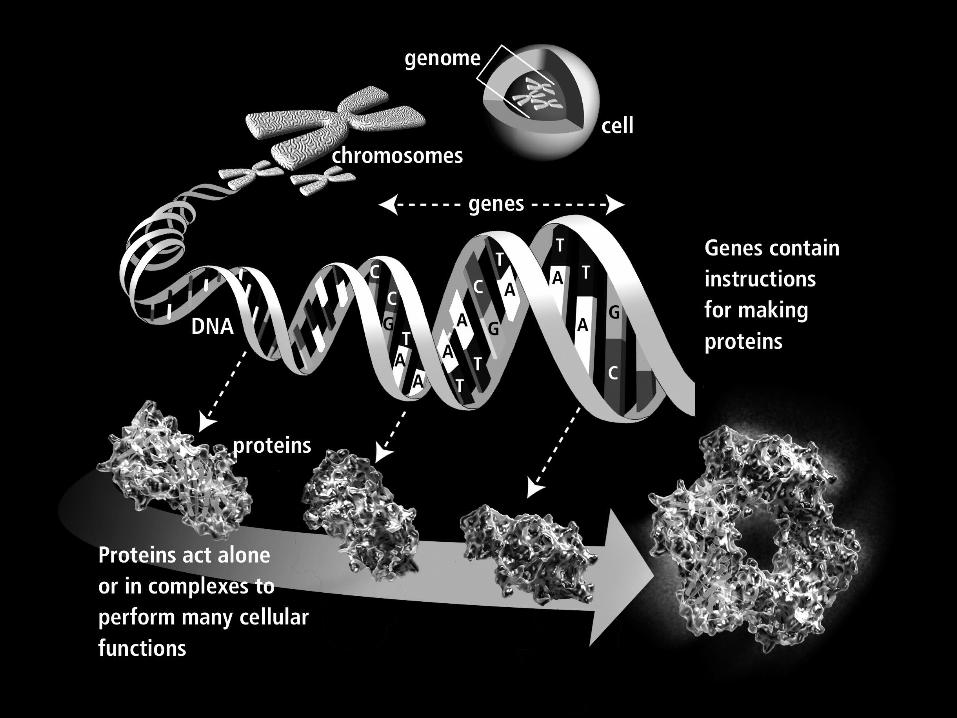
Proteins
Functional Units in the cell Perform a Variety of Functions
e.g. Catalysis of reactions, Structural and mechanical roles, transport of other molecules
Can take years to study a single protein Any good leads would be helpful!
09 / 23 / 2005 [email protected] 5
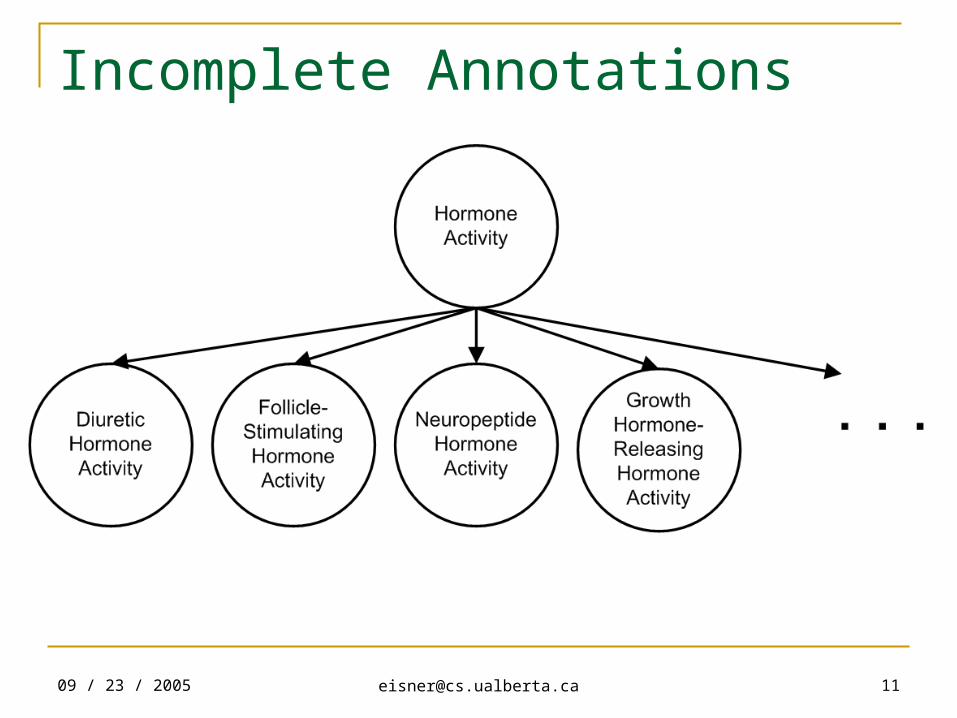
Protein Function Prediction and Protein Function Determination Prediction:
An estimate of what function a protein performs Determination:
Work in a laboratory to observe and discover what function a protein performs
Prediction complements determination
09 / 23 / 2005 [email protected] 6
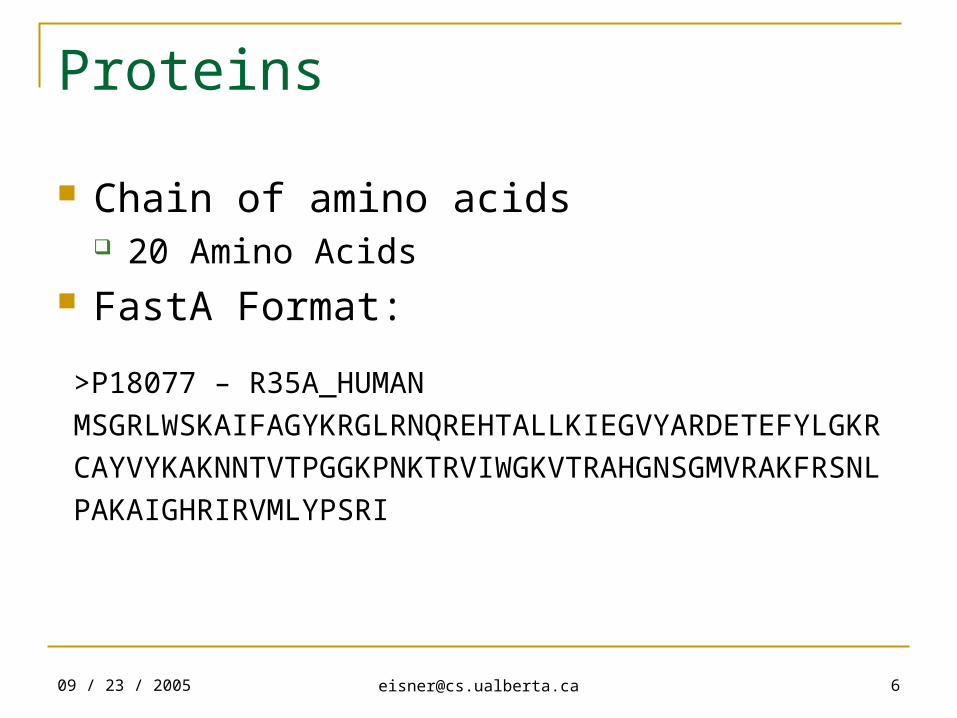
Proteins
Chain of amino acids 20 Amino Acids
FastA Format:
>P18077 – R35A_HUMAN
MSGRLWSKAIFAGYKRGLRNQREHTALLKIEGVYARDETEFYLGKR
CAYVYKAKNNTVTPGGKPNKTRVIWGKVTRAHGNSGMVRAKFRSNL
PAKAIGHRIRVMLYPSRI
09 / 23 / 2005 [email protected] 7
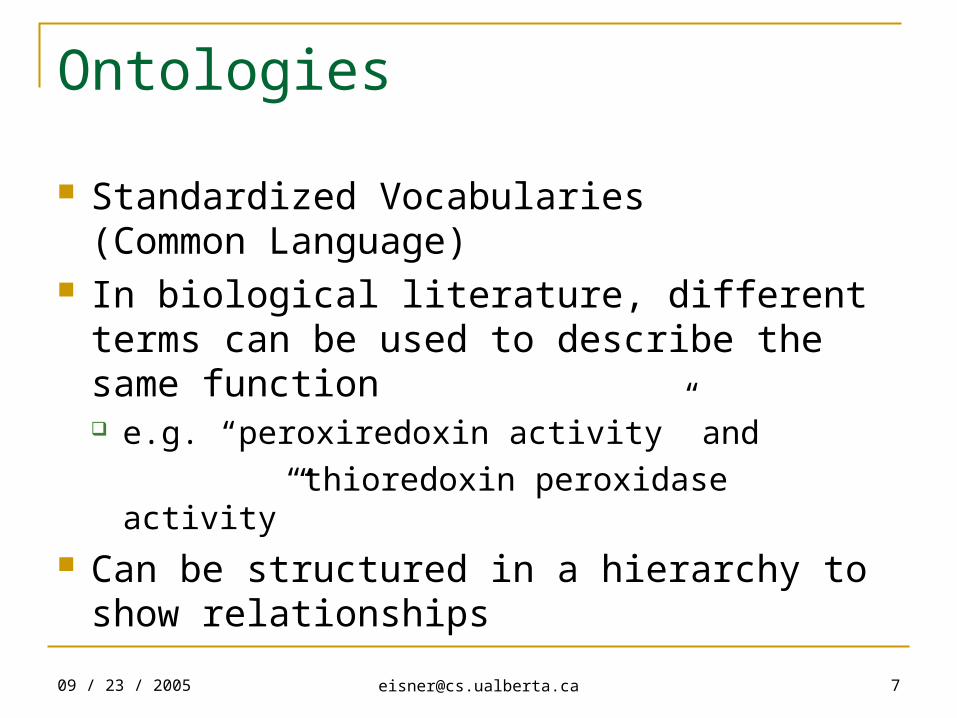
Ontologies
Standardized Vocabularies (Common Language)
In biological literature, different terms can be used to describe the same function e.g. “peroxiredoxin activity” and
“thioredoxin peroxidase activity” Can be structured in a hierarchy to show
relationships
09 / 23 / 2005 [email protected] 8
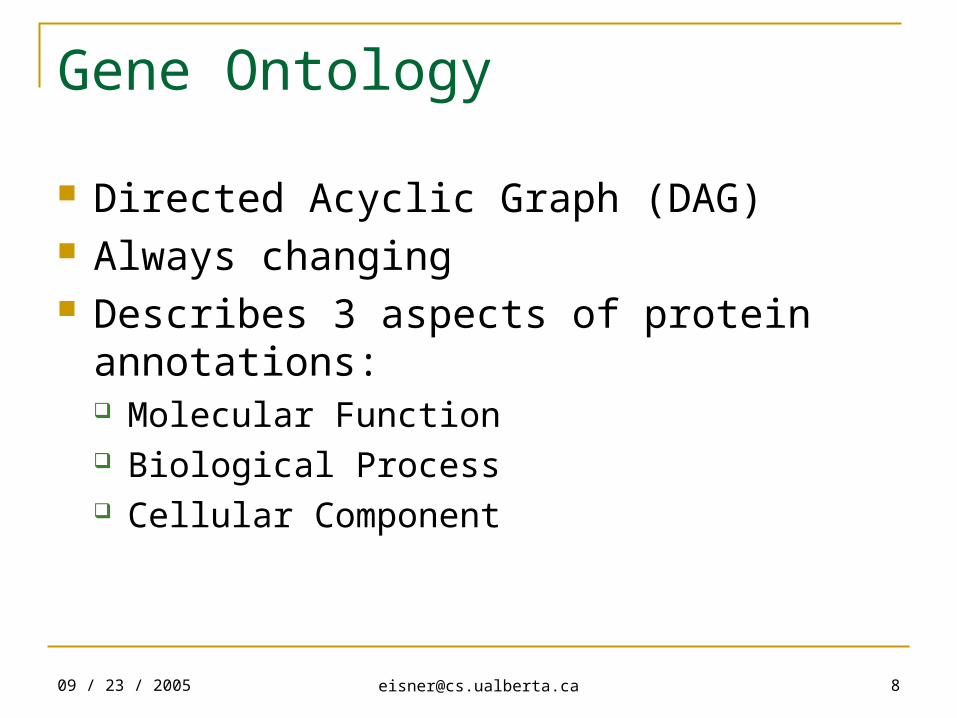
Gene Ontology
Directed Acyclic Graph (DAG) Always changing Describes 3 aspects of protein annotations:
Molecular Function Biological Process Cellular Component
09 / 23 / 2005 [email protected] 9
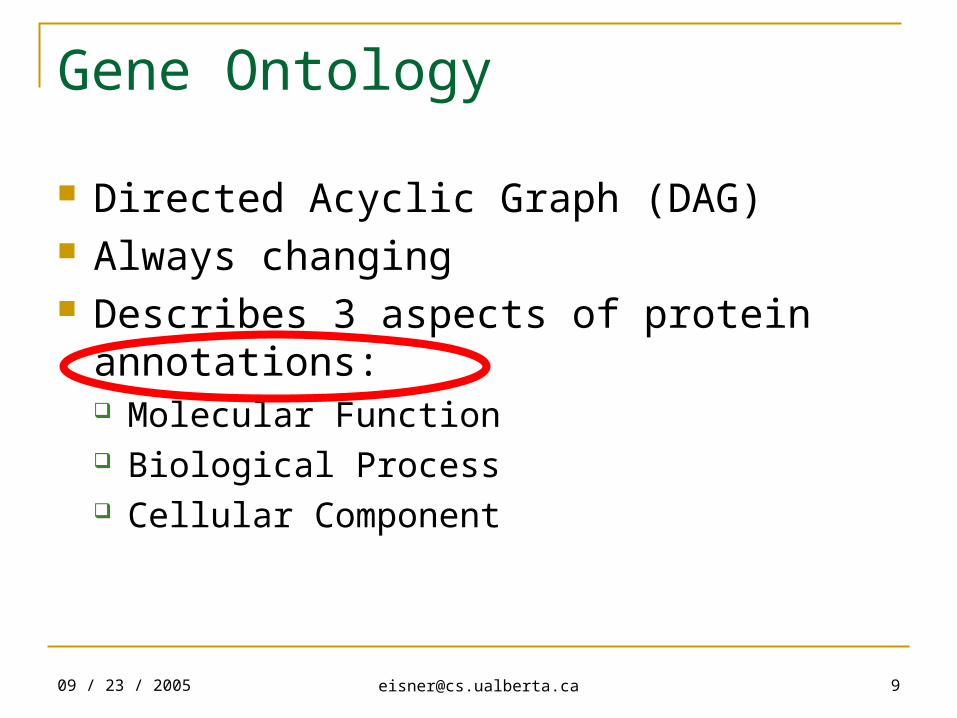
Gene Ontology
Directed Acyclic Graph (DAG) Always changing Describes 3 aspects of protein annotations:
Molecular Function Biological Process Cellular Component
09 / 23 / 2005 [email protected] 10
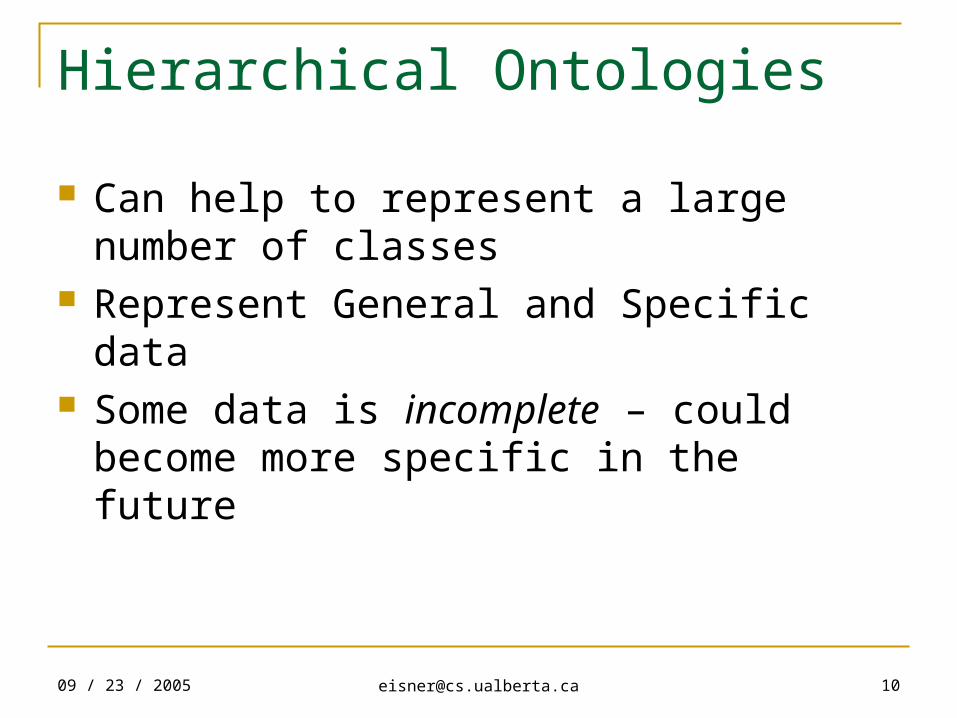
Hierarchical Ontologies
Can help to represent a large number of classes
Represent General and Specific data Some data is incomplete – could become
more specific in the future
09 / 23 / 2005 [email protected] 13
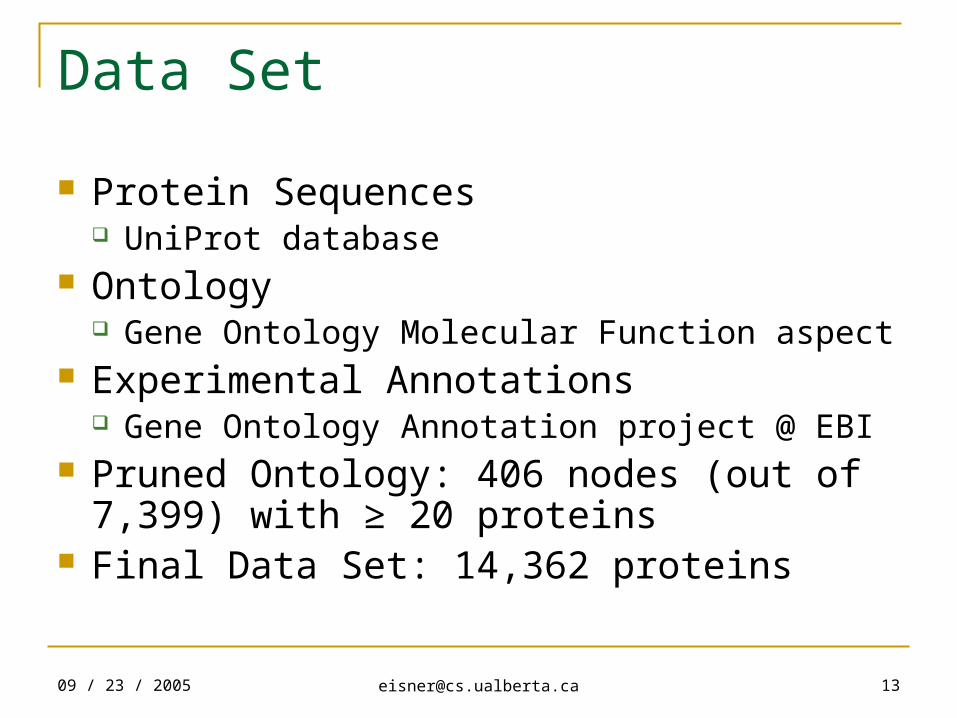
Data Set
Protein Sequences UniProt database
Ontology Gene Ontology Molecular Function aspect
Experimental Annotations Gene Ontology Annotation project @ EBI
Pruned Ontology: 406 nodes (out of 7,399) with ≥ 20 proteins
Final Data Set: 14,362 proteins

09 / 23 / 2005 [email protected] 14
Outline
Introduction Predictors Evaluation in a Hierarchy Local Predictor Design Experimental Results Conclusion
09 / 23 / 2005 [email protected] 15
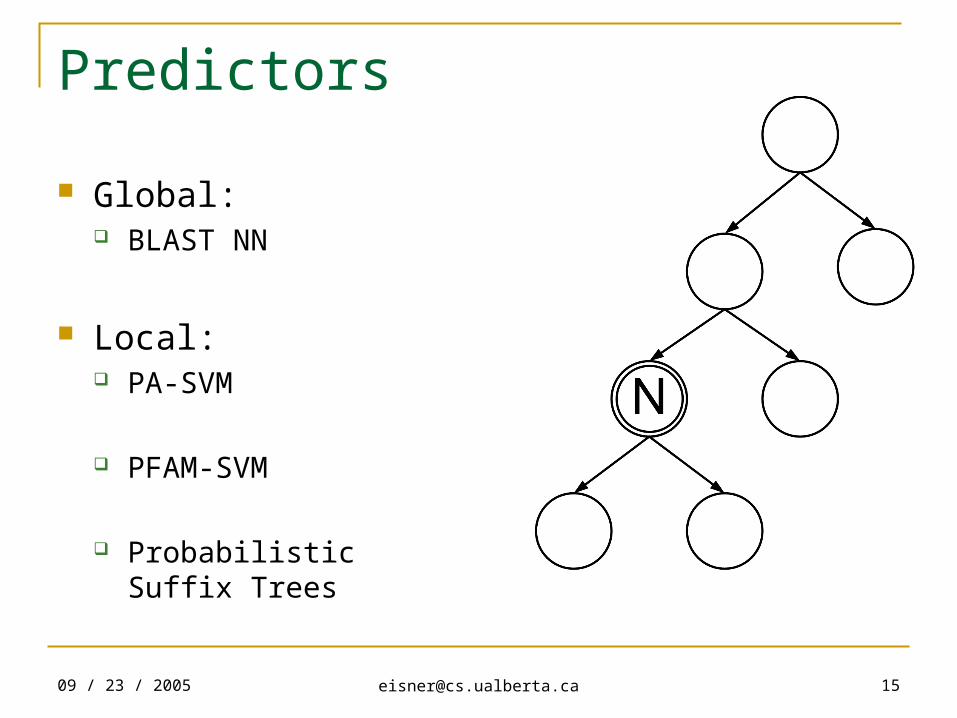
Predictors
Global: BLAST NN
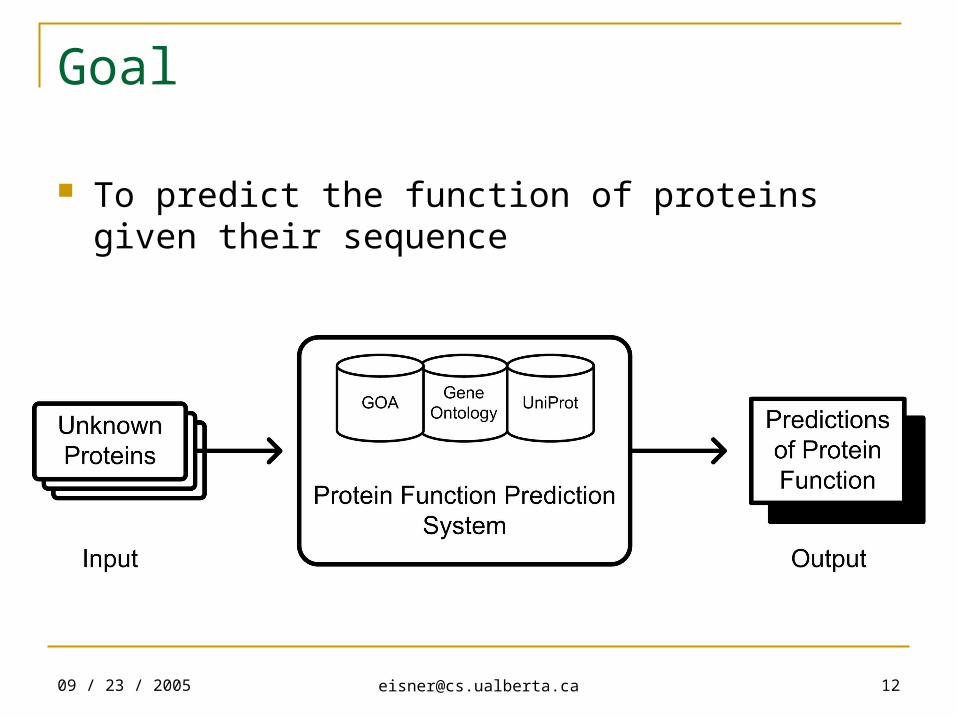
Local: PA-SVM
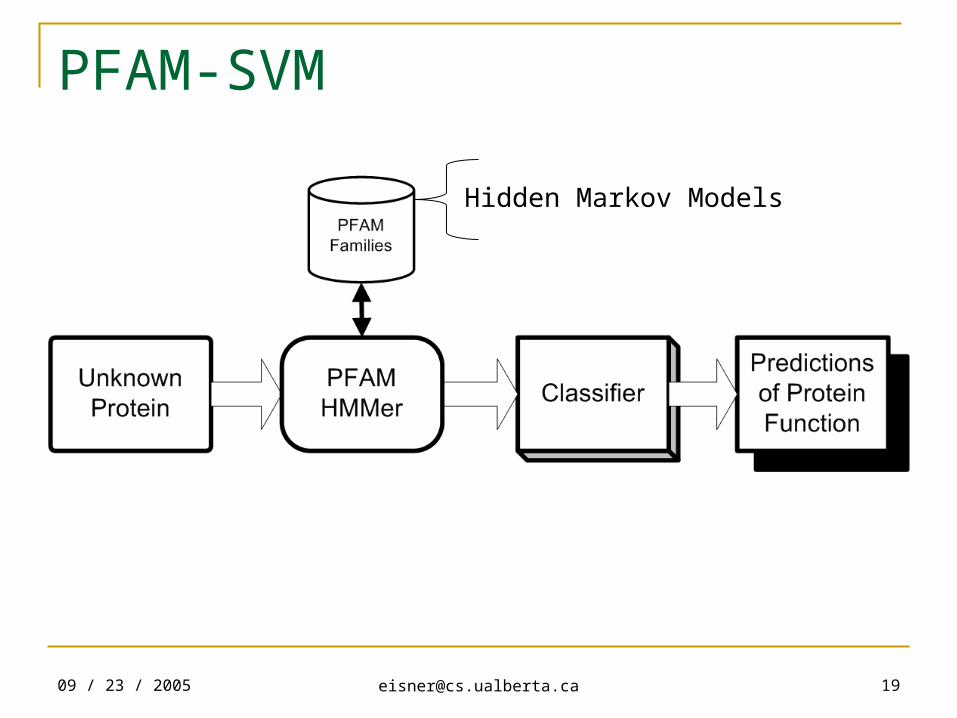
PFAM-SVM
Probabilistic Suffix Trees
09 / 23 / 2005 [email protected] 16
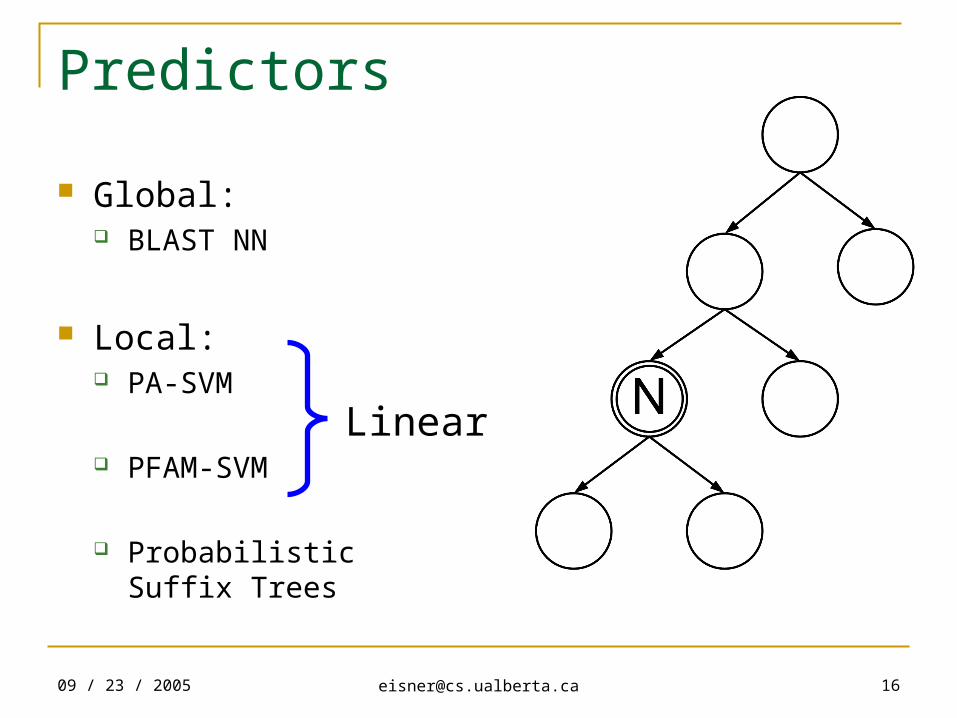
Predictors
Global: BLAST NN
Local: PA-SVM
PFAM-SVM
Probabilistic Suffix Trees
Linear
09 / 23 / 2005 [email protected] 17
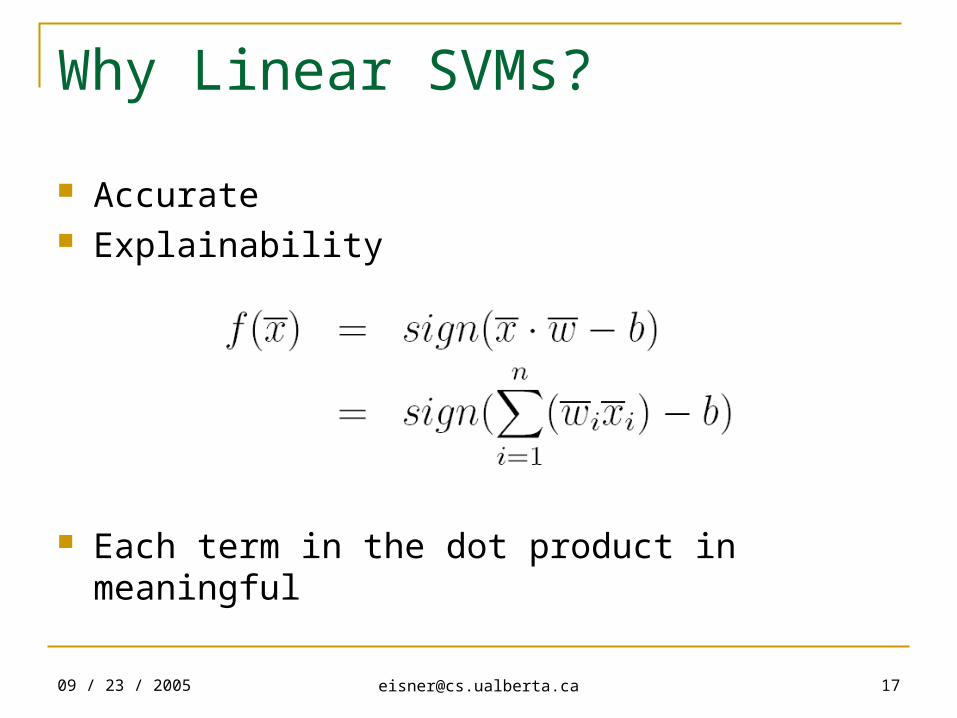
Why Linear SVMs?
Accurate Explainability
Each term in the dot product in meaningful
09 / 23 / 2005 [email protected] 20
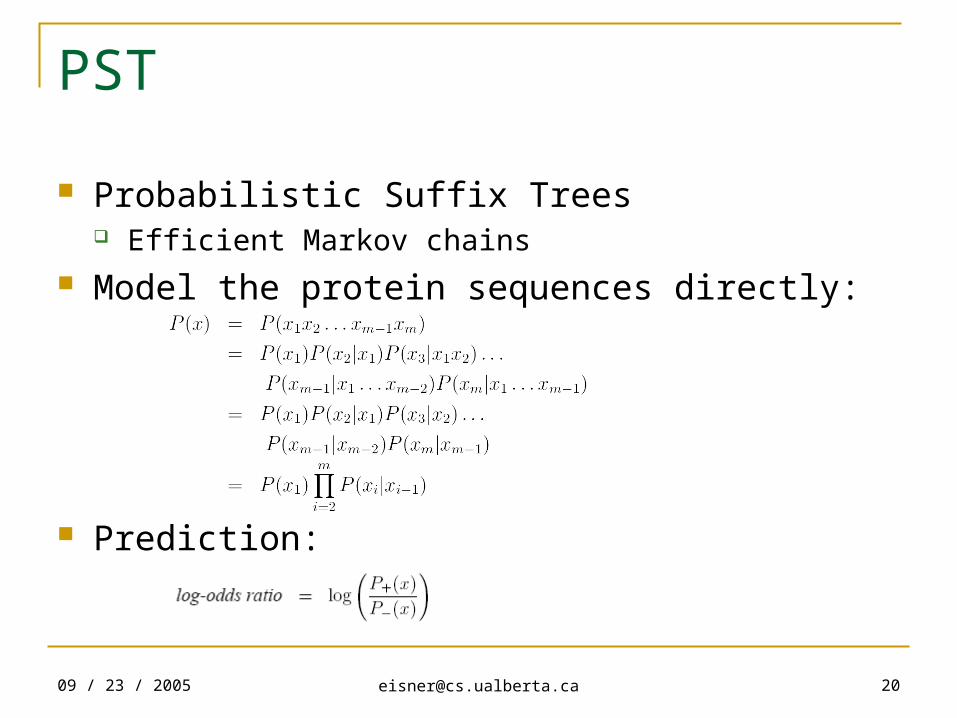
PST
Probabilistic Suffix Trees Efficient Markov chains
Model the protein sequences directly:
Prediction:
09 / 23 / 2005 [email protected] 21
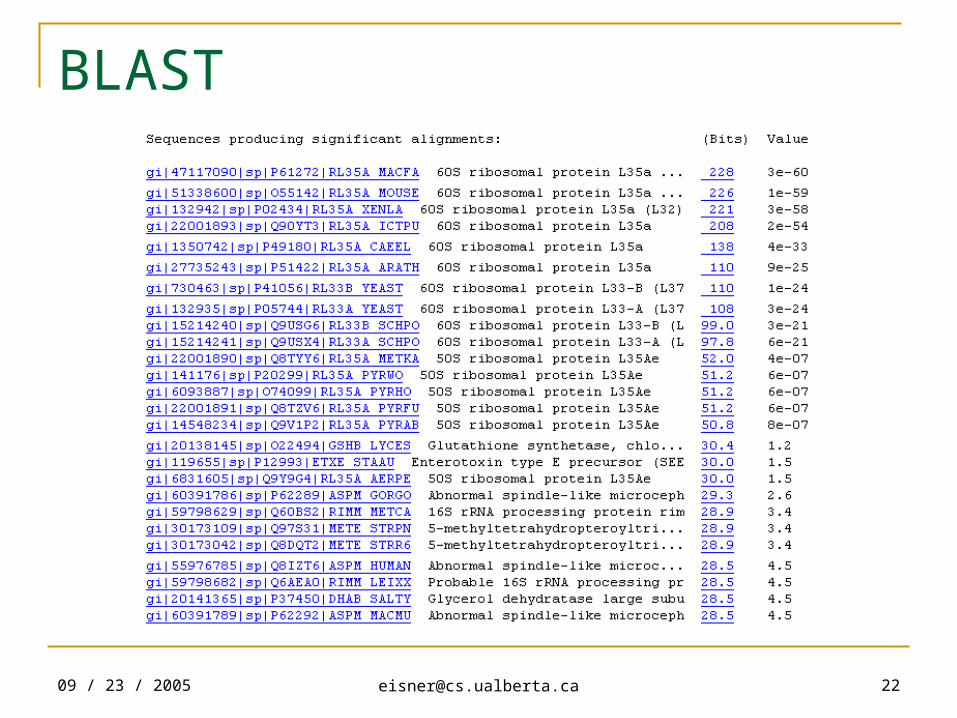
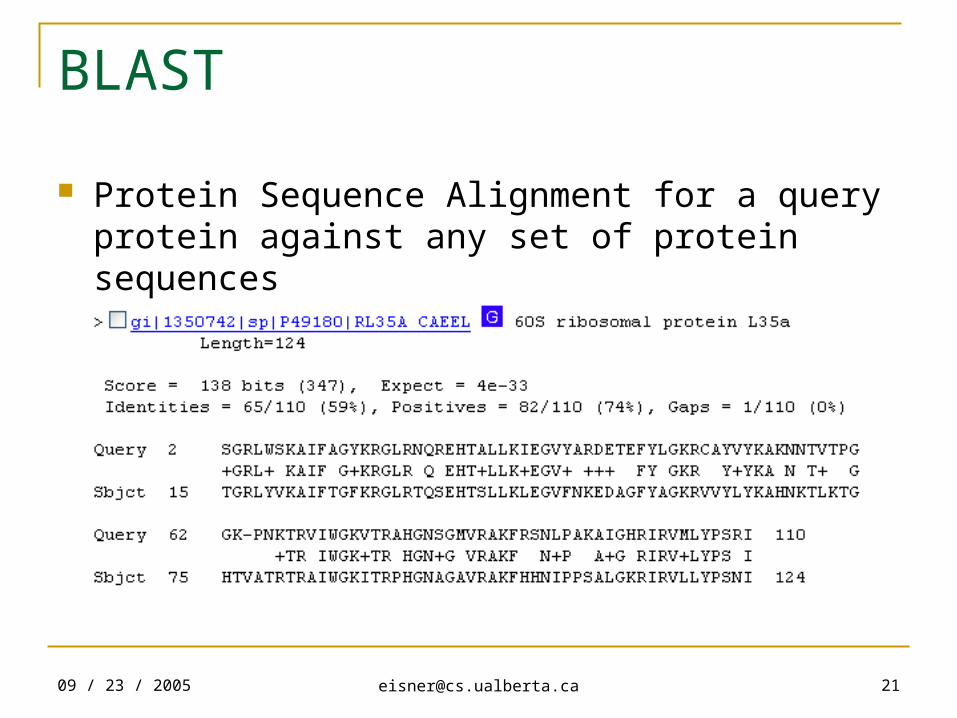
BLAST
Protein Sequence Alignment for a query protein against any set of protein sequences
09 / 23 / 2005 [email protected] 23
Outline
Introduction Predictors Evaluation in a Hierarchy Local Predictor Design Experimental Results Conclusion
09 / 23 / 2005 [email protected] 24
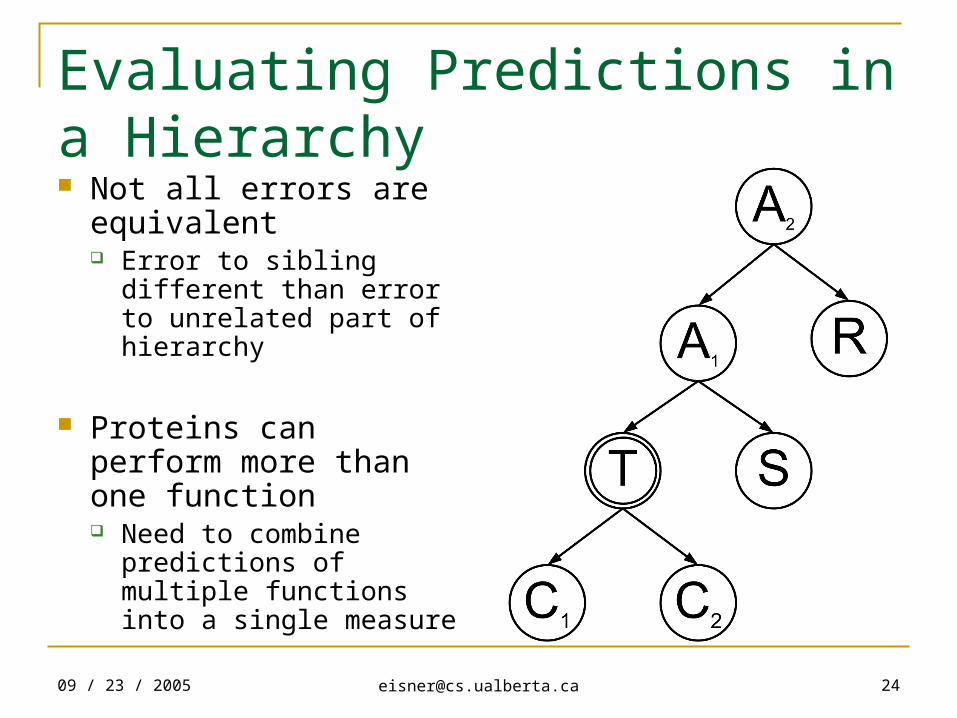
Evaluating Predictions in a Hierarchy Not all errors are
equivalent Error to sibling different
than error to unrelated part of hierarchy
Proteins can perform more than one function Need to combine
predictions of multiple functions into a single measure
09 / 23 / 2005 [email protected] 25
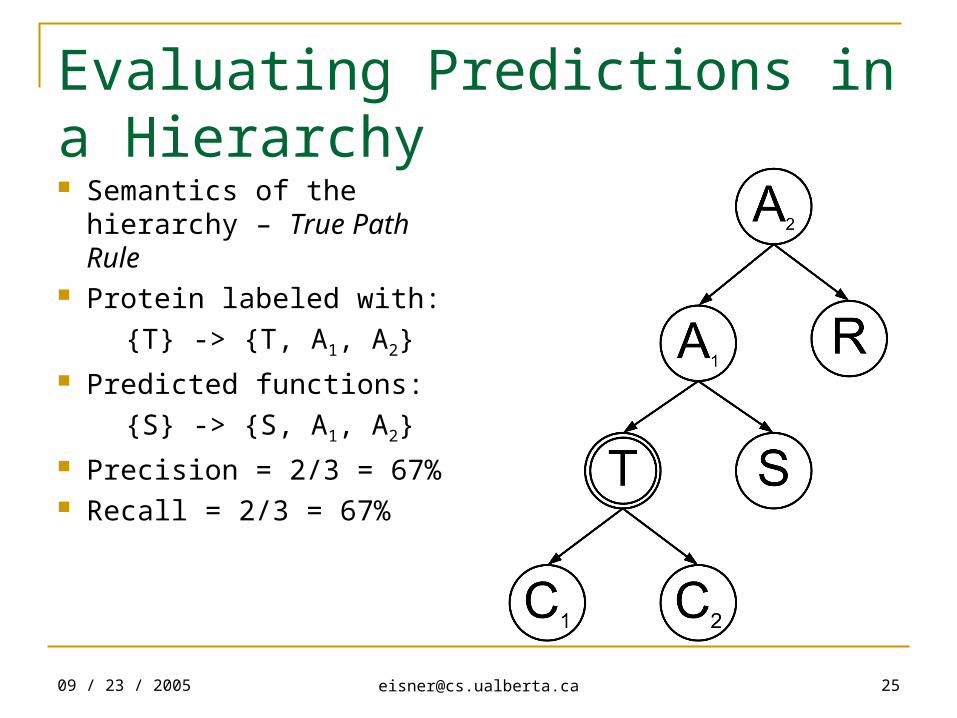
Evaluating Predictions in a Hierarchy Semantics of the
hierarchy – True Path Rule
Protein labeled with:
{T} -> {T, A1, A2} Predicted functions:
{S} -> {S, A1, A2} Precision = 2/3 = 67% Recall = 2/3 = 67%
09 / 23 / 2005 [email protected] 26
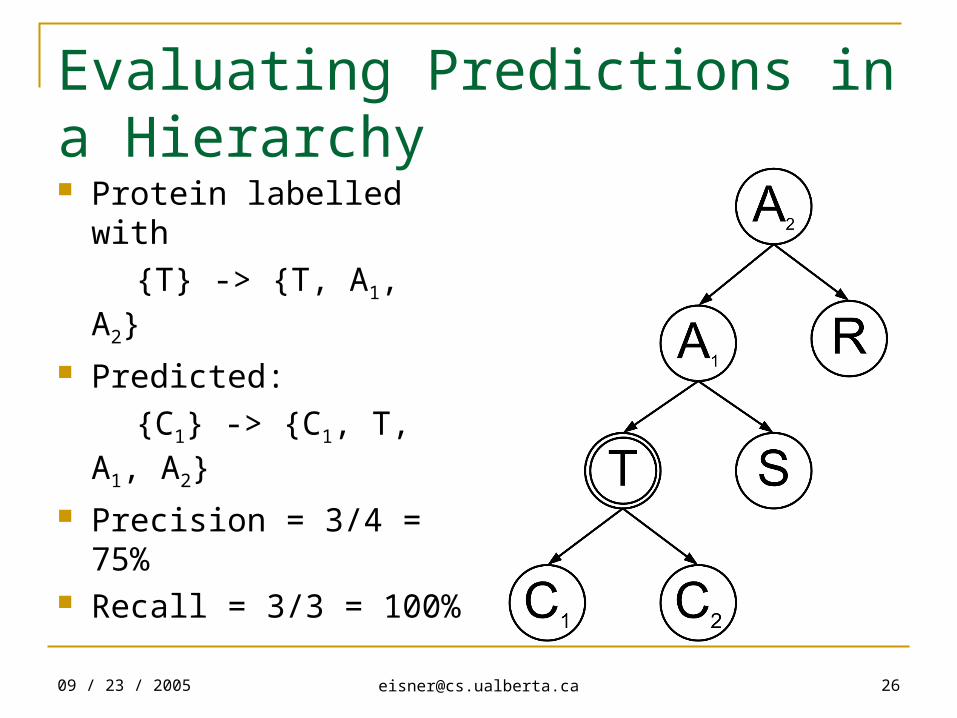
Evaluating Predictions in a Hierarchy Protein labelled with
{T} -> {T, A1, A2} Predicted:
{C1} -> {C1, T, A1, A2} Precision = 3/4 = 75% Recall = 3/3 = 100%
09 / 23 / 2005 [email protected] 28
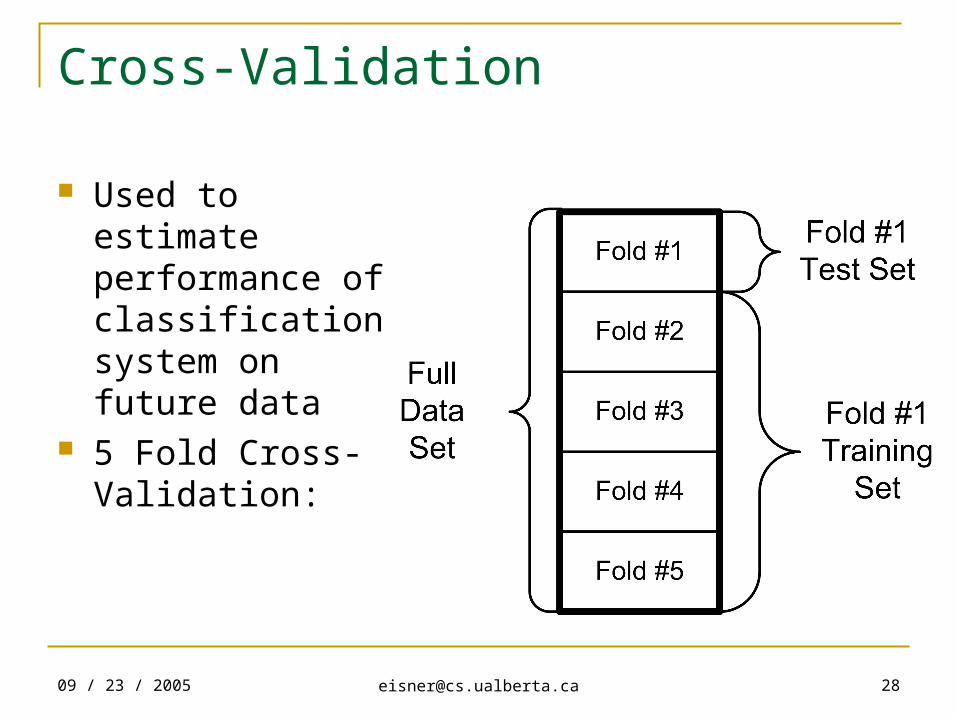
Cross-Validation
Used to estimate performance of classification system on future data
5 Fold Cross-Validation:
09 / 23 / 2005 [email protected] 29
Outline
Introduction Predictors Evaluation in a Hierarchy Local Predictor Design Experimental Results Conclusion
09 / 23 / 2005 [email protected] 30
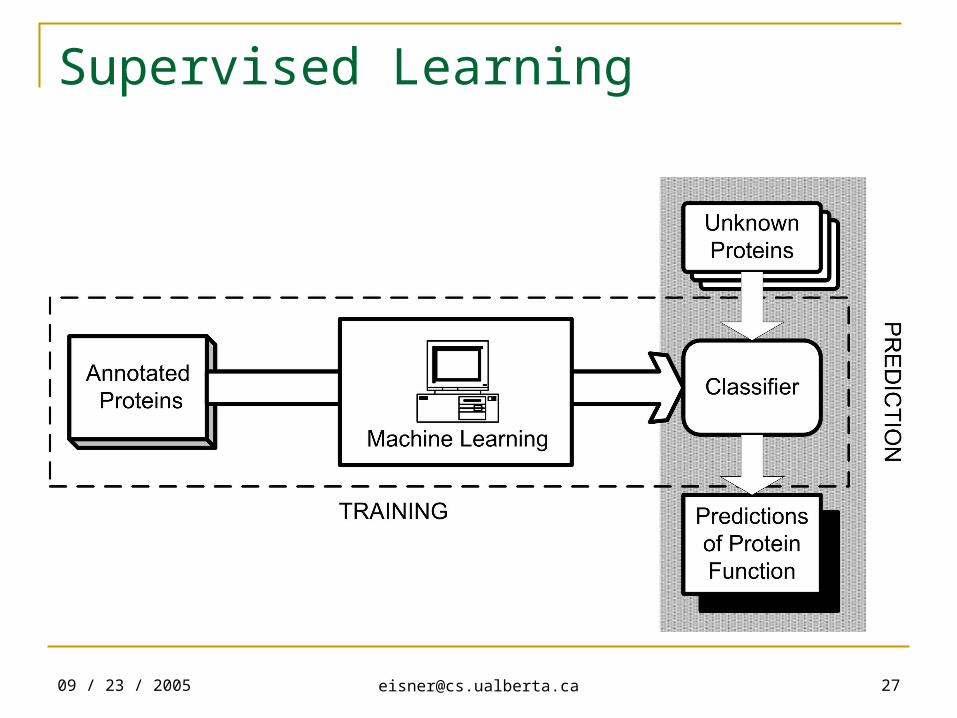
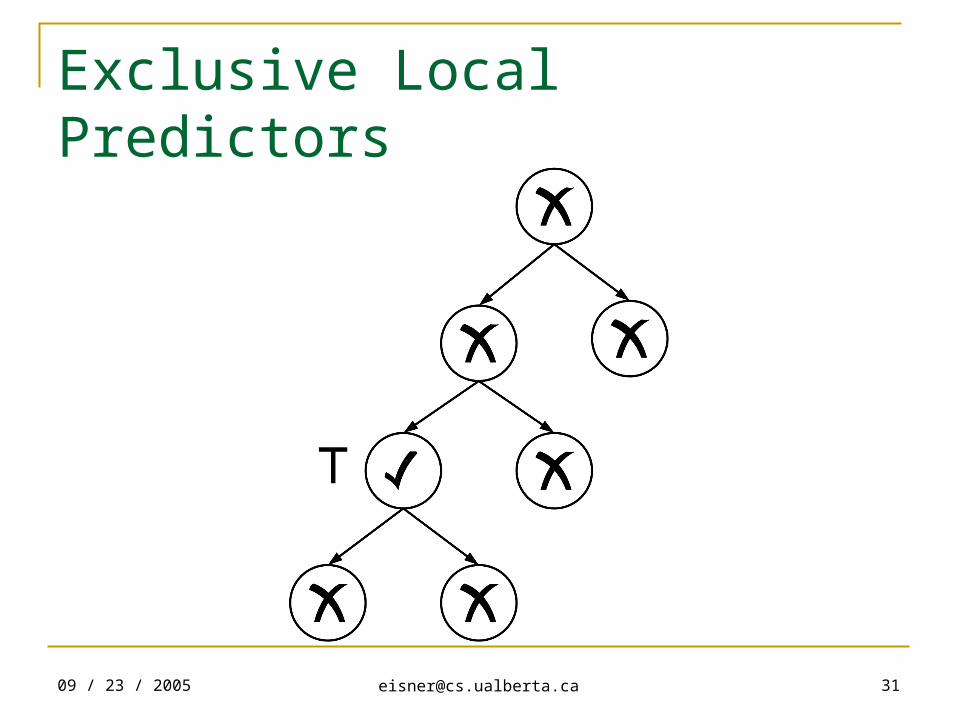
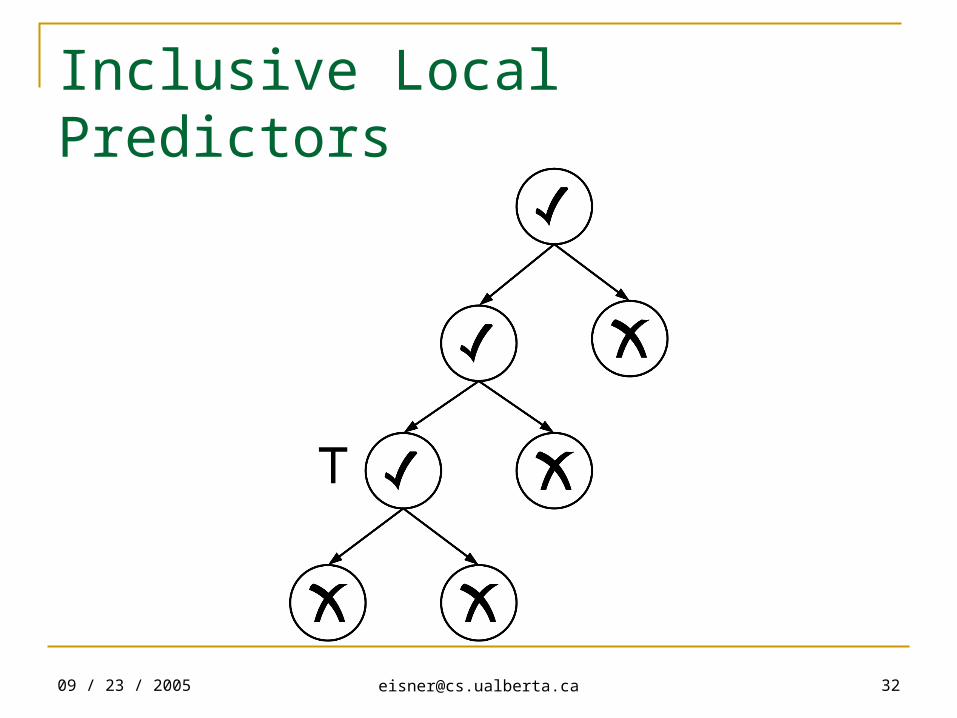
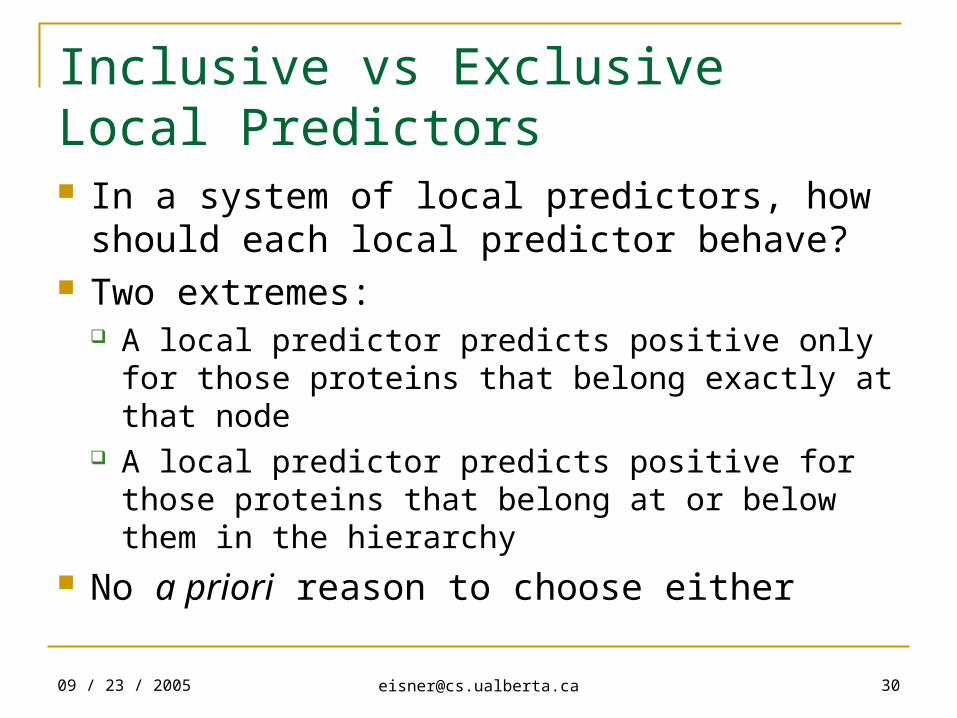
Inclusive vs Exclusive Local Predictors In a system of local predictors, how should
each local predictor behave? Two extremes:
A local predictor predicts positive only for those proteins that belong exactly at that node
A local predictor predicts positive for those proteins that belong at or below them in the hierarchy
No a priori reason to choose either
09 / 23 / 2005 [email protected] 33
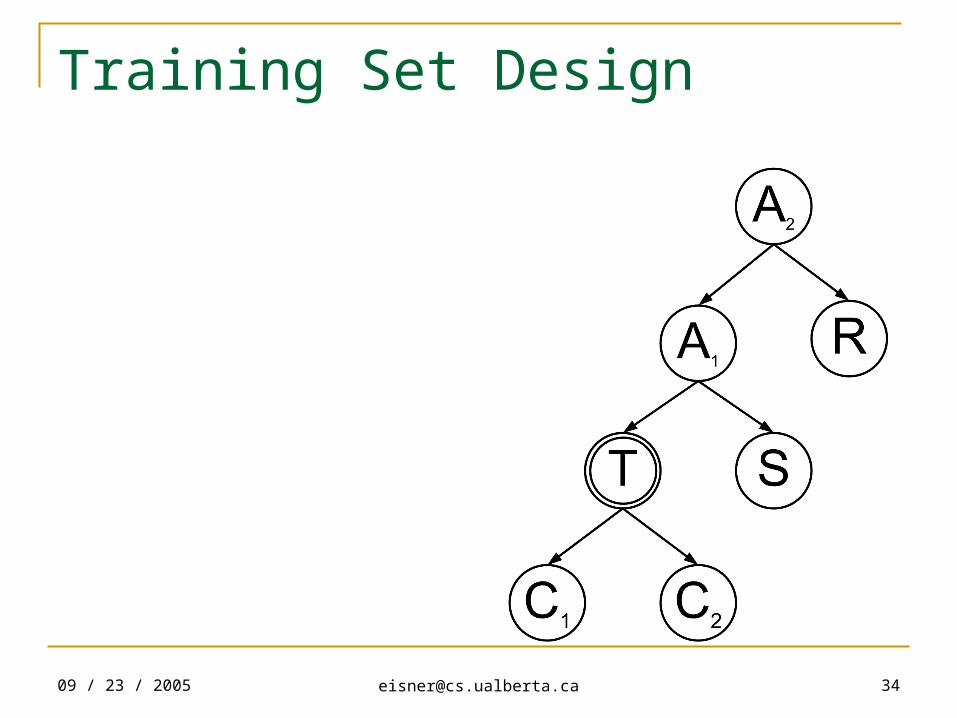
Training Set Design
Proteins in the current fold’s training set can be used in any way
Need to select for each local predictor: Positive training examples Negative training examples
09 / 23 / 2005 [email protected] 35
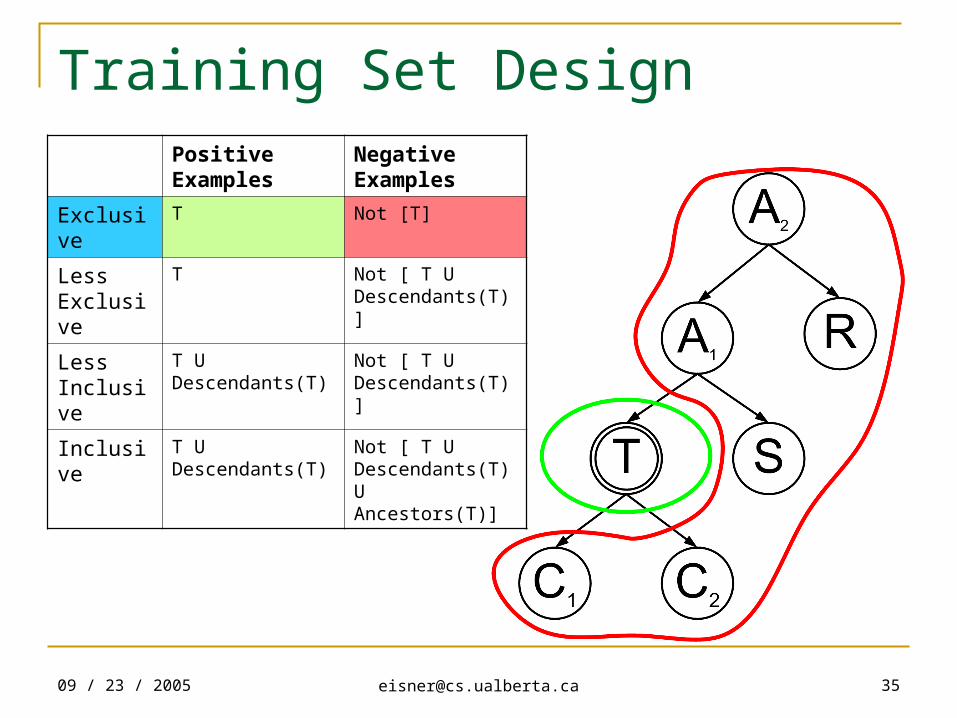
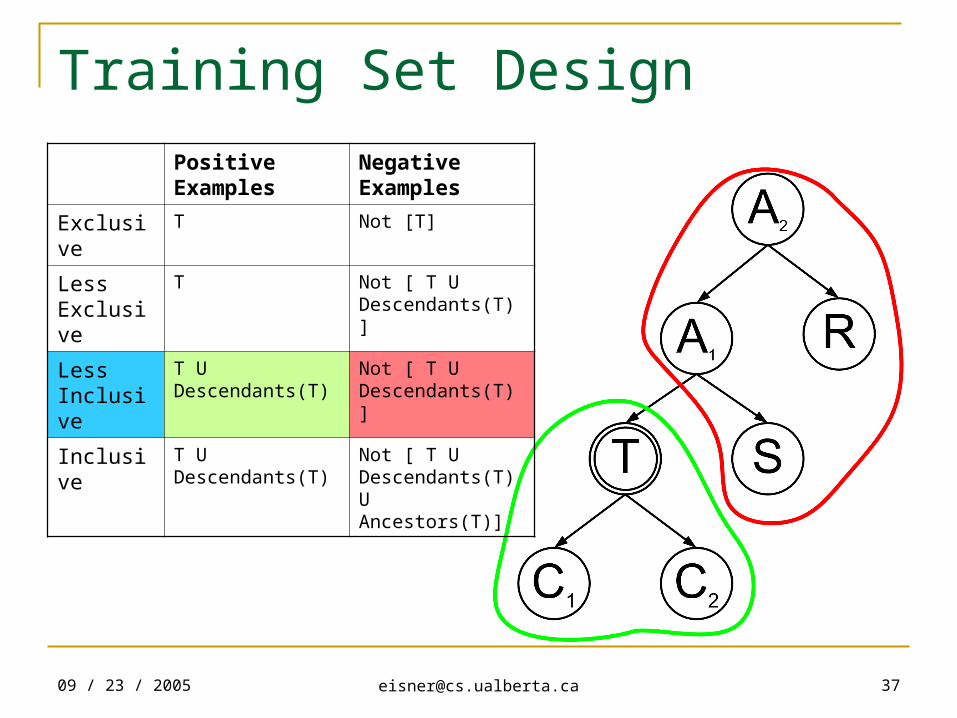
Training Set DesignPositive Examples
Negative Examples
Exclusive T Not [T]
Less Exclusive
T Not [ T U Descendants(T)]
Less Inclusive
T U Descendants(T)
Not [ T U Descendants(T)]
Inclusive T U Descendants(T)
Not [ T U Descendants(T) U Ancestors(T)]
09 / 23 / 2005 [email protected] 36
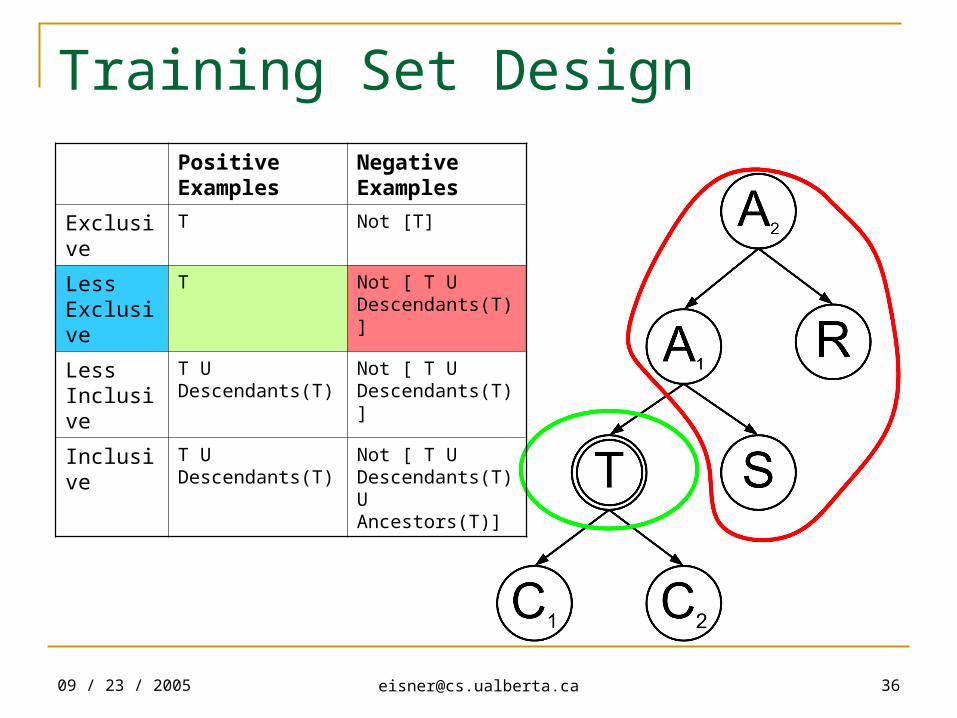
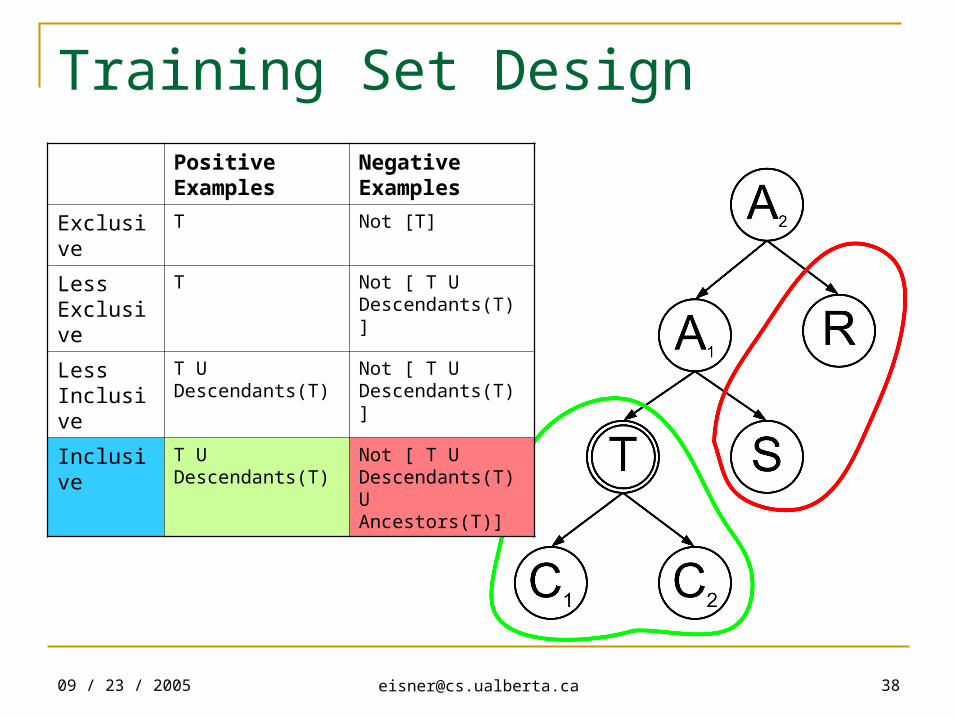
Training Set DesignPositive Examples
Negative Examples
Exclusive T Not [T]
Less Exclusive
T Not [ T U Descendants(T)]
Less Inclusive
T U Descendants(T)
Not [ T U Descendants(T)]
Inclusive T U Descendants(T)
Not [ T U Descendants(T) U Ancestors(T)]
09 / 23 / 2005 [email protected] 37
Training Set DesignPositive Examples
Negative Examples
Exclusive T Not [T]
Less Exclusive
T Not [ T U Descendants(T)]
Less Inclusive
T U Descendants(T)
Not [ T U Descendants(T)]
Inclusive T U Descendants(T)
Not [ T U Descendants(T) U Ancestors(T)]
09 / 23 / 2005 [email protected] 38
Training Set DesignPositive Examples
Negative Examples
Exclusive T Not [T]
Less Exclusive
T Not [ T U Descendants(T)]
Less Inclusive
T U Descendants(T)
Not [ T U Descendants(T)]
Inclusive T U Descendants(T)
Not [ T U Descendants(T) U Ancestors(T)]
09 / 23 / 2005 [email protected] 39
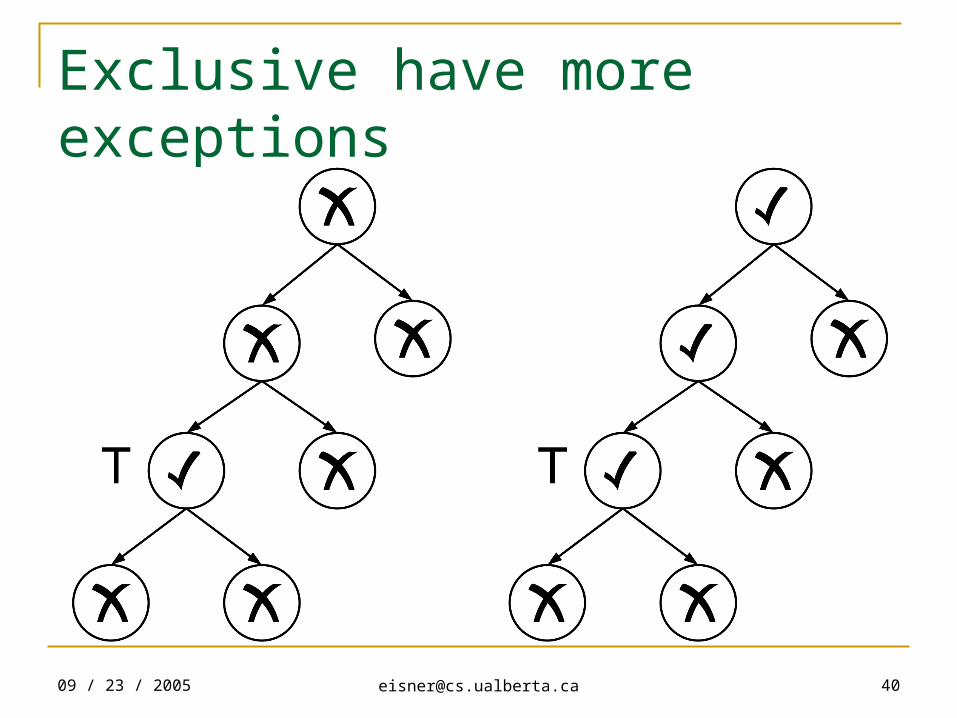
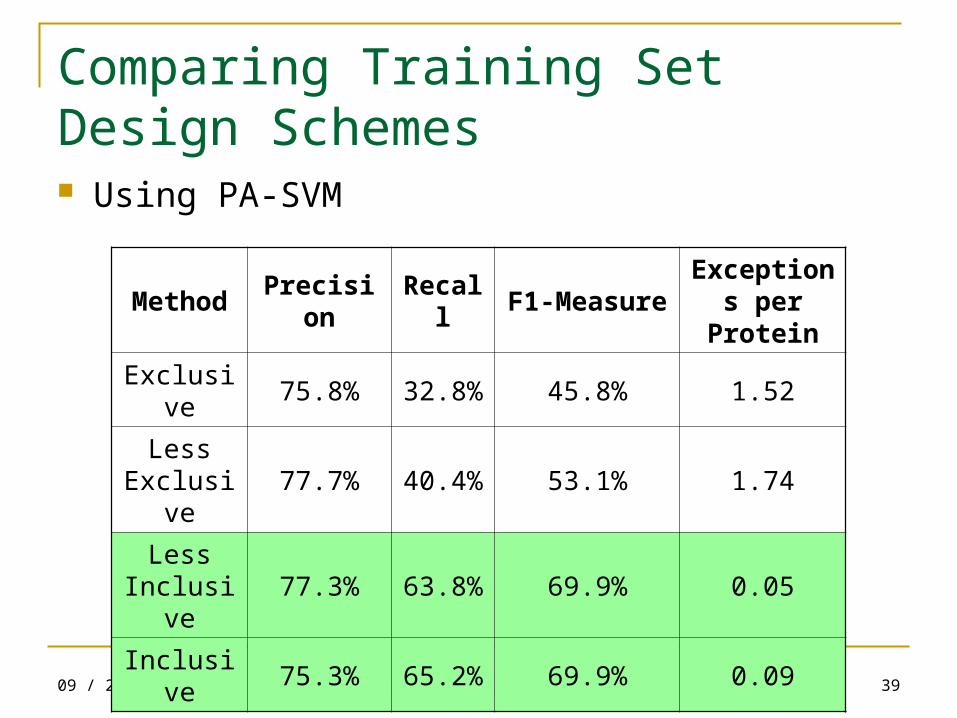
Comparing Training Set Design Schemes Using PA-SVM
Method Precision Recall F1-MeasureExceptions per Protein
Exclusive 75.8% 32.8% 45.8% 1.52
Less Exclusive
77.7% 40.4% 53.1% 1.74
Less Inclusive
77.3% 63.8% 69.9% 0.05
Inclusive 75.3% 65.2% 69.9% 0.09
09 / 23 / 2005 [email protected] 41
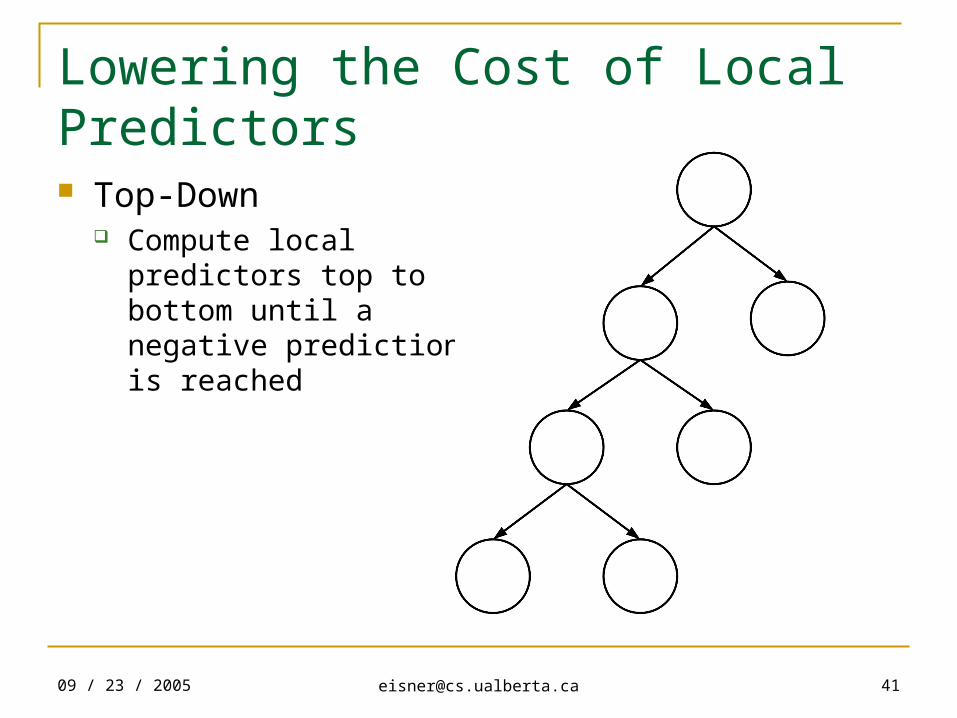
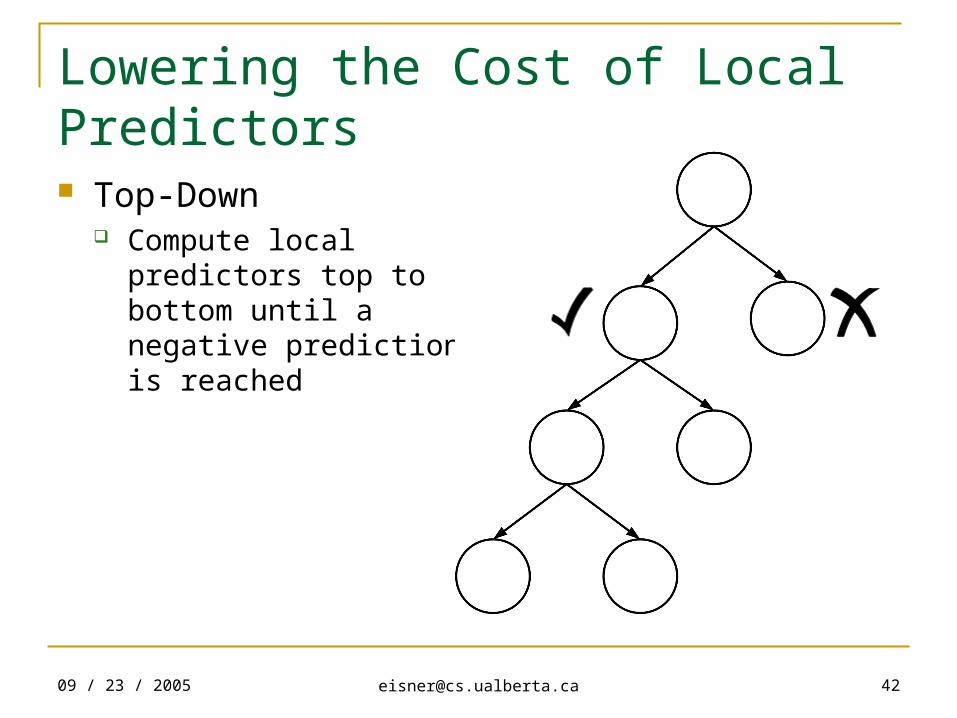
Lowering the Cost of Local Predictors Top-Down
Compute local predictors top to bottom until a negative prediction is reached
09 / 23 / 2005 [email protected] 42
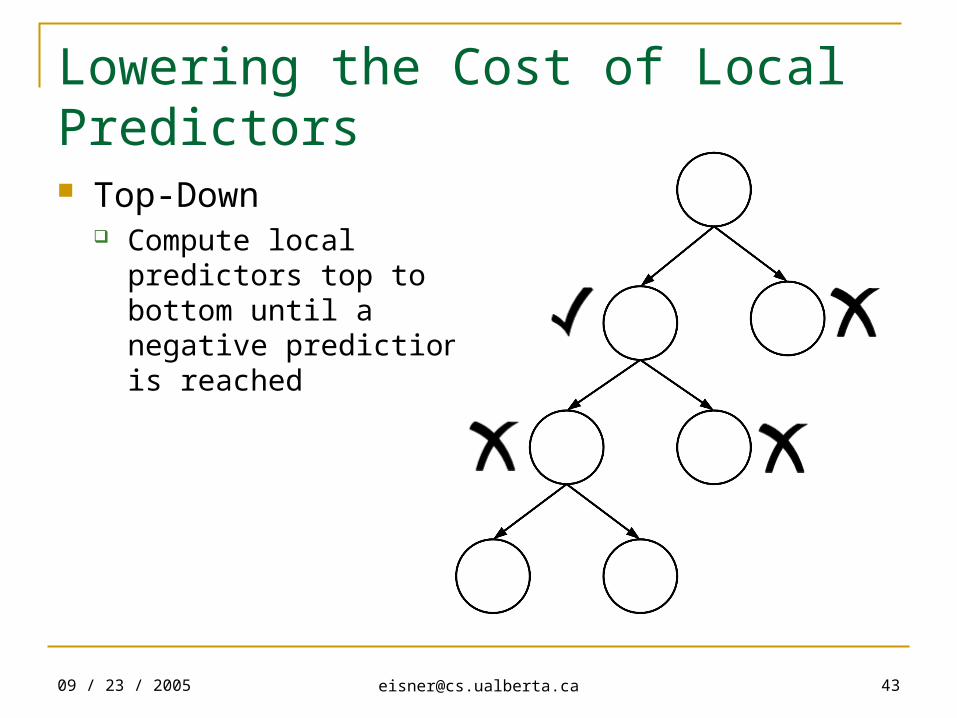
Lowering the Cost of Local Predictors Top-Down
Compute local predictors top to bottom until a negative prediction is reached
09 / 23 / 2005 [email protected] 43
Lowering the Cost of Local Predictors Top-Down
Compute local predictors top to bottom until a negative prediction is reached
09 / 23 / 2005 [email protected] 44
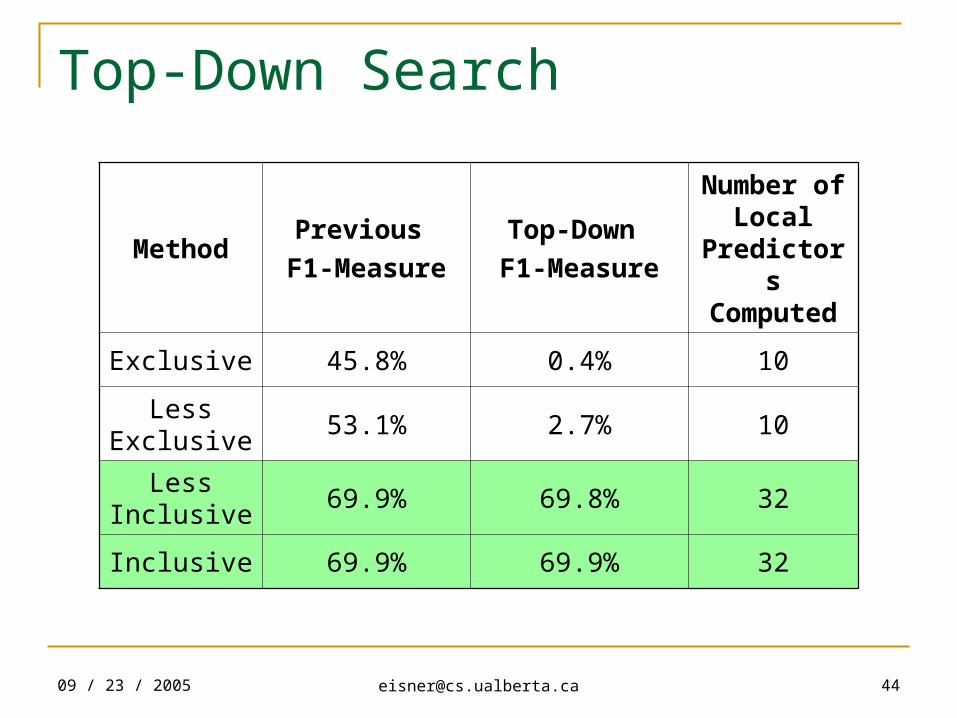
Top-Down Search
MethodPrevious
F1-Measure
Top-Down
F1-Measure
Number of Local
Predictors Computed
Exclusive 45.8% 0.4% 10
Less Exclusive
53.1% 2.7% 10
Less Inclusive
69.9% 69.8% 32
Inclusive 69.9% 69.9% 32
09 / 23 / 2005 [email protected] 45
Outline
Introduction Predictors Evaluation in a Hierarchy Local Predictor Design Experimental Results Conclusion
09 / 23 / 2005 [email protected] 46
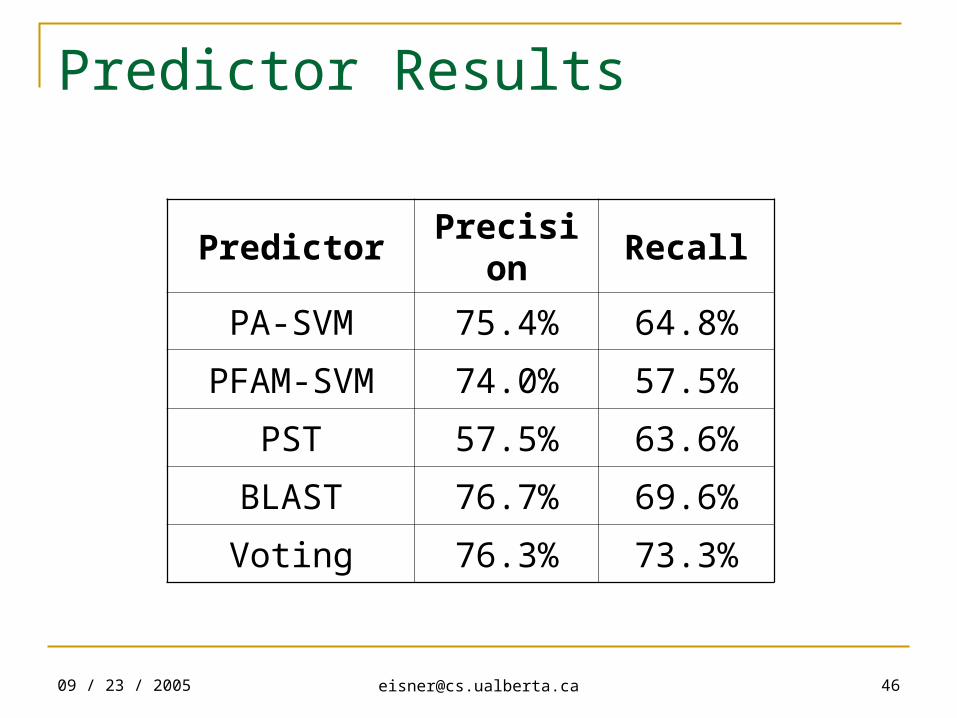
Predictor Results
Predictor Precision Recall
PA-SVM 75.4% 64.8%
PFAM-SVM 74.0% 57.5%
PST 57.5% 63.6%
BLAST 76.7% 69.6%
Voting 76.3% 73.3%
09 / 23 / 2005 [email protected] 47
Similar and Dissimilar Proteins
89% of proteins – at least one good BLAST hit Proteins which are similar (often homologous) to
the set of well studied proteins
11% of proteins – no good BLAST hit Proteins which are not similar to the set of well
studied proteins
09 / 23 / 2005 [email protected] 48
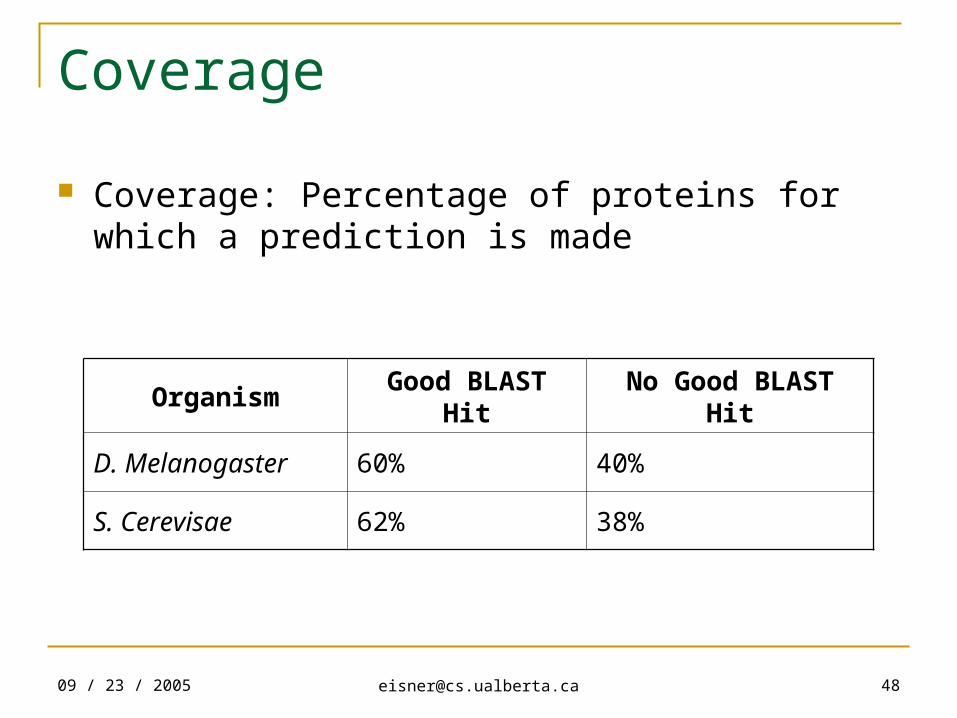
Coverage
Coverage: Percentage of proteins for which a prediction is made
Organism Good BLAST Hit No Good BLAST Hit
D. Melanogaster 60% 40%
S. Cerevisae 62% 38%
09 / 23 / 2005 [email protected] 49
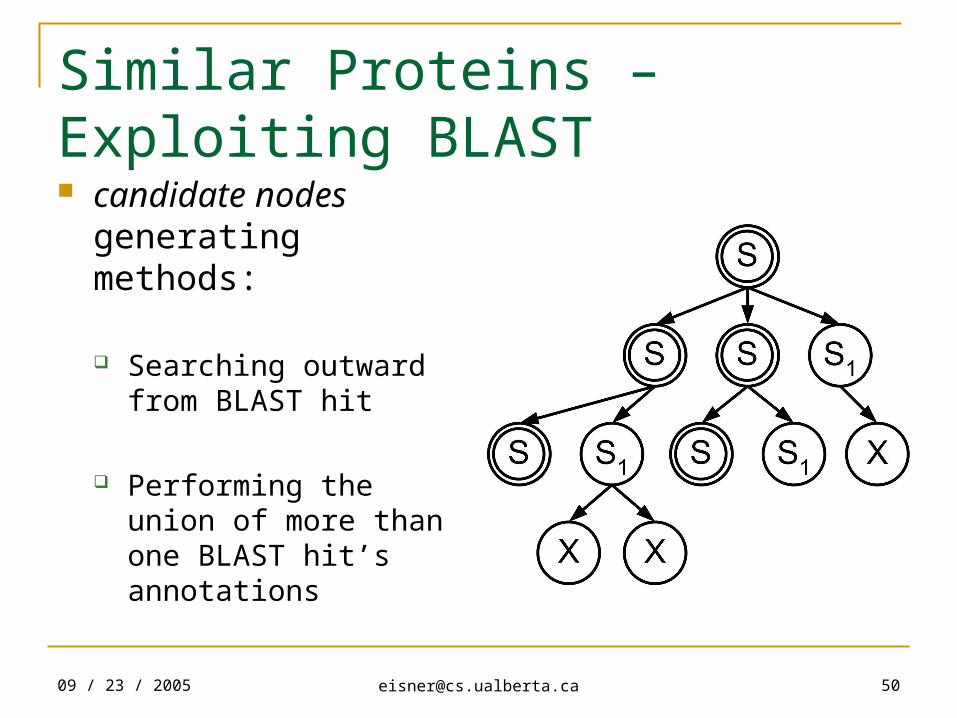
Similar Proteins – Exploiting BLAST BLAST is fast and accurate when a good hit is found
Can exploit this to lower the cost of local predictors Generate candidate nodes Only compute local predictors for candidate nodes Candidate node set should have:
High Recall Minimal Size
09 / 23 / 2005 [email protected] 50
Similar Proteins – Exploiting BLAST candidate nodes
generating methods:
Searching outward from BLAST hit
Performing the union of more than one BLAST hit’s annotations
09 / 23 / 2005 [email protected] 51
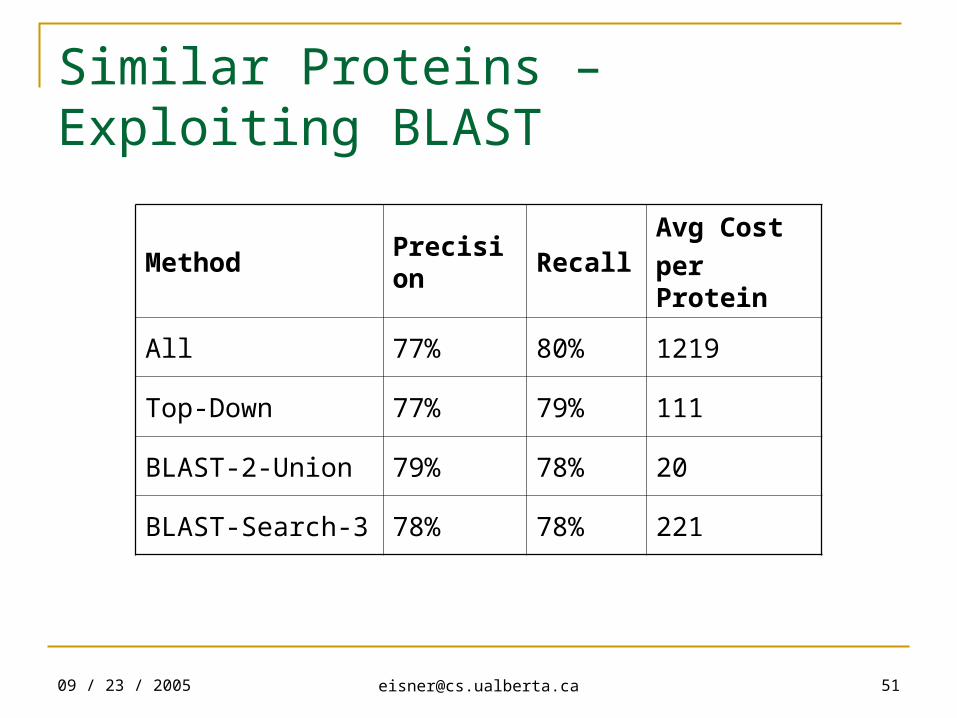
Similar Proteins – Exploiting BLAST
Method Precision RecallAvg Cost
per Protein
All 77% 80% 1219
Top-Down 77% 79% 111
BLAST-2-Union 79% 78% 20
BLAST-Search-3 78% 78% 221
09 / 23 / 2005 [email protected] 52
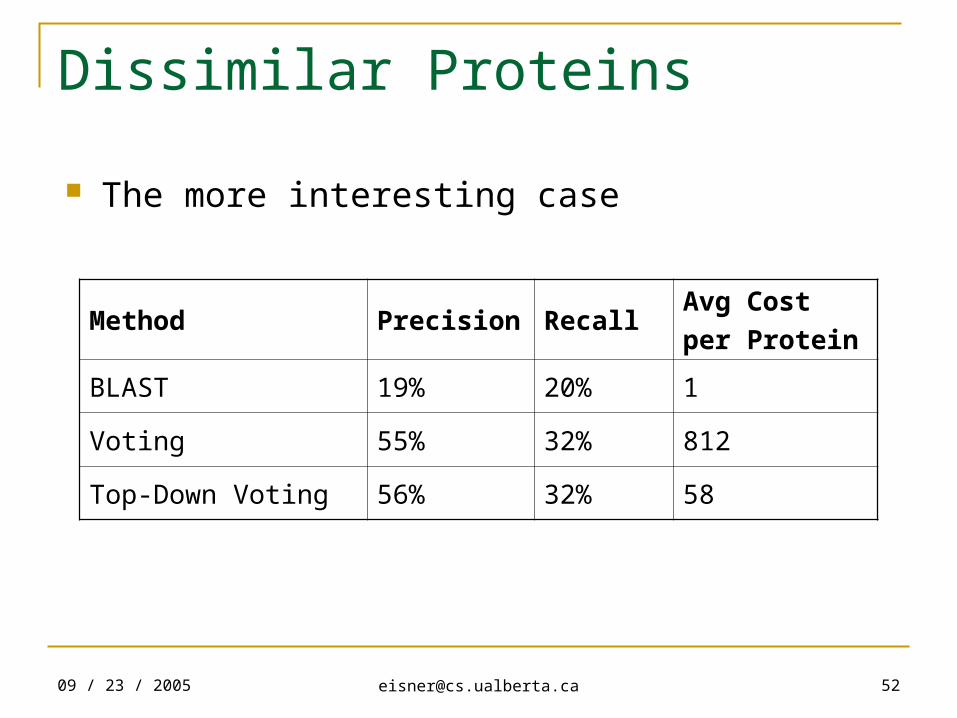
Dissimilar Proteins
Method Precision RecallAvg Cost
per Protein
BLAST 19% 20% 1
Voting 55% 32% 812
Top-Down Voting 56% 32% 58
The more interesting case
09 / 23 / 2005 [email protected] 53
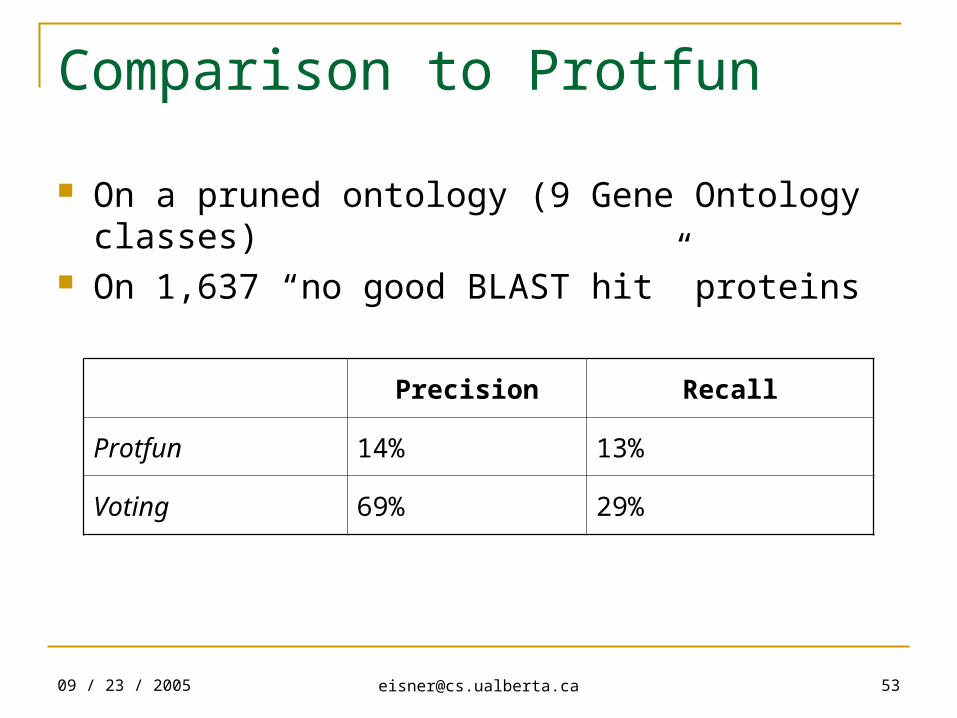
Comparison to Protfun
On a pruned ontology (9 Gene Ontology classes) On 1,637 “no good BLAST hit” proteins
Precision Recall
Protfun 14% 13%
Voting 69% 29%
09 / 23 / 2005 [email protected] 54
Future Work
Try other two ontologies – biological process and cellular component
Use other local predictors More parameter tuning Predictor cost
09 / 23 / 2005 [email protected] 55
Conclusion
Protein Function Prediction provides good leads for Protein Function Determination
Hierarchical ontologies can represent incomplete data allowing the prediction of more functions
Considering the hierarchy: More accurate & Less Computationally Intensive
Methods presented have a higher coverage than BLAST alone
Results accepted to IEEE CIBCB 2005

09 / 23 / 2005 [email protected] 56
Thanks to…
Duane Szafron and Paul Lu
Brett Poulin and Russ Greiner
Everyone in the Proteome Analyst research group
09 / 23 / 2005 [email protected] 57
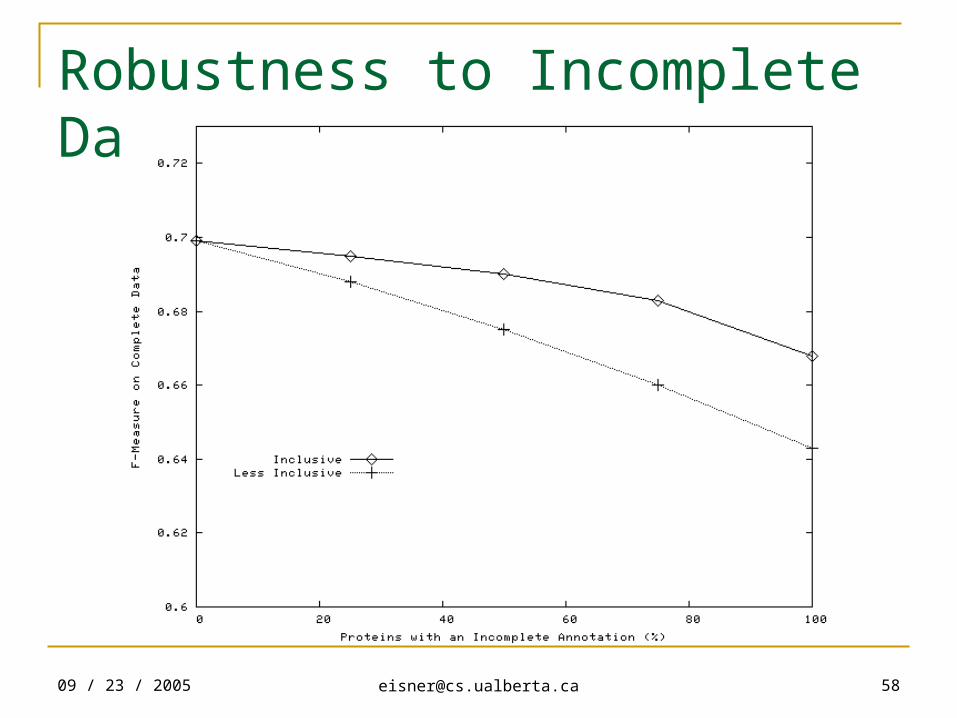
Incomplete Data & Prediction Inclusive avoids using ambiguous
(incomplete) training data Does this help? To test:
Train on more Incomplete Data: Choose X% of proteins, and move one annotation up
Evaluation Predictions on “Complete” data

09 / 23 / 2005 [email protected] 59
Local vs Global Cross-Validation
Some node predictors have as little as 20 positive examples
How to do cross-validation to make sure each predictor has enough positive training examples?
09 / 23 / 2005 [email protected] 60
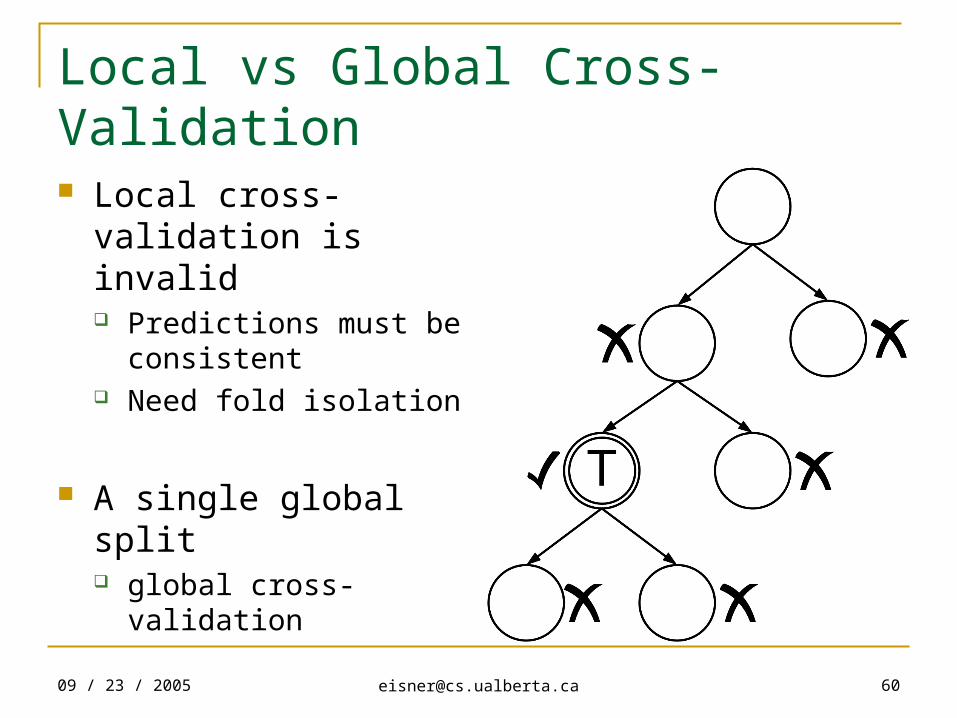
Local vs Global Cross-Validation
Local cross-validation is invalid Predictions must be
consistent Need fold isolation
A single global split global cross-validation