Embed Size (px)
Citation preview

08/02/01 1
Statistical Summary of theMack T10 Precision/BOI
Matrix

08/02/01 2
Summary• This is a preliminary analysis. Data are not available
yet for IR Oxidation or used oil viscometrics. • Delta lead benefits from a natural log transformation.• No other transformations were necessary.• The matrix data have not been evaluated for ACC
precision requirements.• There was a significant positive correlation between
delta lead and upper bearing weight loss and between top ring weight loss and cylinder liner wear.

08/02/01 3
Summary(continued)
• Labs had significant effects for delta lead and upper bearing weight loss.• Stand within Lab was significant for delta lead.• Technology had a significant effect for delta lead and upper bearing weight loss.• Base Oil had a significant effect for cylinder liner wear.• Observations with large Studentized residuals were seen for delta lead.• Oil means and standard deviations are given for potential use in LTMS.

08/02/01 4
Data Set• Table 1 shows the design for the matrix.• All operationally valid data with the exception of CMIR 38815 are included.• The T10 Task Force decided to eliminate CMIR 38815 from the analysis.
– This was an early test in Lab B on Oil A which had high silicon and aluminum in the used oil. It also had high ring weight loss with low cylinder liner wear. The lab ran Oil A again with non-anomalous results. The matrix remains intact as planned.

08/02/01 5
Table 1. Mack T10 Precision Matrix Plan
TechnologyBase Oil X Y ZBase Oil 1 PC-9A PC-9D PC-9GBase Oil 2 PC-9B PC-9E PC-9HBase Oil 3 PC-9C PC-9F PC-9J
Lab/ StandLab A Lab D Lab G Lab F Lab B
1 2 3 4 5 6 7A A A A A A AG A G D A A DE E B H E H BC J F C J F J
08/02/01 6
Table 2. Mack T10 Precision Matrix Datafrom TMC 07/16/01
Test CMIR Lab Stand EOT Date Oil Tech Base Oil DPBFNL ABWLU ATRWLFNL CLWFNL OILCON
1 38814 F 1 20001211 A X 1 33 257 139 36 792 38809 A 1 20001219 A X 1 23 206 158 33 523 38811 D 1 20001224 A X 1 12 195 139 38 524 38945 D 1 20010215 F Y 3 21 222 69 27 565 38953 F 1 20010217 H Z 2 73 364 150 33 616 38939 A 1 20010305 C X 3 33 243 116 25 637 38810 A 2 20010313 A X 1 19 159 168 38 468 38947 G 1 20010318 H Z 2 115 378 156 34 649 38937 A 1 20010329 E Y 2 18 151 118 21 5310 38951 G 2 20010330 A X 1 37 218 125 33 5311 38943 D 1 20010401 B X 2 17 182 125 31 4412 38957 B 1 20010403 D Y 1 25 183 204 46 5413 38942 A 2 20010408 A X 1 16 182 87 27 4114 38948 G 2 20010419 J Z 3 90 343 119 35 4715 38952 F 1 20010419 F Y 3 62 321 106 26 5116 38949 G 1 20010420 C X 3 77 336 133 35 6617 38941 A 1 20010422 G Z 1 71 324 107 29 5218 38938 A 2 20010504 J Z 3 44 278 153 31 5819 38944 D 1 20010504 G Z 1 27 238 154 39 4720 38956 B 1 20010509 J Z 3 50 314 127 30 3521 38950 G 2 20010512 E Y 2 52 317 109 28 5522 38946 G 1 20010517 D Y 1 206 344 108 33 7123 38940 A 2 20010528 E Y 2 22 184 67 20 4524 40919 B 1 20010529 B X 2 34 234 121 24 5425 40230 G 2 20010602 A X 1 25 197 108 34 4826 41135 F 1 20010611 A X 1 28 248 128 26 6027 41410 B 1 20010618 A X 1 34 229 140 35 4228 41412 G 1 20010703 A X 1 66 295 123 39 64

08/02/01 7
Transformations
• Box-Cox procedure was applied using all matrix data.
• Delta lead benefits from a natural logarithm transformation.
• No data transformations are indicated for other responses analyzed.

08/02/01 8
Ln(Delta Lead)Summary of Model Fit
• Model factors include Laboratory (A,B,D,F,G), Stand within Laboratory (A1,A2,G1,G2), Technology (X,Y,Z), Base Oil (1,2,3) and Technology by Base Oil interaction.
• Technology, Lab, and Stand within Lab were significant.– Root MSE from the model was 0.29 (13 df).– The R2 for the model was 0.91.– Figure 1 illustrates the least squares means by oil.– Figure 2 summarizes least squares means for technologies and labs.– Stand within Lab significance was driven by the two stands in Lab G
which were almost significantly different from each other. Both stands were higher (in many cases significantly) than all other stands.
– Log transformation was appropriate.
– The two observations with Oil D had large Studentized residuals.

08/02/01 9
Figure 1Least Squares Means for Oils
0
10
20
30
40
50
60
70
80
X Y Z
Technology
Del
ta L
ead
(p
pm
)
Base Oil 1
Base Oil 2
Base Oil 3
Technology was significant.

08/02/01 10
Figure 2Technology and Lab Least Squares
Means for Delta Lead (ppm)
vs A vs B vs D vs F vs GA 33 1.00 0.08 0.21 0.00B 36 1.00 0.09 0.45 0.01D 18 0.08 0.09 0.00 0.00F 55 0.21 0.45 0.00 0.26G 85 0.00 0.01 0.00 0.26
p-value for test of equal means (Tukey) LS MeanLab
vs X vs Y vs ZX 30 0.33 0.00Y 38 0.33 0.07Z 56 0.00 0.07
p-value for test of equal means (Tukey) Technology
Least Squares Mean

08/02/01 11
Upper Bearing Weight LossSummary of Model Fit
• Model factors include Laboratory (A,B,D,F,G), Technology (X,Y,Z), Base Oil (1,2,3) and Technology by Base Oil interaction.
• Technology and Lab were significant.– Root MSE from the model was 38.0 (15 df).– The R2 for the model was 0.82.– Figure 3 illustrates the least squares means by oil.– Figure 4 shows the least squares means for technologies and labs.
– No observations had large Studentized residuals.

08/02/01 12
Figure 3Least Squares Means for Oils
0
50
100
150
200
250
300
350
X Y Z
Technology
Up
per
Bea
rin
g W
eig
ht
Lo
ss (
mg
)
Base Oil 1
Base Oil 2
Base Oil 3
The Technology effect was significant.

08/02/01 13
Figure 4 Technology and Lab Least Squares Means Upper Bearing Weight Loss
(mg)
vs X vs Y vs ZX 242.8 0.98 0.01Y 246.7 0.98 0.01Z 318.2 0.01 0.01
TechnologyLeast Squares
Meanp-value for test of equal means (Tukey)
vs A vs B vs D vs F vs GA 237.3 0.93 0.94 0.10 0.01B 259.4 0.93 0.63 0.51 0.17D 215.7 0.94 0.63 0.04 0.02F 311.5 0.10 0.51 0.04 0.99G 322.3 0.01 0.17 0.02 0.99
Labp-value for test of equal means (Tukey)
LS Mean

08/02/01 14
Top Ring Weight LossSummary of Model Fit
• Model factors include Laboratory (A,B,D,F,G), Technology (X,Y,Z), Base Oil (1,2,3) and Technology by Base Oil interaction.
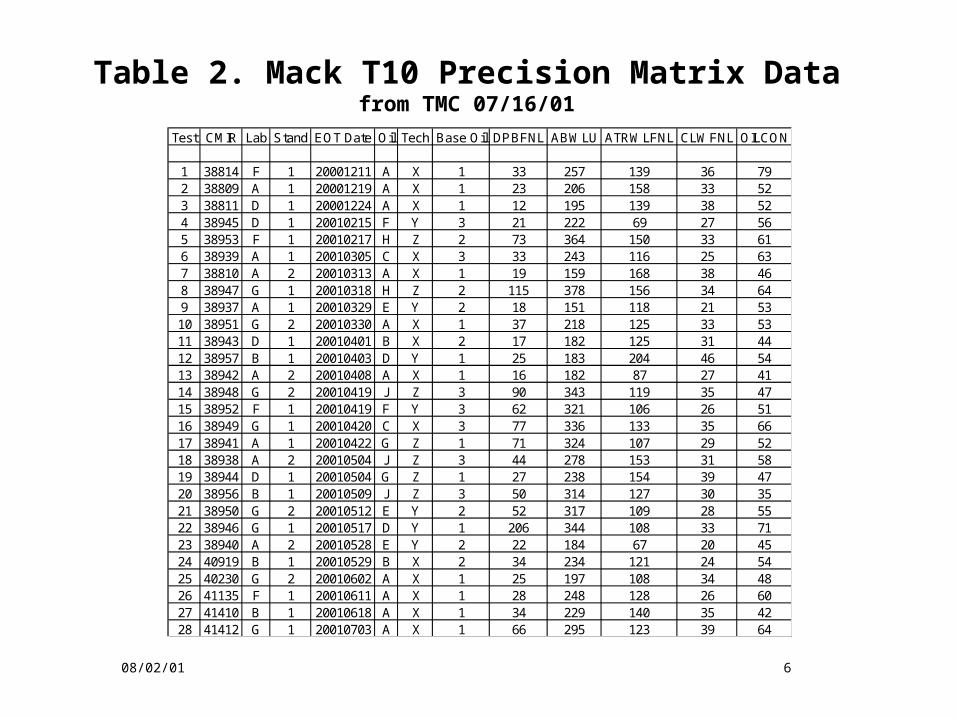
• No effects were significant.– Root MSE from the model was 28 (15 df).– The R2 for the model was 0.49.– Figure 5 illustrates the least squares means by oil.– Figure 6 illustrates the least squares means for laboratories.
– No observations had large Studentized residuals.
08/02/01 15
Figure 5Least Squares Means for Oils
0
20
40
60
80
100
120
140
160
180
X Y Z
Technology
To
p R
ing
Wei
gh
t L
oss
(m
g)
Base Oil 1
Base Oil 2
Base Oil 3
No oil effects were significant.

08/02/01 16
Figure 6Lab Least Squares Means
Top Ring Weight Loss (mg)
vs A vs B vs D vs F vs GA 123 0.89 0.98 0.99 0.97B 141 0.89 1.00 0.99 0.62D 135 0.98 1.00 1.00 0.86F 131 0.99 0.99 1.00 0.89G 114 0.97 0.62 0.86 0.89
LS MeanLabp-value for test of equal means (Tukey)

08/02/01 17
Cylinder Liner WearSummary of Model Fit
• Model factors include Laboratory (A,B,D,F,G), Technology (X,Y,Z), Base Oil (1,2,3) and Technology by Base Oil interaction.
• The Base Oil effect was significant.– Root MSE from the model was 4.4 (15 df).– The R2 for the model was 0.69.– Figure 7 illustrates the least squares means by oil.– Figure 8 shows least squares means for base oils and labs.
– There were no large Studentized residuals.

08/02/01 18
Figure 7Least Squares Means for Oils
0.0
5.0
10.0
15.0
20.0
25.0
30.0
35.0
40.0
45.0
X Y Z
Technology
Cyl
ind
er L
iner
Wea
r (m
icro
ns)
Base Oil 1
Base Oil 2
Base Oil 3
The Base Oil effect was significant.

08/02/01 19
Figure 8 Base Oil and Lab Least Squares
Means Cylinder Liner Wear (microns)
vs 1 vs 2 vs 31 35.8 0.01 0.062 28.2 0.01 0.743 30.0 0.06 0.74
Base OilLeast Squares
Meanp-value for test of equal means (Tukey)
vs A vs B vs D vs F vs GA 27.8 0.69 0.18 0.99 0.45B 32.0 0.69 0.87 0.96 1.00D 35.5 0.18 0.87 0.45 0.82F 29.4 0.99 0.96 0.45 0.92G 31.9 0.45 1.00 0.82 0.92
LS MeanLabp-value for test of equal means (Tukey)

08/02/01 20
Oil ConsumptionSummary of Model Fit
• Model factors include Laboratory (A,B,D,F,G), Technology (X,Y,Z), Base Oil (1,2,3) and Technology by Base Oil interaction.
• No effects were significant.– Root MSE from the model was 8.6 (15 df).– The R2 for the model was 0.56.– Figure 9 illustrates the least squares means by oil.– Figure 10 show least squares means for labs.
– There were no large Studentized residuals.

08/02/01 21
Figure 9Least Squares Means for Oils
0.0
10.0
20.0
30.0
40.0
50.0
60.0
70.0
X Y Z
Technology
Oil
Co
nsu
mp
tio
n (
g/h
)
Base Oil 1
Base Oil 2
Base Oil 3
There were no significant oil effects.

08/02/01 22
Figure 10Lab Least Squares Means
Oil Consumption (g/h)
vs A vs B vs D vs F vs GA 53.1 0.74 1.00 0.36 0.81B 45.4 0.74 0.86 0.11 0.26D 52.4 1.00 0.86 0.39 0.90F 65.1 0.36 0.11 0.39 0.77G 58.1 0.81 0.26 0.90 0.77
Lab LS Meanp-value for test of equal means (Tukey)
08/02/01 23
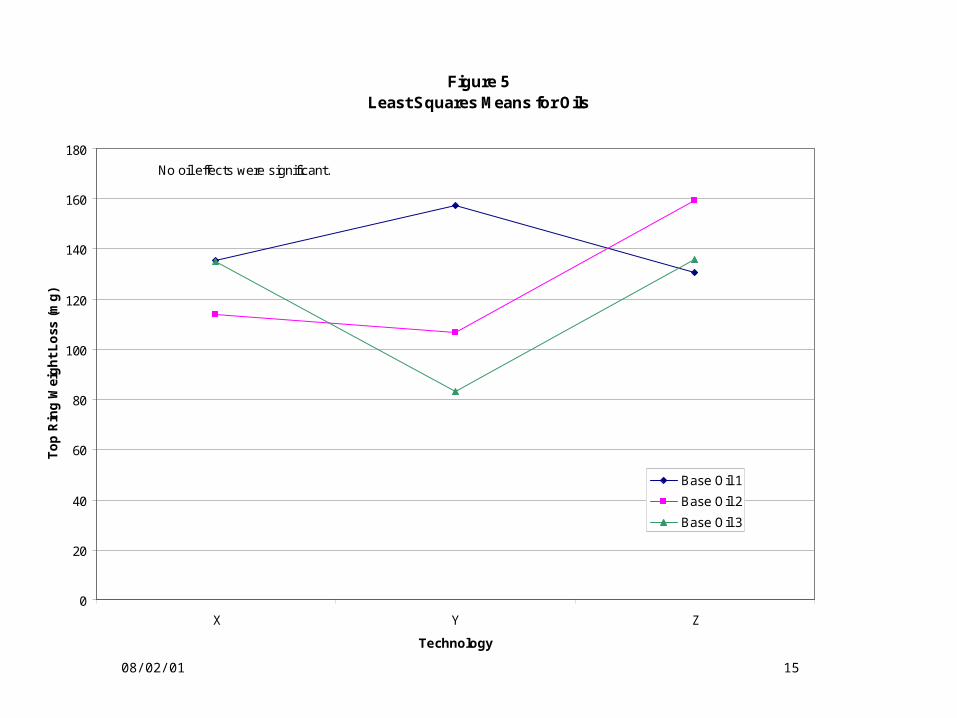
Correlations Among the Criteria
ln(Delta Pb)
Upper Bearing Weight Loss
Top Ring Weight Loss
Cylinder Liner Wear
Oil Consumption
ln(Delta Pb) 1.00 0.92 0.01 0.10 0.44Upper
Bearing Weight Loss 0.92 1.00 0.00 0.07 0.40
Top Ring Weight Loss 0.01 0.00 1.00 0.72 0.12Cylinder Liner
Wear 0.10 0.07 0.72 1.00 0.14Oil
Consumption 0.44 0.40 0.12 0.14 1.00
Raw Data
ln(Delta Pb)
Upper Bearing Weight Loss
Top Ring Weight Loss
Cylinder Liner Wear
Oil Consumption
ln(Delta Pb) 1.00 0.80 0.11 0.20 -0.22Upper
Bearing Weight Loss 0.80 1.00 0.24 0.22 -0.14
Top Ring Weight Loss 0.11 0.24 1.00 0.87 0.56Cylinder Liner
Wear 0.20 0.22 0.87 1.00 0.47Oil
Consumption -0.22 -0.14 0.56 0.47 1.00
Oil LS Means
ln(Delta Pb)
Upper Bearing Weight Loss
Top Ring Weight Loss
Cylinder Liner Wear
Oil Consumption
ln(Delta Pb) 1.00 0.68 -0.32 -0.22 0.10Upper
Bearing Weight Loss 0.68 1.00 -0.25 -0.17 0.31
Top Ring Weight Loss -0.32 -0.25 1.00 0.77 0.13Cylinder Liner
Wear -0.22 -0.17 0.77 1.00 0.08Oil
Consumption 0.10 0.31 0.13 0.08 1.00
Residuals

08/02/01 24
Oil Least Squares Means and Standard Deviations
Oil lnDeltaPb UBWL TRWL CLW OilConA 3.1683 210.2 135 34.9 52.5B 3.6333 239.6 114 24.8 54.8C 3.3968 278.7 135 31.7 63.6D 3.7706 242.0 157 38.7 65.4E 3.2942 220.7 107 25.4 51.3F 3.8216 277.3 83 25.5 49.6G 4.2122 323.8 130 33.9 51.6H 3.7972 323.2 159 34.3 55.7J 4.0624 307.5 136 32.8 49.0
Std Dev 0.2946 38.0 28 4.4 8.6