Embed Size (px)
Citation preview
1
Paper 080-2013
The SQL Tuning Checklist: Making Slow Database Queries a Thing of the Past
Jeff Bailey and Tatyana Petrova, SAS Institute, Inc., Cary, NC
ABSTRACT
The SQL query had been running for 36 hours before it was killed. The project team is panicking. The customer is upset. What can you, a SAS
® programmer, do to get out of this dilemma? Something has to be done, but what?
Chances are you have been there. You have felt the pain. You have lived through the helplessness and fear of imminent failure. Fortunately, it is possible to get out of this mess. This paper will show you the steps (and the mindset) required to solve this all-too-common problem. This paper includes examples from DB2, Greenplum, Oracle, and Teradata.
INTRODUCTION
We have all been there: our SQL statements are taking forever to run. Or worse, they run for so long (sometimes days) that we must kill them. It is very frustrating. You feel helpless. You do not know what to do. You have no idea how to begin. You begin the self-doubt death spiral. Your head fills with questions. What is the first step? Who can help me? How can I get them to help me? Is this a lost cause? Then the finger-pointing starts, and the blame game begins.
No single paper can turn you into an SQL tuning wizard. A book cannot do that either. It takes practice and experience. That is the bad news. The good news is that you do not have to be a wizard in order to be effective. It is entirely possible that you can read this paper, and in minutes, fix SQL performance problems that have plagued you for weeks. Wait, it gets better. The ideas in this paper will help you avoid these situations in the future. This is nice because the only thing better than solving a difficult problem is avoiding it in the first place.
Fortunately, you do not need to have a lot of SQL experience. Solving these problems is not that difficult if you have a plan and know a few secrets. That is what this paper is about – a plan and a few secrets.
The paper will:
describe a protocol that you can use to solve SQL performance issues
detail specific techniques that you can use to discover the causes of SQL performance issues and correct them
introduce the cast of characters who might be able to help you and describe how to convince them to help you
discuss preventing SQL performance issues from occurring in the first place
Along the way, you will see SQL commands that can help you become self-sufficient. We will be discussing DB2, Greenplum, Oracle, and Teradata. Do not worry if your database does not appear here. The steps are very similar, and you will be able to apply what you learn to your environment. When it comes to SQL performance, mindset is very important. We will help you develop the mindset that you will need to conquer the SQL beast!
THE SQL TUNING CHECKLIST
KEEP A RECORD
SQL performance issues tend to repeat themselves. You can rest assured that if you have a performance issue today you will face something similar next year or perhaps next week. It is important to keep a record of the issues that you faced and how you solved them. How you do this is up to you. Make sure that you can search your documentation easily. Keep in mind that others might benefit from reading about how you conquered each issue.
Take away: Create an SQL Tuning Journal and use it to record SQL performance problems and solutions.
IS THERE A PROBLEM?
There is obviously a problem, right? The query takes forever to run. If you are like most of us, you want to immediately start thinking about solutions. Before we do that, let us take a step back and ask a simple question.
Data ManagementSAS Global Forum 2013
2
Is there a problem?
In all likelihood, the answer will be a resounding “Yes!,” but humor us for a minute. Can you explain to someone how you know there is a problem? If you have a query that runs for days and never comes back, it is most likely a problem. But, there are times when a properly working query takes a long time to run. For now, it is best to assume that queries that take days to run are a problem. You can use this checklist to determine if a long-running query is a problem.
There is another question lurking here, and this question is easy to miss.
What is the business question that you are trying to answer?
The query could be answering the wrong question. Unfortunately, we usually discover this after tuning the query. Seriously, we wasted a lot of time by not looking into the business reason for the problem queries. Do not spend a lot of time on writing this business reason. Be brief and stick to facts. Document the business reason in your SQL Tuning Journal.
At this point, we know that there is a problem, and we have an idea of the intent of the query. We have documented this intent in our SQL Tuning Journal. Now, we need to dig a little deeper, so that we can discover the nature of the problem. We can do that by asking another question.
Is this a new query?
If the answer is “Yes,” estimate how long you think the query should run. It is also a good idea to make a note of how long is too long. It is important to remember that these are estimates. Do not get hung up on them.
If the answer is “No,” then this is an existing query, and something has gone wrong. This is a pretty good situation to be in because it means that something has changed. In this case, you need to ask a different set of questions.
Has the query run faster in the past?
If the query has run faster, determine whether the query slowed down gradually or rapidly. Note the answer to this question in your journal. This is important and will help you diagnose the root cause of the problem.
Add this information to your SQL Tuning Journal and move on to the next step.
Take away: Determine the business reason for the query. You might find that the wrong question is being asked.
FIND THE SQL
This is perhaps the most important item on the SQL Tuning Checklist. If you do not have the SQL statement that is being sent to the database management system (DBMS), there is very little you can do to tune it.
SAS communicates with relational databases using SQL. It does not matter if you are using DATA steps, the SQL procedure, or SAS Information Maps. If you are dealing with a database, your SAS jobs are using SQL to do the work. Fortunately, it is very easy for SAS to show you the SQL.
Run this SAS statement to show you the SQL that is being sent to the database:
OPTIONS SASTRACE=',,,d' SASTRACELOC=saslog NOSTSUFFIX;
How you run this statement depends on your SAS application.
SAS Foundation – Issue the command from your display manager session.
SAS Enterprise Guide - Add this statement to a code node.
SAS Workspace Server – Include this statement in the autoexec.sas file. You can view the SQL statement in the SAS log on the SAS Workspace Server.
SAS Stored Process Server - Include this statement in the autoexec.sas file. You can view the SQL statement in the SAS log on the SAS Stored Process Server.
SAS® Information Map Studio (SAS
® Web Report Studio, and so on) – This one depends on your SAS
application. For example, to view the SQL in SAS Information Map Studio:
1. Open SAS Information Map Studio.
2. Select ToolsRun a Test Query.
Data ManagementSAS Global Forum 2013

3
3. In the Test the Information Map dialog box, click View SQL. The SQL query will appear in the View Query dialog box.
4. Add the SQL statement to your SQL Tuning Journal.
The SASTRACE= option will write a lot of information to your SAS log. The key to using this option properly is knowing where to find the important information amid all the “other” stuff. Let us look at an example using Greenplum. You have a question, “Is the SAS DATEPART() function in my query being passed to Greenplum?” It is a pretty simple question, but people ask this sort of thing all the time. Let us see how we can find the answer to this question.
First, we create some code and submit it.
PROC SQL;
CONNECT TO GREENPLM (SERVER=gpserv USER=myuser PW=mypasswd
DATABASE=db1 SCHEMA=myuser);
EXECUTE (create table datetest(i integer, myTS timestamp)
distributed by (i)) BY GREENPLM;
QUIT;
PROC SQL;
CONNECT TO GREENPLM (SERVER=gpserv USER=myuser PW=mypasswd
DATABASE=db1 SCHEMA=myuser);
EXECUTE (insert into datetest values (1, '1961-10-01 01:01:01.01')) BY GREENPLM;
EXECUTE (insert into datetest values (2, '1961-10-02 02:02:02.02')) BY GREENPLM;
EXECUTE (insert into datetest values (3, '1961-10-03 03:03:03.03')) BY GREENPLM;
EXECUTE (insert into datetest values (4, '1961-10-04 04:04:04.04')) BY GREENPLM;
EXECUTE (insert into datetest values (5, '1961-10-05 05:05:05.05')) BY GREENPLM;
EXECUTE (insert into datetest values (6, '1961-10-06 06:06:06.06')) BY GREENPLM;
EXECUTE (insert into datetest values (7, '1961-10-07 07:07:07.07')) BY GREENPLM;
EXECUTE (insert into datetest values (8, '1961-10-08 08:08:08.08')) BY GREENPLM;
EXECUTE (insert into datetest values (9, '1961-10-09 09:09:09.09')) BY GREENPLM;
EXECUTE (insert into datetest values (10,'1961-10-10 10:10:10.10')) BY GREENPLM;
QUIT;
LIBNAME mygplum GREENPLM SERVER=gpserv USER=myuser PW=mypasswd
DATABASE=db1 SCHEMA=myuser;
OPTIONS SASTRACE=',,,d' SASTRACELOC=saslog NOSTSUFFIX;
PROC SQL;
SELECT I, DATEPART(myTS) "The Date"
FROM mygplum.datetest
WHERE DATEPART(myTS) = '06OCT61'd;
QUIT;
We are interested in the final PROC SQL code. The question is, “Is the DATEPART() function being passed to Greenplum?” If the function is not passed, then every row in the database is returned to SAS and post-processed. Post-processing is less than optimal. You want to pay attention to WHERE clauses. It is particularly troublesome to have WHERE clauses in post-processing.
3 options sastrace=',,,d' sastraceloc=saslog nostsuffix;
4 proc sql;
5 select distinct i, datepart(myTS) "TheDate"
6 from mygplum.datetest
7 where datepart(myTS) = '06OCT61'd;
GREENPL: AUTOCOMMIT turned ON for connection id 0
GREENPL_1: Prepared: on connection 0
SELECT * FROM myuser.DATETEST FOR READ ONLY
SAS_SQL: Unable to convert the query to a DBMS specific SQL statement due to an
error.
Data ManagementSAS Global Forum 2013
4
ACCESS ENGINE: SQL statement was not passed to the DBMS, SAS will do the
processing.
NOTE: Writing HTML Body file: sashtml.htm
GREENPL_2: Prepared: on connection 0
SELECT "i", "myts" FROM myuser.DATETEST FOR READ ONLY
GREENPL_3: Executed: on connection 0
Prepared statement GREENPL_2
8 quit;
NOTE: PROCEDURE SQL used (Total process time):
real time 1.73 seconds
cpu time 0.67 seconds
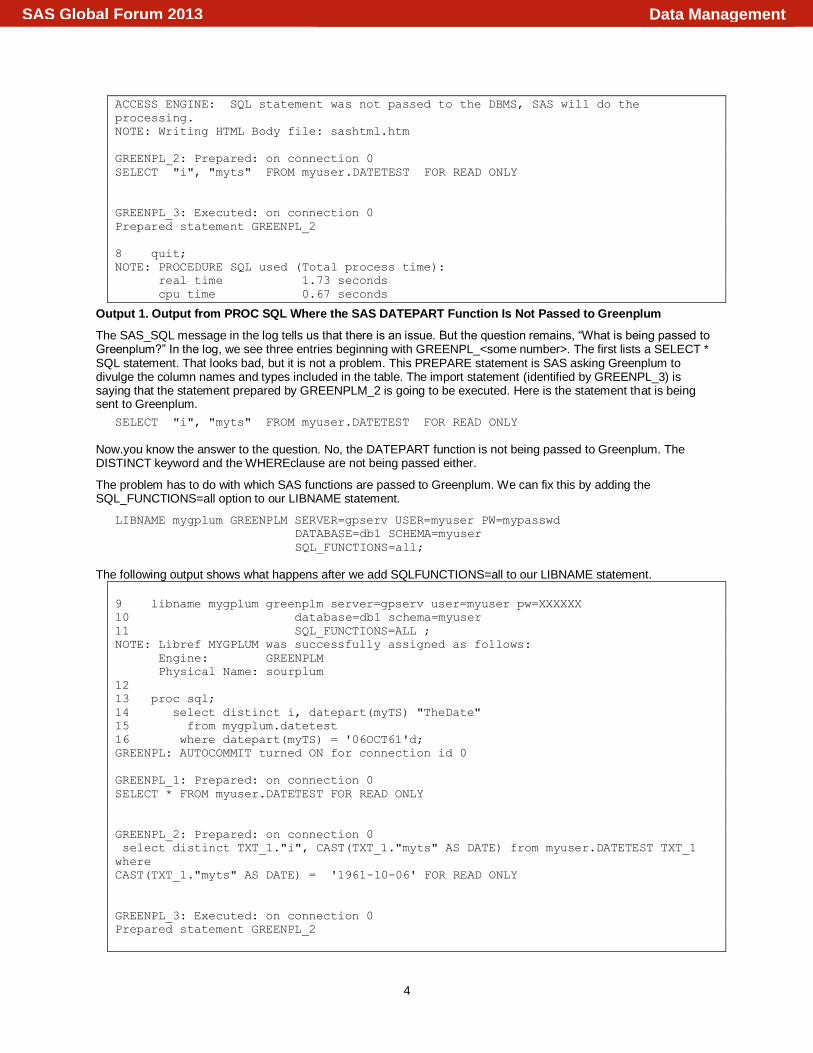
Output 1. Output from PROC SQL Where the SAS DATEPART Function Is Not Passed to Greenplum
The SAS_SQL message in the log tells us that there is an issue. But the question remains, “What is being passed to Greenplum?” In the log, we see three entries beginning with GREENPL_<some number>. The first lists a SELECT * SQL statement. That looks bad, but it is not a problem. This PREPARE statement is SAS asking Greenplum to divulge the column names and types included in the table. The import statement (identified by GREENPL_3) is saying that the statement prepared by GREENPLM_2 is going to be executed. Here is the statement that is being sent to Greenplum.
SELECT "i", "myts" FROM myuser.DATETEST FOR READ ONLY
Now.you know the answer to the question. No, the DATEPART function is not being passed to Greenplum. The DISTINCT keyword and the WHEREclause are not being passed either.
The problem has to do with which SAS functions are passed to Greenplum. We can fix this by adding the SQL_FUNCTIONS=all option to our LIBNAME statement.
LIBNAME mygplum GREENPLM SERVER=gpserv USER=myuser PW=mypasswd
DATABASE=db1 SCHEMA=myuser
SQL_FUNCTIONS=all;
The following output shows what happens after we add SQLFUNCTIONS=all to our LIBNAME statement.
9 libname mygplum greenplm server=gpserv user=myuser pw=XXXXXX
10 database=db1 schema=myuser
11 SQL_FUNCTIONS=ALL ;
NOTE: Libref MYGPLUM was successfully assigned as follows:
Engine: GREENPLM
Physical Name: sourplum
12
13 proc sql;
14 select distinct i, datepart(myTS) "TheDate"
15 from mygplum.datetest
16 where datepart(myTS) = '06OCT61'd;
GREENPL: AUTOCOMMIT turned ON for connection id 0
GREENPL_1: Prepared: on connection 0
SELECT * FROM myuser.DATETEST FOR READ ONLY
GREENPL_2: Prepared: on connection 0
select distinct TXT_1."i", CAST(TXT_1."myts" AS DATE) from myuser.DATETEST TXT_1
where
CAST(TXT_1."myts" AS DATE) = '1961-10-06' FOR READ ONLY
GREENPL_3: Executed: on connection 0
Prepared statement GREENPL_2
Data ManagementSAS Global Forum 2013

5
ACCESS ENGINE: SQL statement was passed to the DBMS for fetching data.
17 quit;
NOTE: PROCEDURE SQL used (Total process time):
real time 0.55 seconds
cpu time 0.04 seconds
Output 2. Output from PROC SQL When the DATEPART Function Is Passed to Greenplum
Again, SAS tells us that the statement prepared in GREENPLM_2 is going to be executed. Here is the new statement that is being sent to Greenplum.
select distinct TXT_1."i", CAST(TXT_1."myts" AS DATE) from myuser.DATETEST TXT_1
where CAST(TXT_1."myts" AS DATE) = '1961-10-06' FOR READ ONLY
Now we see that the WHERE clause, the DISTINCT keyword, and the DATEPART function are being passed to Greenplum. Greenplum is now returning a single row instead of the entire table. We always strive to have the DBMS do as much work as possible.
The most convenient way to discover the SQL statement being passed is to use the SAS OPTION statement. However, it is not the only way.
You can use DBMS features to display the SQL that is generated. For example, if you are using SAS with Teradata, your database administrator (DBA) can use database query logging (DBQL). After query logging is enabled, your DBA can use the DBC.DBQLogTbl table to find your query. This data dictionary table stores the text of the SQL queries. If query logging is not enabled, your DBA will not be able to find the query. Fortunately, Teradata DBAs usually enable query logging.
Finding user SQL text is easy in Teradata. With the other databases, it is a little more difficult. Let us briefly look at what is involved.
DB2 users will need to look into the DB2 package cache. DB2 keeps the most frequently executed SQL statements in memory. If your DB2 system is heavily used, the SQL statement you are looking for might not be available. Describing how to do this would take a while, so in the References section of this paper, we have included a link to an IBM DeveloperWorks article that explains how this is done.
Greenplum DBAs can look at the pg_stat_activity view. Your DBA must search for the right SQL.
In Oracle, finding the SQL statement is somewhat complicated. It requires joining the sys.v_$sql and sys.v_$sqltext views. To find example code, search the Internet using “find SQL text oracle” as the search term.
The take away here is, yes, your DBA might be able to find your specific SQL statement in the morass of SQL that has been running on the database. Do not make them do it. Help them out. Use the SAS OPTIONS statement (as previously described). Not only will this statement save your DBA time, your use of this statement shows the DBA that you are making an effort to solve the problem.
Finding the SQL might solve your problem without worrying about the next step, “What is the DBMS doing?” If the previous example were an actual problem, we would be well on our way to solving it. It would be obvious that the problem is that SAS is not passing the DISTINCT keyword or the date functions to Greenplum. We would not need to worry about what the DBMS is doing and could jump to the “Come up with a Plan” step.
However, let us assume that nothing in the SQL statement stands out, and we need to dig further.
Before proceeding, add the SQL statement to your SQL Tuning Journal and get ready for fun.
Take away: Use the SASTRACE= and SASTRACELOC= options to find the SQL that SAS is sending to the database.
WHAT IS THE DBMS DOING?
Now, we know the secret of uncovering the SQL that SAS is passing to the DBMS. Just knowing the query can take us a long way, but at some point, we must delve into how the DBMS plans to execute the query.
The optimizer determines the best way to answer the question posed by the SQL -- if only the optimizer would tell us exactly how it plans to get that answer. Many DBAs call this an “explain plan.” Fortunately, there is an SQL statement that will make the query optimizer spill its secrets. It is called the EXPLAIN statement. There is no need to fear it. On the other hand, there is a need to use it often.
Learning to decipher the output from the EXPLAIN statement can be daunting. Fortunately, you do not need to be an expert to use it to solve your problem. The output is useful even if you cannot understand it. Simply sending the
Data ManagementSAS Global Forum 2013
6
output to your DBA (or a more experienced co-worker) might help you. In reality, running the EXPLAIN statement shows that you have made an effort. DBAs love it when people make an effort.
Let us look at a Teradata example.
Bob walks up to the DBA and says, “Our Teradata server is really slow. My query never returns.” (For future reference, it is never a good idea to tell a DBA that their database is slow. It might come back to haunt you.) He has the query printed on a sheet of paper. He hands the paper to the DBA. Here is the SQL code.
SELECT a.store_id, a. transaction_id, b.date_id, b.employee_rk
FROM eecdata.order_fact a
, eecdata.order_fact b
WHERE a.store_id = 1182041
AND b.date_id = '2004-01-25';
(You might immediately see the problem. If so, please play along.) The DBA shows Bob how to run an EXPLAIN statement. Notice, the only difference between the two sets of code is the EXPLAIN keyword. Here is the new code:
EXPLAIN
SELECT a.store_id, a. transaction_id, b.date_id, b.employee_rk
FROM eecdata.order_fact a
, eecdata.order_fact b
WHERE a.store_id = 1182041
AND b.date_id = '2004-01-25';
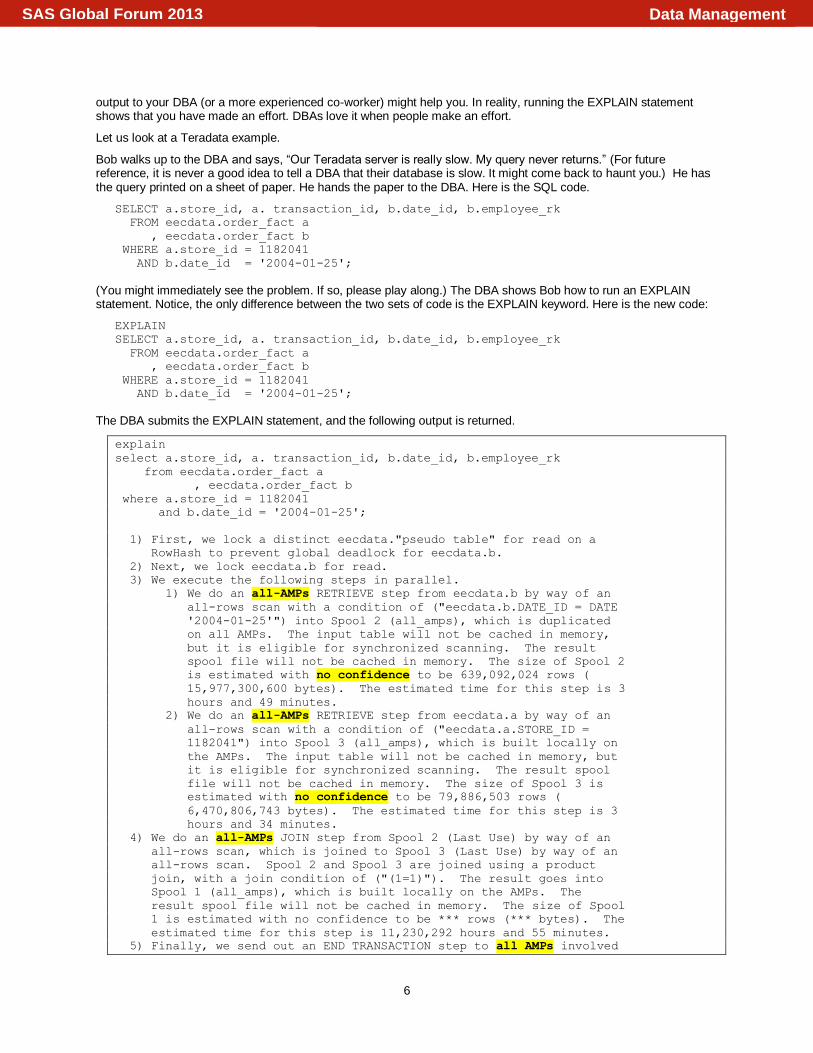
The DBA submits the EXPLAIN statement, and the following output is returned.
explain
select a.store_id, a. transaction_id, b.date_id, b.employee_rk
from eecdata.order_fact a
, eecdata.order_fact b
where a.store_id = 1182041
and b.date_id = '2004-01-25';
1) First, we lock a distinct eecdata."pseudo table" for read on a
RowHash to prevent global deadlock for eecdata.b.
2) Next, we lock eecdata.b for read.
3) We execute the following steps in parallel.
1) We do an all-AMPs RETRIEVE step from eecdata.b by way of an
all-rows scan with a condition of ("eecdata.b.DATE_ID = DATE
'2004-01-25'") into Spool 2 (all_amps), which is duplicated
on all AMPs. The input table will not be cached in memory,
but it is eligible for synchronized scanning. The result
spool file will not be cached in memory. The size of Spool 2
is estimated with no confidence to be 639,092,024 rows (
15,977,300,600 bytes). The estimated time for this step is 3
hours and 49 minutes.
2) We do an all-AMPs RETRIEVE step from eecdata.a by way of an
all-rows scan with a condition of ("eecdata.a.STORE_ID =
1182041") into Spool 3 (all_amps), which is built locally on
the AMPs. The input table will not be cached in memory, but
it is eligible for synchronized scanning. The result spool
file will not be cached in memory. The size of Spool 3 is
estimated with no confidence to be 79,886,503 rows (
6,470,806,743 bytes). The estimated time for this step is 3
hours and 34 minutes.
4) We do an all-AMPs JOIN step from Spool 2 (Last Use) by way of an
all-rows scan, which is joined to Spool 3 (Last Use) by way of an
all-rows scan. Spool 2 and Spool 3 are joined using a product
join, with a join condition of ("(1=1)"). The result goes into
Spool 1 (all_amps), which is built locally on the AMPs. The
result spool file will not be cached in memory. The size of Spool
1 is estimated with no confidence to be *** rows (*** bytes). The
estimated time for this step is 11,230,292 hours and 55 minutes.
5) Finally, we send out an END TRANSACTION step to all AMPs involved
Data ManagementSAS Global Forum 2013
7
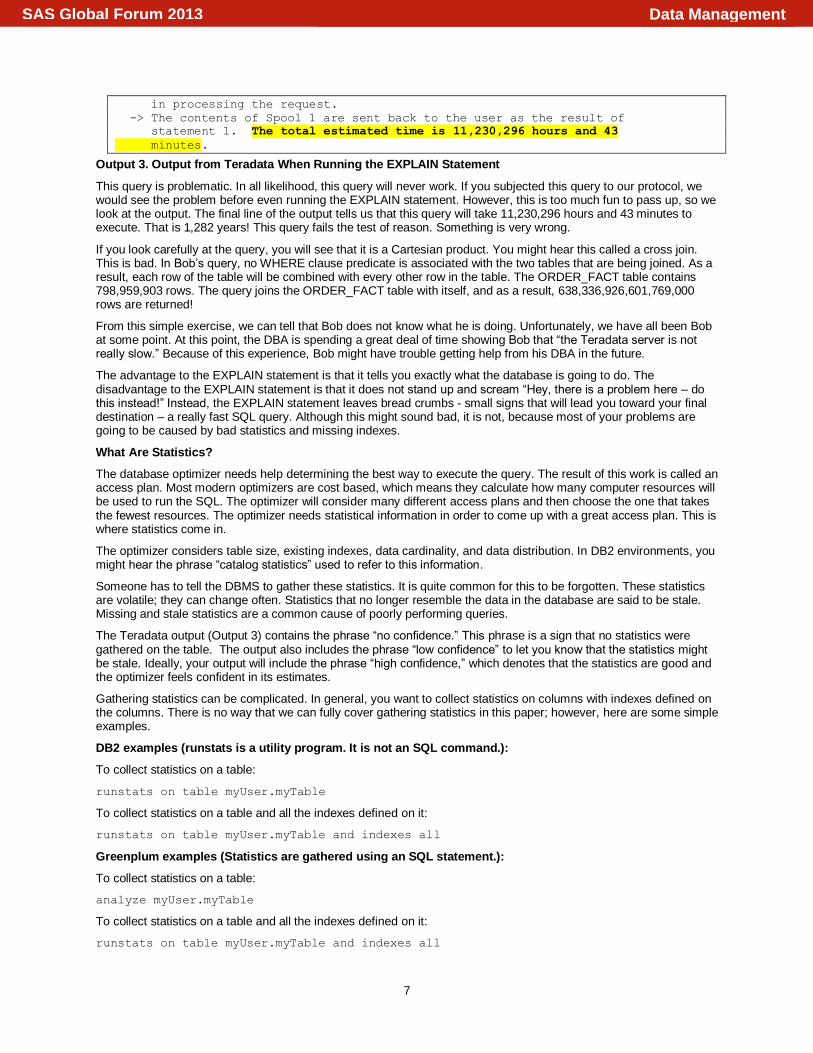
in processing the request.
-> The contents of Spool 1 are sent back to the user as the result of
statement 1. The total estimated time is 11,230,296 hours and 43
minutes.
Output 3. Output from Teradata When Running the EXPLAIN Statement
This query is problematic. In all likelihood, this query will never work. If you subjected this query to our protocol, we would see the problem before even running the EXPLAIN statement. However, this is too much fun to pass up, so we look at the output. The final line of the output tells us that this query will take 11,230,296 hours and 43 minutes to execute. That is 1,282 years! This query fails the test of reason. Something is very wrong.
If you look carefully at the query, you will see that it is a Cartesian product. You might hear this called a cross join. This is bad. In Bob’s query, no WHERE clause predicate is associated with the two tables that are being joined. As a result, each row of the table will be combined with every other row in the table. The ORDER_FACT table contains 798,959,903 rows. The query joins the ORDER_FACT table with itself, and as a result, 638,336,926,601,769,000 rows are returned!
From this simple exercise, we can tell that Bob does not know what he is doing. Unfortunately, we have all been Bob at some point. At this point, the DBA is spending a great deal of time showing Bob that “the Teradata server is not really slow.” Because of this experience, Bob might have trouble getting help from his DBA in the future.
The advantage to the EXPLAIN statement is that it tells you exactly what the database is going to do. The disadvantage to the EXPLAIN statement is that it does not stand up and scream “Hey, there is a problem here – do this instead!” Instead, the EXPLAIN statement leaves bread crumbs - small signs that will lead you toward your final destination – a really fast SQL query. Although this might sound bad, it is not, because most of your problems are going to be caused by bad statistics and missing indexes.
What Are Statistics?
The database optimizer needs help determining the best way to execute the query. The result of this work is called an access plan. Most modern optimizers are cost based, which means they calculate how many computer resources will be used to run the SQL. The optimizer will consider many different access plans and then choose the one that takes the fewest resources. The optimizer needs statistical information in order to come up with a great access plan. This is where statistics come in.
The optimizer considers table size, existing indexes, data cardinality, and data distribution. In DB2 environments, you might hear the phrase “catalog statistics” used to refer to this information.
Someone has to tell the DBMS to gather these statistics. It is quite common for this to be forgotten. These statistics are volatile; they can change often. Statistics that no longer resemble the data in the database are said to be stale. Missing and stale statistics are a common cause of poorly performing queries.
The Teradata output (Output 3) contains the phrase “no confidence.” This phrase is a sign that no statistics were gathered on the table. The output also includes the phrase “low confidence” to let you know that the statistics might be stale. Ideally, your output will include the phrase “high confidence,” which denotes that the statistics are good and the optimizer feels confident in its estimates.
Gathering statistics can be complicated. In general, you want to collect statistics on columns with indexes defined on the columns. There is no way that we can fully cover gathering statistics in this paper; however, here are some simple examples.
DB2 examples (runstats is a utility program. It is not an SQL command.):
To collect statistics on a table:
runstats on table myUser.myTable
To collect statistics on a table and all the indexes defined on it:
runstats on table myUser.myTable and indexes all
Greenplum examples (Statistics are gathered using an SQL statement.):
To collect statistics on a table:
analyze myUser.myTable
To collect statistics on a table and all the indexes defined on it:
runstats on table myUser.myTable and indexes all
Data ManagementSAS Global Forum 2013
8
Oracle examples (Statistics are gathered using the DBMS_STATS package.):
Gathering statistics in Oracle is quite involved. Here are some simple examples. For more information about this topic, see the Oracle documentation.
To collect statistics a table:
EXEC DBMS_STATS.GATHER_TABLE_STATS('myUser'.'myTable');
To collect statistics on a table’s indexes:
EXEC DBMS_STATS.GATHER_INDEX_STATS('myUser'.'myTable_pk');
To drop statistics for a table:
EXEC DBMS_STATS.DELETE_TABLE_STATS('myUser'.'myTable');
Teradata examples:
To collect statistics on a column:
collect stats on myUser.myTable column (myCol);
To collect statistics on an index:
collect stats on myUser.myTable index (myIndex);
To drop statistics on a table:
drop stats on myUser.myTable;
Indexes
Indexes are database objects that allow the optimizer to quickly find a single row (or a small subset of rows). Indexes are also very useful when joining tables together. Previously, we discussed a series of questions that you need to ask about poorly performing queries. The line of questioning goes something like this:
Is this a new query? For new queries, it is not uncommon for performance issues to be caused by missing indexes. In Output 3, you will see the phrase “all-AMPs.” Teradata uses this phrase when it sequentially scans tables. This situation is commonly called a “table scan.” Table scans are not always a problem. If you are running analytic processes, a table scan might be alright. If you want to see the data for a single customer, you do not want to perform table scans.
Let us assume that this is a new query, and we would like to determine how to index it. To make this exercise easier, we will use a contrived query. This query joins tables tab1 and tab2 together using the col1 column. Column col1 exists in both tables and is a primary key.
SELECT t1.col1
, t2.col2
, t2.col3
, t1.col4
, t2.col5
, t2.col6
FROM tab1 as t1
, tab2 as t2
WHERE t1.col1 = t2.col1
AND t2.col2 = 'search criteria'
ORDER BY t1.col4;
This is a simple query. We can look at it and tell a lot about it. What if the query was much more complicated? How would you assess it?
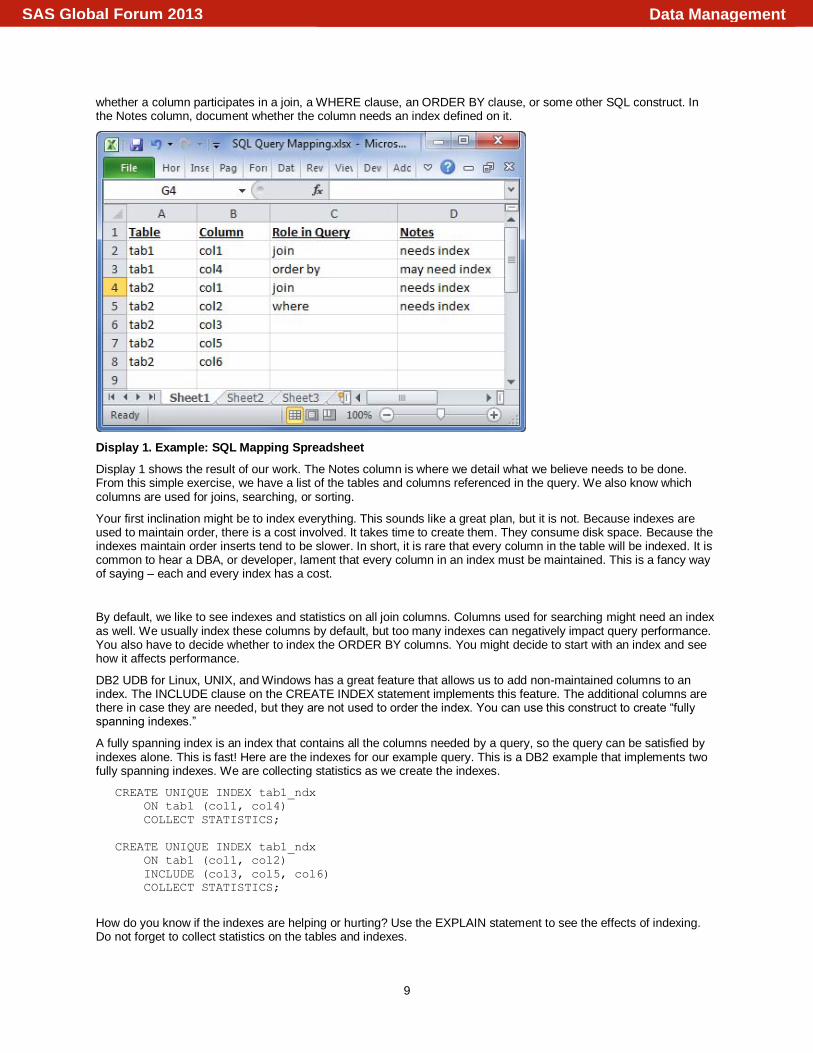
It would be nice if we had a map showing the important parts of the query. Fortunately, we can create this map by using a spreadsheet. Our map will have 4 columns: Table, Column, Role in Query, and Notes. You begin by listing all the tables and columns. After you have created this list, move to the Role in Query column. In this column, note
Data ManagementSAS Global Forum 2013
9
whether a column participates in a join, a WHERE clause, an ORDER BY clause, or some other SQL construct. In the Notes column, document whether the column needs an index defined on it.
Display 1. Example: SQL Mapping Spreadsheet
Display 1 shows the result of our work. The Notes column is where we detail what we believe needs to be done. From this simple exercise, we have a list of the tables and columns referenced in the query. We also know which columns are used for joins, searching, or sorting.
Your first inclination might be to index everything. This sounds like a great plan, but it is not. Because indexes are used to maintain order, there is a cost involved. It takes time to create them. They consume disk space. Because the indexes maintain order inserts tend to be slower. In short, it is rare that every column in the table will be indexed. It is common to hear a DBA, or developer, lament that every column in an index must be maintained. This is a fancy way of saying – each and every index has a cost.
By default, we like to see indexes and statistics on all join columns. Columns used for searching might need an index as well. We usually index these columns by default, but too many indexes can negatively impact query performance. You also have to decide whether to index the ORDER BY columns. You might decide to start with an index and see how it affects performance.
DB2 UDB for Linux, UNIX, and Windows has a great feature that allows us to add non-maintained columns to an index. The INCLUDE clause on the CREATE INDEX statement implements this feature. The additional columns are there in case they are needed, but they are not used to order the index. You can use this construct to create “fully spanning indexes.”
A fully spanning index is an index that contains all the columns needed by a query, so the query can be satisfied by indexes alone. This is fast! Here are the indexes for our example query. This is a DB2 example that implements two fully spanning indexes. We are collecting statistics as we create the indexes.
CREATE UNIQUE INDEX tab1_ndx
ON tab1 (col1, col4)
COLLECT STATISTICS;
CREATE UNIQUE INDEX tab1_ndx
ON tab1 (col1, col2)
INCLUDE (col3, col5, col6)
COLLECT STATISTICS;
How do you know if the indexes are helping or hurting? Use the EXPLAIN statement to see the effects of indexing. Do not forget to collect statistics on the tables and indexes.
Data ManagementSAS Global Forum 2013
10
Take away: Many (perhaps most) SQL performance issues involve statistics and indexing.
DEVELOP A PLAN
At this point, we know that there is a problem. We have used the SASTRACE= option to find the problematic SQL. We have taken the SQL and found the access plan the optimizers will use to execute it. We have determined which columns in the tables have indexes. Finally, we have learned the current state of the statistics.
We will use this information to develop a plan for solving the problem. This plan does not need to be fancy or extremely detailed. In fact, after you have created one plan, you can use it as a template.
Here is a typical plan:
Step 1: Determine who can solve the problem.
Step 2: Deliver the information (SQL query, explain plan, statistics information, and index information) that you learned in the previous steps to the person identified in step 1.
Step 3: Get out of the way and let them solve the problem.
The goal here is to combine the necessary information into an easy-to-use format and pass it along to the person who can help you. More than likely, this person is the DBA for your database environment. If you happen to be creating a data warehouse, this person might be one of the developers working on the project with you. In a development environment, you might be able to solve the problem.
DBAs have a reputation of being difficult to deal with. Some of it is deserved (as DBAs we can say that) but much of it is not. I personally love it when an end user has taken the time to run through the previous steps. In many situations, we can immediately see the problem and fix it. What we do not like is to be told what we have to do to fix the problem. You should not say something like this, “We have a problem query. You need to create an index on column C in table T.” You might be exactly right, but you might be wrong. If your DBA does not like you, he might do EXACTLY what you tell him to do with negative results.
Let your DBA diagnose the problem.
Here is an example from the real world. A developer walks up to me (a DBA) and says “our extract, transform, and load (ETL) job stream is slow. Fix this query.” The query was taking 45 minutes to run. The job stream was taking over 9 hours to run. I asked to see SASTRACE= output for the entire run. We were able to speed up their query. It ran in 22 minutes. After looking at the rest of the jobs, we found that there were repeated SELECT (*) queries. Although each query was taking less than two minutes to run, there were a lot of these queries. We asked the developers what the goal of the query was (See the “Is There a Problem?” section). The developers wanted to know if a table was empty. We changed some of their queries to use SELECT MAX(col1), where col1 had a unique index and current statistics. The job stream ran over 2 hours faster!
If the DBA had simply done what the developers told him to do, the developers would have missed a great opportunity to improve the performance of the system. The point is, let the DBAs determine how to solve the issue.
Add the document (or e-mail message) that you used to request help to your SQL Tuning Journal. You will find it useful in the future.
Take away: Present the problem to the person who will solve it in a clear and concise manner. This person should not have to struggle to understand the issue. Do not tell the person what to do.
SOLVE THE PROBLEM
If you are not solving the problem, this step is easy. You get to work on other things while your DBA goes off and works magic. That magic might include creating indexes, gathering statistics on your tables, rearranging table spaces (this is moving table data from one set of disks to another in order to make processing more efficient), materializing views, or some other technique.
Naturally, this question will come up, “How long will it take the DBA to solve the problem?” The answer depends on how the problem will be solved. Adding an index and gathering statistics should not take a long time. On the other hand, rearranging disk space on the database server might take weeks of planning and a weekend outage. If the solution involves rearranging databases objects (for example, combining tables into materialized views, new tables, and so on), the problem could take days or weeks to fix.
Remember to record the solution to the problem in your SQL Tuning Journal. Having a history of problems along with the solutions will help you avoid problems in the future. The simple act of recording this information seems to make your brain foresee problems, and avoiding problems is much faster than solving them.
Data ManagementSAS Global Forum 2013
11
You probably will not need to document a great deal of detail. Simply saying “statistics were out-of-date” could suffice. As you add the solution to your journal, ask yourself, “Is this a re-occurring issue?” If it is, you might want to discuss an overall strategy for avoiding it.
Here is an example. Oracle performs better if you drop indexes prior to loading a table. Let us assume you experience many issues where performance is impacted because there are missing indexes. If your DBA just re-creates these indexes, you have not solved the real issue. You still have an ETL job that is not fully re-creating the indexes. It is best to deal with situations like this from a holistic perspective. We have also seen situations where the ETL job did not drop all the indexes, and the Oracle loads ran slowly. Remember to look at the big picture.
Take away: Find out how the problem was resolved and record it in your journal.
VERIFY THE SOLUTION
Verifying the solution can be as simple as rerunning the query (or job stream) and comparing the output to your previous results. If the fix was rewriting your code, verify that the output is correct.
When your DBA implemented the solution to your problem, she probably ran a new EXPLAIN statement and compared the output to the one you supplied. This is a great way to see if the problem was fixed. If the explain plans are the same, it means that your problem was not really solved. We recommend rerunning the EXPLAIN statement and adding it to your SQL Tuning Journal.
The SQL Tuning Journal is a great educational tool. You can learn a great deal by comparing the plan with the problem to the plan with the solution.
Take away: Rerun the EXPLAIN statement and compare it with the previous one.
POST-MORTEM EXAMINATION
We have arrived at the last item on our checklist – post-mortem examination. Ideally, this will be a very reflective process. It is the time to understand the lessons that you have learned. Now is the time to ask the following questions:
What was the underlying cause of the issue?
Who helped you solve the issue?
How was the problem fixed?
How can you avoid similar issues in the future?
Postmortems are commonly overlooked. Many people do not view it as real work and cast it aside to move on to “more important” activities. We believe that a post-mortem examination is one of the most important things that you can do. We include it our own work, and that is why we have included it in this paper. Solving performance issues can be very painful and time-consuming. If you save your co-workers from this pain, you have acted nobly. Plus, it feels great to help people.
Full investment in this part of the process allows the lessons to be fully understood. The lessons might be as simple as learning a new technique for tuning SQL or a different way to code a SAS job. We hope that you take the time to discuss how the problem could have been avoided in the first place.
One of the worst situations you can find yourself in is having a problem occur – repeatedly. This type of situation is frustrating and demoralizing. The post-mortem examination will help you prevent recurring issues.
Let us look at an example. You are implementing a data warehouse. You are creating the ETL processes that will ensure that the warehouse is loaded in an efficient manner. Every night, you have problems with slow loading. Every morning, you have SQL performance issues. You look through your notes and notice that as the load file size increases problems appear. Jobs that previously ran in minutes might now take an hour or more. Your notes also show that you constantly have to ask your DBA to fix the performance issues in the morning. In the past, you have used database-specific load utilities (rather than SAS) to fix the issue.
The loading issue might be easy. Get the team to evaluate the load jobs and change the SAS jobs so that the bulk loading feature is used. Many people do not know how to use these features and just need to be made aware of them. In short: develop a universal loading strategy for your warehouse and implement it before loading becomes an issue. As a result, your jobs run much faster, and the time variance is mitigated.
The second problem is sneaky. From what you have learned in this paper, you can probably guess that there are statistics issues here. If you have kept an SQL Tuning Journal, this should be obvious. (This is why you need to document how your DBA fixes problems.) The holistic solution is to meet with your DBA and develop an official
Data ManagementSAS Global Forum 2013
12
strategy for collecting statistics during the ETL process. Having your ETL process automatically gather statistics is a winning idea. It prevents you from having to deal with random performance issues every morning.
Having this information in your SQL Tuning Journal is very valuable. Taking this information and sharing it increases its value exponentially. The question is, “How do you share this information?” The tools that we use are papers, blogging, presentations, and workshops. We live in amazing times. It has never been easier to broadcast your message. One of the great things about documenting your solutions on the web is that it is easy for other folks to find solutions with a simple search.
Take away: This is the time to integrate what you have learned so that you fully understand it. Once you understand it, shout the lessons from a mountain top.
CONCLUSION
Using the SQL Tuning Checklist is a painless approach to solving SQL performance problems. After reading this paper, you are not an SQL tuning wizard, but you know that you do not have to be. It is the mindset that is important, and now you have that. In addition, you now have a clear, concise, and actionable plan that you can use to tame the wildest of SQL problems. You have a basic understanding of the cause of many of the issues that you will encounter, and you know how to get your DBA to help you. Finally, you know how to avoid many of these issues in the first place.
Please take the ideas presented here and customize them for your situation. If something does not work for you, delete it. If something is missing, add it. Be sure to let us know what you have added. We will help you spread the word.
REFERENCES
Bailey, Jeff. 2010. “Troubleshooting SAS and Teradata Query Performance Problems.” Cary, NC: SAS Institute, Inc. Available at http://support.sas.com/resources/papers/TroubleshootingSASandTeradataQueryPerformanceProblems.pdf.
Crooks, Ember. “Mining your package cache for problem SQL in DB2 for Linux, UNIX, and Windows.” IBM developerWorks. November 12, 2012. Available at http://www.ibm.com/developerworks/data/library/techarticle/dm-1211packagecache/index.html.
EMC Corporation. 2012. Greenplum Database 4.2: Database Administrator Guide.
ACKNOWLEDGMENTS
The authors extend their heartfelt thanks and gratitude to the following individuals:
Oak Barrett, EMC
Pravin Boniface, SAS Institute Inc.
Pat Buckley, SAS Institute Inc.
John Cunningham, Teradata
Marie Dexter, SAS Institute Inc.
Patrick Hennessy, EMC
Momolue Kiadii, Teradata
Greg Otto, Teradata
Austin Swift, SAS Institute Inc.
CONTACT INFORMATION
Your comments and questions are valued and encouraged. Contact the authors:
Jeff Bailey SAS Campus Drive SAS Institute Inc. [email protected] LinkedIn: http://www.linkedin.com/in/jeffreydbailey Twitter: http://twitter.com/Jeff_Bailey
Data ManagementSAS Global Forum 2013
13
Tatyana Petrova SAS Campus Drive SAS Institute Inc. [email protected]
SAS and all other SAS Institute Inc. product or service names are registered trademarks or trademarks of SAS Institute Inc. in the USA and other countries. ® indicates USA registration.
Other brand and product names are trademarks of their respective companies.
Data ManagementSAS Global Forum 2013


![[Shinobi] Claymore 080](https://img.pdfslide.us/doc/110x75/568c49bd1a28ab49169561dc/shinobi-claymore-080.jpg)