Embed Size (px)
DESCRIPTION
INTRODUCTION TO LTE RADIO PLANNING CAPACITY
Citation preview
1 © Nokia Siemens Networks RA41208EN30GLA0
LTE RPESS Radio Planning Capacity
3 © Nokia Siemens Networks RA41208EN30GLA0
Module Objectives
After completing this module, the participant should be able to:
• Understand basic traffic modelling
• Evaluate the cell capacity
• Understand the main factors impacting the cell capacity
• Review the baseband dimensioning
4 © Nokia Siemens Networks RA41208EN30GLA0
Radio Planning Capacity
Capacity Dimensioning
Cell Capacity (Throughput)
Baseband Dimensioning
5 © Nokia Siemens Networks RA41208EN30GLA0
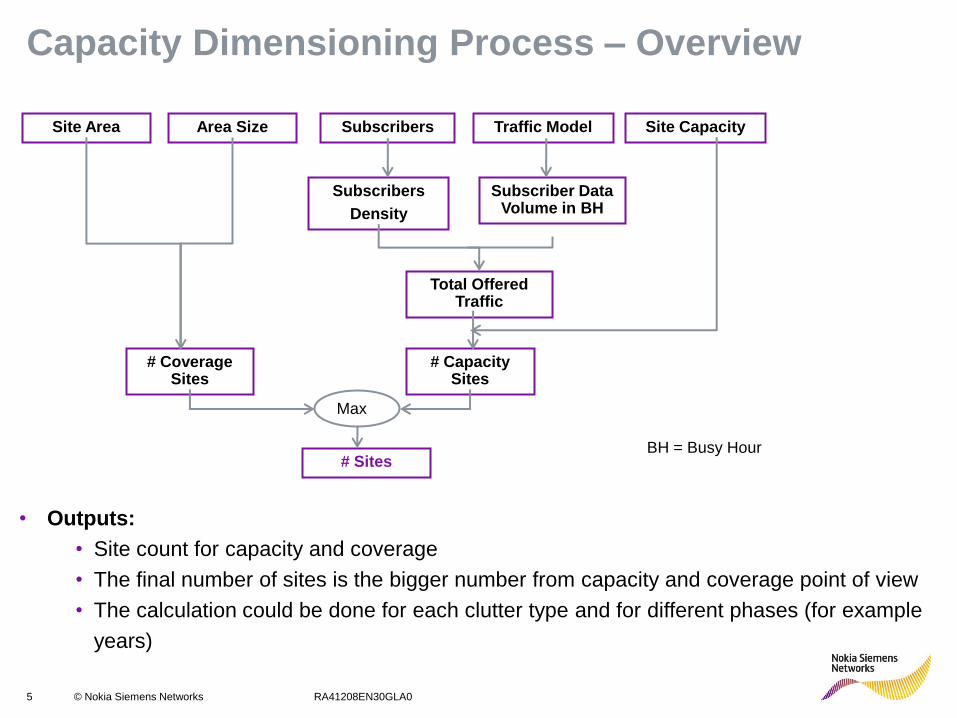
Capacity Dimensioning Process – Overview
Site Area Area Size Subscribers Traffic Model Site Capacity
Subscribers
Density
Subscriber Data Volume in BH
Total Offered Traffic
# Capacity Sites
# Coverage Sites
# Sites
Max
BH = Busy Hour
• Outputs:
• Site count for capacity and coverage
• The final number of sites is the bigger number from capacity and coverage point of view
• The calculation could be done for each clutter type and for different phases (for example
years)
6 © Nokia Siemens Networks RA41208EN30GLA0
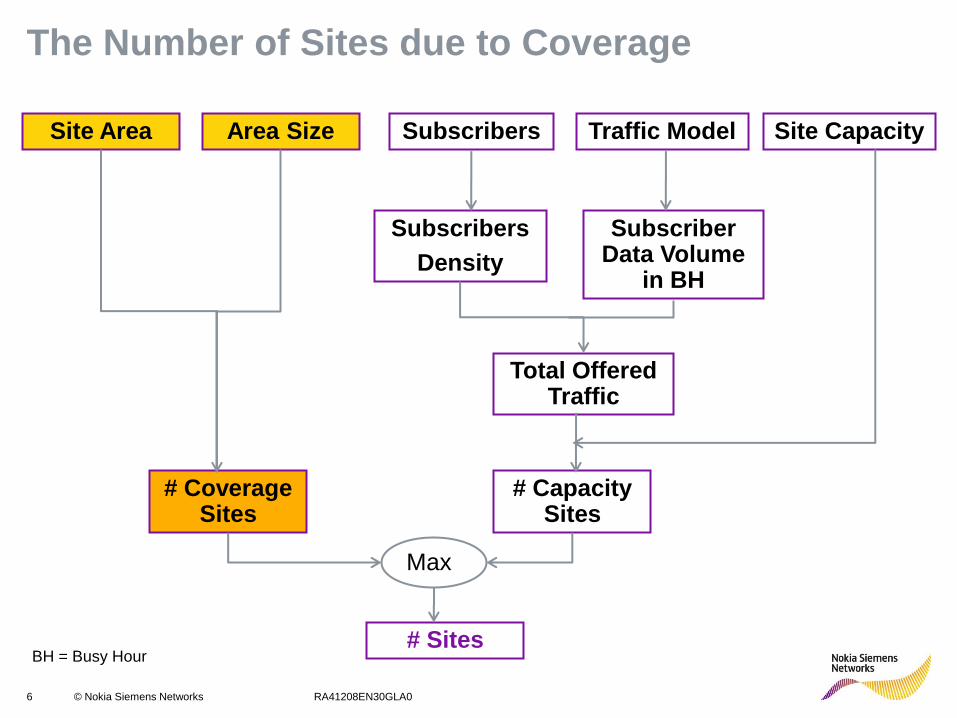
The Number of Sites due to Coverage
Site Area Area Size Subscribers Traffic Model Site Capacity
Subscribers
Density
Subscriber Data Volume
in BH
Total Offered Traffic
# Capacity Sites
# Coverage Sites
# Sites
Max
BH = Busy Hour
7 © Nokia Siemens Networks RA41208EN30GLA0
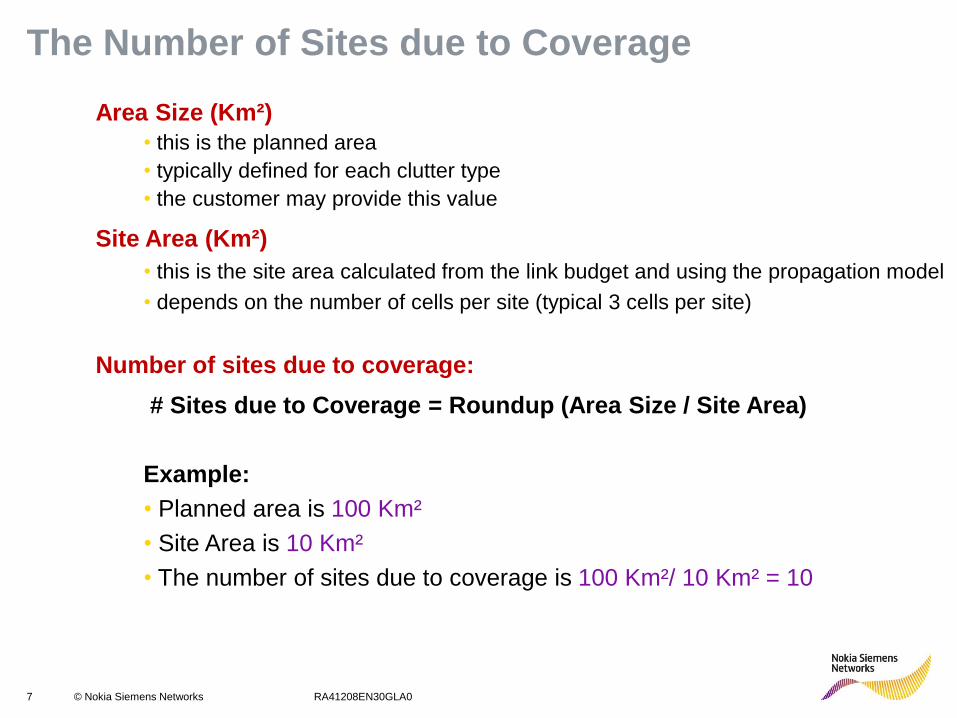
The Number of Sites due to Coverage
Area Size (Km²)
• this is the planned area
• typically defined for each clutter type
• the customer may provide this value
Site Area (Km²)
• this is the site area calculated from the link budget and using the propagation model
• depends on the number of cells per site (typical 3 cells per site)
Number of sites due to coverage:
# Sites due to Coverage = Roundup (Area Size / Site Area)
Example:
• Planned area is 100 Km²
• Site Area is 10 Km²
• The number of sites due to coverage is 100 Km²/ 10 Km² = 10
8 © Nokia Siemens Networks RA41208EN30GLA0
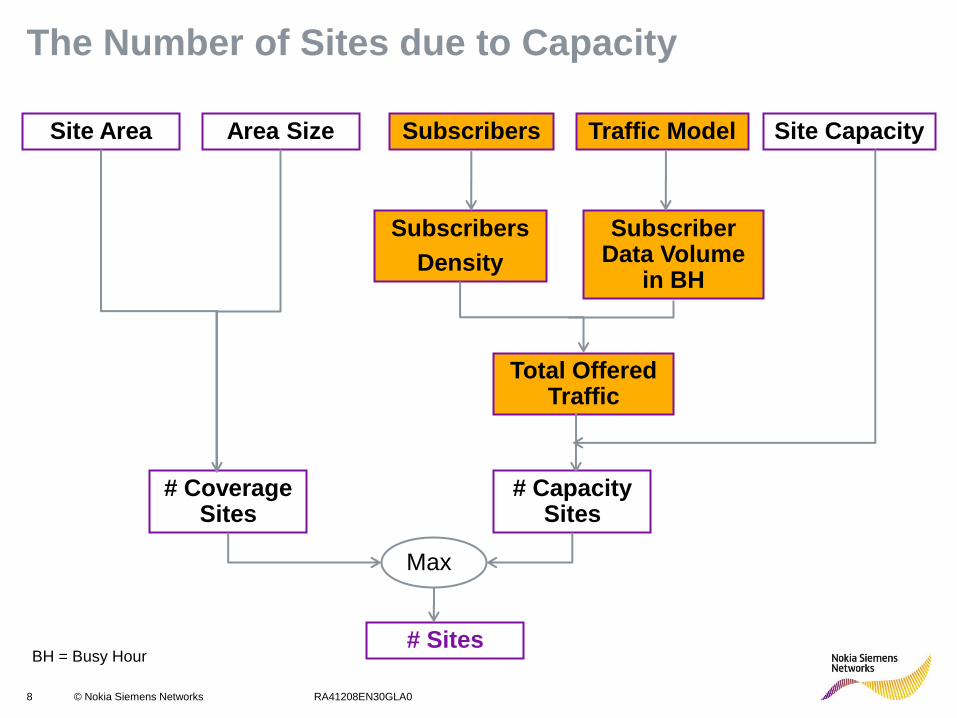
The Number of Sites due to Capacity
Site Area Area Size Subscribers Traffic Model Site Capacity
Subscribers
Density
Subscriber Data Volume
in BH
Total Offered Traffic
# Capacity Sites
# Coverage Sites
# Sites
Max
BH = Busy Hour
9 © Nokia Siemens Networks RA41208EN30GLA0
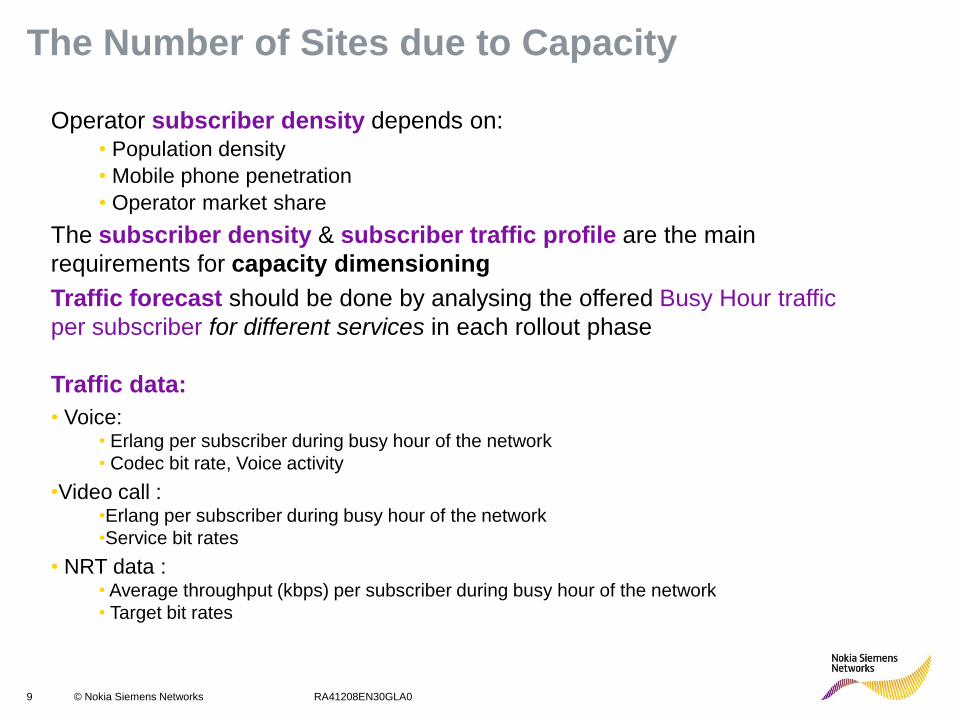
The Number of Sites due to Capacity
Operator subscriber density depends on: • Population density
• Mobile phone penetration
• Operator market share
The subscriber density & subscriber traffic profile are the main
requirements for capacity dimensioning
Traffic forecast should be done by analysing the offered Busy Hour traffic
per subscriber for different services in each rollout phase
Traffic data:
• Voice: • Erlang per subscriber during busy hour of the network
• Codec bit rate, Voice activity
•Video call : •Erlang per subscriber during busy hour of the network
•Service bit rates
• NRT data : • Average throughput (kbps) per subscriber during busy hour of the network
• Target bit rates
10 © Nokia Siemens Networks RA41208EN30GLA0
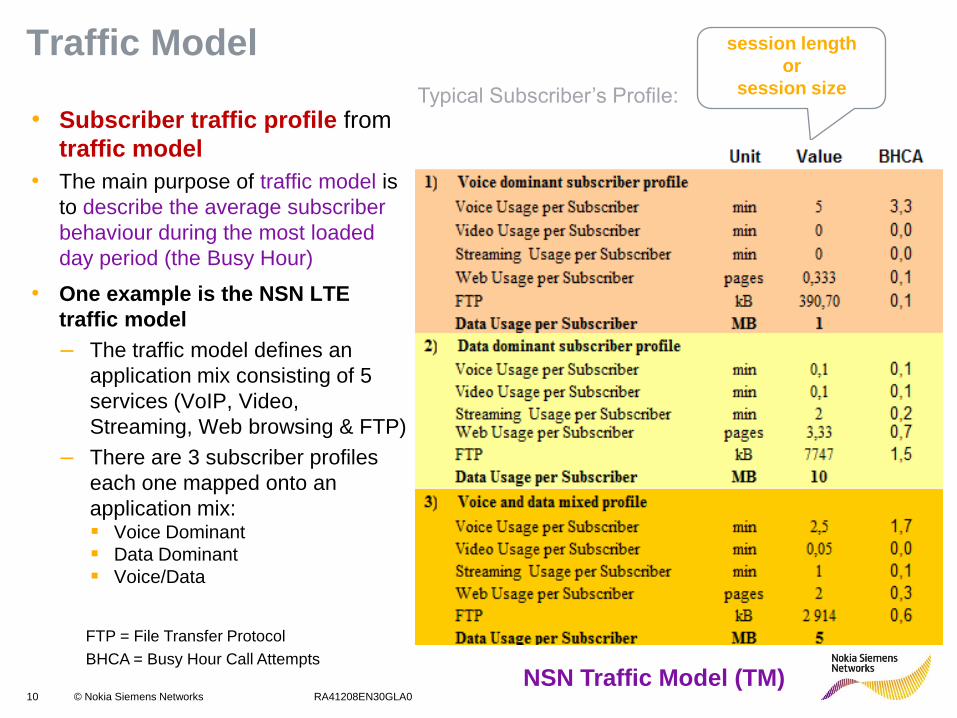
Traffic Model • Subscriber traffic profile from
traffic model
• The main purpose of traffic model is
to describe the average subscriber
behaviour during the most loaded
day period (the Busy Hour)
• One example is the NSN LTE
traffic model
– The traffic model defines an
application mix consisting of 5
services (VoIP, Video,
Streaming, Web browsing & FTP)
– There are 3 subscriber profiles
each one mapped onto an
application mix: Voice Dominant
Data Dominant
Voice/Data
session length
or
session size Typical Subscriber’s Profile:
FTP = File Transfer Protocol
BHCA = Busy Hour Call Attempts
NSN Traffic Model (TM)
11 © Nokia Siemens Networks RA41208EN30GLA0
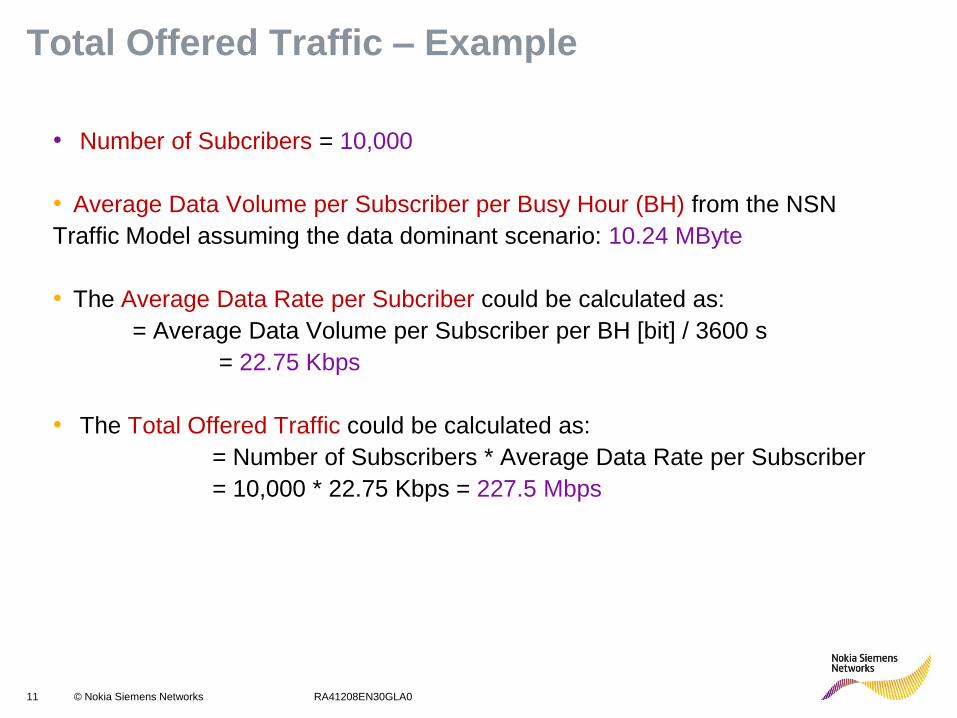
Total Offered Traffic – Example
• Number of Subcribers = 10,000
• Average Data Volume per Subscriber per Busy Hour (BH) from the NSN
Traffic Model assuming the data dominant scenario: 10.24 MByte
• The Average Data Rate per Subcriber could be calculated as:
= Average Data Volume per Subscriber per BH [bit] / 3600 s
= 22.75 Kbps
• The Total Offered Traffic could be calculated as:
= Number of Subscribers * Average Data Rate per Subscriber
= 10,000 * 22.75 Kbps = 227.5 Mbps
12 © Nokia Siemens Networks RA41208EN30GLA0
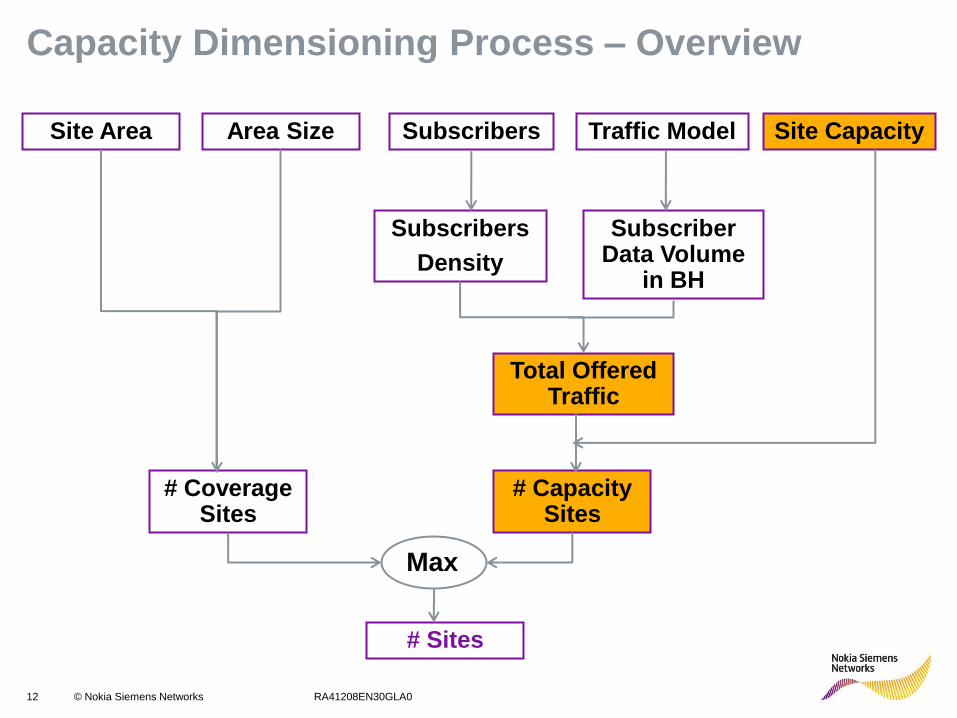
Capacity Dimensioning Process – Overview
Site Area Area Size Subscribers Traffic Model Site Capacity
Subscribers
Density
Subscriber Data Volume
in BH
Total Offered Traffic
# Capacity Sites
# Coverage Sites
# Sites
Max
13 © Nokia Siemens Networks RA41208EN30GLA0
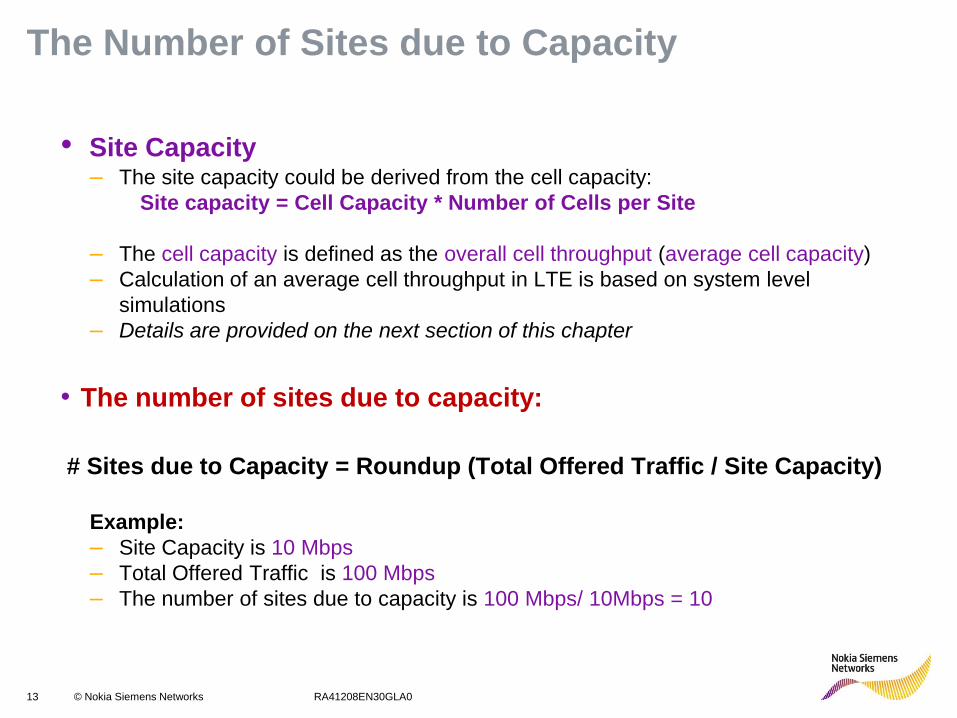
The Number of Sites due to Capacity
• Site Capacity – The site capacity could be derived from the cell capacity:
Site capacity = Cell Capacity * Number of Cells per Site
– The cell capacity is defined as the overall cell throughput (average cell capacity)
– Calculation of an average cell throughput in LTE is based on system level
simulations
– Details are provided on the next section of this chapter
• The number of sites due to capacity:
# Sites due to Capacity = Roundup (Total Offered Traffic / Site Capacity)
Example:
– Site Capacity is 10 Mbps
– Total Offered Traffic is 100 Mbps
– The number of sites due to capacity is 100 Mbps/ 10Mbps = 10
14 © Nokia Siemens Networks RA41208EN30GLA0
Radio Planning Capacity
Capacity Dimensioning
Cell Capacity (Throughput)
Baseband Dimensioning
15 © Nokia Siemens Networks RA41208EN30GLA0
Cell Throughput Calculation Methodology
• DL & UL Capacity are calculated based on system level simulations
• Algorithm calculates the Average Cell Throughput (capacity) for a single cell
• During the system level simulations effects like UE mobility, slow/ fast fading,
scheduling, power control, admission control, handovers have been considered
• The basic principle of these simulations is that for a given cell area a certain (evenly
distributed) subscriber density is assumed and for each subscriber particular SINR
conditions apply which depend on the location of the subscriber in the cell
• Capacity Simulations Results:
• Calculation of an average cell throughput is based on a method which calculates
the spectral efficiency
• 4 representative site grids (defined by the Inter-Site Distance (ISD): 500m, 1732m,
3000m, 9000m) have been simulated in dynamic system level environment
• UL & DL spectral efficiency figures have been gathered for all available channel
bandwidth configurations (1.4MHz, 3MHz, 5 MHz, 10MHz, 15MHz & 20 MHz)
16 © Nokia Siemens Networks RA41208EN30GLA0
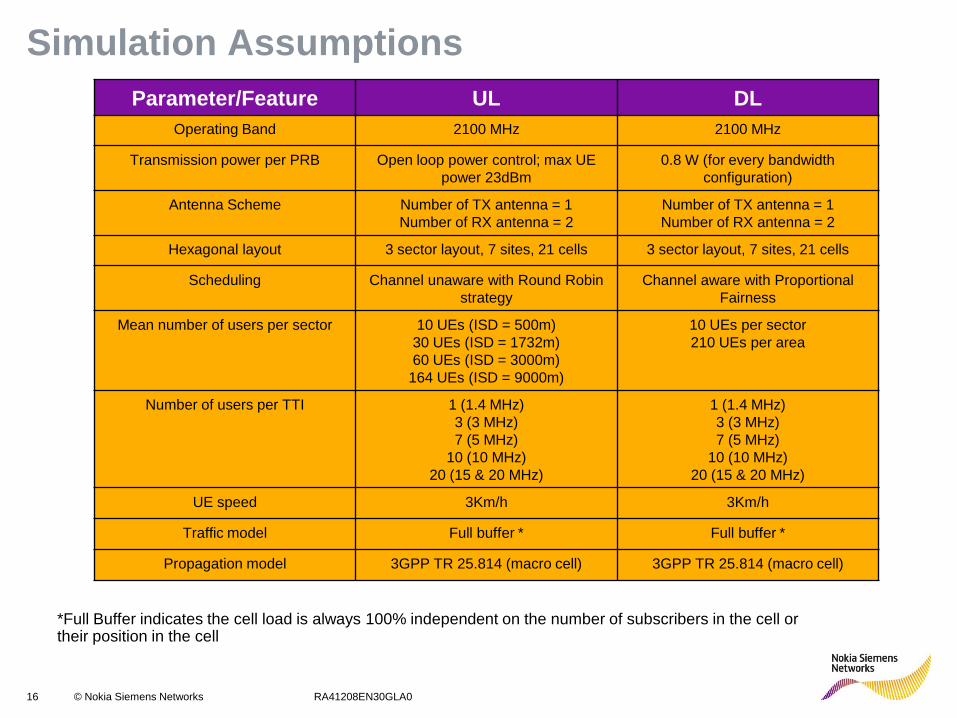
Simulation Assumptions
Parameter/Feature UL DL
Operating Band 2100 MHz 2100 MHz
Transmission power per PRB Open loop power control; max UE
power 23dBm
0.8 W (for every bandwidth
configuration)
Antenna Scheme Number of TX antenna = 1
Number of RX antenna = 2
Number of TX antenna = 1
Number of RX antenna = 2
Hexagonal layout 3 sector layout, 7 sites, 21 cells 3 sector layout, 7 sites, 21 cells
Scheduling Channel unaware with Round Robin
strategy
Channel aware with Proportional
Fairness
Mean number of users per sector 10 UEs (ISD = 500m)
30 UEs (ISD = 1732m)
60 UEs (ISD = 3000m)
164 UEs (ISD = 9000m)
10 UEs per sector
210 UEs per area
Number of users per TTI 1 (1.4 MHz)
3 (3 MHz)
7 (5 MHz)
10 (10 MHz)
20 (15 & 20 MHz)
1 (1.4 MHz)
3 (3 MHz)
7 (5 MHz)
10 (10 MHz)
20 (15 & 20 MHz)
UE speed 3Km/h 3Km/h
Traffic model Full buffer * Full buffer *
Propagation model 3GPP TR 25.814 (macro cell) 3GPP TR 25.814 (macro cell)
*Full Buffer indicates the cell load is always 100% independent on the number of subscribers in the cell or their position in the cell
17 © Nokia Siemens Networks RA41208EN30GLA0
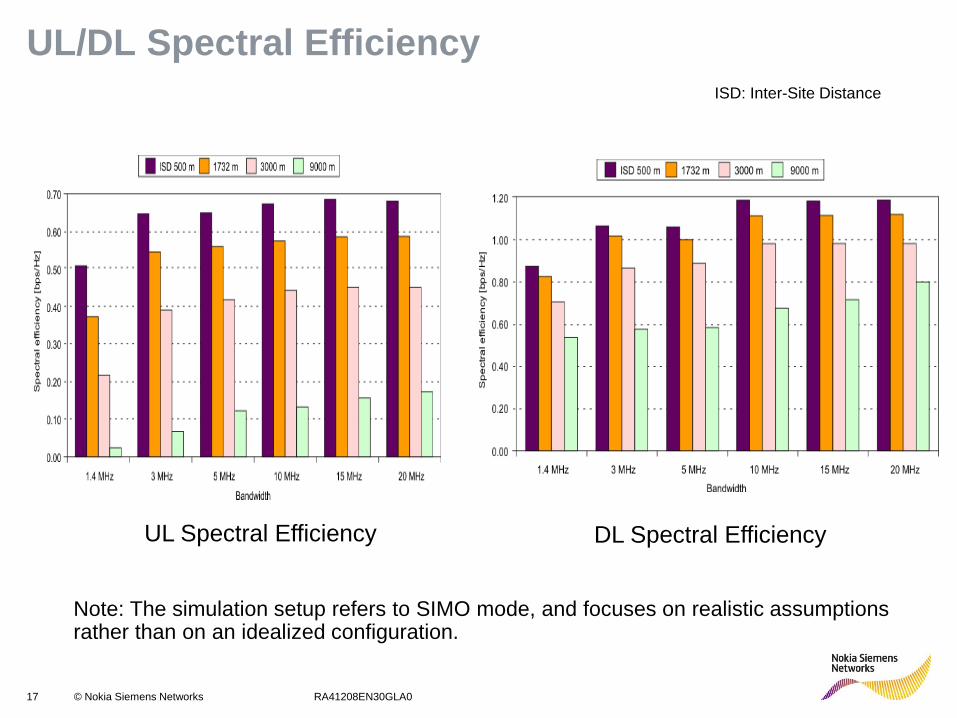
UL/DL Spectral Efficiency
UL Spectral Efficiency DL Spectral Efficiency
ISD: Inter-Site Distance
Sp
ectr
al E
ffic
ien
cy (
Kb
ps/K
Hz)
Note: The simulation setup refers to SIMO mode, and focuses on realistic assumptions rather than on an idealized configuration.
18 © Nokia Siemens Networks RA41208EN30GLA0
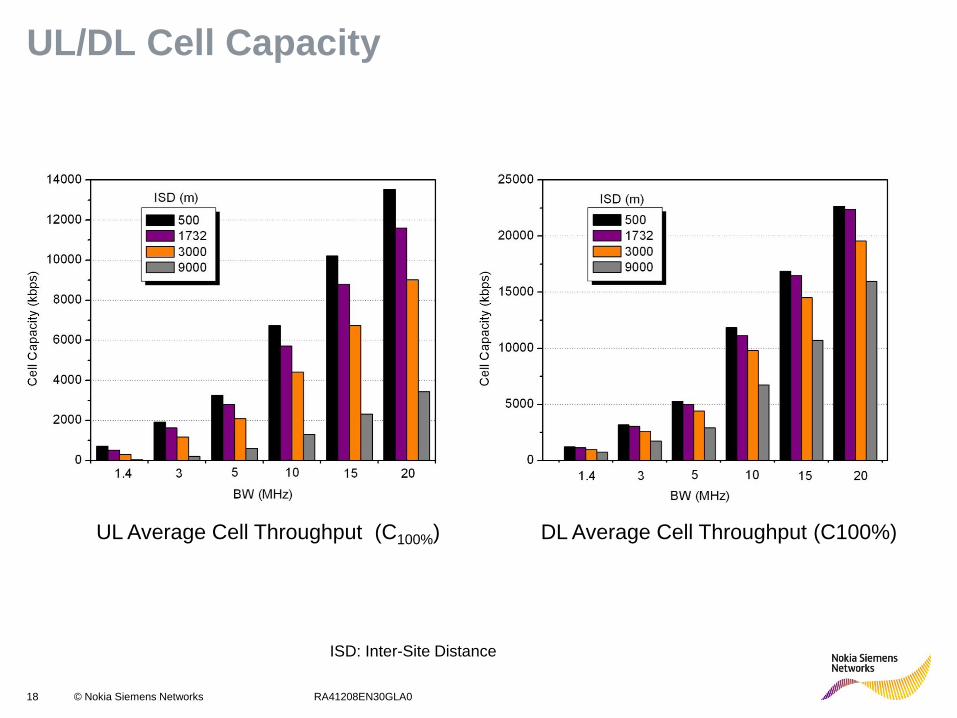
UL/DL Cell Capacity
UL Average Cell Throughput (C100%) DL Average Cell Throughput (C100%)
ISD: Inter-Site Distance
19 © Nokia Siemens Networks RA41208EN30GLA0
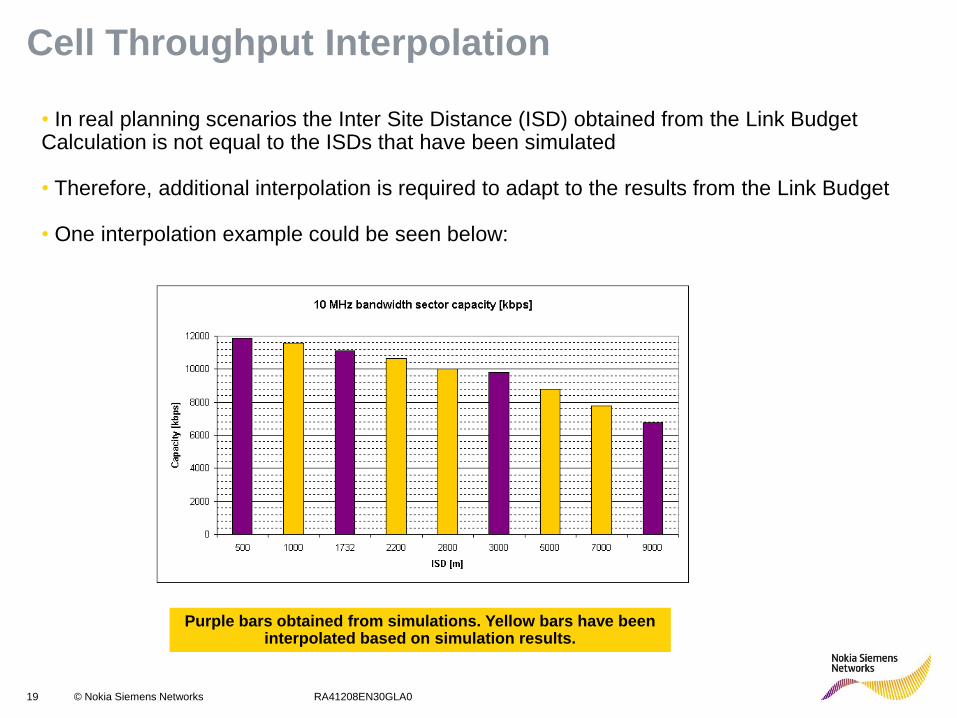
Cell Throughput Interpolation
Purple bars obtained from simulations. Yellow bars have been interpolated based on simulation results.
• In real planning scenarios the Inter Site Distance (ISD) obtained from the Link Budget Calculation is not equal to the ISDs that have been simulated
• Therefore, additional interpolation is required to adapt to the results from the Link Budget
• One interpolation example could be seen below:
20 © Nokia Siemens Networks RA41208EN30GLA0
Factors Affecting the Cell Capacity
• The LTE Cell Capacity (Throughput) depends on:
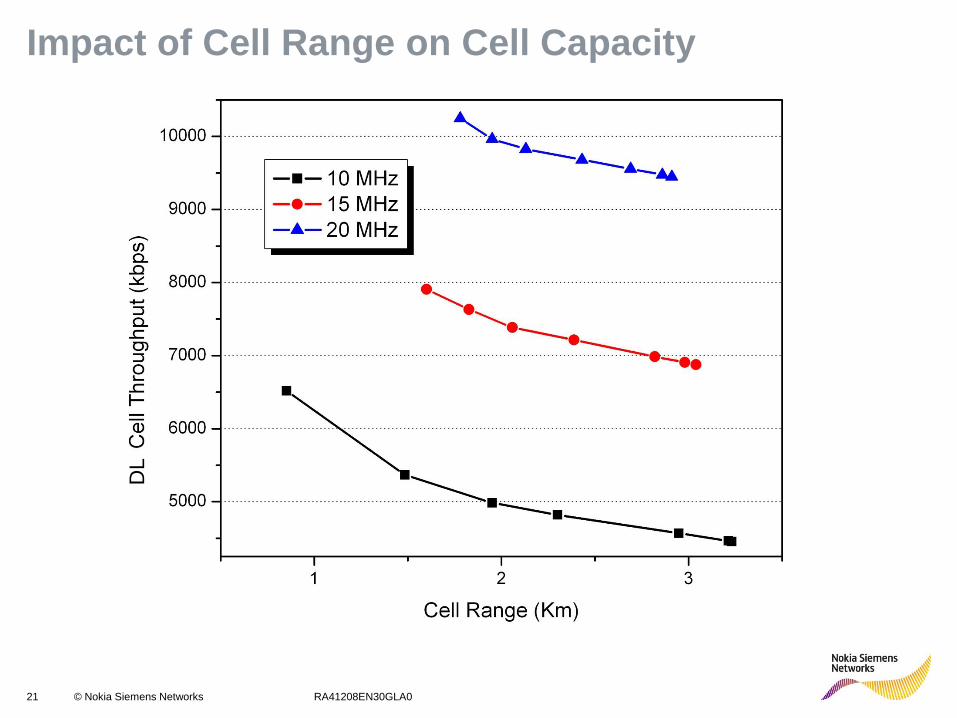
• Cell Range (Pathloss) – Considered as a variation of the Inter Site Distance (ISD)
– The effect of larger ISD has been presented in the previous slides
– The SINR distribution is bad in larger cells which becomes more & more noise limited
• Channel Bandwidth (1.4 MHz ... 20 MHz) – The best capacity performance can be achieved with wide channel bandwidth due to
the maximum frequency diversity gain
– Small Bandwidth configuration are characterized by high system overhead
• Cell Load – The values presented so far are for 100% cell load
– The impact of cell load is based on simulation results
• LTE Features: – MIMO (Multiple Input Multiple Output)
– Scheduling: Proportional Fair or Round Robin
See next slides for details
21 © Nokia Siemens Networks RA41208EN30GLA0
Impact of Cell Range on Cell Capacity
DL
22 © Nokia Siemens Networks RA41208EN30GLA0
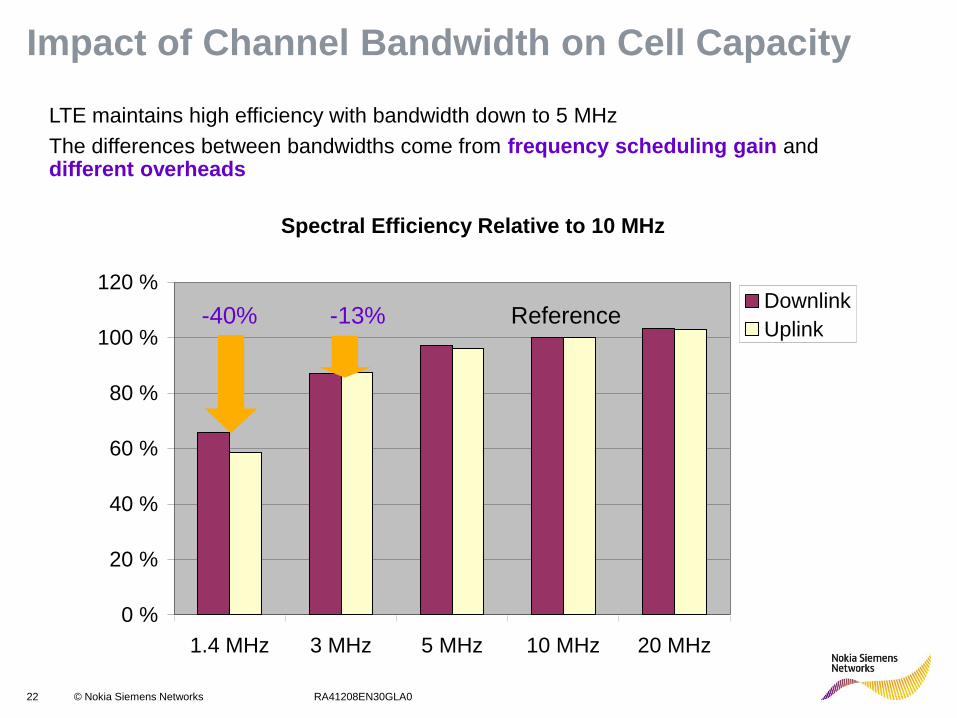
Spectral Efficiency Relative to 10 MHz
0 %
20 %
40 %
60 %
80 %
100 %
120 %
1.4 MHz 3 MHz 5 MHz 10 MHz 20 MHz
Downlink
Uplink
Impact of Channel Bandwidth on Cell Capacity
-40% -13% Reference
LTE maintains high efficiency with bandwidth down to 5 MHz
The differences between bandwidths come from frequency scheduling gain and different overheads
23 © Nokia Siemens Networks RA41208EN30GLA0
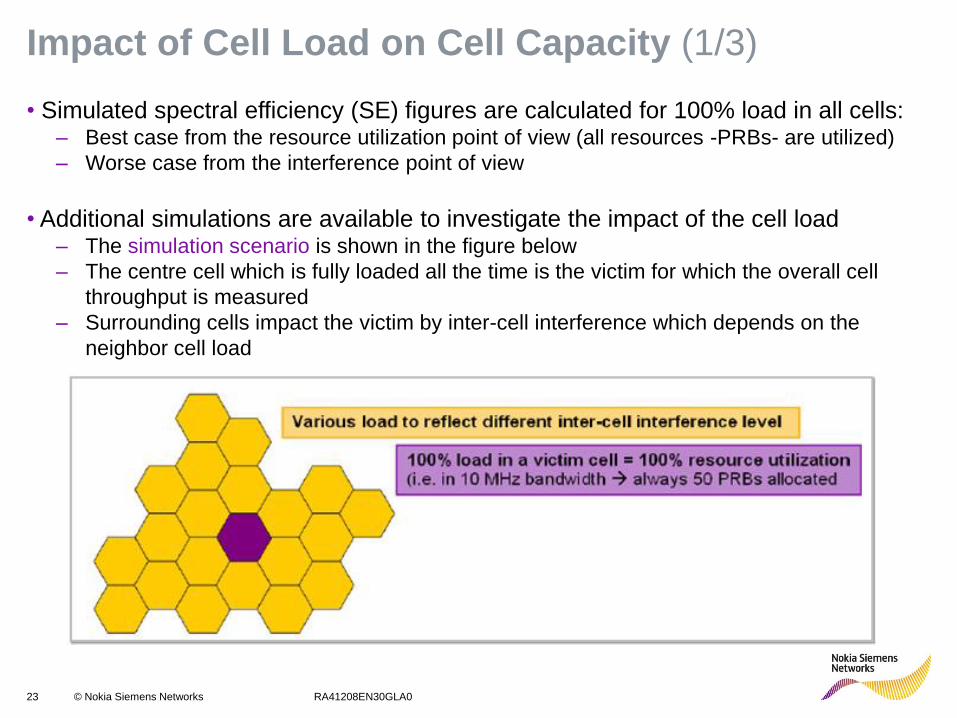
Impact of Cell Load on Cell Capacity (1/3)
• Simulated spectral efficiency (SE) figures are calculated for 100% load in all cells: – Best case from the resource utilization point of view (all resources -PRBs- are utilized)
– Worse case from the interference point of view
• Additional simulations are available to investigate the impact of the cell load – The simulation scenario is shown in the figure below
– The centre cell which is fully loaded all the time is the victim for which the overall cell
throughput is measured
– Surrounding cells impact the victim by inter-cell interference which depends on the
neighbor cell load
24 © Nokia Siemens Networks RA41208EN30GLA0
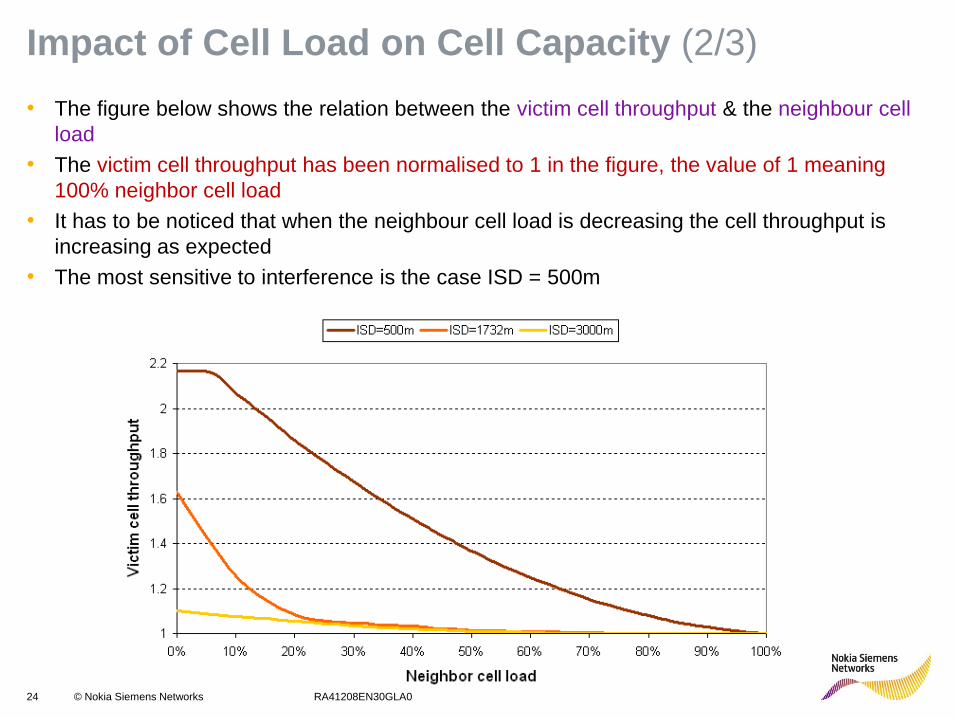
Impact of Cell Load on Cell Capacity (2/3)
• The figure below shows the relation between the victim cell throughput & the neighbour cell
load
• The victim cell throughput has been normalised to 1 in the figure, the value of 1 meaning
100% neighbor cell load
• It has to be noticed that when the neighbour cell load is decreasing the cell throughput is
increasing as expected
• The most sensitive to interference is the case ISD = 500m
25 © Nokia Siemens Networks RA41208EN30GLA0
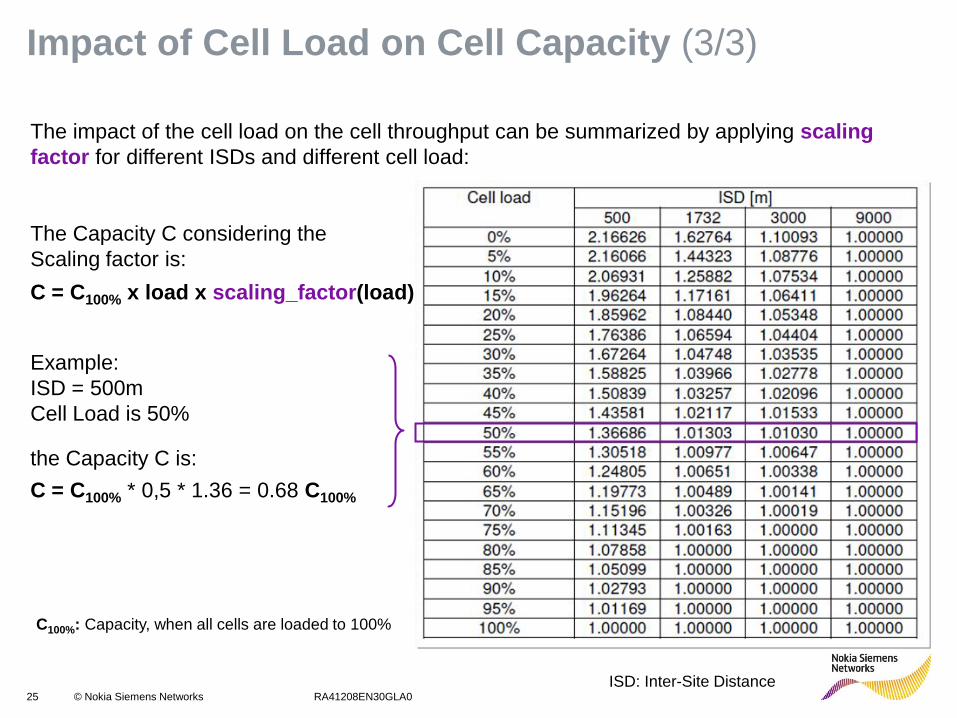
Impact of Cell Load on Cell Capacity (3/3)
The impact of the cell load on the cell throughput can be summarized by applying scaling
factor for different ISDs and different cell load:
The Capacity C considering the
Scaling factor is:
C = C100% x load x scaling_factor(load)
Example:
ISD = 500m
Cell Load is 50%
the Capacity C is:
C = C100% * 0,5 * 1.36 = 0.68 C100%
ISD: Inter-Site Distance
C100%: Capacity, when all cells are loaded to 100%
26 © Nokia Siemens Networks RA41208EN30GLA0
Impact of MIMO on Cell Capacity (1/3)
RL 30 supports 2 transmit antennas at the eNodeB
Transmit diversity (Tx diversity)
• results in coverage improvement
• therefore, it is more suitable to be used at the cell edge
Open / Closed Loop Spatial Multiplexing
• Spatial multiplexing on the other hand doubles the user data rate
The mechanism of Adaptive MIMO Mode Control assures CQI dependent switching
between Transmit Diversity and Spatial Multiplexing (see next slide)
The average cell capacity is then determined by:
• the ratio of the dual-stream transmissions (how much Tx diversity & how much spatial
multiplexing) for one connection in average
• The number of users out of total cell users which are using either Tx diversity or spatial
multiplexing
27 © Nokia Siemens Networks RA41208EN30GLA0
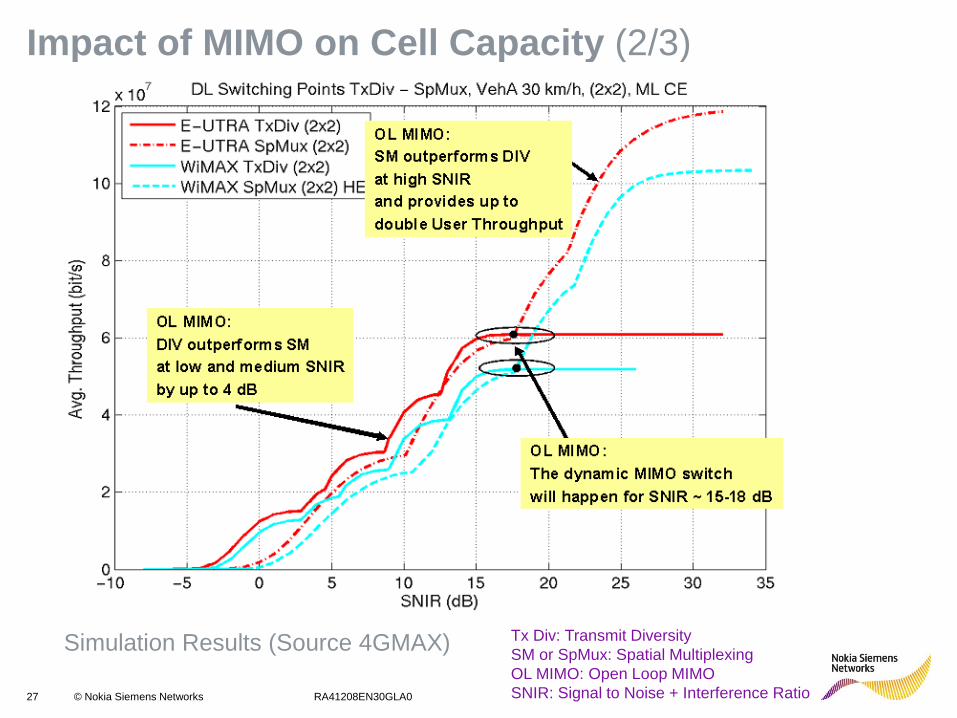
Impact of MIMO on Cell Capacity (2/3)
Simulation Results (Source 4GMAX) Tx Div: Transmit Diversity
SM or SpMux: Spatial Multiplexing
OL MIMO: Open Loop MIMO
SNIR: Signal to Noise + Interference Ratio
28 © Nokia Siemens Networks RA41208EN30GLA0
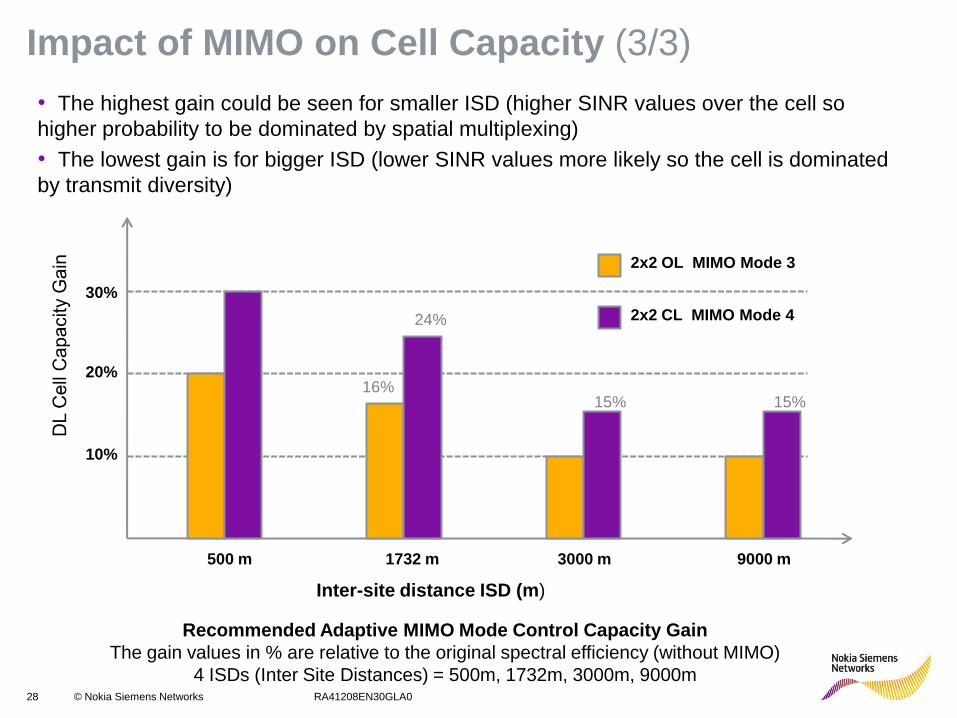
Impact of MIMO on Cell Capacity (3/3)
• The highest gain could be seen for smaller ISD (higher SINR values over the cell so
higher probability to be dominated by spatial multiplexing)
• The lowest gain is for bigger ISD (lower SINR values more likely so the cell is dominated
by transmit diversity)
Recommended Adaptive MIMO Mode Control Capacity Gain
The gain values in % are relative to the original spectral efficiency (without MIMO)
4 ISDs (Inter Site Distances) = 500m, 1732m, 3000m, 9000m
Inter-site distance ISD (m)
10%
20%
30%
500 m 1732 m 3000 m 9000 m
16%
24%
15% 15%
2x2 OL MIMO Mode 3
2x2 CL MIMO Mode 4
29 © Nokia Siemens Networks RA41208EN30GLA0
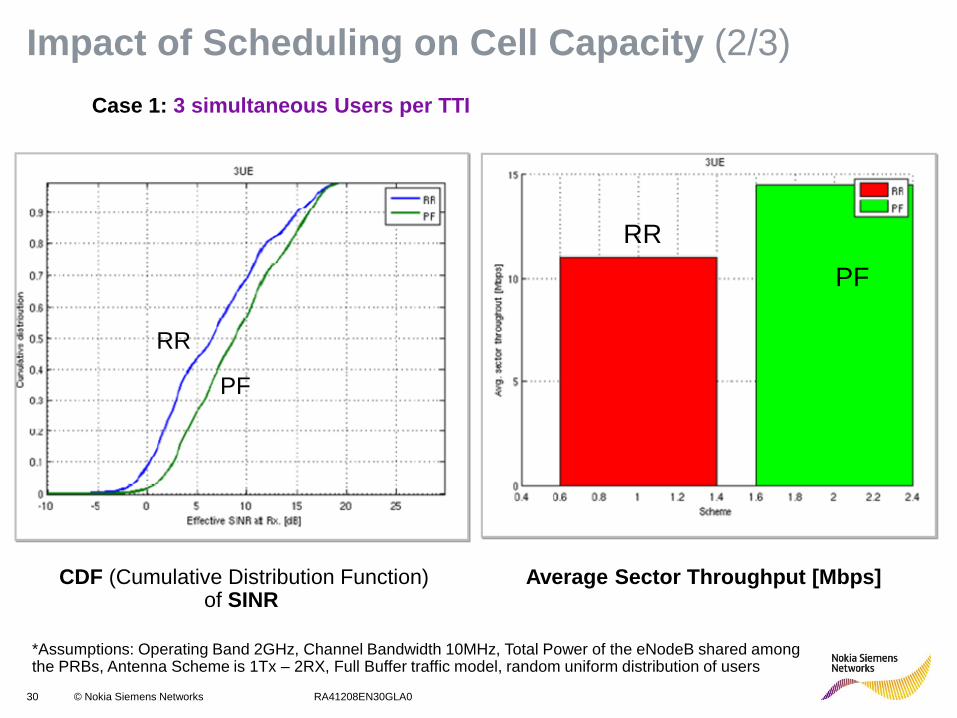
Impact of Scheduling on Cell Capacity (1/3)
• In RL 20 two scheduling strategies for DL FDPS* are supported:
• Round Robin RR (default)
• Proportional Fair PF (license)
• From the average cell throughput point of view there is some gain when
Proportional Fair (PF) is used versus Round Robin (RR)
• The main reason for the gain is coming from the fact that the SINR distribution in
the cell is improved when Proportional Fair is used
• The gain is dependent on the number of users that are scheduled together in the
same TTI (1ms): the higher the number of scheduled users per TTI the higher the
average cell throughput gain when Proportional Fair is in use
• 2 examples coming from simulations are shown in the next slides:
• 3 scheduled users per TTI
• 10 scheduled users per TTI
* FDPS: frequency domain packetscheduling
30 © Nokia Siemens Networks RA41208EN30GLA0
Impact of Scheduling on Cell Capacity (2/3)
CDF (Cumulative Distribution Function) of SINR
Average Sector Throughput [Mbps]
Case 1: 3 simultaneous Users per TTI
*Assumptions: Operating Band 2GHz, Channel Bandwidth 10MHz, Total Power of the eNodeB shared among the PRBs, Antenna Scheme is 1Tx – 2RX, Full Buffer traffic model, random uniform distribution of users
PF
RR
RR
PF
31 © Nokia Siemens Networks RA41208EN30GLA0
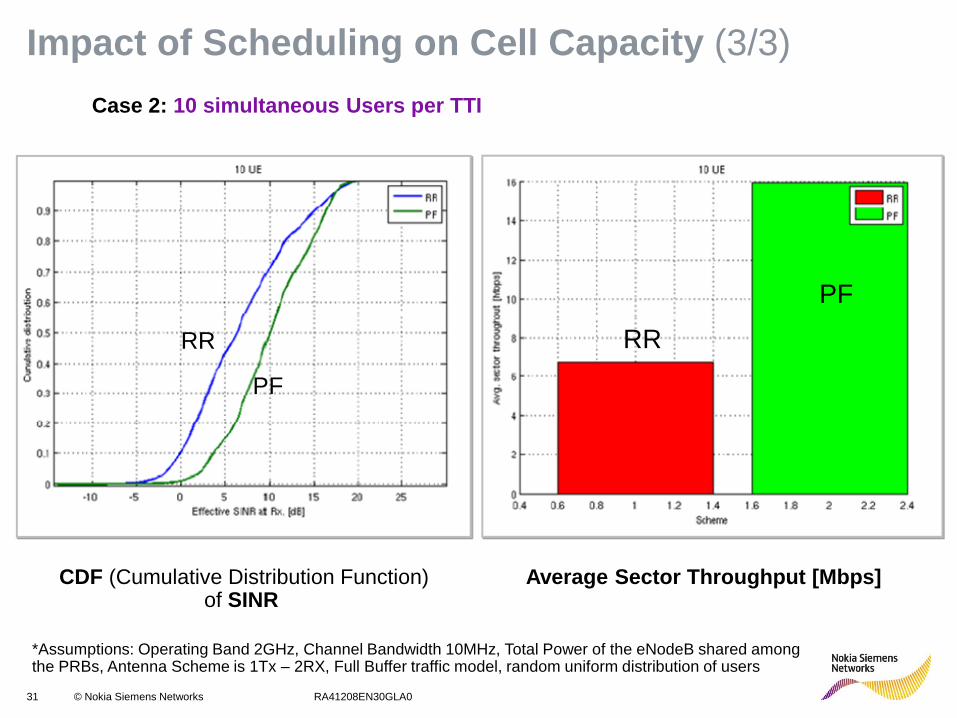
Impact of Scheduling on Cell Capacity (3/3)
Case 2: 10 simultaneous Users per TTI
Average Sector Throughput [Mbps]
*Assumptions: Operating Band 2GHz, Channel Bandwidth 10MHz, Total Power of the eNodeB shared among the PRBs, Antenna Scheme is 1Tx – 2RX, Full Buffer traffic model, random uniform distribution of users
PF
RR RR
PF
CDF (Cumulative Distribution Function) of SINR
32 © Nokia Siemens Networks RA41208EN30GLA0
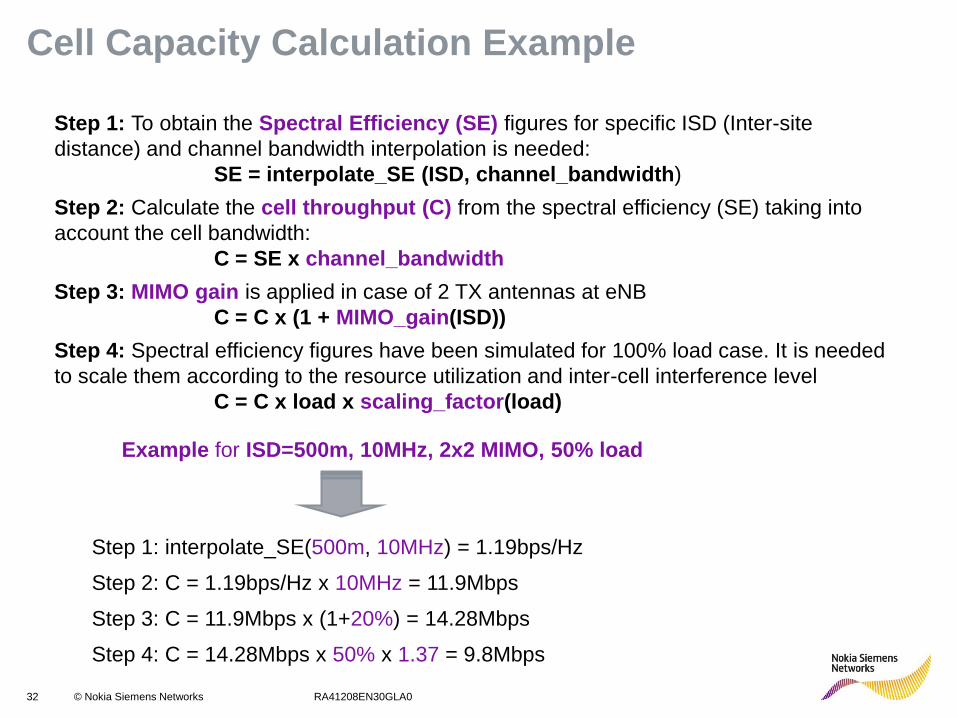
Cell Capacity Calculation Example
Step 1: To obtain the Spectral Efficiency (SE) figures for specific ISD (Inter-site
distance) and channel bandwidth interpolation is needed:
SE = interpolate_SE (ISD, channel_bandwidth)
Step 2: Calculate the cell throughput (C) from the spectral efficiency (SE) taking into
account the cell bandwidth:
C = SE x channel_bandwidth
Step 3: MIMO gain is applied in case of 2 TX antennas at eNB
C = C x (1 + MIMO_gain(ISD))
Step 4: Spectral efficiency figures have been simulated for 100% load case. It is needed
to scale them according to the resource utilization and inter-cell interference level
C = C x load x scaling_factor(load)
Step 1: interpolate_SE(500m, 10MHz) = 1.19bps/Hz
Step 2: C = 1.19bps/Hz x 10MHz = 11.9Mbps
Step 3: C = 11.9Mbps x (1+20%) = 14.28Mbps
Step 4: C = 14.28Mbps x 50% x 1.37 = 9.8Mbps
Example for ISD=500m, 10MHz, 2x2 MIMO, 50% load
33 © Nokia Siemens Networks RA41208EN30GLA0
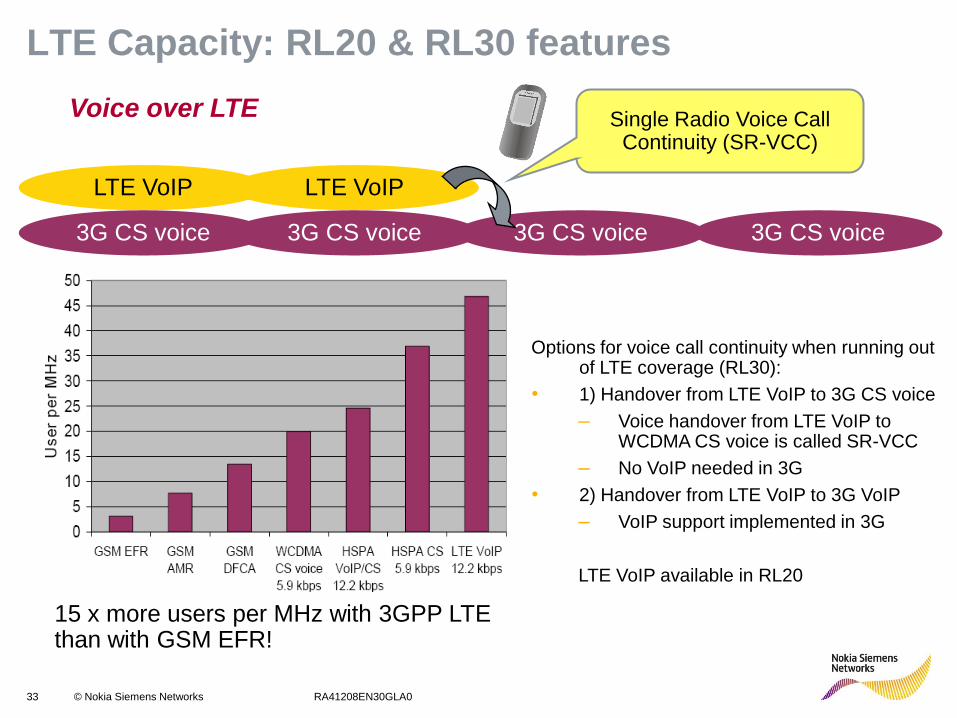
LTE Capacity: RL20 & RL30 features
Voice over LTE
LTE VoIP
3G CS voice
LTE VoIP
3G CS voice 3G CS voice 3G CS voice
Single Radio Voice Call Continuity (SR-VCC)
Options for voice call continuity when running out of LTE coverage (RL30):
• 1) Handover from LTE VoIP to 3G CS voice
– Voice handover from LTE VoIP to WCDMA CS voice is called SR-VCC
– No VoIP needed in 3G
• 2) Handover from LTE VoIP to 3G VoIP
– VoIP support implemented in 3G
LTE VoIP available in RL20
15 x more users per MHz with 3GPP LTE than with GSM EFR!
34 © Nokia Siemens Networks RA41208EN30GLA0
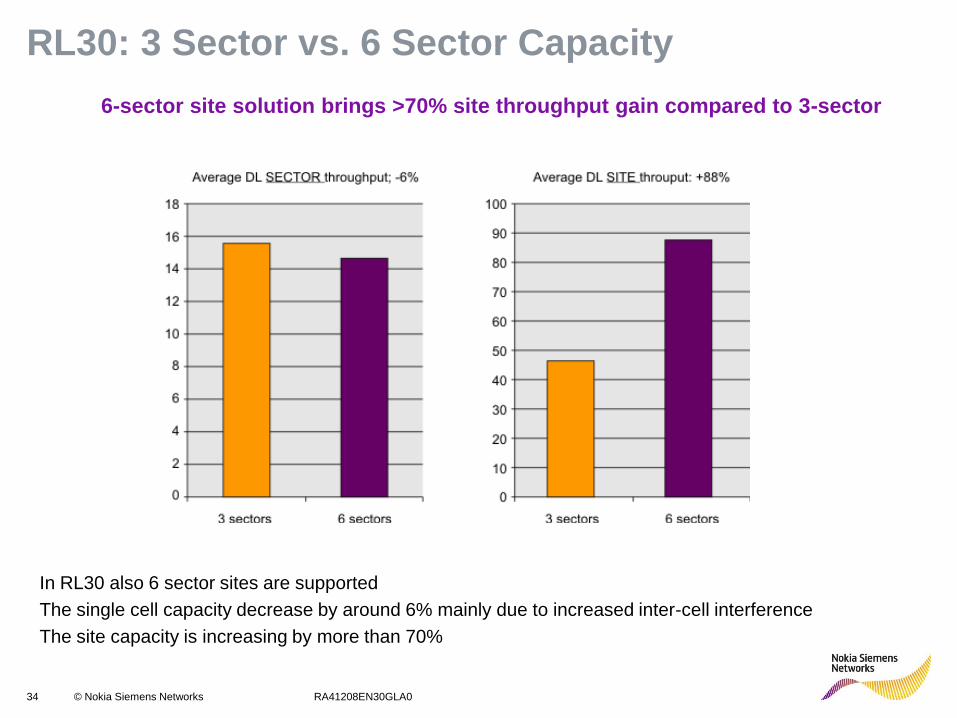
RL30: 3 Sector vs. 6 Sector Capacity
LTE 6-sector site solution brings >70% site throughput gain compared to 3-sector
In RL30 also 6 sector sites are supported
The single cell capacity decrease by around 6% mainly due to increased inter-cell interference
The site capacity is increasing by more than 70%
35 © Nokia Siemens Networks RA41208EN30GLA0
Radio Planning Capacity
Capacity Dimensioning
Cell Capacity (Throughput)
Baseband Dimensioning
36 © Nokia Siemens Networks RA41208EN30GLA0
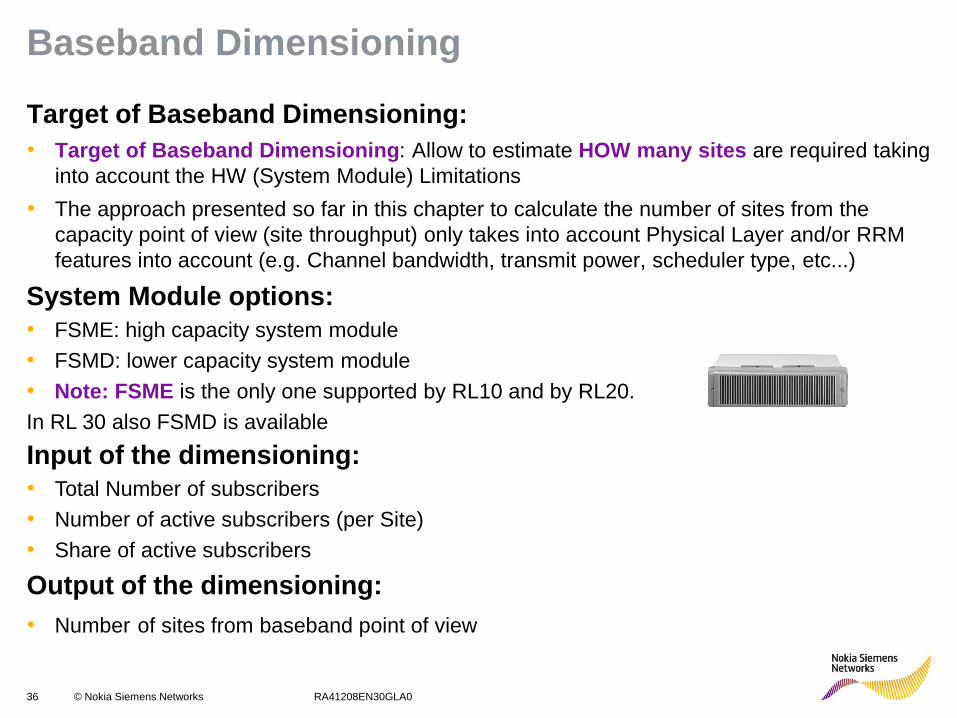
Baseband Dimensioning Target of Baseband Dimensioning:
• Target of Baseband Dimensioning: Allow to estimate HOW many sites are required taking
into account the HW (System Module) Limitations
• The approach presented so far in this chapter to calculate the number of sites from the
capacity point of view (site throughput) only takes into account Physical Layer and/or RRM
features into account (e.g. Channel bandwidth, transmit power, scheduler type, etc...)
System Module options:
• FSME: high capacity system module
• FSMD: lower capacity system module
• Note: FSME is the only one supported by RL10 and by RL20.
In RL 30 also FSMD is available
Input of the dimensioning:
• Total Number of subscribers
• Number of active subscribers (per Site)
• Share of active subscribers
Output of the dimensioning:
• Number of sites from baseband point of view
37 © Nokia Siemens Networks RA41208EN30GLA0
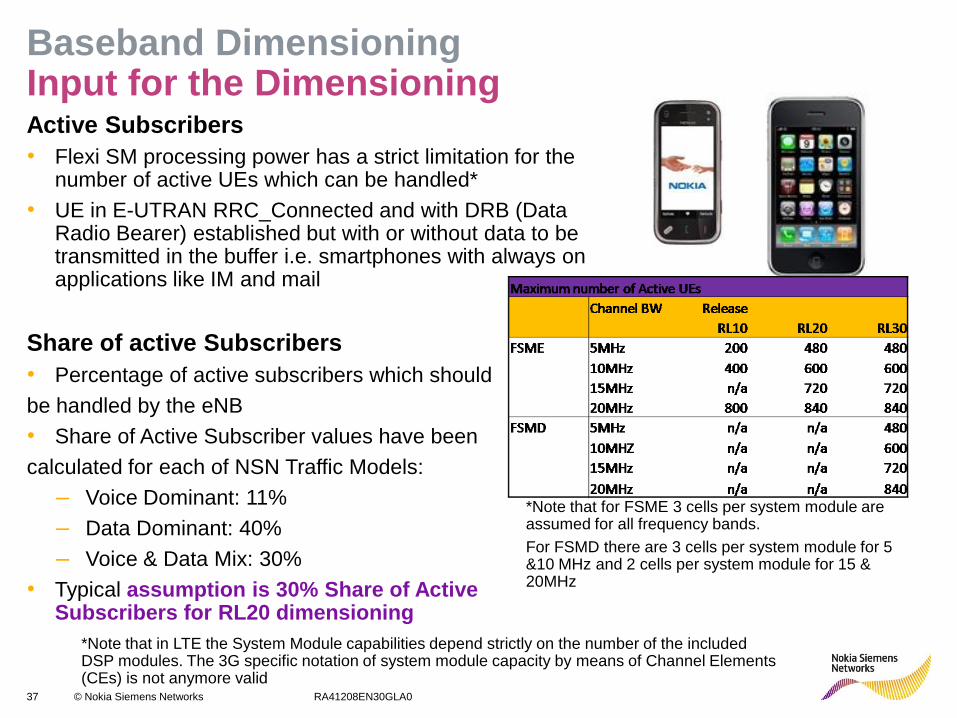
Active Subscribers
• Flexi SM processing power has a strict limitation for the number of active UEs which can be handled*
• UE in E-UTRAN RRC_Connected and with DRB (Data Radio Bearer) established but with or without data to be transmitted in the buffer i.e. smartphones with always on applications like IM and mail
Share of active Subscribers
• Percentage of active subscribers which should
be handled by the eNB
• Share of Active Subscriber values have been
calculated for each of NSN Traffic Models:
– Voice Dominant: 11%
– Data Dominant: 40%
– Voice & Data Mix: 30%
• Typical assumption is 30% Share of Active Subscribers for RL20 dimensioning
Baseband Dimensioning Input for the Dimensioning
*Note that in LTE the System Module capabilities depend strictly on the number of the included DSP modules. The 3G specific notation of system module capacity by means of Channel Elements (CEs) is not anymore valid
*Note that for FSME 3 cells per system module are assumed for all frequency bands.
For FSMD there are 3 cells per system module for 5 &10 MHz and 2 cells per system module for 15 & 20MHz
38 © Nokia Siemens Networks RA41208EN30GLA0
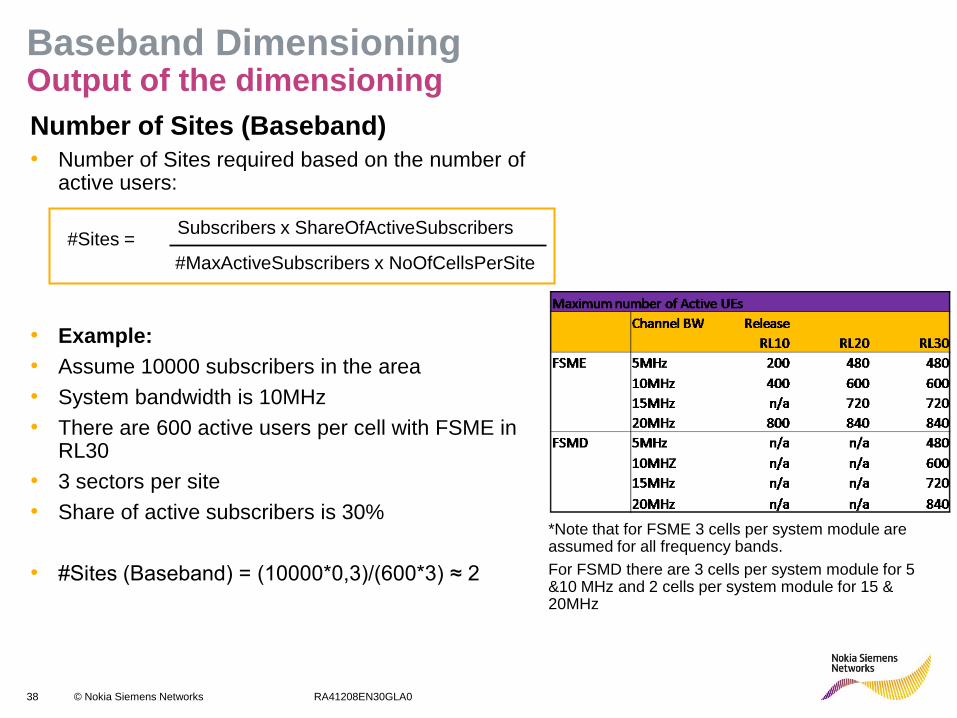
Baseband Dimensioning Output of the dimensioning
Number of Sites (Baseband)
• Number of Sites required based on the number of active users:
• Example:
• Assume 10000 subscribers in the area
• System bandwidth is 10MHz
• There are 600 active users per cell with FSME in RL30
• 3 sectors per site
• Share of active subscribers is 30%
• #Sites (Baseband) = (10000*0,3)/(600*3) ≈ 2
Subscribers x ShareOfActiveSubscribers #Sites =
#MaxActiveSubscribers x NoOfCellsPerSite
*Note that for FSME 3 cells per system module are assumed for all frequency bands.
For FSMD there are 3 cells per system module for 5 &10 MHz and 2 cells per system module for 15 & 20MHz