Embed Size (px)
Citation preview
7/26/2019 075 Simulation of Grinding Circuit at Silver Plant, Turkey
http://slidepdf.com/reader/full/075-simulation-of-grinding-circuit-at-silver-plant-turkey 1/7
Simulation of grinding circuit
at
G j m j ~ k 6 y
silver plant, Turkey
S.
Ersaym
B.
Sonmez $.
L.
ErgOn,
B.
Aksanl and I.
F.
Erkal
Synopsis
Since
start-up
the comminution circuit
at
Etibank's
i i m i i ~ o y
silver plant, Kiitahya, Turkey,
has
experienced
severe problems ansmg from the
unexpected
amount and moisture content of clays
n
the
feed.
Three
alternatives were
proposed in an
attempt to solve the
problem: first,
replacement of the
existing crushing circuit by tooth roll-type crushers;
second, the use of washing drums;
and,
third, the
introduction of primary
autogenous/semi-autogenous
milling
in
place
of
crushing.
The effects of
the first two
alternatives
on the
capacity
of
the
grinding circuit
were
investigated through computer
simulations.
A
series of laboratory
and
industrial-scale
ball-mill
batch grinding tests was conducted. The
parameters
of
a
cumulative-based
kinetic model were determined.
The
ball-mill circuit was sampled and
operating
model
parameters
were calculated. The
ability
of
batch
grinding
parameters to represent the operating.
conditions was
then
examined.
.
Laboratory
tests failed
to
provide acceptable
model
parameters.
However,
parameters
that were obtained
in
work with an industrial-size batch mill were found to
be suitable for
simulation
studies. The simulations
indicated that a
continuous feed
of
-12
rom provided
by tooth-roll crushers
would
maintain the desired
capacity. Increasing the
feed
size to -25 rom
would
cause
a
reduction
in
capacity of 8-15 .
The
use of
washing
drums
in
the
existing
crushing circuit
could
also solve the capacity problem,
but
small fluctuations
in
water flow
rates might
result
in problems
of excess
water in the grinding circuit.
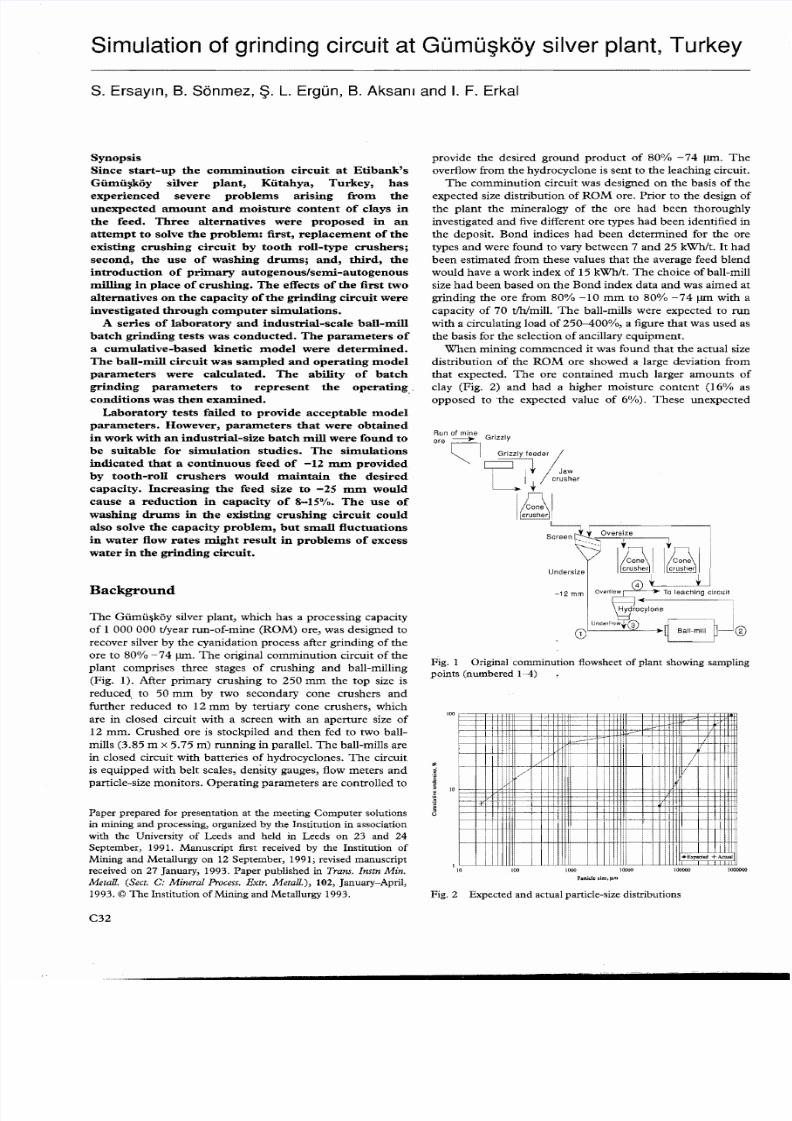
ackground
The
G i i m i i ~ k O y silver plant, which has a processing capacity
of 1 000 000
t/year run-of-mine (ROM) ore, was designed to
recover silver by
the
cyanidation process after grinding
of the
ore
to
80
-74
1ffi.
The
original comminution circuit
of the
plant comprises three stages of crushing
and
ball-milling
(Fig. 1). After primary crushing to 250 mm the top size is
reduced, to 50 mm by two secondary cone crushers and
further reduced to 12
mm
by tertiary cone crushers, which
are in closed circuit with a screen with an aperture size
of
12
mm. Crushed
ore
is
stockpiled
and then
fed
to
two ball
mills (3.85 m x 5.75 m) running
in
parallel.
The
ball-mills are
in closed circuit with batteries
of
hydrocyclones.
The
circuit
is equipped with belt scales, density gauges, flow meters
and
particle-size monitors. Operating parameters are controlled to
Paper
prepared for presentation
at
the meeting Computer solutions
in mining
and
processing, organized
by
the Institution
in
association
with the
University
of
Leeds
and
held in Leeds
on
23
and
24
September, 1991. Manuscript first received
by
the Institution
of
Mining
and
Metallurgy
on
12 September, 1991; revised manuscript
received
on
27 January, 1993.
Paper
published in
Trans. Instn Min.
Metall.
Sect. C:
Mineral Process. Extr. Metall. ,
102, January-April,
1993.
©
The
Institution of Mining and Metallurgy 1993.
provide the desired
ground product
of
80
-74
1ffi. The
overflow from
the
hydrocyclone is sent
to the
leaching circuit.
The
comminution circuit was designed on the basis
of
the
expected size distribut ion
of ROM
ore. Prior to the design
of
the plant the mineralogy of the ore
had
been thoroughly
investigated and five different ore types
had
been identified in
the
deposit.
Bond
indices
had
been determined for
the
ore
types
and
were found to vary between 7
and
25 kWh/to
It had
been
estimated from these values
that the
average feed
blend
would have a work index
of
15 kWh/to
The
choice
of
ball-mill
size
had
been based on the Bond index data
and
Was aimed at
grinding the ore from 80
-10 mm
to 80 -74 1ffi with a
capacity
of
70 tIhImilL
The
ball-mills were expected to run
with a circulating load
of 250-400 ,
a figure
that
was
used
as
the basis for the selection
of
ancillary equipment.
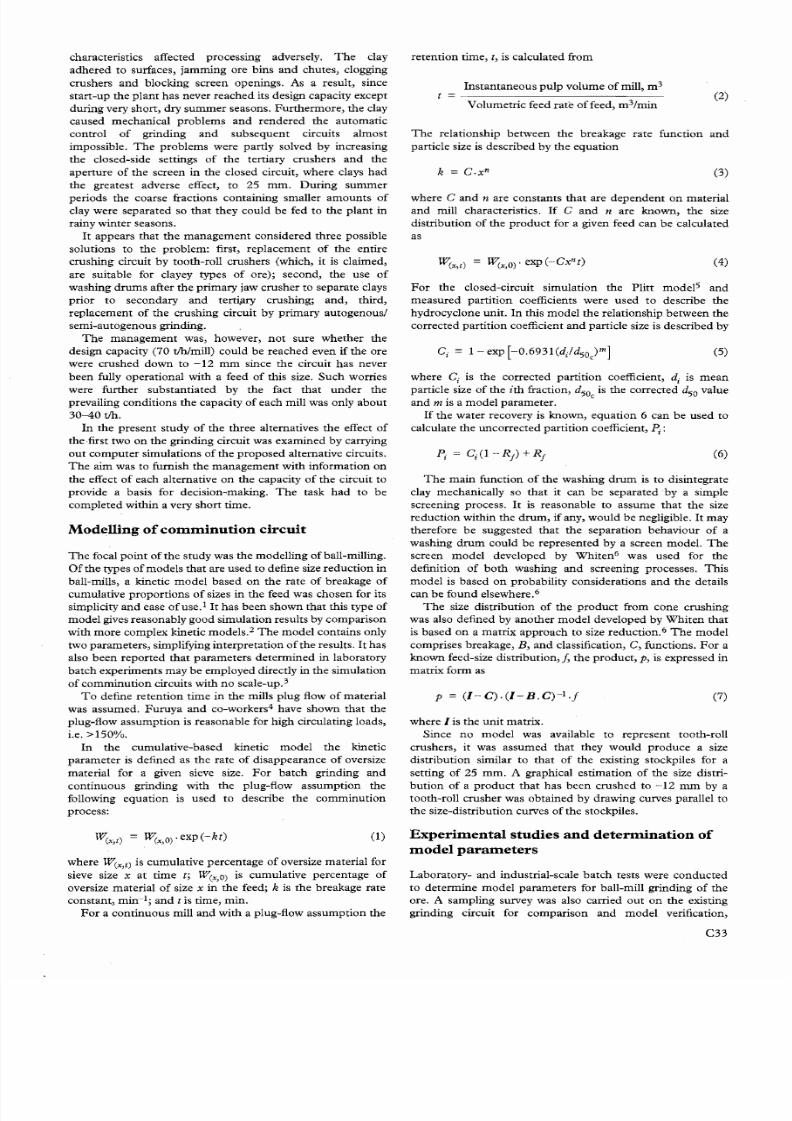
When
mining
commenced t
was found
that the
actual size
distribution
of
the
ROM
ore showed a large deviation from
that expected. The ore contained
much
larger amounts
of
clay (Fig. 2) and
had
a higher moisture content (16 as
opposed to ·the expected value of 6%). These unexpected
Run of mine
ore - -»
Grizzly
~ _ ~
Screen Oversi ze _,
:
I'
lt £i
one Cone
Undersize I c r ~ e r
L G r : : ~ : r i J
-12 mm I O v e r l l o w ~ To leaching circuit
~ l o Y l o n e m
~ I
.
Underpow+®
Fig. 1 Original comminut ion fiowsheet
of plant
showing sampling
points (numbered
14
lO°mlfmrmgmmng
Ii
t
]
100 1000
Particlcslze. un
Fig. 2 Expected
and
actual particle-size distributions
C32
7/26/2019 075 Simulation of Grinding Circuit at Silver Plant, Turkey
http://slidepdf.com/reader/full/075-simulation-of-grinding-circuit-at-silver-plant-turkey 2/7
characteristics affected processing adversely. The clay
adhered to surfaces, jamming ore bins and chutes, clogging
crushers and blocking screen openings. s a result, since
start-up the plant has never reached its design capacity except
during very short, dry summer seasons. Furthennore, the clay
caused mechanical problems
and
rendered
the
automatic
control
of
grinding
and
subsequent circuits almost
impossible.
The
problems were partly solved by increasing
the closed-side settings of the tertiary crushers and the
aperture
of
the
screen in
the
closed circuit, where clays
had
the greatest adverse effect, to 25 mm. During summer
periods the coarse fractions containing smaller amounts of
clay were separated so that they could be fed
to
the plant in
rainy winter seasons.
It
appears that the management considered three possible
solutions to the problem: first, replacement
of
the entire
crushing circuit by tooth-roll crushers (which, it is claimed,
are suitable for clayey types
of
ore); second, the use
of
washing drums after the primary jaw crusher to separate clays
prior to secondary and tertijIry crushing; and, third,
replacement of the crushing circuit by primary autogenous
semi-autogenous grinding.
The
management was, however,
not
sure whether the
design capacity
70
tIhImill) could be reached even i f the ore
were crushed down to
-12 mm
since the circuit has never
been fully operational with a feed
of
this size. Such wotries
were further substantiated by the fact that
under
the
prevailing conditions the capacity
of
each mill was only about
30-40 tIh.
In the present study
of
the three alternatives the effect
of
the first two on the grinding circuit was examined by carrying
out
computer
simulations of the proposed alternative circuits.
The
aim was to furnish the management with information on
the effect
of
each alternative
on
the capacity
of
the circuit to
provide a basis for decision-making.
The
task
had to be
completed within a very short time.
Modelling
of comminution
circuit
The
focal
point of
the study was the modelling
of
ball-milling.
Of
the types
of
models
that
are used to define size reduction
in
ball-mills, a kinetic model based
on
the rate
of
breakage of
cumulative proportions of sizes in the feed was chosen for its
simplicity and ease of use. It has been shown that this type
of
model gives reasonably good simulation results by comparison
with more complex kinetic models.
2
The
model
contains only
two parameters, simplifYing interpretation of the results. t has
also
been
reported
that
parameters
detennined in
laboratory
batch experiments may
be
employed directly in the simulation
of
comminution
circuits with
no
scale-up.
3
To define retention time
in
the mills plug flow of material
was assumed. Furuya
and
co-workers
4
have shown that the
plug-flow assumption is reasonable for high circulating loads,
i.e. >150%.
In the cumulative-based kinetic model the kinetic
parameter
is
defined as the rate
of
disappearance of oversize
material for a given sieve size.
For
batch grinding and
continuous grinding with the plug-flow assumption the
following equation is used to describe the comminution
process:
W(x,t) =
W(x,O)
exp(-kt)
1)
where
W(x,t)
is
cumulative percentage
of
oversize material for
sieve size
x
at
time
t W(x, 0) is
cumulative percentage
of
oversize material
of
size
x
in the feed; k
is
the breakage rate
constant, min-I; and t
is
time, min.
For
a continuous mill and with a plug-flow assumption the
retention time, t is calculated from
Instantaneous pulp volume of mill, m
3
=
(2)
Volumetric feed
rate
offeed, m
3
/min
The
relationship between the breakage rate function
and
particle size
is
described
by
the equation
3)
where C and
n
are constants
that
are dependent on material
and mill characteristics. f C
and n
are known, the size
distribution of the product for a given feed can
be
calculated
as
4)
W(x,t)
For
the closed-circuit simulation the Plitt modelS and
measured partition coefficients were used to describe the
hydrocyclone unit.
In
this model the relationship between the
corrected part ition coefficient and particle size is described by
5)
where C
is
the corrected partition coefficient, d
j
is
mean
particle size
of
the
ith
fraction,
d
s
is
the corrected
d
s
value
. c
and
m
IS a model parameter.
If
the water recovery
is
known, equation 6 can be used to
calculate the uncorrected partition coefficient, P;:
(6)
The
main function
of
the washing
drum is to
disintegrate
clay mechanically
so that
it can be separated by a simple
screening process. t
is
reasonable to assume that the size
reduction within the
drum,
if
any, would
be
negligible.
t
may
therefore be suggested that the separation behaviour of a
washing drum could be represented by a screen model. The
screen
model
developed by Whiten
6
was used for the
definition
of both
washing
and
screening processes.
This
model is based
on
probability considerations
and
the details
can be found elsewhere.
6
The size distribution of the product from cone crushing
was also defined by another model developed by Whiten that
is based
on
a matrix approach to size reduction.
6
The
model
comprises breakage, B and classification, C, functions.
For
a
known feed-size distribution,
j
the
product,
p is
expressed
in
matrix form as
p
=
l -C) . l -B .C) - I . j
(7)
where I is the
unit
matrix.
Since no
model
was available to represent tooth-roll
crushers, it was assumed that they would produce a size
distribution similar to
that of
the existing stockpiles for a
setting
of
25 mm. A graphical estimation
of
the size distri
bution
of
a product that has been crushed to --12
mm
by a
tooth-roll crusher was obtained by drawing curves parallel to
the size-distribution curves of the stockpiles.
xperimental studies and determination
of
model
parameters
Laboratory- and industrial-scale
batch
tests were conducted
to
determine model parameters for ball-mill grinding
of
the
ore. A sampling survey was also catried out
on
the existing
grinding circuit for comparison and model verification,
C33
7/26/2019 075 Simulation of Grinding Circuit at Silver Plant, Turkey
http://slidepdf.com/reader/full/075-simulation-of-grinding-circuit-at-silver-plant-turkey 3/7
although the
mill was
not
running to design specifications
during the
sampling period.
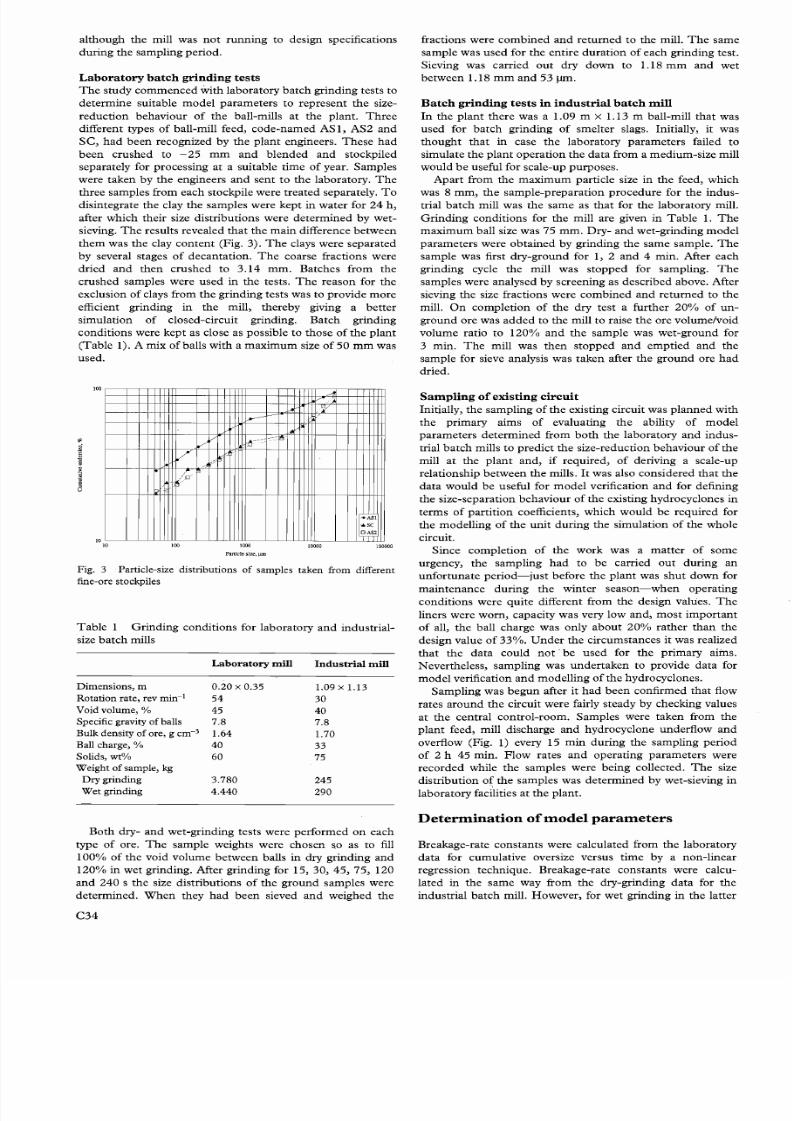
Laboratory
batch grinding tests
The study commenced with laboratory batch grinding tests to
determine suitable model parameters to represent
the
size
reduction behaviour of the ball-mills
at
the plant. Three
different types of ball-mill feed, code-named ASl, AS2 and
SC, had been
recognized by the plant engineers. These
had
been
crushed
to
-25
mm and
blended
and stockpiled
separately for processing
at
a suitable time
of
year. Samples
were taken by
the
engineers and sent to
the
laboratory.
The
three samples from each stockpile were treated separately. To
disintegrate the clay the samples were
kept
in
water
for
24
h,
after which their size distributions were determined by wet
sieving. The results revealed
that
the main difference
between
them
was
the
clay
content
(Fig. 3). The clays were separated
by
several stages of decantation. The coarse fractions were
dried and
then
crushed to 3.14
mm.
Batches from the
crushed samples were used in the tests.
The
reason for the
exclusion of clays from
the
grinding tests was to provide more
efficient grinding in the mill, thereby giving a better
simulation of closed-circuit grinding.
Batch
grinding
conditions were
kept
as close as possible to those of
the plant
(Table 1). A mix
of
balls with a
maximum
size
of
50
mm
was
used.
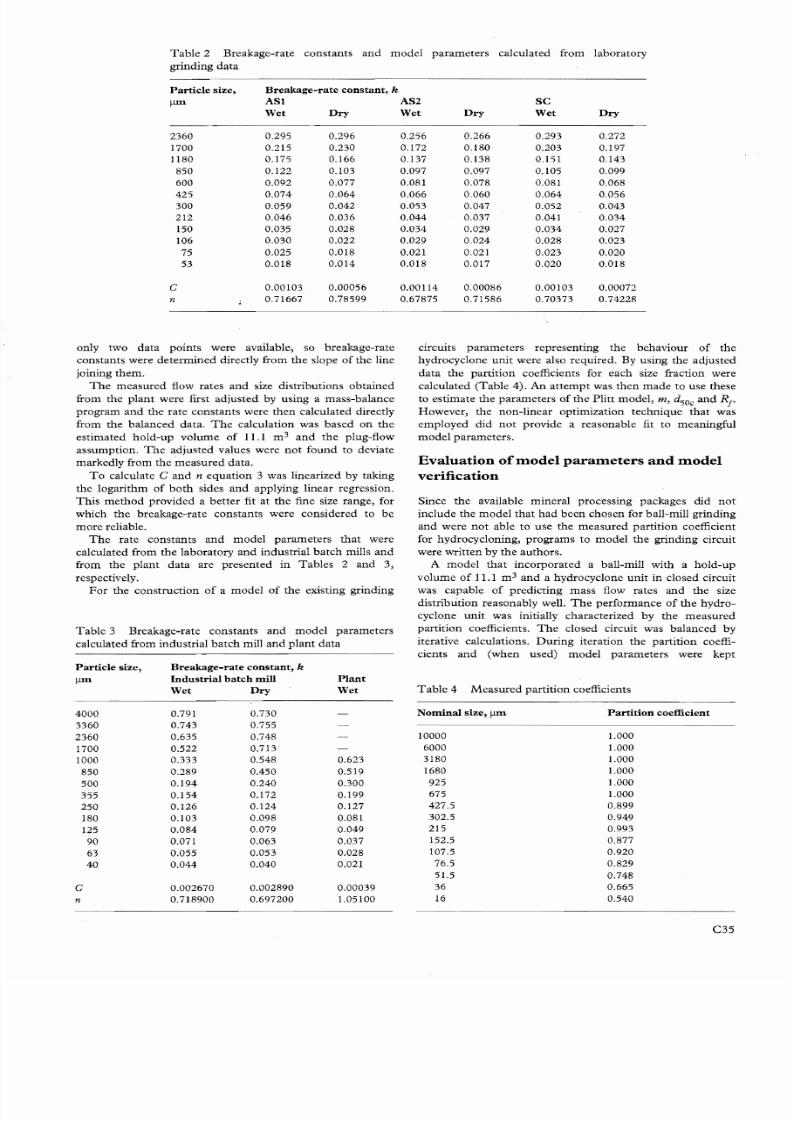
100
0
c
-
0
10
10 100
Y
-
+ASI
sc
Sampling of existing circuit
Initially, the sampling of
the
existing circuit was planned with
the primary aims of evaluating the ability of model
parameters determined
from
both the
laboratory
and indus
trial batch mills to
predict the
size-reduction
behaviour
of
the
mill
at the plant and, if
required, of deriving a scale-up
relationship
between the
mills.
t
was also considered
that the
data would be useful for model verification and for defining
the size-separation behaviour of the existing hydro cyclones in
terms
of
partition
coefficients, which
would be required
for
the modelling of the unit during the simulation of the whole
circuit.
1000
10000
100000
Paniciesize,
11m
Fig. 3 Particle-size distributions of samples taken from different
fine-ore stockpiles
Table
1
Grinding
conditions for laboratory
and
industrial
size batch mills
Laboratory mill
Industrial
mill
Dimensions,
m
0.20
x
0.35 1.09
x
1.13
Rotation rate, rev min-
54
30
Void volume,
45
40
Specific gravity of balls
7.8
7.8
Bulk density of ore, g
cm-
3
1.64
1.70
Ball charge,
40
33
Solids, wt%
60
75
Weight of sample, kg
Dry grinding
3.780
245
Wet
grinding
4.440
290
Both
dry-
and
wet-grinding tests were
performed on each
type
of
ore.
The
sample weights were chosen
SO
as to fill
100%
of the
void volume
between
balls
in
dry grinding
and
120%
in
wet grinding. After grinding for 15, 30,
45,
75, 120
and
240
s
the
size distributions of
the
ground samples were
determined. When
they
had
been sieved
and
weighed
the
fractions were combined
and
returned to the mill. The
same
sample was used for the entire duration of
each
grinding test.
Sieving was carried
out
dry down to 1.18 mm and wet
between
1.18 mm and 53
run
atch grinding tests in industrial batch
mill
n the plant there was a 1.09 m x 1.13 m ball-mill that was
used
for batch grinding of smelter slags. Initially, it was
thought
that in
case the laboratory parameters failed to
simulate
the
plant operation
the data
from a medium-size mill
would be
useful for scale-up purposes.
Apart from the maximum particle size in the feed, which
was 8
mm, the
sample-preparation procedure for the indus
trial batch mill was the
same
as that for the laboratory mill.
Grinding conditions for the mill are given in Table 1. The
maximum ball size was 75
mm. Dry-
and wet-grinding model
parameters
were
obtained
by grinding
the same
sample. The
sample was first
dry-ground
for 1, 2 and 4 min. After
each
grinding cycle
the
mill was
stopped
for sampling. The
samples were analysed by screening as described above. After
sieving the size fractions were combined
and
returned to
the
mill. On completion of the dry test a further 20% of
un
ground ore was
added
to the mill to raise
the
ore volume/void
volume ratio to
120% and the sample
was
wet-ground
for
3 min.
The
mill was
then
stopped
and
emptied and the
sample for sieve analysis was
taken
after
the
ground ore
had
dried.
Since
completion
of the
work
was a
matter
of
some
urgency,
the
sampling
had
to be carried
out during
an
unfortunate
period-just before
the plant
was
shut down
for
maintenance during the
winter
season-when
operating
conditions were
quite
different from
the
design values. The
liners were
worn,
capacity was very low
and,
most
important
of all, the ball charge was only about
20%
rather than the
design value
of
33%. Under the circumstances it was realized
that the
data could not' be used for the primary aiins.
Nevertheless, sampling was undertaken to provide data for
model
verification
and
modelling of
the hydro
cyclones.
Sampling
was
begun
after it
had
been
confirmed
that
flow
rates around
the
circuit were fairly steady by checking values
at the
central control-room. Samples were
taken
from
the
plant feed, mill discharge and hydrocyclone underflow and
overflow (Fig. 1) every 15 min during the sampling period
of 2 h 45 min. Flow rates and operating parameters were
recorded
while the samples were being collected. The size
distribution of
the
samples was
determined
by wet-sieving
in
labora tory facilities
at the
plant.
Detennination of model parameters
Breakage-rate constants were calculated from the laboratory
data
for cumulative oversize versus
time
by a
non-linear
regression technique. Breakage-rate constants were calcu
lated
in
the same
way from
the
dry-grinding
data
for
the
industrial batch mill. However, for wet grinding in
the
latter
C34
7/26/2019 075 Simulation of Grinding Circuit at Silver Plant, Turkey
http://slidepdf.com/reader/full/075-simulation-of-grinding-circuit-at-silver-plant-turkey 4/7
Table 2
Breakage-rate constants
and
model
parameters calculated from laboratory
grinding data
Particle size
r e a k a g e ~ r a t e
constant
k
J UTl
ASl AS2 SC
Wet
Dry
Wet
Dry
Wet
Dry
2360
0.295
0.296
1700
0.215 0.230
1180
0.175 0.166
850
0.122
0.103
600
0.092 0.077
425
0.074
0.064
300
0.059 0.042
212
0.046 0.036
150 0.035 0.028
106
0.030 0.022
75
0.025
0.018
53
0.Ql8
0.014
C
0.00103 0.00056
n
0.71667 0.78599
only two data points were available, so breakage-rate
constants were determined directly from
the
slope
of
the line
joining them.
The measured flow rates and size distributions obtained
from the plant were first adjusted by using a mass-balance
program and the rate constants were then calculated directly
from
the
balanced data.
The
calculation was
based on the
m
3
estimated hold-up volume
of
11.1
and the
plug-flow
assumption.
The
adjusted values were
not
found to deviate
markedly from the measured data.
To
calculate C
and n
equation 3 was linearized by taking
the logarithm
of both
sides and applying linear regression.
This method provided a better fit at the fine size range, for
which
the
breakage-rate constants were considered to
be
more reliable.
The
rate constants
and
model parameters
that
were
calculated from the laboratory
and
industrial batch mills
and
from the plant data are presented
in
Tables 2 and 3,
respectively.
For
the construction of a model
of
the existing grinding
Table 3 r e a k a g e ~ r a t e constants and model parameters
calculated from industrial batch mill
and
plant data
Particle size
r e a k a g e ~ r a t e constant k
J UTl
Industrial batch mil l
Plant
Wet Dry Wet
4000
0.791
0.730
0.256 0.266 0.293 0.272
0.172
0.180 0.203
0.197
0.137 0.138 0.151
0.143
0.097 0.097 0.105 0.099
0.081 0.078 0.081 0.068
0.066 0.060
0.064
0.056
0.053
0.047
0.052
0.043
0.044
0.037 0.041
0.034
0.034 0.029
0.034
0.027
0.029 0.024 0.028
0.023
0.021 0.021 0.023
0.020
0.018 0.017 0.020 0.018
0.00114 0.00086 0.00103
0.00072
0.67875 0.71586 0.70373 0.74228
circuits parameters representing the behaviour
of
the
hydrocyclone unit were also required. By using the adjusted
data the partition coefficients for each size fraction were
calculated (Table 4). n attempt was then made
to
use these
to estimate the parameters
of
the Plitt model, m d 5 ~
and
R
f
However, the non-linear optimization technique that was
employed did
not
provide a reasonable fit
to
meaningful
model parameters.
Evaluation
of
model parameters and model
verification
Since the available mineral processing packages did
not
include the model
that had been
chosen for ball-mill grinding
and
were
not
able
to
use the measured partition coefficient
for hydrocycloning, programs to model
the
grinding circuit
were written by the authors.
A model
that
incorporated a ball-mill with a hold-up
volume
of
11.1 m
3
and
a hydro cyclone unit in closed circuit
was capable
of
predicting mass flow rates and the size
distribution reasonably well. The performance of the hydro
cyclone unit was initially characterized by the measured
partition coefficients.
The
closed circuit was balanced by
iterative calculations.
During
iteration
the
partition coeffi
cients and (when used) model parameters were kept
Table
4 Measured partition coefficients
Nominal
size J UTl
Partition
coefficient
3360
2360
1700
1000
850
500
355
250
180
125
90
63
40
C
n
0.743
0.635
0.522
0.333
0.289
0.194
0.154
0.126
0.103
0.084
0.071
0.055
0.044
0.002670
0.718900
0.755
0.748
0.713
0.548
0.450
0.240
0.172
0.124
0.098
0.079
0.063
0.053
0.040
0.002890
0.697200
0.623
0.519
0.300
0.199
0.127
0.081
0.049
0.037
0.028
0.021
0.00039
1.05100
10000 1.000
6000 1.000
3180
1.000
1680
1.000
925 1.000
675 1.000
427.5 0.899
302.5
0.949
215 0.993
152.5 0.877
107.5
0.920
76.5
0.829
51.5
0.748
36
0.665
16
0.540
C35
7/26/2019 075 Simulation of Grinding Circuit at Silver Plant, Turkey
http://slidepdf.com/reader/full/075-simulation-of-grinding-circuit-at-silver-plant-turkey 5/7
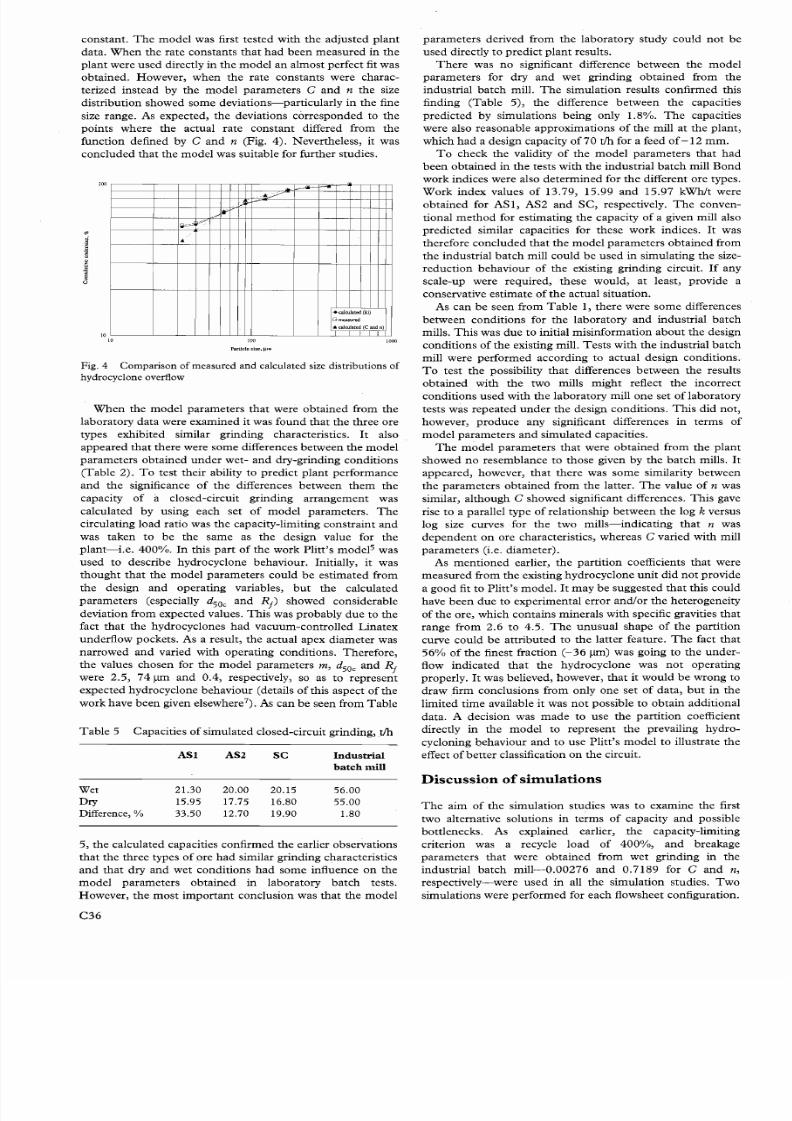
constant. The
model
was first
tested
with
the adjusted plant
data.
When
the rate constants
that had been measured in the
plant
were
used
directly
in the model an
almost per fect fit was
obtained. However, when the rate constants were charac
terized instead by the model parameters C
and
n the size
distribution showed
some deviations-particularly in
the fine
size range. As expected, the deviations
corresponded
to the
points where
the
actual rate
constant
differed
from the
function defined by C
and
n (Fig. 4). Nevertheless, it was
concluded that the model
was suitable for further studies.
100
I
3
6
G
10
10
100
1000
V
,/
I*-
I
I ~ ' , l , ( ~ )
GmeasurW
A calculated C andn)
Panicle
size,
11m
Fig. 4 Comparison of measured and calculated size distributions of
hydrocycione overflow
When the model parameters
that were
obtained
from
the
laboratory
data
were
examined
it was
found
that
the
three ore
types exhibited similar grinding characteristics.
It
also
appeared that there were some differences between the model
parameters obtained under wet- and dry-grinding conditions
(Table 2). To test their ability to predict plant performance
and the
significance of
the
differences
between them
the
capacity of
it
closed-circuit grinding
arrangement
was
calculated
by using each
set
of
model
parameters.
The
circulating load ratio was
the
capacity-limiting constraint and
was
taken
to be
the same
as
the
design value for
the
plant-i.e.
400%. In this part of the work Plitt's models was
used to describe hydrocyclone behaviour. Initially, it was
thought
that
the model parameters
could
be estimated from
the
design and operating variables, but the calculated
parameters (especially d
soc
and R
f
showed considerable
deviation from expected values. This was probably due to the
fact
that
the hydrocyclones
had vacuum-controlled Linatex
underflow pockets. As a result,
the
actual apex
diameter
was
narrowed and
varied with operating conditions.
Therefore,
the
values chosen for
the model parameters m
d
soc
and
R
f
were 2.5, 741JIIl
and
0.4, respectively, so as
to represent
expected hydrocyclone behaviour (details
of
this aspect
of
the
work have been given elsewhere
7
. As can be seen from
Table
Table
5 Capacities of simulated closed-circuit grinding,
tlh
AS AS2
SC Industrial
batch l i l l
Wet
21.30
20.00
20.15 56.00
Dry
15.95 17.75
16.80 55.00
Difference, % 33.50 12.70 19.90
1.80
5, the calculated capacities confirmed the earlier observations
that the three
types
of
ore
had
similar grinding characteristics
and
that dry and wet conditions
had some
influence
on
the
model parameters
obtained
in
laboratory batch tests.
However,
the
most
important
conclusion was that
the model
C36
parameters
derived from
the
laboratory
study could not
be
used
directly
to predict plant
results.
There
was
no
significant difference
between the model
parameters for dry and wet grinding obtained from the
industrial batch mill. The simulation results confirmed this
finding (Table 5), the difference
between the
capacities
predicted
by simulations being only 1.8 . The capacities
were also reasonable approximations
of the
mill
at the plant,
which
had
a design capacity
of 70 t/h
for a feed of
-12 mm.
To check the validity of the model parameters that had
been obtained in the tests with the industrial batch mill
Bond
work indices were also determined for
the
different
ore
types.
Work index values of 13.79, 15.99 and 15.97 kWhlt were
obtained
for AS1, AS2 and SC, respectively. The conven
tional
method
for estimating
the
capacity
of
a given mill also
predicted
similar capacities for these
work
indices.
It
was
therefore
concluded that the model parameters obtained
from
the industrial batch mill could be used in simulating the size
reduction
behaviour
of the existing grinding circuit.
If
any
scale-up were required, these would,
at
least, provide a
conservative estimate of
the
actual situation.
As
can
be seen
from Table
1,
there
were
some
differences
between
conditions for
the
laboratory and industrial batch
mills.
This
was
due to
initial misinformation
about the
design
conditions
of
the
existing mill.
Tests
with
the
industrial
batch
mill were performed according to actual design conditions.
To test the possibility that differences between the results
obtained with
the
two mills
might
reflect
the
incorrect
conditions used with
the
laboratory mill one set of laboratory
tests was
repeated under the
design conditions.
This did not,
however, produce any significant differences
in terms
of
model parameters and simulated
capacities.
The
model parameters that were obtained from the plant
showed no resemblance to those given by the batch mills. t
appeared, however,
that
there was some similarity between
the
parameters
obtained
from
the latter. The value of n was
similar, although C showed significant differences.
This
gave
rise
to
a parallel type
of
relationship
between the
log
k
versus
log size curves for
the
two
mills-indicating
that n was
dependent
on
ore characteristics, whereas C varied with mill
parameters
(i.e. diameter).
As mentioned earlier, the partition coefficients that were
measured from the existing
hydro
cyclone unit did not provide
a good fit to Plitt's model.
t may
be suggested
that
this could
have
been
due to experimental
error
and/or the heterogeneity
of
the ore, which contains minerals with specific gravities
that
range
from 2.6
to 4.5. The unusual shape of
the partition
curve
could
be attributed to
the
latter feature. The fact
that
56%
of
the
finest fraction (-36 1JIIl) was going to
the
under
flow
indicated that the hydro
cyclone was
not
operating
properly.
t
was believed, however,
that
it
would be wrong
to
draw
firm conclusions from only
one
set
of
data,
but
in
the
limited time available it was not possible to obtain additional
data. A decision was
made
to use
the partition
coefficient
directly in the model to represent
the
prevailing hydro
cycloning behaviour and to use Plitt's model to illustrate
the
effect of better classification
on
the circuit.
iscussion of
simulations
The
aim of
the
simulation studies was to examine the first
two alternative solutions
in terms of
capacity
and
possible
bottlenecks. As explained earlier, .the capacity-limiting
criterion was a recycle load of 400%,
and
breakage
parameters that
were
obtained
from wet grinding
in
the
industrial
batch
mill-0.00276
and 0.7189
for C
and
n
respectively-were used in
all the simulation studies.
Two
simulations were
performed
for
each
flowsheet configuration.
7/26/2019 075 Simulation of Grinding Circuit at Silver Plant, Turkey
http://slidepdf.com/reader/full/075-simulation-of-grinding-circuit-at-silver-plant-turkey 6/7
One, which was referred
to
as existing conditions , involved
the use
of
the measured parti tion coefficient
and
a 64 solids
ratio
in
the milL
The
other simulation, referred to as design
conditions ,
used-as
its
name implies-a more
efficient
classification defined by Plitt s model with values for the
parameters m
d
50c
and
f
of
2.5, 74 lID
and
0.40,
respectively, and
75
solids in
the
milL
For both
existing and
design conditions the ball charge was assumed to
be 33 .
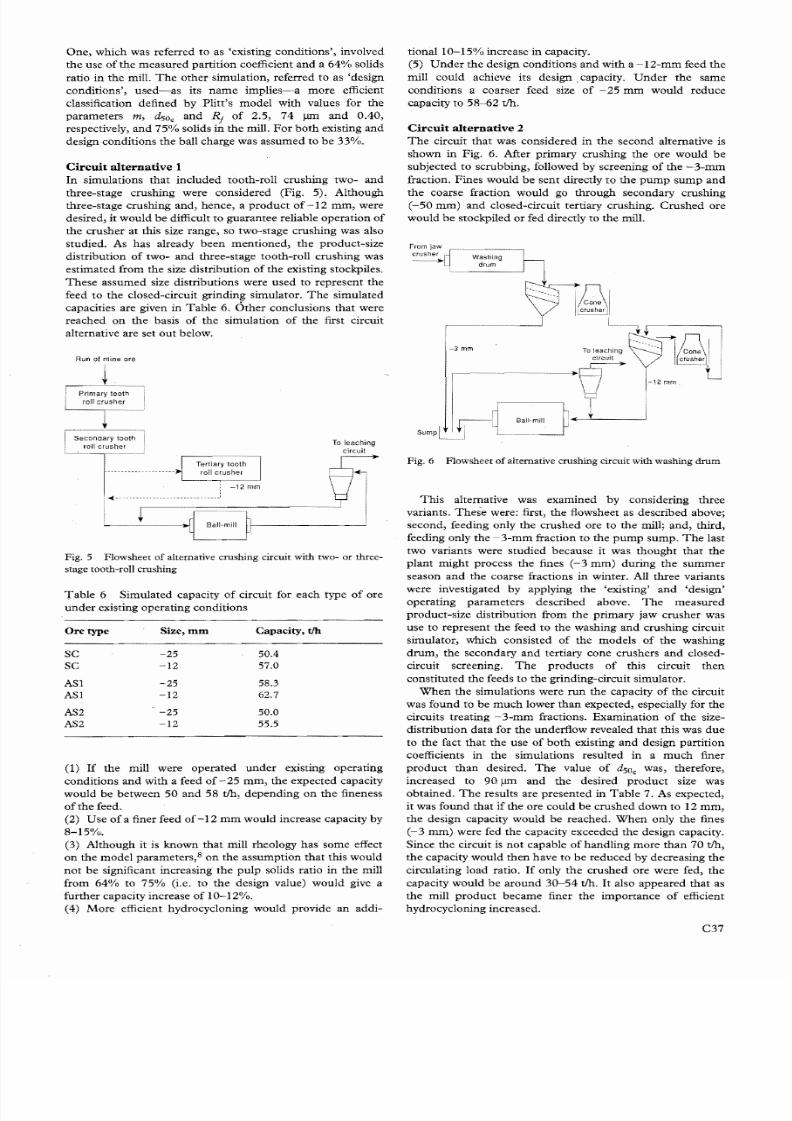
Circuit
alternative
1
In
simulations
that
included tooth-roll crushing two- and
three-stage crushing were considered (Fig. 5), Although
three-stage crushing and, hence, a product
of
-12
mm,
were
desired, it would be difficult to guarantee reliable operat ion
of
the crusher at this size range, so two-stage crushing was also
studied. As has already been mentioned,
the
product-size
distribution
of
two- and three-stage tooth-roll crushing was
estimated from the size distribution
of
the existing stockpiles.
These assumed size distributions were used to represent the
feed to the closed-circuit grinding simulator. The simulated
capacities are given
in
Table 6. Other conclusions that were
reached
on
the basis
of
the simulation
of
the first circuit
alternative are set
out
below.
Run of mine ore
o
leaching
Fig. 5 Flowsheet of alternative crushing circuit with two- or three
stage tooth-roll
crushing
Table
6 Simulated capacity
of
circuit for each type
of
ore
under
existing operating conditions
Ore type
Size, mm
Capacity,
t h
SC
SC
-25
-12
50.4
57.0
AS1
ASl
-25
-12
58.3
62.7
AS2
AS2
-25
-12
50.0
55.5
1) If
the mill were operated
under
eXlstmg operating
conditions and with a feed
of
-25
mm,
the expected capacity
would be between 50
and
58
tIh,
depending
on the
fineness
ofthe
feed.
(2) Use of a finer feed
of
-12
mm
would increase capacity by
8-15 .
(3) Although it is known that mill rheology has some effect
on
the model parameters,
8
on
the assumption
that
this would
not
be significant increasing the pulp solids ratio in the mill
from
64
to
75
(i.e. to
the
design value) would give a
further capacity increase
of 10-12 .
(4)
More
efficient hydrocyc1oning would provide
an
addi
tionaI1O-15
increase in capacity.
(5)
Under
the design conditions and with a -12-mm feed the
mill could achieve its
design,
capacity.
Under the
same
conditions a coarser feed size
of -25
mm
would reduce
capacity
to 58-62 tIh.
Circuit alternative
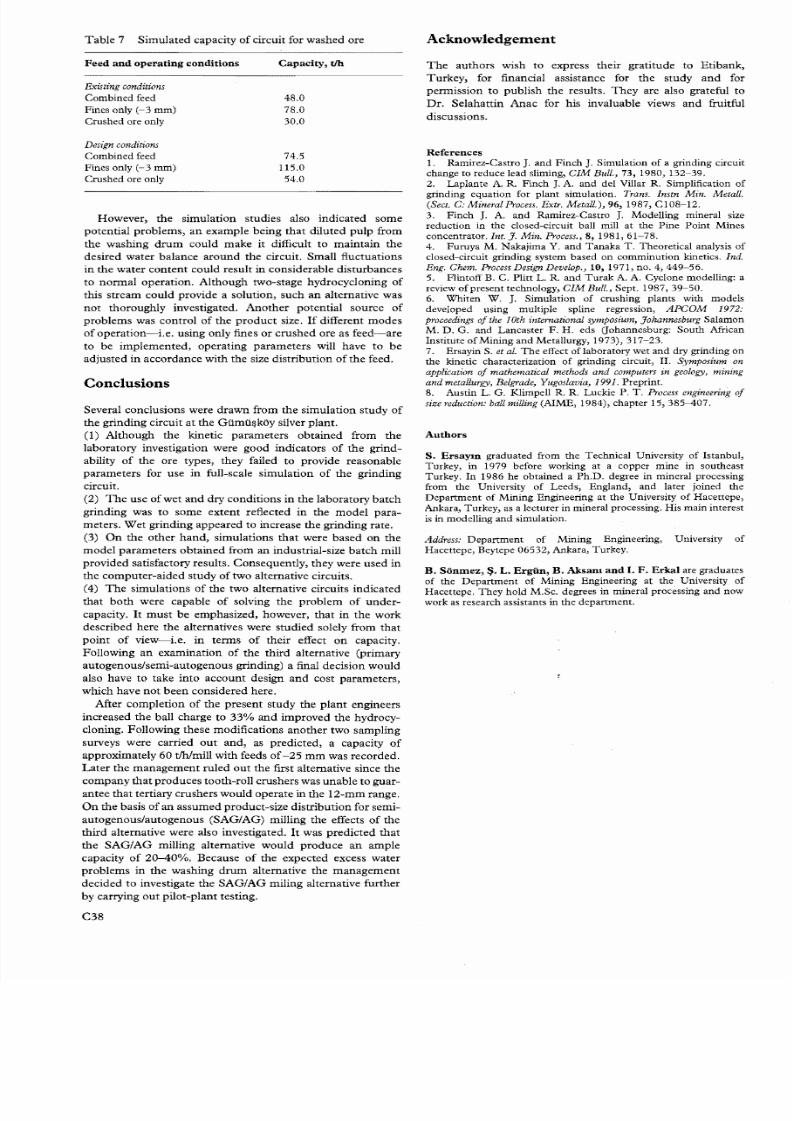
2
The
circuit
that
was considered
in
the second alternative is
shown in Fig, 6. After primary crushing the ore would be
subjected
to
scrubbing, followed
by
screening
of
the
-3-mm
fraction. Fines would
be
sent directly
to the pump sump and
the
coarse fraction would go through secondary crushing
(-50
mm) and closed-circuit tertiary crushing. Crushed ore
would
be
stockpiled
or
fed directly to the mill.
Fig. 6 Flowsheet
of
alternative crushing circuit with washing drum
This
alternative was examined by considering three
variants.
h e s ~ e
were: first, the fiowsheet as described above;
second, feeding only the crushed ore to the mill; and, third,
feeding only the
-3-mm
fraction to the
pump
sump.
The
last
two variants were studied because it was thought
that
the
plant might process the fines
(-3 mm)
during the
summer
season
and
the coarse fractions in winter. All three variants
were investigated by applying the existing and design
operating parameters described above.
The
measured
product-size distribution from
the
primary jaw crusher was
use to represent the feed to the washing and crushing circuit
simulator, which consisted
of
the models
of
the washing
drum,
the secondary
and
tertiary cone crushers
and
c1osed
circuit screening.
The
products
of
this circuit
then
constitu ted the feeds to the grinding-circuit simulator.
When
the simulations were
run
the capacity
of
the circuit
was found to
be much
lower
than
expected, especially for the
circuits treating - 3-mm fractions. Examination
of
the size
distribution data for the underflow revealed that this was due
to the fact that the use
of both
existing
and
design partition
coefficients in the simulations resulted in a
much
finer
product than desired. The value
of
d
soc
was, therefore,
increased to
90 lID
and the desired product size was
obtained.
The
results are presented in
Table
7. As expected,
it
was found
that if
the ore could be crushed
down
to 12
mm,
the design capacity would be reached. When only the fines
(-3
mm)
were fed the capacity exceeded the design capacity.
Since the circuit is
not
capable
of
handling more
than
70
tIh,
the
capacity would
then
have to
be
reduced
by
decreasing
the
circulating load ratio.
f
only the crushed ore wcre fed, the
capacity would
be
around
30-54 tIh. It
also appeared that as
the mill
product
became finer the importance
of
efficient
hydrocyc1oning increased.
C37
7/26/2019 075 Simulation of Grinding Circuit at Silver Plant, Turkey
http://slidepdf.com/reader/full/075-simulation-of-grinding-circuit-at-silver-plant-turkey 7/7
Table
7 Simulated capacity
of
circuit for washed ore
Feed
and
operating conditions Capacity, tJh
Exist ing conditions
Combined
feed 48.0
Fines only (-3
mm) 78.0
Crushed ore only 30.0
Design conditions
Combined feed 74.5
Fines only
(-3
mm)
115.0
Crushed
ore only
54.0
However, the simulation studies also indicated some
potential problems,
an
example being that diluted pulp from
the washing
drum
couId make it difficult to maintain the
desired water balance around the circuit. Small fluctuations
in the water content could result in considerable disturbances
to
normal operation. Although two-stage hydrocydoning
of
this stream could provide a solution, such an alternative was
not thoroughly investigated. Another potential source
of
problems was control
of
the
product
size.
If
different modes
of operation-Leo
using only fines
or
crushed ore as
feed-are
to
be implemented, operating parameters will have
to be
adjusted
in
accordance with the size distribution
of
the feed.
Conclusions
Several conclusions were drawn from the simulation study
of
the grinding circuit
at
the
G i i m i i ~ k o y
silver plant.
1)
Although the kinetic parameters obtained from the
laboratory investigation were good indicators
of
the grind
ability
of
the ore types, they failed to provide reasonable
parameters for use in full-scale simulation
of
the grinding
circuit.
2) The use of wet and dry conditions in the laboratory batch
grinding was
to
some extent reflected in the
model
para
meters.
Wet
grinding appeared
to
increase the grinding rate.
3)
On the other hand,
simulations
that
were based
on the
model parameters obtained from
an
industrial-size
batch
mill
provided satisfactory results. Consequently, they were used
in
the computer-aided study
of
two alternative circuits.
(4)
The
simulations
of
the two alternative circuits indicated
that both were capable
of
solving the problem
of
under
capacity.
t
must
be emphasized, however, that in the work
described here the alternatives were studied solely from
that
point
of
view-i.e. in
terms
of
their effect
on
capacity.
Following
an
examination
of
the third alternative primary
autogenous/semi-autogenous grinding) a final decision would
also have to take into account design
and
cost parameters,
which have
not been
considered here.
After completion
of
the present study the plant engineers
increased the ball charge to
33
and improved the hydrocy
cloning. Following these modifications another two sampling
surveys were carried
out
and, as predicted, a capacity
of
approximately 60 tIhImill with feeds
of -25 mm
was recorded.
Later the management
ruled
out
the first alternative since the
company
that
produces tooth-roll crushers was unable
to
guar
antee
that
tertiary crushers would operate in the
12-mm
range.
On the
basis
of
an
assumed product-size distribution for semi
autogenous/autogenous
SAG/AG)
milling the effects
of
the
third alternative were also investigated.
It
was predicted
that
the SAG/AG milling alternative would produce
an
ample
capacity
of
20-40 .
Because
of
the expected excess water
problems in the washing drum alternative the management
decided to investigate the SAG/AG miling alternative further
by carrying
out pilot-plant testing.
C38
cknowledgement
The
authors wish to express their gratitude to Etibank,
Turkey, for financial assistance for the study
and
for
permission
to
publish the results. They are also grateful to
Dr. Selahattin Anac for his invaluable views and fruitful
discussions.
References
1.
Ramirez-Castro
J and
Finch
J
Simulation
of
a grinding circuit
change to re duce lead sliming,
IM
Bull.,
73,
1980,132-39.
2.
Laplante A. R Finch
J A.
and
del Villar
R
Simplification
of
grinding equation for plant simulation. Trans. Instn Min. Metall.
Sect. C: Mineral Process Extr. Metall.), 96, 1987, C108-12.
3. Finch J A. and Ramirez-Castro J Modelling mineral size
reduction
in the closed-circuit ball mill
at
the
Pine
Point
Mines
concentrator. Int. J. Min. Process., 8,1981,61-78.
4.
Furuya
M. Nakajima
Y.
and Tanaka
T.
Theoretical analysis of
closed-circuit grinding system based
on comminution
kinetics. Ind.
Eng. Chem.
Process
Design Develop.,
10,1971, no. 4,449-56,
5. Flintoff B. C. Plitt L R
and Turak
A.
A.
Cyclone modelling: a
review
of present
technology, IM Bull., Sept. 1987,
39-50.
6.
Whiten W.
J Simulation of crushing plants with models
developed using multiple spline regression, APG01W
972:
proceedings of the 10th international symposium, Johannesburg
Salamon
M. D.
G.
and
Lancaster F. H.
eds Gohannesburg: South African
Institute
of
Mining and
Metallurgy, 1973),
317-23.
7. Ersayin S. et al.
The
effect of laboratory
wet and
dry grinding
on
the kinetic characterization of grinding circuit,
II.
Symposium on
appli<;ation
of
mathematical methods and computers in geology, mining
and
metallurgy, Belgrade, Yugoslavia, 1991. Preprint.
8. Austin L G. K1impell R R Luckie P. T.
Process engineering
of
size reduction: ball milling AIME, 1984),
chapter
15,385-407.
Authors
S. Ersaym
graduated from
the Technical University of Istanbul,
Turkey, in 1979 before working
at
a copper
mine
in southeast
Turkey.
In
1986 he obtained a
Ph.D.
degree in mineral processing
from the University of Leeds, England,
and
later joined the
Department of Mining
Engineering
at
the University of Hacettepe,
Ankara, Tur key, as a lecturer in mineral processing. His
main
interest
is
in modelling
and
simulation.
Address:
Department of Mining
Engineering, University of
Hacettepe,
Beytepe 06532, Ankara, Turkey.
B.
Sonmez,
L
Ergiin,
B. Aksam
and
I F.
Erkal
are graduates
of the
Department of Mining
Engineering
at
the University
of
Hacettepe.
They hold M.Sc.
degrees
in
mineral processing
and now
work as research assistants
in the department.