Embed Size (px)
Citation preview

Oecologia (2000) 125:389-399 ....; ,_ e _'_DOI 10.1007/s0044200(K)455 _::_ _ _
_" -.
A.J. Burton" K.S. Pregltz_r • R.L. Hendrick _ _
Relationshipsbetweenfine root dynamicsand nitrogen availabilityin Michigan northernhardwoodforests =
Received: 18March 1999 / Accepted: 5 May 2000 / Published online: 6 July 2000 _ o© Springer-Verlag 2000 _ _
0_
Abstract Minirhizotrons were used to observe fine root Key words Sugar maple • Root longevity • Root(<1 ram) production, mortality, and longevity over production. Root mortality. Carbon allocation2 years in four sugar-maple-dominated northern hard- _wood forests located along a latitudinal temperature gra-dient. The sites also differed in N availability, allowing Introductionus to assess the relative influences of soil temperature
and N availability in controlling fine root lifespans. Root Fine root turnover has a strong influence on below-production and mortality occurred throughout the year, ground allocation of C and nutrients in forest ecosystemswith most production occurring in the early portion of (Gholz et al. 1985; Nadelhoffer et al. 1985; Joslin and
,, the growing season (by rffi'd-July). Mortality was distrib- Henderson 1987; Arthur and Fahey 1992; Hendrick anduted much more evenly throughout the year. For surface Pregitzer 1993a). As such, there is a great deal of interestfine roots (0-10 cm deep), significant differences in root in understanding how soil environmental factors, such aslongevity existed among the sites, with median root life- temperature and N availability, affect root lifespan. It hasspans for root cohorts produced in 1994 ranging from been suggested that higher soil temperatures might de-405 to 540 days. Estimates of fine root turnover, based crease root lifespan (Hendrick and Pregitzer 1993b; Self
on the average of_annual root production and mortality et al. 1995), and root longevity appears to be generallyas a proportion 01_standing crop, ranged from 0.50 to greater in species from cold environments (Eissenstat0.68 year -1 for roots in the upper 30 cm of soil. The pat- and Yanai 1997). Within a forest type, improved N avail-terns across sites in root longevity and turnover did not ability sometimes leads to decreases in fine root produc-follow the north to south temperature gradient, but rather tion and biomass (Haynes and Gower 1995), but evi-corresponded to site differences in N availability, with idence exists for both increased (Keyes and Grier 1981;longer average root lifespans and lower root turnover oc- Vogt et al. 1986b; Pregitzer et al. 1993) and decreasedcurring where N availability was greater. This suggests (Aber et al. 1985; Nadelhoffer et al. 1985; Pregitzer et al.the possibility that roots are maintained as long as the 1995) fine root lifespans in more fertile soils. This con-benefit (nutrients) they provide outweighs the C cost of tradictory evidence has led to the development of a vari-keeping them alive. Root N concentrations and respira- ety of hypotheses to explain root longevity (Nadelhoffertion rates (at a given temperature) were also higher at et al. 1985; Hendricks et al. 1993; Eissenstat and Yanaisites where N availability was greater. It is proposed that 1997), but direct observational tests of these hypothesesgreater metabolic activity for roots in nitrogen-rich zones in mature forest ecosystems are needed.leads to geater carbohydrate allocation to those roots, Hendrick and Pregitzer (1993b) examined fine rootand that a reduction in root C sink strength when local longevity in two northern hardwood forests in Michigannutrients are depleted provides a mechanism through and found shorter root lifespans at the more southernwhich root lifespan is regulated in these forests, site. They speculated that warmer soil temperatures at
the southern site might be the cause. This paper reportsA.J. Burton (_). K.S. Pregitzer the results of a study that geographically expands theirSchool of Forestry and Wood Products,Michigan Technological University, work to quantify fine root demography at four sitesHoughton, M149931, USA along a latitudinal temperature gradient. Recent work hase-mail: [email protected], Fax: +1-906-4872915 documented that differences in N availability also existR.L. Hendrick among the four study sites (Zogg et al. 1996), in a pat-D.B. Warnell School of Forest Resources, tern that does not correspond to the temperature gradient.University of Georgia, Athens, GA 30602, USA These natural differences in ambient conditions allowed

390 _
us tO assess the relative influences of temperature and N black to prevent light penetration and then repainted white to min-availability on fine root lifespans at the sites, using mini- imize heat load.
Video images were collected from the minirhizotron tubes atrhizotrons to observe fine root production and longevity approximately five week intervals from mid-May through earlyover two growing seasons. Objectives of the study were: November in 1994, and at 5- to 6-week intervals from mid-April(1) to define seasonal patterns of fine root production to mid-November in 1995 and late April to early June in 1996.and mortality; (2) to determine if differences existed All sites were sampled during each sampling period, with the ex-
among the four sites in "t_in_root longevity and turnover; ception of site A in April, 1995, which was inaccessible dueto deep snow cover. Image collection proceeded from south (site(3) to assess whether such differences corresponded to D) to north (site A) and typically was completed within 7 days°differences among sites in temperature or N availability; The sampling periods used to generate the data reportedand (4) to compare fine root production, mortality and in this paper were: 17-24 May, 19-27 June, 26-30 Juty,turnover in surface (0-10 cm depth) and subsurface soils 30 August-5 September, 4-10 October, and 2-7 November(20-30 cm and 40-50 cm depths). 1994; 13-23 April, 15-22 May, 28 June-5 July, 7-12 August,21-25 September, and 14-20 November 1995; and 22 April-
9 May, and 7-18 June 1996. All video images were recorded onHi-8 mm videotape using a model BTC 1.125 MinirhizotronResearch Color Camera (Bartz Technology Co., Santa Barbara,
Materials a nd methods calif., USA).A PC-based, interactive_ image analysis system (ROOTS,
Fine root production and longevity were studied in four northern Hendrick and Pregitzer 1992a, 1993a) was used to analyze roothardwood forests located along a 3° latitudinal transect in Michi- images. Videotaped minirhizotron images were projected onto agan (Table 1). The forests are second-growth northern hardwoods, computer monitor, and the image from each frame was temporari-approximately 85 years of age, dominated by sugar maple (Acer ly "captured" on-screen by RQOTS using a TARGA+ videograph-saccharum Marsh.), and occurring on sandy, well-drained spodo- ics card (Truevision, Inc., Indianapolis, Ind., USA). For the firstsols (Burton et al. 1991; MacDonald et al. 1991; Randlett et al. image collection date, the ler/'gths and diameters of all roots were1992). Mean annual air temperature increases by about 3°C from traced to the nearest 0.01 ram; and each root was given an identifi-north to south (sites A-D) along the latitudinal gradient, and dif- cation number, classified as living or dead (based upon color andferences among the sites in N availability, fine root N concentra- consistency in the image), and designated as white or brown. Alltiom and fine root respiration rate have been documented (Burton measurements and classifications were written to a dBASE 11I+et al. 1996; Zogg et al. 1996), with significantly higher N avail- file (Ashton-Tate, Torrance, Calif., USA) by ROOTS. The tracingsability, fine root N concentrations, and fine root respiration rates were saved in separate disk files. For subsequent image sets, theoccurring at sites B and C (Table 1). tracings from the previous date were overlain on the new image,
Fine root production and,_ortaiity data reported in this paper allowing previously existing roots to be identified. These werewere collected from three 30x30 m study plots located at each then retraced and designated as white, brown, dead, or missing°site. In September and October of 1993, five clear polybutyrate New roots also were traced, given identification numbers, and des-minirhizotron tubes (2 m longx5.08 cm inside diameter) were in- ignated as new. Roots that were missing and did not reappear atstalled at each plot at a 45 ° angle to the soil surface to a vertical subsequent image collection dates were assumed to have died.depth of >70 cm. Rectangular image frames (0.9xl.3 cm) were Complete records were kept for" all roots, even after they werescribed every 0.9 cm along a transect on the exterior surface of classified as dead or missing. By using ROOTS to match tracingseach minirhizotron tube prior to installation. Every fifth image with identification numbers, the fates of individual roots or unitsframe was scribed w_ith an identifying number. The image frames of root length were followed from initiation until death (Hendrickwere oriented upward during tube installation, and tubes were an- and Pregitzer 1992a,1992b).chored to prevent inadvertent movement or rotation. This enabled Fine root lifespans at the sites were assessed by studying thethe videotaping of the same locations within the soil on all sam- survival of contemporaneously produced root cohorts from eachpiing dates. The aboveground portions of the tubes were painted site. Cohorts consisted of all roots _<1mm in diameter produced
Table 1 Selected characteris-tics of four northern hardwood Characteristic Site A Site B Site C Site Dforests in Michigan, USA.Overstory data are from the Latitude (N) 46052 ' 45o33 ' 44023 ' 43°40 'year 1995. Site means for N Longitude (W) 88053 ' 84°51 ' 85050 ' 86009 'mineralization, root N concen- Mean annual precipitation a (mm) 883 893 870 779tration, and root respiration Mean annual temperature b (°C) 3.8 5.2 6.1 6.8followed by a different letter Total basal area (m 2ha-t) 34 31 32 33are significantly different at the Sugar maple basal area (%) 86 86 83 750.05 level of probability Overstory age 88 82 83 87
Net N mineralization c (lug N g soil -t) 0.29b 0.46a 0.48a 0.32bFine root N concentration a (mg g-t) 17.4b 18.8a 18.6a 17.4bFine root respiration a (nmol 02 _t s-t at 24°C) ll.0b 13.4a 13.8a 11.6b
a For the years 1994-1996, recorded using weighing rain gauges (Model 5-780, Belfort InstrumentCo., Baltimore, Md., USA) located in open areas within 5 km of each sitebFor the years 1994-1996, recorded at 2 m using thermistors which were read every 30 min through-out the year, with averages recorded every 3 h using data loggers (EasyLogger Models 824 and 925,Data Loggers, Inc., Logan, Utah, USA)c Data from Zogg et al. (1996) for the top l0 cm of soil and organic matter occurring beneath the sur-face litter (O0 layer. Net N mineralization was determined using the buried bag technique, with bagsreplaced at 5-week intervals from May through November 1994. Bulk densities of the surface 10 cm,determined at a later date, were similar among sites (G.R Zogg, unpunished work)dData from Burton et al. (1996) for roots _<1mm in diameter collected from the top 10 cm of soil andorganic matter occurring beneath the surface litter (O i) layer
391
between any two sampling dates at a site (mean diameter of all ._.roots studied was actually 0.3t ram). At each site, cohorts from 1.0 _ *,_ *-_.-_ _ <,_,,--_ 9..three depths were identified and tracked: 0-10 cm, 20-30 cm, and \ ,., . '-"%' . .i'"::--_40--50 cm. Images from all 15 tubes at each site were analyzed for 0.8 _ ,, _.. ---_ ,-_ o. -,_,
the 20-30 cm and 40-50 cm depths. For the 0-t0 cm depth, much '" _" ------_,..,.:i_,..£.... " " :...., .+_,_higher root densities and constraints on the amount of time and la- 0.6 .--__.r_---:_. i_ii-_,._.j:...7.... ×bor available for digitizing images necessitated the use of onlynine tubes per site (three t_mm, each plot). For each depth incre- 0,4 "--">_7_._-Q_.k_
ment., the survival of cohorts produced within each sampling inter- 0.2 "val was determined for each subsequent sampling date, and sur- Site A
vival was expressed as a fraction of initial cohort root number still 0.0 . . .surviving. Fine root survival functions were determined using the
1-May-94 1-Nov-94 1-May-95 1-Nov-95 1-May-96life table method of failure-time analysis (Fox 1993), which is ap-propriate for right-censored data (Lee 1992). The SAS lifetest pro-
cedure (SAS Institute 1989) was used to perform these analyses _.0 _--t,_,-._:. .... Q * ,, +--®....."., " ":" 'O. A-. ,x .... "- ,,.,
and to determine product-limit survival estimates of mean and me- _ -_. . . ..... _:_dian root Ii:fespans. Differences among sites in root survival for 0.8 --1,. _.._ = . ........each cohort initiation date were tested using the Wilcoxon multi- _-----._... "*','_:_--a ....... '_-,pie comparison described by Fox (1993). _ 0.6 "'-am'- ""_"- .... "=
• "Fine root production for each sampling interval was deter- > " ' .... -:--_mined by summing the tength of all new roots and adding the ex- ._ 0.4tension growth of all previously existing roots. Fine root mortalityfor each sampling interval was determined by summing the _ 0.2 Site Blengths of all roots that had died during that interval and adding o _'root length lost by existing roots due to herbivory or dieback, x::: 0.0 "oMonthly estimates of fine root production and mortality at the o 1-May-94 1-Nov-94' 1-May-95 1-Nov-95 l-May-96
sites were made by assuming production was constant for each '_
day in the time interval between consecutive imaging dates. Esti- c 1.0 ,4, _ cao. ,,.-:t-ll .....mates of daily production and mortality were then summed foreach month. Production and mortality were both expressed as root o o.s _%_-___c___--__---:_":i ' ,_-..A..,, ....... ,,----%t;it.2_ _.. '_'--°length per minirhizotron tube area observed (mm cm-2), o "'_:i_._.i ........,_.,
Estimates of annual fine root turnover (proportion of standing a.. °61 "_-,-:._£!_,_._root biomass replaced annually) were made using: (1) the ratio of ' " _u:,8annual root. length produced,et_ average live root length observed; 0.4_
' (2) the ratio of annual root length mortality to average live rootlength observed; and (3) the average of the above two measures. 0.2 Site CDifferences among sites in annual root turnover were determinedusing analysis of variance and Tukey's HSD test, using turnover 0.0 .....estimates from each of the three plots per site. The inverse of me- 1-May-94 1-Nov-94 1-May-95 1-Nov-95 1-May-96
dian cohort [ifespan (year --t) for the 1994 root cohorts was used as
an additional index of differences among the sites in annual root _.0 ,.,, _ =. ,, .....turnover. _ _ __2_.-_0, +..... ".....o
....... 0.8 _"_ - _ " "'_;' '_ ..... �'_,.,, ,:*,_,"_ _... " _",x
Results 0._ - ---- • "---=_=........
• 0.4 m---_-L .
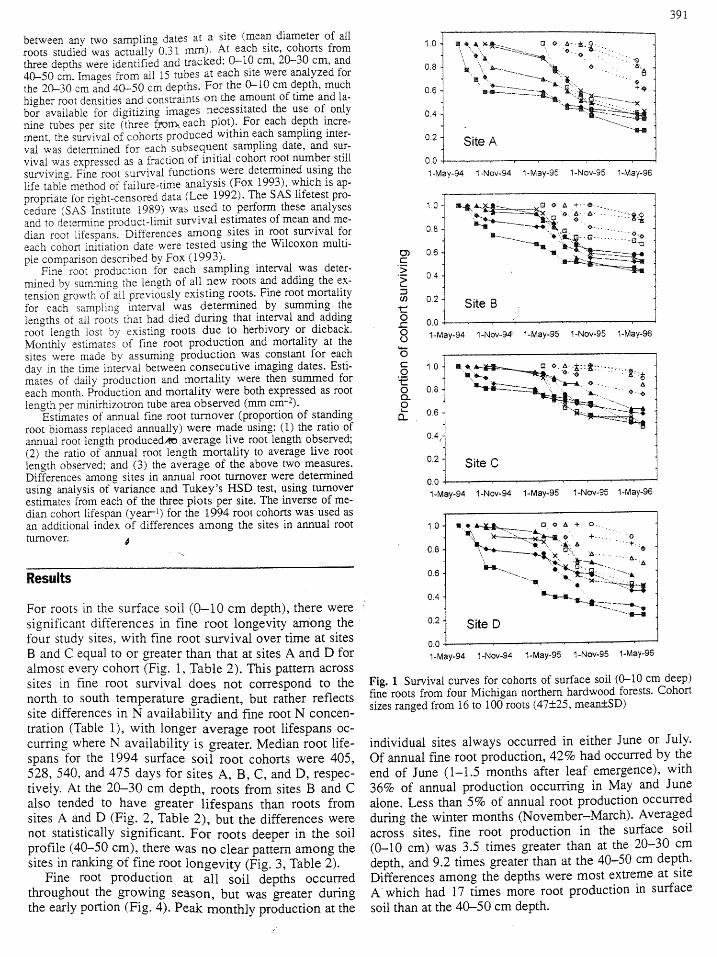
For roots in the surface soil (0-10 cm depth), there were _,......-....-27_HIsignificant differences in fine root longevity among the 0.2 Site Dfour study sites, with fine root survival over time at sites
0.0B and C equal to or greater than that at sites A and D for 1-Ma-94 1-Nov-94 1-May-95 l-Nov-95 1-May-96almost every cohort (Fig. 1, Table 2). This pattern across
sites in fine root survival does not correspond to the Fig. 1 Survival curves for cohorts of surface soil (0.10 cm deep)north to south temperature gradient, but rather reflects fine roots from four Michigan northern hardwood forests. Cohortsite differences in N availability and fine root N concen- sizes ranged from 16 to 100 roots (47+25, mean+_SD)
tration (Table 1), with longer average root lifespans oc-
curring where N availability is greater. Median root life- individual sites always occurred in either June or July.
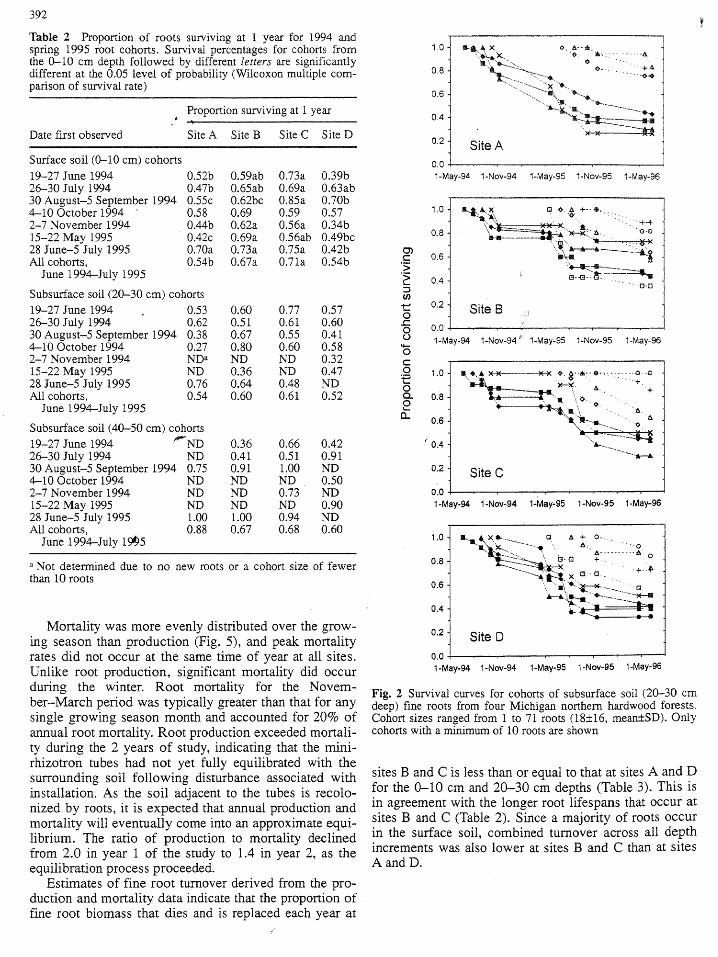
spans for the 1994 surface soil root cohorts were 405, Of annual fine root production, 42% had occurred by the528, 540, and 475 days for sites A, B, C, and D, respec- end of June (1-1.5 months after leaf emergence), withtively. At the 20-30 cm depth, roots from sites B and C 36% of annual production occurring in May and June
also tended to have geater lifespans than roots from alone. Less than 5% of annual root production occurredsites A and D (Fig. 2, Table 2), but the differences were during the winter months (November-March). Averaged
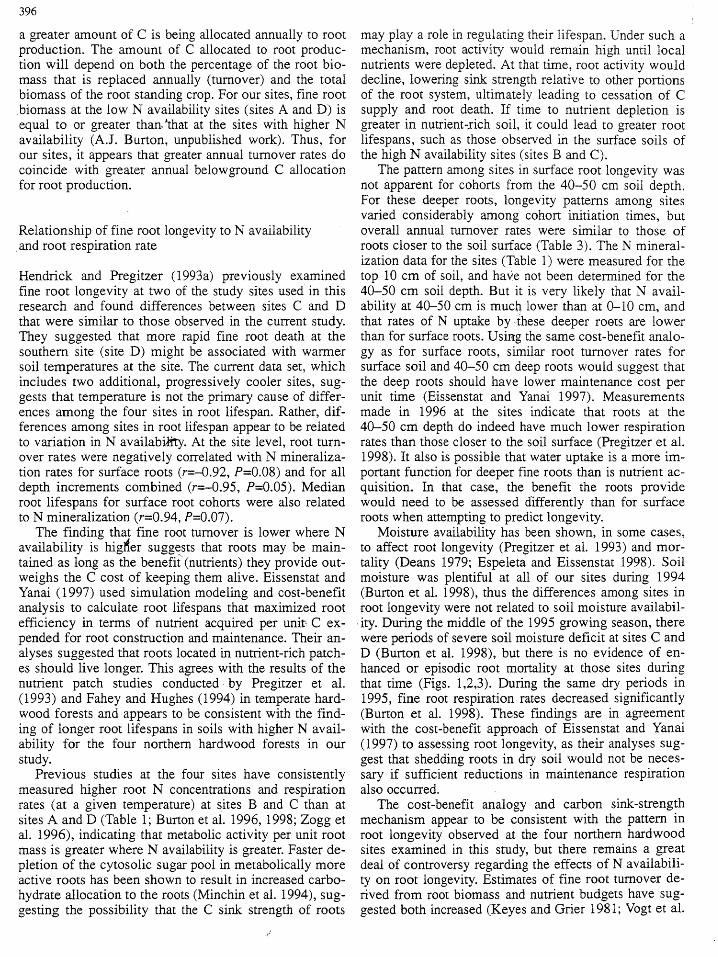
not statistically significant. For roots deeper in the soil across sites, fine root production in the surface soilprofile (40-50 cm), there was no clear pattern among the (0-10 cm) was 3.5 times greater than at the 20-30 cmsites in ranking of fine root longevity (Fig. 3, Table 2). depth, and 9.2 times greater than at the 40-50 cm depth.
Fine root production at all soil depths occurred Differences among the depths were most extreme at site
throughout the growing season, but was greater during A which had 17 times more root production in surfacethe early portion (Fig. 4). Peak monthly production at the soil than at the 40-50 cm depth.
y'
392 _
Table 2 Proportion of roots surviving at 1 year for 1994 andspring 1995 root cohorts. Survival percentages for cohorts from 1,0 _,_ × ,. _--,_,
'_2z>, ._, • .... -....... Athe 0-10 cm depth followed by different letters are significantly o ......different at the 0.05 level of probability (Wilcoxon multiple com- o,8 .. _r--*. ...... -"_"*
"',. ""_--_ ""X "_'_.
parison of survival rate) 0.6 "-.. _.'_,_ *--.,..,...
, Proportion,. surviving at 1 year 0.4 _,__.._._Date first observed Site A Site B Site C Site D _--_---
0.2 Site A
Surface soil (0-10 cm) cohorts 0.019-27June 1994 0.52b 0.59ab 0.73a 0.39b 1-May-94 1-Nov-94 1-May-95 1-Nov-95 1-May-9626-30 July 1994 0.47b 0.65ab 0.69a 0.63ab30 August-5 September 1994 0.55c 0.62bc 0.85a 0.70b4--10 October 1994 _ 0.58 0.69 0.59 0.57 1.0 _,.t,_,_ _ _. ,, +--®,
2-7 November 1994 0.44b 0.62a 0.56a 0.34b _,._ _. -.. TT15-22 May 1995 0.42c 0.69a 0.56ab 0.49bc 0.8 _ _ "_-x.;_.. _-.o28 June-5 July 1995 0.70a 0.73a 0.75a 0.42b
All cohorts, 0.54b 0.67a 0.7 la 0.54b ._ 0.6 _v_,,___e__....•>- _ /_.__.'_ y---_
June 1994--July 1995 _ 0.4 ...........o._Subsurface soil (20-30 cm) cohorts u_19-27 June 1994 0.53 0.60 0.77 0.57 _ 0.2 Site B
0 _:!26-30 July 1994 0.62 0.51 0.61 0.60 x:: ,'30August-5 September 1994 0.38 0.67 0.55 0.41 _ o.0 ..... . . ....
1-Ma'r-94 1-Nov-94 _ 1-May-,95 1-Nov-95 1-May-964-10 October I994 0.27 0.80 0.60 0.582-7 November 1994 ND a ND ND 0.32 ,-
15-22 May 1995 ND 0.36 ND 0.47 ._o 1.0 m..._, ×x xx .._..i..®.:_: ...... o.-o28 June-5 July 1995 0.76 0.64 0.48 ND "I_ ', .....0 _,_,,___..___.__ x-_,,, "_,. "..... +,.+All cohorts, 0.54 0.60 0.61 0.52 _ 0.8 It_ ,l_-,_t ,,._. "
June t994-July 1995 o - ...... , 0.•,_ _ _Ik ii. '\ ".... "_.
n 0.6 "lk,'t_-s. '" o _Subsurface soil (40-50 cm) cohorts ' _--_-- ".
19-27 June 1994 '°"ND 0.36 0.66 0.42 ' 0.4 J,-_._._
26-30 July 1994 ND 0.41 0.51 0.91 ""_--_30 August-5 September 1994 0.75 0.91 1.00 ND 0.2 Site C4.10 October 1994 ND ND ND 0.502-7 November 1994 ND ND 0.73 " ND 01o •15-22 May 1995 ND ND ND 0.90 1-May-94 1-Nov-94 1-May-95 1-Nov-95 1-May-9628 June-5 July 1995 1.00 1.00 0.94 NDAll cohorts, 0.88 0.67 0.68 0.60
June 1994-July 19t)5 1.0 I-._ ,, x_-.._ _ ,, + o-.
Not determined due to no new roots or a cohort size of fewer o.a _'.-bL_-_,j, i_-_ +"* i--l!, x _ ......
than 10 roots 0.6 ....., -.,=,;*-:_c--_....._....
' 0.4 .:_- _*-_
Mortality was more evenly distributed over the grow- 0.2ing season than production (Fig. 5), and peak mortality Site Drates did not occur at the same time of year at all sites. 0.0Unlike root production, significant mortality did occur _-May-_4_-Nov-94_-May-_S_-Nov-_S_-May-9_during the winter. Root mortality for the Novem- Fig. 2 Survival curves for cohorts of subsurface soil (20-30 cmber-March period was typically greater than that for any deep) fine roots from four Michigan northern hardwood forests,,single growing season month and accounted for 20% of Cohort sizes ranged from 1 to 71 roots (18+16, mean±SD). Onlyannual root mortality. Root production exceeded mortali- cohorts with a minimum of 10 roots are shown
ty during the 2 years of study, indicating that the mini-rhizotron tubes had not yet fully equilibrated with thesurrounding soil following disturbance associated with sites B and C is less than or equal to that at sites A and D
installation. As the soil adjacent to the tubes is recolo- for the 0--10 cm and 20-30 cm depths (Table 3). This isnized by roots, it is expected that annual production and in agreement with the longer root lifespans that occur atmortality will eventually come into an approximate equi- sites B and C (Table 2). Since a majority of roots occur
librium. The ratio of production to mortality declined in the surface soil, combined turnover across all depthfrom 2.0 in year 1 of the study to 1.4 in year 2, as the increments was also lower at sites B and C than at sitesequilibration process proceeded. A and D.
Estimates of fine root turnover derived from the pro-
duction and mortality data indicate that the proportion offine root biomass that dies and is replaced each year at

. 393
i .3.5
' [1_' mO.10cmI 0 A. *> _' _':_ ........... ,3,0 bite A "__.,_, @- e, _ ............... _.e @ 20 - 30 cm• _ ,_
.......... i 2.50 8 ............. ,i tll 4.0 - 50 cm
4 _o f1 ii '° -04 *_ "! o.5 [! ii
i ' _ j ¢002 _ S iteA M J J A S 0 N S d F M a V d J A SON D J F V A M
t} 3,5 •
00 . - ..... i
'_.-,May-g.4I-NOv-B4 loMay-95 I-NOv-95 14qay-96 =._. 30 /I Site B Do- _0cm t" . N20,.30cm_ In40.50 cm
i it ij E 0.5,_ i lu , ' i: o6_ . _ o,,o..... =-£&£
"_ • _"..................................*_ " c M d d A S O N O d F M A M d ,; A S 0 N O J F M A M
5 _ :s.s, ,m " _-'-" ..............................__ ' : Site C 80 - _ocm 'tc o2-_ SiteB ,_ g s.o i =20-Socm io ,, J _ z.s) [j [t _o-socm [
© _-M a',/-'_4 I -Nov-94 I ..May-95 I _No>,95 ;-Mayo96 _ !,5
0 _ _,0
X '
.... , .r-
• i 3.o -] Site D _o. _ocm I20 - 30 cm I
, ! lll4O-_cm ]0.4 4 _,.
02 '[1 Site C 1 _,.s [J 1
MJ J A SON O J F MAM J j A SOND J F MAM
i 1994 1995 ! 996
,_.,_ _, ._:..o_ q Fig. 4 Monthty fine root production ra_es for the period May 19940.s .j _, . ,_ _ ........ j to May 1996 for four Michigan northern hardwood forests
°°i .- .......................*-.I0_-4 '_............ '__"'-_-'_ .........................."-" _ Pregitzer t996, 1997). Hendrick and Pregitzer (1996)
J J reported circumstantial evidence that episodic deep (50-0_i J ',ij Site O I(X) cm) root production was related to :periods of high wa-
t io,o ..... , -- . : ter demand. Sites C and D experienced s_ong soil moisture1-May-g4 l*N0v<94 144ay-95 I-Nov-gS 14,1ay-96 deficits during the 1995 growing see.son (Burton et at.
Fig. 3 Survivat curves for cohorts of subsurface soil (40-50 cm 1998), but no increase in root production was observed dur-deep) fine roots from four Michigan northern hardwood forests, ing these drought periods at the deepest depth used in thisCohort sizes ranged from 0 to 47 roots (8±t.0, mean±SD). Only study (4i'5-50 cm). Instead, a decrease in root production oc-cohorts wiO_a minimum of 1.():roots _re shown cuffed at sites C and D at all depths during the 1995 gq-ow-
mg season (Fig. 4), in agreement with previous reports ofreduced root initiation and elongation in du soils (Morrow
Discussie_ 1950:; Teskey and Hinckley 1981 Kuhns et at. 1985). Thisdoes not preclude the possibUity that dry conditions resulted
Fine root production, mortality and turnover in enhanced root production at depths deeper than 50 cm, asobserved by Hendrick _d Pregitzer (1996). Fine root mor-
"lq_e finding that :root production was continuous over the tNity was continuous throughout the year and more evenlyentire growing season, with a :majority of production occur- distributed over time than production, simit_ to previousring in the spring and early summer (by mid-July), is con- reports for sites C _d D (Hendrick rand Degitzer 19961).sistent with :numerous previous obser_'ations for sugar ma- Estimates of fine root turnover calculated using theple (Morrow 1950)and northern hardwood forests (Fahey annual rate of production were greater than those calcu-and Hughes 1994; Burke and Raynal 1.994; H[endrick and lated using the annual rate of mortality (Table 3). This is
.........i'?uilim?lrrri/rPTm............................................................................................................................................................................................................................_ ........ _ ..... -=_-="- '" ' ' '1 '<J-'i7---_

394 ,_
2.5 Table 3 Estimates of fine root turnover for four Michigan north..Site A rno- 10cm ern hardwood forests. Site means followed by different letters are
2.0_.5 ill] I a20.m40- so3°cmcrn significantly different at the 0.05 level of probability1.0 1 _ 1 _ Fine r°°t turn°ver (year-t) f°r0.5 ___ Basis of estimate SiteA SiteB SiteC Sited0.0 []-...... _, II_[k_k N P,,_ Ik lk & [1._rl. _. Surface soil (0-I0 crri) cohorts
MJ J ASONDJ FMAMJ JASONDJ FMAMAnnuallength production a 0.8lab 0.76ab 0.72b 0.82a
2.5 Annual length mortality a 0..52 0.42 0.36 0.52Site B []0- lo cm Average of production 0.66a 0.59ab 0.54b 0.67a
2.0 N20- 30 cm and mortality a
-=_ 1.5 m40-5ocm Medianroot lifespan a 0.90a 0.69b 0.68b 0,7Tab
o Subsurface soil (20-30 cm) cohorts
,.', Annual length production 0.88 0.76 0.77 0.76).5 Annual length mortality 0.48a 0.25b 0.39ab 0.50a
o ] rl [_ r_ I1._ Average of production y 0.68 0.50 0.58 0.63E ?.o n_........M O O A S O N D J F M A M J OA S O N D J F M A M and mortatit
•_ _..5 Subsurface soil (40-50 cm) cohorts_o ._.o Site C Do- locm Annual length production 1.06 0.81 0.89 0.85E _s2o-30crn Annual length mortality 0.20 0.25 0.48 0.50
1.5 R4o- 50cm Average of production 0e63 0.53 0.68 0.68
_ I'o 1_ _ _- 1_,_ _. _ _t and mortality
._q
u. _ All depth increments combined0.5 ___ rk._.n_,__,_rL _llkn.. .... Annual length production 0.83 0.76 0.75 0.800.o Annual length_mortality 0.50a 0.36b 0.37ab 0.50a
M J J A S O N D J F M A M J J A $ O N D J F M A M Average of production 0.66a 0.56b 0.56b 0.65ab2.5 and mortality
Site D [] o- lo cm2.0 ,,_ m2o-30 cm a Turnover estimates from production and mortality data were de-1.5 s4o- 50 cm rived by dividing annual root length production (or mortality) by
the average total root length observed. For surface soil roots, turn-1.0 over estimates from median root lifespans were calculated as the
0.5 _L_ _ _ inverse of median root lifespan for all 1994 root cohorts at a siteoo _.,. _.,. _.__lk_. L_._ _rLMJ J ASOND J FMAMJ JASOND J FMAM
1994 # 1995 1996 types: 0.33 year -1 for birch-aspen, 0.94 year -1 for balsampoplar, and 0.75 year -1 for alder-balsam poplar in Alaska
Fig. 5 Monthly fine root mortality rates for the period May 1994 (Ruess et al. 1996); 0.21 year -1 for white oak in Missourito May 1996 for four Michigan northern hardwood forests (Joslin and Henderson 1987); 0.67-0.89 year -1 for a
mixed deciduous forest in Massachusetts (McClaughertythought to be a consequence of the minirhizotron tubes _et al. 1982); 0.6 year -1 in a Belgian beech forest (Van
not having fully equilibrated following installation Praag et al. 1988); and 0.19-0.64 year -t (maximum-(Joslin and Wolfe 1999). Eventually, as the tubes reach minimum method) and 0.64-2.26 year -1 (N budget meth-
equilibrium, annual rates of production and mortality od) for oak and maple forests in Wisconsin (Aber et al.should become approximately equal. For this to occur, 1985). Most of these turnover rates were calculated frommeasured rates of production for the sites must decrease, root production values derived using either the differ-
or rates of mortality must increase, or both. In any of ence in maximum and minimum live root biomass mea-these possible scenarios, the standing crop of root length sured during the year (maximum-minimum method,
visible on the tube surface will increase during the time McClaugherty et al. 1982) or the N budget method ofequilibrium is being approached. Thus the observed ra- Aber et al. (1985). Both of these methods are subject to
tios of annual root length production to total live root errors associated with their inherent assumptions. Forlength are likely to have overestimated turnover, while example, the maximum-minimum method assumes thatthe ratios of root length mortality to total live root length root production and mortality do not occur simultaneous-
underestimated turnover, ly during the growing season (Aber et al. 1985). MakingFor the minirhizotron tubes used in this study, root this assumption would lead to underestimation of root
turnover rates calculated using the average of production production and turnover in stands such as our study sites,
and mortality would appear to provide the best estimates in which root production and mortality are concurrentof annual fine root turnover. The range of turnover rates throughout the year. The N budget method makes a vail-from this method, 0.50-0.68 year -t for the various sites ety of assumptions, including accurate measurement of
and depths (Table 3), is well within the range reported in N mineralization using the buried bag technique and thethe literature for a wide variety of deciduous forest forest stand taking up all N made available through min-

395i
eralization and atmospheric inputs (Aber et al. 1985). sites (sites C and D in this report) of 0.83 and 0.79 year -1Failure of these and other assumptions associated with using the ratio of root length production to average total
the technique could result in either under- or overestima- root length observed during the year, and 0.76 andtion of fine root production and annual turnover. Root 0.66 year -_ comparing the average of root length produc-turnover estimates made using minirhizotrons avoid tion and mortality to total root length observed. These
these problems, but are subject to a variety of possible values are only slightly greater than determined for theerrors, including the p_eviously mentioned disturbance same sites in this.study (c. 11%), and the relative rankingassociated with tube installation, and the assumption that of the sites remains the same, indicating that the resultsfine root dynamics along the soil-tube interface are the of minirhizotron studies are quite repeatable.same as those in bulk soil. Median root lifespans (days to 50% mortality) of the
In our study, equilibration following tube installation individual cohorts examined in this study ranged from as
appears to be proceeding more rapidly at sites A and D little as 74 days to greater than 500 days (Figs. 1,2,3),than at sites B and C. In the upper 10 cm of soil, ratios of but most cohorts, including all surface soil (0-10 cm)
fine-root production to mortality were 1.6, 1.8, 2.0, and cohorts, had median root lifespans greater than 300 days.1.6 at sites A, B, C, and D, respectively, over the 2-year These values for surface fine roots are somewhat greater
study period. Although the tubes were not fully equili- than those previously reported for sugar maple forestsbrated during the experiment, we believe that the pattern (Hendrick and Pregitzer 1992a, 1993b; Fahey andwe observed among sites in annual root turnover is real. Hughes 1994). The inverse of median root lifespansThe same pattern occurred across sites whether annual from the 1994 surface soi!: root cohorts was used to esti-rates of mortality, annual rates of production, or median mate an index of root turnover for the sites (Table 3).root lifespans of contemporaneous cohorts were used as Annual fine root turnovdr rates so derived were similarthe basis for estimating annual turnover (Table 3), and to those based on the ratio of root length production to
the pattern among sites in root lifespan was similar in total root length observed, but lower than those based onboth years (Fig. 1, Table 2), despite the fact that the ratio root length mortality or the average of root length pro-of production to mortality was much closer to equilibri- duction and mortality (Talkie 3). However, the values didum in year two. This suggests that the longer root life- correctly assess relative differences among the sites inspans and lower annual turnover at sites B and C are real fine root turnover (Table 3), with greater turnover occur-rather than being artifaeg of site differences in rates of ring at sites A and D, where N availability was lower and,?
tube equilibration following disturbance. It is more like- median root lifespans were shorter.ly that slower equilibration at sites B and C is actually a Turnover estimates based on median root lifespan willconsequence of the longer root lifespans observed at only be accurate if the rate of mortality remains relative-those sites; i.e., where roots live longer, it takes more ly constant until all roots have died. In our study, thistime after recolonization for the initial flush of root pro- was not the case. For example, the average mortality rateduction to die, thus mortality lags further behind produc- across all sites in surface soil fine roots declined fromtion at those sites. _ 0.17% day -t during the first growing season of a root co-
Overall, we feel miniri_izotrons provide a powerful horts existence to 0.12% day -1 during the second grow-tool for assessing root longevity and turnover, and our ing season. This would cause the inverse of median rootturnover estimates compare well with published values lifespan to overestimate turnover. Hendrick and Pregitzerfor other sugar maple-dominated forests. Burke and Ray- '(1992a) observed a similar decline in mortality rate asnal (1994) estimated fine root (<3 mm) turnover of 0.8 to root cohorts were followed over time. This decline over1.2 year -1 for northern hardwoods at Huntington Forest time in fine root mortality rate may be related to differ-in New York, using production estimates derived from ences in architectural position within the root system ofthree different techniques; the maximum-minimum apparently similar fine roots. In sugar maple, root diame-method, a phenology-based examination of changes in ters <0.5 mm can exist for as many as six root orderslive and dead root biomass (Vogt et al. 1986a), and the (Pregitzer et al. 1997). These orders include many shortlitterfall ratio method of Nadelhoffer and Raich (1992). lateral roots which serve as the absorbing structure but
The fine root (<1 mm) production estimates of Fahey also include longer lateral connecting roots that likelyand Hughes (1994) can be used to estimate turnover function in transport of water and nutrients. These rootsrates of 0.54-0.66 year-X for a northern hardwood stand are all <0.5 mm, but may have very different lifespans.in New Hampshire (production estimated using ingrowth Root cohorts observed along our minirhizotron tube sur-cores and in situ screens). For sugar maple stands in faces likely contained both types of "fine roots", espe-Wisconsin, Aber et al. (1985) estimated fine root cially in 1994 when the soil-tube interface was being re-(<3 mm) turnover rates of 1.29-2.01 year-1 using the N colonized. This could explain why the cohorts exhibitedbudget method and 0.26-0.33 year -1 using the maximim- higher mortality rates early in their existence than at laterminimum method. Hendrick and Pregitzer (1993a) previ- times when they may have been comprised primarily ofously used minirhizotrons to study fine root dynamics at longer-lived connecting roots.two of the northern hardwood sites used in this study. It should be noted that a higher annual root turnoverTheir data from 1989 can be used to estimate fine root rate at a site, i.e., a greater proportion of the root system(<2 mm) turnover rates for their northern and southern dying and being replaced, does not necessarily mean that
/
396
a greater amount of C is being allocated annually to root may play a role in regulating their lifespan. Under such aproduction. The amount of C allocated to root produc- mechanism, root activity would remain high until localtion will depend on both the percentage of the root bio- nutrients were depleted. At that time, root activity wouldmass that is replaced annually (turnover) and the total decline, lowering sink strength relative to other portionsbiomass of the root standing crop. For our sites, fine root of the root system, ultimately leading to cessation of Cbiomass at the low N availability sites (sites A and D) is supply and root death. If time to nutrient depletion isequal to or greater than.'that at the sites with higher N greater in nutrient-xich soil, it could lead to greater rootavailability (A.J. Burton, unpublished work). Thus, for lifespans, such as those observed in the surface soils ofour sites, it appears that greater annual turnover rates do the high N availability sites (sites B and C).coincide with greater annual belowground C allocation The pattern among sites in surface root longevity wasfor root production, not apparent for cohorts from the 40-50 cm soil depth.
For these deeper roots, longevity patterns among sites• varied considerably among cohort initiation times, but
Relationship of fine root longevity to N availability overall annual turnover rates were similar to those ofand root respiration rate roots closer to the soil surface (Table 3). The N mineral-
ization data for the sites (Table 1) were measured for theHendrick and Pregitzer (1993a) previously examined top 10 cm of soil, and ha'_e not been determined for thefine root longevity at two of the study sites used in this 40-50 cm soil depth. But it is very likely that N avail-research and found differences between sites C and D ability at 40-50 cm is much lower than at 0-10 cm, andthat were similar to those observed in the current study, that rates of N uptake by :_hese deeper roots are lowerThey suggested that more rapid fine root death at the than for surface roots. Using the same cost-benefit analo-southern site (site D) might be associated with warmer gy as for surface roots, similar root turnover rates forsoil temperatures at the site. The current data set, which surface soil and 40-50 cm deep roots would suggest thatincludes two additional, progressively cooler sites, sug- the deep roots should have lower maintenance cost pergests that temperature is not the primary cause of differ- unit time (Eissenstat and Yanai 1997). Measurementsences among the four sites in root lifespan. Rather, dif- made in 1996 at the sites indicate that roots at theferences among sites in root lifespan appear to be related 40-50 cm depth do indeed have much lower respirationto variation in N availabit_. At the site level, root turn- rates than those closer to the soil surface (Pregitzer et al.over rates were negatively correlated with N mineraliza- 1998). It also is possible that water uptake is a more im-tion rates for surface roots (r=-0.92, P=0.08) and for all portant function for deeper fine roots than is nutrient ac-depth increments combined (r--0.95, P=0.05). Median quisition. In that case, the benefit the roots provideroot lifespans for surface root cohorts were also related would need to be assessed differently than for surfaceto N mineralization (r=0.94, P=0.07). roots when attempting to predict longevity.
The finding that fine root turnover is lower where N Moisture availability has been shown, in some cases,availability is higher suggests that roots may be main- to affect root longevity (Pregitzer et al. 1993) and mor-rained as long as the benefit'S(nutrients) they provide out- tality (Deans 1979; Espeleta and Eissenstat 1998). Soilweighs the C cost of keeping them alive. Eissenstat and moisture was plentiful at all of our sites during 1994Yanai (1997) used simulation modeling and cost-benefit (Burton et al. 1998), thus the differences among sites inanalysis to calculate root lifespans that maximized root root longevity were not related to soil moisture availabil-efficiency in terms of nutrient acquired per unit,: C ex- ity. During the middle of the 1995 growing season, therepended for root construction and maintenance. Their an- were periods of severe soil moisture deficit at sites C andalyses suggested that roots located in nutrient-rich patch- D (Burton et al. 1998), but there is no evidence of en-es should live longer. This agrees with the results of the hanced or episodic root mortality at those sites duringnutrient patch studies conducted by Pregitzer et al. that time (Figs. 1,2,3). During the same dry periods in(1993) and Fahey and Hughes (1994) in temperate hard- 1995, fine root respiration rates decreased significantlywood forests and appears to be consistent with the find- (Burton et al. 1998). These findings are in agreementing of longer root lifespans in soils with higher N avail- with the cost-benefit approach of Eissenstat and Yanaiability for the four northern hardwood forests in our (1997) to assessing root longevity, as their analyses sug-study, gest that shedding roots in dry soil would not be neces-
Previous studies at the four sites have consistently sary if sufficient reductions in maintenance respirationmeasured higher root N concentrations and respiration also occurred.rates (at a given temperature) at sites B and C than at The cost-benefit analogy and carbon sink-strengthsites A and D (Table 1; Burton et al. 1996, 1998; Zogg et mechanism appear to be consistent with the pattern inal. 1996), indicating that metabolic activity per unit root root longevity observed at the four northern hardwoodmass is greater where N availability is greater. Faster de- sites examined in this study, but there remains a greatpletion of the cytosolic sugar pool in metabolically more deal of controversy regarding the effects of N availabili-active roots has been shown to result in increased carbo- ty on root longevity. Estimates of fine root turnover de-hydrate allocation to the roots (Minchin et al. 1994), sug- rived from root biomass and nutrient budgets have sug-gesting the possibility that the C sink strength of roots gested both increased (Keyes and Grier 1981; Vogt et al.
S

,_ -_ 397
1986b) and decreased (Aber et at. 1985; Nadelhoffer et o rr_,pec_slo
al. 1985) fine root lifespans in more fertile soils. In di- -,. ,,/_-,-_ +rree,pec,,_22>4% °. _ Et Tree species 3rect observational studies utilizing a single species or 1" v _ X Tree species 4
_>' + +_ _ _ Tree species 5forest type, root lifespans have been shown to be both ._positively (Keyes and Grier 1981; Pregitzer et al. 1993) _ _ oTr_e_pec_and negatively (Pregitzer et al. 1995, 2000) related to N -gavailability. These findifigs'have led to the generation of _ • - 2',¢29_several competing hypotheses regarding the effect of N _%,,,availability on root longevity and the mechanisms bywhich N availability might control root longevity (Raich ' " ' .....and Nadelhoffer 1989; Hendricks et al. 1993; Eissenstat Navailability >
and Yanai t997). Fig. 6 Hypothetical relationships between fine root longevity andSome of the contradictory evidence regarding N ef- N availability within forest types along N availability gradients
fects on root lifespan may be a consequence of some ex- (thin lines) and across forest types adapted to different ranges in Nperiments studying a single tree species (or forest type) availability (bold line). Across species, root lifespan decreaseswith increasing N availability. Within species, root tifespan gener-across a range of N availabilities, whereas other studies ally increases with increasing N availability, although decreasesexamined a variety of different tree species, each adapt- and no change are also possible responsesed to sites of different fertility. It is possible that averageroot lifespan in species adapted to nutrient-poor environ- :_ments is longer than that in species adapted to nutrient- Clearly, the possibility exists that the within-species re-rich environments, as hypothesized by Nadelhoffer et al. sponse of root longevity tb increasing N availability may(1985), Eissenstat (1992), and Grime (1994), while in- be specific to the species involved, with increases, de-creased soil N availability for a given tree species or creases and no change in root longevity all being poten-within a forest type often leads to longer root lifespans tial effects (Fig. 6). It should be noted that differencesas observed in this study and by Pregitzer et al. (1993), across forest types in root longevity are usually greaterFahey and Hughes (1994), and Keyes and Grier (1981). than those occurring within a species. For example, in aFigure 6 depicts such a hypothetical situation. Under study of nine forest ecosystems, Nadelhoffer et al. (1985)such a scenario, we sugg_t that the between-species ef- estimated that a 3.5-fold increase in net N mineralizationfects of N availability on root longevity would reflect ge- resulted in a 5-fold increase in root turnover. This com-netic adaptation of each species to the range of site con- pares to our findings within a single species (sugar ma-ditions where it normally occurs. If this were true, one ple) that a 50% increase in net N mineralization caused awould expect lower average root activity (respiration) in corresponding decrease in root turnover of only 20 toroots of species adapted to N-poor sites. This would cre- 30%. The relative slopes of the lines in Fig. 6 are intend-
ate a low C cost,_ermitting long root lifespans despite ed to illustrate the possibility that differences in N avail-low nutrient gain per uni.t, time (Eissenstat and Yanai ability may have a much greater effect on differences in1997). Such a cross-species relationship between root root lifespans across species than within species.longevity and root respiration would be analagous to that A possible explanation for the finding of Majdi andreported across species and biomes for leaves, with spe- Kangas (1997) that N fertilization decreased root life-cies that have greater leaf lifespans having lower inher- _span is that it represents a transient response to a sudden,ent N concentration and dark respiration rates (Reich et large change in N availability. Heavy N additions to for-al. 1997, 1998a,1998b). ests can lead to a reduction in total root biomass (Vogt et
The hypothetical within-species effect of higher N al. 1990; Haynes and Gower 1995). For this new "equi-availability leading to longer root lifespan (species 1, 3, librium" root biomass to be achieved, root production4, and 6 in Fig. 6) would represent a plastic response to must decrease (Vogt et al. 1990; Gower et al. 1992),variation in soil resource availability within the range of and/or average root tifespan must temporarily shorten.N availabilities to which the species was adapted. This Until carbon allocation in the forest has equilibrated withwould allow optimization of above-and belowground re- the altered N availability and a quasi steady-state rootsource acquisition, within the genetic constraints of the biomass is achieved, root lifespans may differ from thosespecies. For sugar maple forests, we have found that in- that will exist after the stand has adjusted to the im-creasing N availability results in _eater root lifespans, proved N availability. The finding by Majdi and Kangasand we have depicted this to be the most common within- (1997) that root lifespans were shorter for P. abies thatspecies response to increasing N availability in Fig. 6. received fertilizer N additions (100 kg N ha -1 year -1)Such a within-species effect of N availability on root lon- may represent such a transient response. Would naturalgevity is consistent with the results reported by stands of P. abies growing on sites of differing nutrientPregitzer et al. (1993), Fahey and Hughes (1994), and availability also have shorter root lifespans where NKeyes and Grier (1981). However, experiments with availability was greater? Would low, uniform rates of Nyoung Populus trees (Pregitzer et al. 1995, 2000) and addition of 10-20 kg N ha -1 year -1 produce the same re-with Picea abies (Majdi and Kangas 1997) have found sults? The answers to such questions are important if weroot longevity was decreased by higher N availability, are to be confident in predictions of how current levels
/

398
of atmospheric N deposition might alter belowground and Michigan Department of Natural Resources for providingforest C allocation, study site locations. This research was funded by the U.SoNation-
al Science Foundation (NSF Grants DEB 9221003, DEB 9629842,For sugar maple-dominated northern hardwood for- DBI 9413407) and the USDA Forest Service Northern Global
ests, we have found that root lifespan is greater at sites Change Program. This paper has not been subject to review by thewhere N availability is higher. This relationship may also funding agencies and should not be construed to represent theirhold true within other forest types, provided that the policies.stands were mature forests; with root biomass that was
relatively steady over time and in equilibrium with Navailability. Heavily fertilized forests or young, fast- Referencesgrowing forests in the early, exptoitative stages of standdevelopment might behave quite differently. To under- Aber JD, MeIillo JM, Nadelhoffer KJ, McClaugherty CA, Pastor Jstand such effects and to assess the possibility that the (1985) Fine root turnover in forest ecosystems in relation toeffects of N availability on root longevity across species quantity and form of nitrogen availability: a comparison of
two methods. Oecologia 66:317-321or forest types might differ from those within species Arthur MA, Fahey TJ (1992) Biomass and nutrients in an Engel-(Fig. 6), additional direct observational experiments of mann spruce-subalpine fir forest in north central Colorado:root longevity need to be made. Such experiments pools, annual production and internal cycling. Can J For Resshould include both studies within forest types along nat- 22:315-325ural N availability gradients, and studies across forest Burke MK, Raynal DJ (1994)Fine root growth phenology, pro-
duction, and turnover in a northern hardwood forest ecosys-.types adapted to sites of differing N availability. Cou- tem. Plant Soil 162:135-146_piing these experiments with measurements of root res- Burton AJ, Pregitzer KS, Reed DD (1991) Leaf area and foliarpiration would allow assessment of the roles root C cost biomass relationships in northern hardwood forests locatedand C-sink strength play in determining root lifespan along an 800 km acid deposition gradient. For Sci 37:1041-t059across and within forest types. Experiments in which N Burton AJ, Pregitzer KS, Zogg GR Zak DR (1996) Latitudinalavailability is artificially altered could also prove useful, variation in sugar maple fine root respiration. Can J For ResIdeally, some of these would be conducted in stands that 26:1761-1768had received low to moderate N additions continuously Burton AJ, Pregitzer KS, Zogg GR Zak DR (1998) Drought reo
duces root respiration in sugar maple forests° Ecol Applfor many years, thereby avoiding the potential confound- 8:771-778ing influence on root loWgevity that could result from Deans JD (1979) Fluctuations of the soil environment and finechanges in root biomass following heavy N additions, root growth in a young sitka spruce plantation. Plant SoitStudying root longevity in small fertilized patches within • 52:195-208the root system (sensu Pregitzer et al. 1993) could pro- Eissenstat DM (1992) Costs and benefits of constructing roots ofsmall diameter. J Plant Nutr 15.:763-782vide an additional means of avoiding or assessing this Eissenstat DM, Yanai RD (1997) The ecology of root lifespan.potential problem. Adv Ecol Res 27:1--60
It is possible that no single theory can explain the ef- Espeleta JF, Eissenstat DM (1998) Responses of citrus fine rootsfects of N availab_llity on root longevity across all spe- to localized soil drying: a comparison of seedlings with adult.... fruiting trees. Tree Physiol 18:113-119cies. Trees such as aspen and sugar maple differ greatly Fahey TJ, Hughes JW (1994) Fine root dynamics in a northernin their aboveground strategies for resource acquisition, hardwood forest ecosystem, Hubbard Brook Experimentalso one must question whether it is reasonable to expect : Forest, NH. 1Ecol 82:533-548them to respond similarly belowground. In this study, Fox GA (1993) Failure-time analysis: emergence, flowering,
survivorship, and other waiting times. In: Scheiner SM,sugar maple roots lived longer at sites where N availabil- Gurevitch J (eds) Design and analysis of ecological experi-ity was greater. This is consistent with a cost-benefit ap- ments. Chapman Hall, New York, pp 253-289proach for determining root lifespan (Eissenstat 1992; Gholz HL, Hendry LC, Cropper WP Jr (1985) Organic matter dy-Eissenstat and Yanai 1997), in which roots are main- namics of fine roots of slash pine (Pinus elliottii) in north
tained longer in more fertile soils that can supply the Florida. Can J For Res 16:529-538Gower ST, Vogt KA, Grier CC (1992) Carbon dynamics of Rockyroots with nutrients over a longer period of time. We Mountain Douglas-fir: influence of water and nutrient avail°have also measured greater root respiration rates and N ability. Ecol Monogr 62:43-65concentrations for sugar maple at sites where N avail- Grime JP (1994) The role of plasticity in exploiting environmental
heterogeneity. In: Caldwell MM, Pearcy RW (eds) Exploita-ability is higher. We propose that greater metabolic ac- tion of environmental heterogeneity of plants: ecophysiologi-tivity for roots in nitrogen-rich soil leads to greater car- cal processes above- and betowground. Academic Press, Newbohydrate allocation to those roots, and that a reduction York, pp 1-20in root C sink strength when local nutrients are depleted Haynes BE, Gower ST (1995) Belowground carbon allocationmay provide a mechanism through which root lifespan is in unfertilized and fertilized red pine plantations in northernregulated in these forests. Wisconsin. Tree Physiol 15:317-325Hendrick RL, Pregitzer KS (1992a) The demography of fine roots
in a northern hardwood forest. Ecology 73:1094--1104Acknowledgements The authors thank Todd Chirko and Brian Hendrick RL, Pregitzer KS (1992b) Spatial variation in tree rootWoodring for their help installing minirhizotron tubes, Jody distribution and growth associated with minirhizotrons. PlantPetriekas and Dan Mouradian for help with image collection, and Soil 143:283-288Veronica Lessard who provided assistance with data analysis. Spe- Hendrick RL, Pregitzer KS (1993a) The dynamics of fine rootcial thanks goes to Trish Baril who spent countless hours digitiz- length, biomass and nitrogen content in two northern hard-ing root images. We also acknowledge the USDA Forest Service wood ecosystems. Can J For Res 23:2507-2520

• i 399
Hendrick RL, Pregitzer KS (1993b) Patterns of fine root mortality Pregitzer KS, Laskowski MJ, Burton AJ, Lessard VC, Zak DRin two sugar maple forests. Nature 361:59-61 (1998) Variation in northern hardwood root respiration with
Hendrick RL, Pregitzer KS (1996) Temporal and depth-related root diameter and soil depth. Tree Physiol 18:665-670patterns of fine root dynamics in northern hardwood forests. J Pregitzer KS, Zak DR, Maziasz J, DeForest J, Curtis PS, LusseahopEco184:167-176 J (2000) Interactive effects of atmospheric CO2and soil N avail-
Hendrick RL, Pregitzer KS (1997) The relationship between fine ability on free roots of Populus. Ecol Appl 10:18-33root demography and the soil environment in northern hard- Raich JW, Nadelhoffer KJ (1989) Belowground carbon allocationwood forests. Ecoscience 4:_9-105 in forest ecosystems: global trends. Ecology 70:1346-1354
Hendricks JJ, Nadelhoffer KJ, Aber JD (1993) Assessing the role Randlett DR, Zak DR, MacDonald NW (1992) Sulfate adsorptionof fine roots in carbon and nutrient cycling. Trends Ecol Evol and microbial immobilization in northern hardwood forests8:174-178 along an atmospheric deposition gradient Can J For Res
Joslin JD, Henderson GS (1987) Organic matter and nutrients as- 22:1843-1850sociated with fine root turnover in a white oak stand. For Sci Reich PB, Waiters MB, Ellsworth DS (1997) From tropics to tun-33:330-346 dra: global convergence in plant functioning. Proc Natl Acad
Joslin JD, Wolfe MH (1999)Disturbances during minirhizotron Sci 94:13730-13734installation can affect root observation data. Soil Sci Soc Am J Reich PB, Waiters MB, Ellsworth DS, Vose JM, Volin JC, Gresham63:218-221 C, Bowman WD (1998a) Relationships of leaf dark respiration
Keyes MR, Grier CC (1981) Above- and belowground net produc- to leaf nitrogen, specific leaf area and leaf life-span: a test acrosstion in 40 year old Douglas-fir stands on low and high produc- biomes and functional groups. Oecologia 114:471--482tivity sites. Can J For Res 11:599-605 Reich PB, Waiters MB, Tjoelker MG, Vanderldein D, Buschena C
Kuhns MR, Garrett HE, Teskey RO, Hinckley TM (1985) Root (1998b) Photosynthesis and respiration rate depend on leafgrowth of black walnut trees related to soil temperature, soil and root morphology and nitrogen concentration in nine borealwater potential and leaf water potential. For Sci 31:617-629 tree species differing in relative growth rate. Funct Ecol
Lee ET (1992) Statistical methods for survival data analysis, 2nd 12:395-405 :_edn. Wiley, New York Ruess RW, Van Cleve K, Y_ie J, Viereck LA (1996) Contribu-
MacDonald NW, Burton A J, Jurgensen MF, McLaughlin JW, tions of fine root producti6n and turnover to the carbon and ni-Mroz GD (1991) Variation in forest soil properties along a trogen cycling in taiga forests of the Alaskan interior. Can JGreat Lakes air pollution gradient. Soil Sci Soc Am J 55: ForRes 26:1326-13361709-1715 SAS Institute (1989) SAS/STAT user's guide, version 6, 4th edn,
Majdi H, Kangas P (1997) Demography of fine roots in response vol 2. SAS Institute, Caryto nutrient applications in a Norway spruce stand in south- Self GK, Brown TK, Graves J, Fitter AH (1995) Longevity andwestern Sweden. Ecoscience 4:199-205 respiration rates of roots of upland grassland species in rela-
McClaugherty CA, Aber JD, MeliUo JM (1982) The role of fine tion tO temperature and atmospheric CO 2 concentration (Ab-roots in the organic matter'and nitrogen budgets of two forest- stract). J Exp Bot 46 (Suppl):25ed ecosystems. Ecology 63:1481-1490 Teskey RO, Hinckley TM (1981) Influence of temperature and
Minchin PEH, Farrar JF, Thorpe MR (1994) Partitioning of Carbon water potential on root growth of white oak. Physiol Plantin split root systems of barley: effect of temperature of the 52:363-369root. J Exp Bot 45:1103-1109 Van Praag I/J, Sougnez-Remy S, Weissen K Carletti G (1988)
Morrow RR (1950) Periodicity and growth of sugar maple surface Root turnover in a beech and a spruce stand of the Belgian Ar-layer roots. J For 48:875-881 dennes. Plant Soil 105:87-103
Nadelhoffer KJ, Raich JW (1992) Fine root production estimates Vogt KA, Grief CC, Gower ST, Sprugel DG, Vogt DJ (1986a)and belowground6carbon allocation in forest ecosystems. Ecol- Overestimation of net root production: a real or imaginaryogy 73:1139-tlg'7 ....... problem? Ecology 67:577-579
Nadelhoffer KJ, Aber JD, Melillo JM (1985) Fine roots, net pri- Vogt KA, Grier CC, Vogt DJ (1986b) Production, turnover and nu-mary productivity, and soil nitrogen availability: a new hy- tritional dynamics of above-and belowground detritus of worldpothesis. Ecology 66:1377-1390 forests. Adv Ecol Res 15:303-307
Pregitzer KS, Hendrick RL, Fogel R (1993) The demography of /Vogt KA, Vogt DJ, Gower ST, Grier CC (1990) Carbon and nitro-fine roots in response to patches of water and nitrogen. New _ gen interactions for forest ecosystems. In: Persson H (ed)Phytol 125:575-580 '_ Above and belowground interactions in forest trees in acidi-
Pregitzer KS, Zak DR, Curtis PS, Kubiske ME, Teeri JA, Vogel fied soils (Environmental Research Programme, Air PollutionCS (1995) Atmospheric CO2, soil nitrogen and turnover of Report Series no. 32). Commission of the European Commu-fine roots. New Phytol 129:579-585 nity, Brussels, pp 203-235
Pregitzer KS, Kubiske ME, Yu CK, Hendrick RL (1997) Relation- Zogg GR Zak DR, Burton AJ, Pregitzer KS (1996) Fine root res--ships among root branch order, carbon, and nitrogen in four piration in northern hardwood forests in relation to tempera-temperate species. Oecologia 111:302-308 ture and nitrogen availability. Tree Physiol 16:719-725