Embed Size (px)
Citation preview
This document consists of 13 printed pages and 3 blank pages.
DC (LEG/SG) 112131/3© UCLES 2016 [Turn over
Cambridge International ExaminationsCambridge International General Certificate of Secondary Education
*0993917174*
BIOLOGY 0610/63
Paper 6 Alternative to Practical May/June 2016
1 hour
Candidates answer on the Question Paper.
No Additional Materials are required.
READ THESE INSTRUCTIONS FIRST
Write your Centre number, candidate number and name on all the work you hand in.Write in dark blue or black pen.You may use an HB pencil for any diagrams or graphs.Do not use staples, paper clips, glue or correction fluid.DO NOT WRITE IN ANY BARCODES.
Answer all questions.
Electronic calculators may be used.You may lose marks if you do not show your working or if you do not use appropriate units.
At the end of the examination, fasten all your work securely together.The number of marks is given in brackets [ ] at the end of each question or part question.
The syllabus is approved for use in England, Wales and Northern Ireland as a Cambridge International Level 1/Level 2 Certificate.
www.dynamicpapers.com
2
0610/63/M/J/16© UCLES 2016
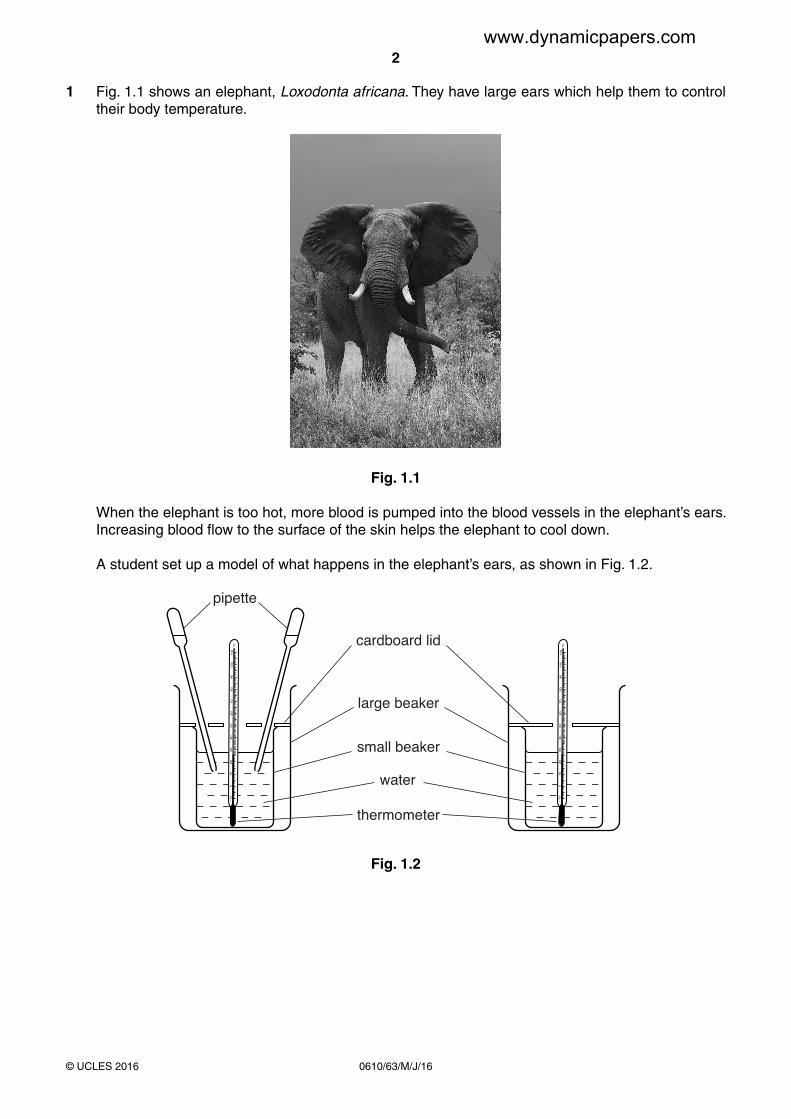
1 Fig. 1.1 shows an elephant, Loxodonta africana. They have large ears which help them to control their body temperature.
Fig. 1.1
When the elephant is too hot, more blood is pumped into the blood vessels in the elephant’s ears. Increasing blood flow to the surface of the skin helps the elephant to cool down.
A student set up a model of what happens in the elephant’s ears, as shown in Fig. 1.2.
–10
010
20
30
40
50
60
70
80
90
100
110
°C
–10
010
20
30
40
50
60
70
80
90
100
110
°C
large beaker
small beaker
water
thermometer
cardboard lid
pipette
Fig. 1.2
www.dynamicpapers.com
3
0610/63/M/J/16© UCLES 2016 [Turn over
They placed hot water into two small beakers and stood each one in a larger beaker. One of the small beakers had ‘ears’ and the other did not.
The ‘ears’ were represented by two plastic dropping pipettes. The student squeezed and released the pipette ears throughout the experiment so that water continuously moved out of and into the pipettes.
The student placed a cardboard lid on top of each small beaker. They made holes in the cardboard lids so that a thermometer and the pipettes could pass through them.
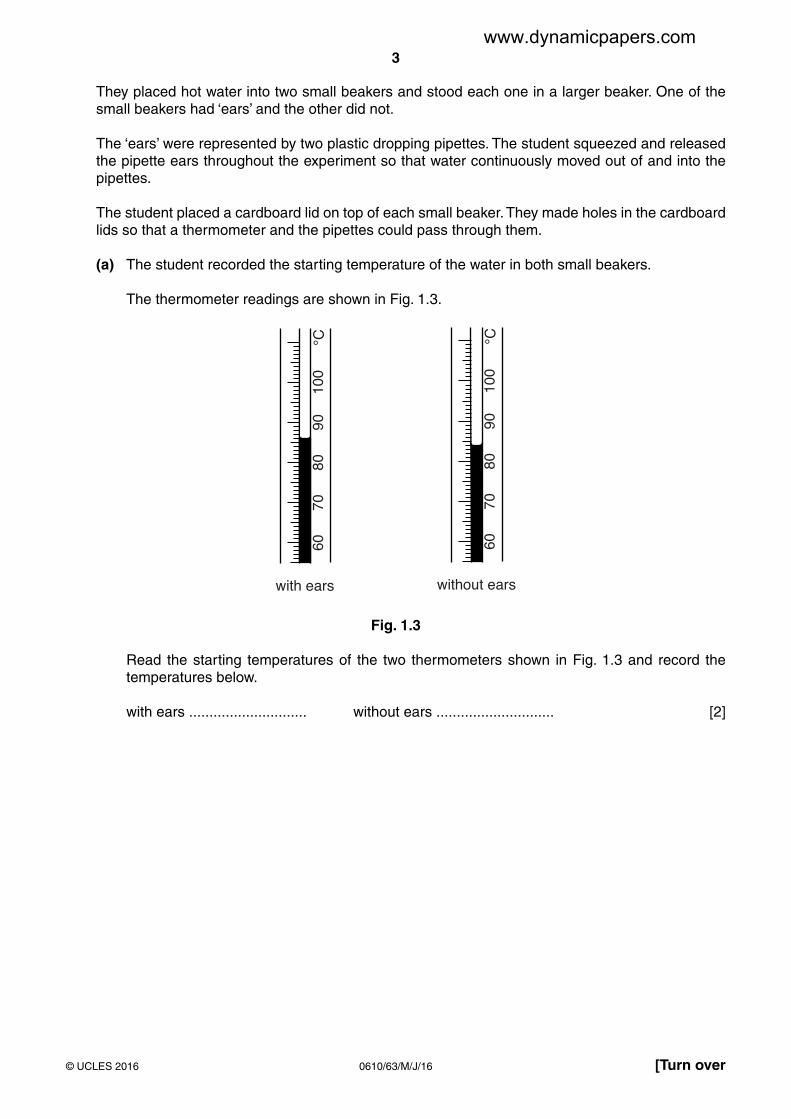
(a) The student recorded the starting temperature of the water in both small beakers.
The thermometer readings are shown in Fig. 1.3.60
7080
9010
0°C
with ears
6070
8090
100
°C
without ears
Fig. 1.3
Read the starting temperatures of the two thermometers shown in Fig. 1.3 and record the temperatures below.
with ears ............................. without ears ............................. [2]
www.dynamicpapers.com

4
0610/63/M/J/16© UCLES 2016
(b) The student measured and recorded the temperature of the hot water in both beakers every minute for a total of eight minutes.
The student obtained the results shown in Fig. 1.4.
With ears (pipettes) the temperature went down to 84 after a minute, then 80, 78, 76, 74, 72, 71 and finished at 70°C after 8 minutes.
Without the ears the other beaker of water dropped every minute to 83, 82, 81, 79, 78, 77, 76 and finished at 75.
Fig. 1.4
Prepare a table to record the observations shown in Fig. 1.4 and the starting temperatures from Fig. 1.3.
Complete the table by entering all of the results.
[4]
www.dynamicpapers.com
5
0610/63/M/J/16© UCLES 2016 [Turn over
(c) Suggest one safety precaution that should be taken during this experiment.
...................................................................................................................................................
...................................................................................................................................................
...............................................................................................................................................[1]
(d) (i) A student repeated this experiment and calculated the change in temperature of the water each minute for eight minutes in both small beakers.
The change in temperature in the small beaker with pipette ears was 18 °C.
The change in temperature in the small beaker without pipette ears was 11 °C.
Explain why it is important to calculate the change in temperature in each beaker.
...........................................................................................................................................
...........................................................................................................................................
...........................................................................................................................................
...........................................................................................................................................
.......................................................................................................................................[2]
(ii) Use the information in part (d)(i) to calculate the rate of temperature change in the small beaker with pipette ears for the student’s experiment.
Show your working.
Give your answer to two significant figures.
rate of temperature change ..............................................°C per min [2]
(e) (i) Suggest why the student used cardboard lids on top of each of the small beakers.
...........................................................................................................................................
...........................................................................................................................................
.......................................................................................................................................[1]
www.dynamicpapers.com

6
0610/63/M/J/16© UCLES 2016
(ii) Suggest and explain one source of error in the method as a result of using the cardboard lids.
...........................................................................................................................................
...........................................................................................................................................
.......................................................................................................................................[2]
(iii) Suggest two improvements which could be made to the method, other than changing the cardboard lids.
1 ........................................................................................................................................
...........................................................................................................................................
...........................................................................................................................................
2 ........................................................................................................................................
...........................................................................................................................................
........................................................................................................................................... [2]
(f) Fig. 1.5 shows a different species of elephant, Elephas maximus, to the one shown in Fig. 1.1.
Fig. 1.5
(i) State one visible difference between the ears of the elephant in Fig. 1.5 and those of the elephant shown in Fig. 1.1.
...........................................................................................................................................
.......................................................................................................................................[1]
www.dynamicpapers.com

7
0610/63/M/J/16© UCLES 2016 [Turn over
(ii) Based on this difference and the results of the student’s experiment in part (d)(i), what can you conclude about the environmental conditions that the elephant shown in Fig. 1.5 lives in compared to the elephant in Fig. 1.1?
...........................................................................................................................................
...........................................................................................................................................
.......................................................................................................................................[1]
[Total: 18]
www.dynamicpapers.com
8
0610/63/M/J/16© UCLES 2016
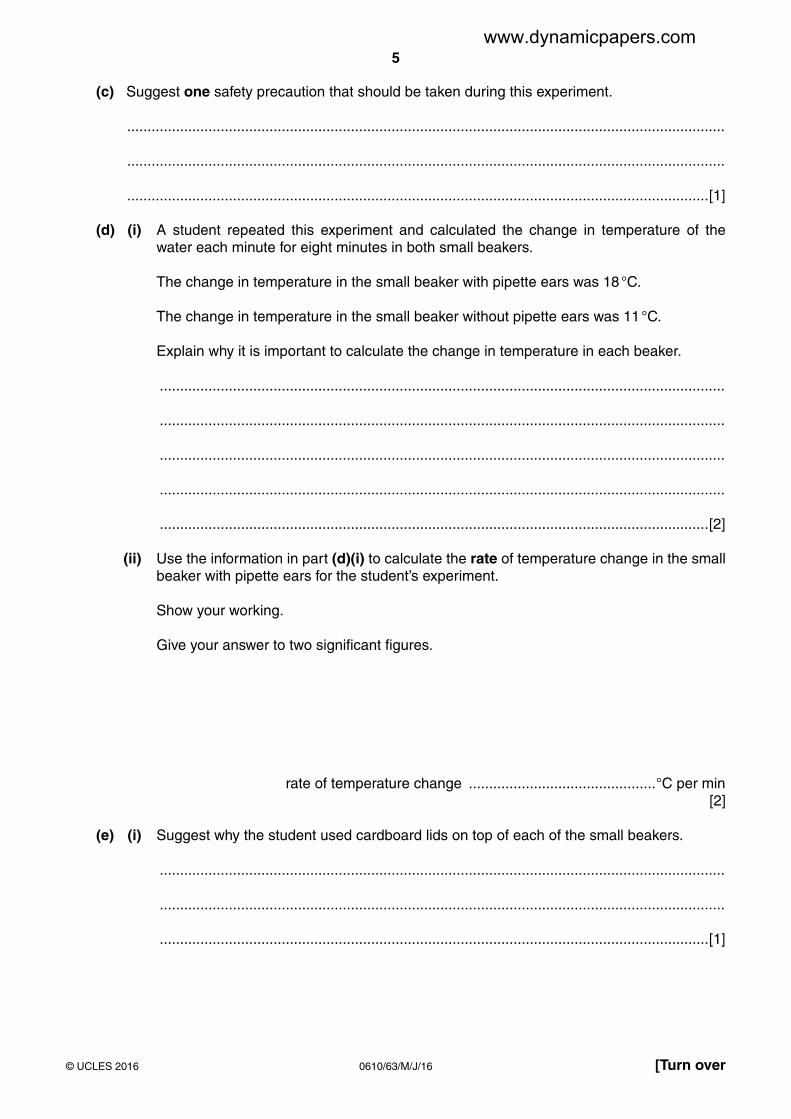
2 A student placed the cut end of a celery stick into a coloured dye as shown in Fig. 2.1.
Fig. 2.1
The student left the celery stick in the dye for five minutes and then removed it.
The student cut a 0.5 cm slice from the end of the celery stick that had been in the dye.
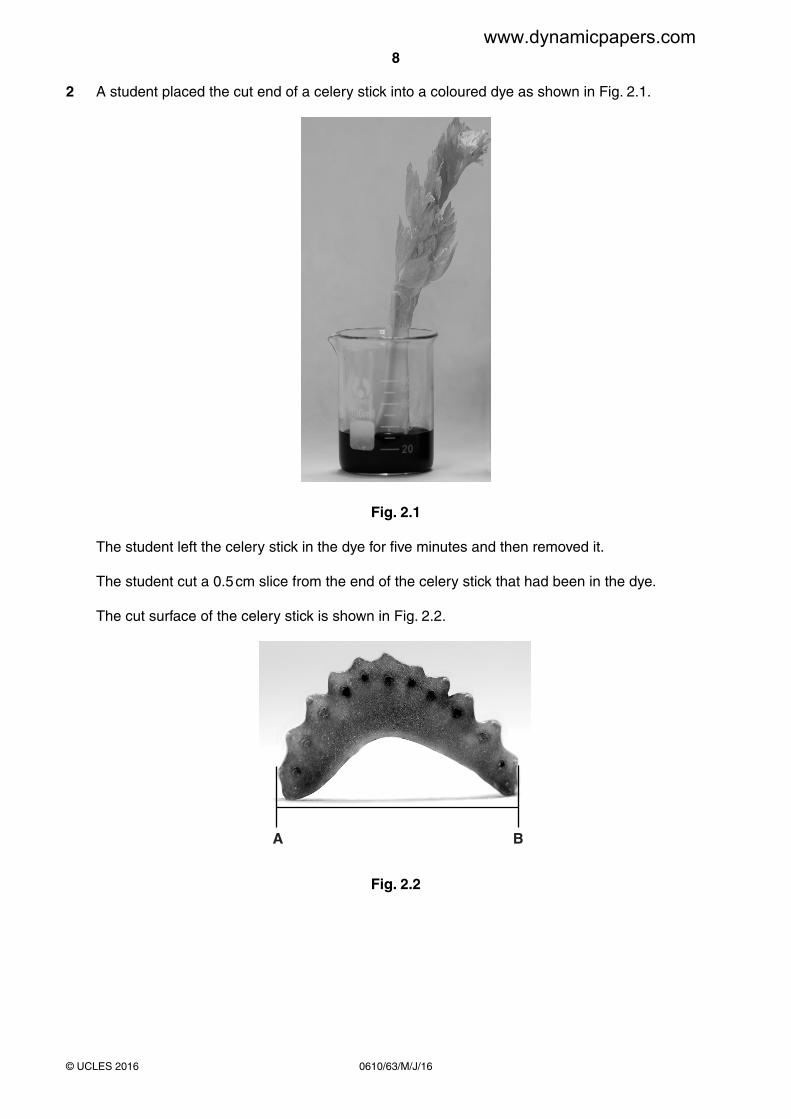
The cut surface of the celery stick is shown in Fig. 2.2.
A B
Fig. 2.2
www.dynamicpapers.com
9
0610/63/M/J/16© UCLES 2016 [Turn over
(a) Make a large drawing of the piece of celery shown in Fig. 2.2.
Label, with the letter D, a part of the celery stick that has been coloured by the dye.
[4]
www.dynamicpapers.com

10
0610/63/M/J/16© UCLES 2016
(b) The size of the piece of celery in Fig. 2.2 is shown by the line AB.
Measure the length of AB on Fig. 2.2.
length of AB on Fig. 2.2 …………………………… mm
Mark on your drawing a line in the same position as the line AB on Fig 2.2.
Measure this line.
length of line on drawing………………………………………..mm
magnification = length of line on drawing
length of AB
Calculate the magnification of your drawing using the information above and your answers.
Show your working.
Give your answer to the nearest whole number.
magnification ...............................................................[3]
(c) It is possible to measure how far the dye has travelled up the celery stick.
This is done by cutting 0.5 cm pieces from the end of the celery stick (that has been in the dye) and counting how many pieces are cut before the dye is no longer visible.
(i) A student cut seven 0.5 cm pieces from the end of a celery stick before the dye was no longer visible.
Calculate how far up the celery stick the dye had travelled. Write your answer in millimetres.
......................................................... mm [1]
www.dynamicpapers.com
11
0610/63/M/J/16© UCLES 2016 [Turn over
(ii) Plan an experiment, similar to that carried out by the student, to investigate the effect of leaf area on the rate of water uptake by a celery stick.
...........................................................................................................................................
...........................................................................................................................................
...........................................................................................................................................
...........................................................................................................................................
...........................................................................................................................................
...........................................................................................................................................
...........................................................................................................................................
...........................................................................................................................................
...........................................................................................................................................
...........................................................................................................................................
...........................................................................................................................................
...........................................................................................................................................
.......................................................................................................................................[6]
[Total: 14]
www.dynamicpapers.com
12
0610/63/M/J/16© UCLES 2016
3 Table 3.1 shows the relationship between an animal’s life expectancy and its heart rate.
Table 3.1
life expectancy / years heart rate / beats per min
1 300
16 200
18 150
26 40
30 20
(a) Plot a graph of the data in Table 3.1 on the grid.
You should include a straight line of best fit on the graph.
[4]
www.dynamicpapers.com
13
0610/63/M/J/16© UCLES 2016
(b) Use the data to describe the trend shown by the graph.
...................................................................................................................................................
...................................................................................................................................................
...................................................................................................................................................
...................................................................................................................................................
...............................................................................................................................................[2]
(c) Cows have an average heart rate of 60 beats per minute.
Use your graph to predict the life expectancy of a cow.
Show on the graph how you obtained your answer.
...................................................... years [2]
[Total: 8]
www.dynamicpapers.com

14
0610/63/M/J/16© UCLES 2016
BLANK PAGE
www.dynamicpapers.com

15
0610/63/M/J/16© UCLES 2016
BLANK PAGE
www.dynamicpapers.com

16
0610/63/M/J/16© UCLES 2016
Permission to reproduce items where third-party owned material protected by copyright is included has been sought and cleared where possible. Every reasonable effort has been made by the publisher (UCLES) to trace copyright holders, but if any items requiring clearance have unwittingly been included, the publisher will be pleased to make amends at the earliest possible opportunity.
To avoid the issue of disclosure of answer-related information to candidates, all copyright acknowledgements are reproduced online in the Cambridge International Examinations Copyright Acknowledgements Booklet. This is produced for each series of examinations and is freely available to download at www.cie.org.uk after the live examination series.
Cambridge International Examinations is part of the Cambridge Assessment Group. Cambridge Assessment is the brand name of University of Cambridge Local Examinations Syndicate (UCLES), which is itself a department of the University of Cambridge.
BLANK PAGE
www.dynamicpapers.com