Embed Size (px)
Citation preview
Care ContinuumOptimization
Data enabled analytics
August 10, 2017
2© 2017 KPMG LLP, a Delaware limited liability partnership and the U.S. member firm of the KPMG network of independent member firms affiliated with KPMG International
Cooperative (“KPMG International”), a Swiss entity. All rights reserved. NDPPS 690650
These pressures are affecting every player in healthcare
3© 2017 KPMG LLP, a Delaware limited liability partnership and the U.S. member firm of the KPMG network of independent member firms affiliated with KPMG International
Cooperative (“KPMG International”), a Swiss entity. All rights reserved. NDPPS 690650
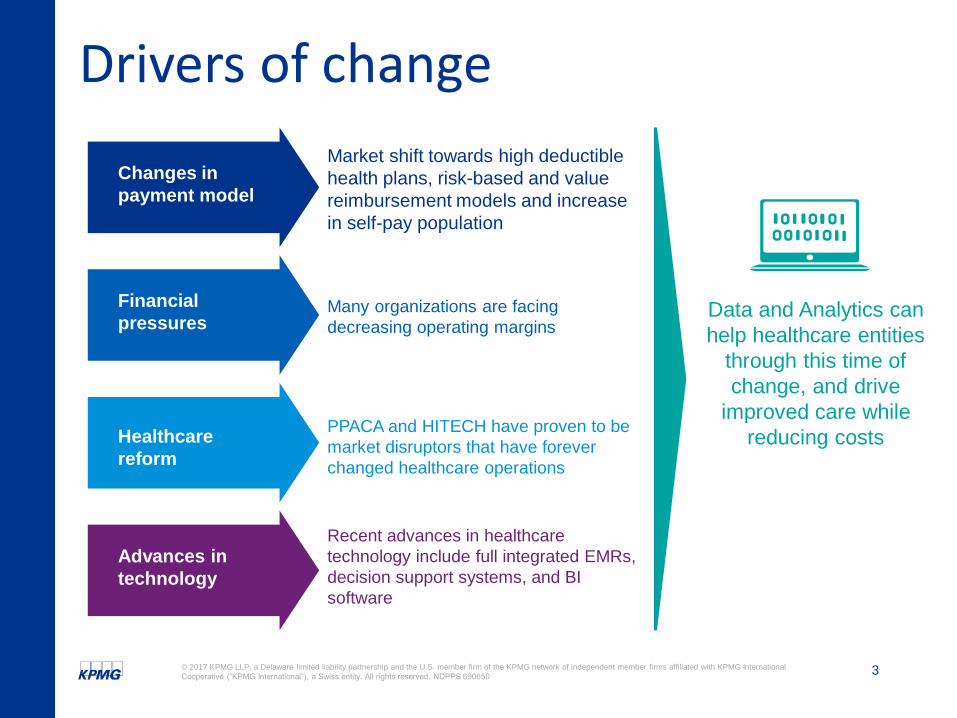
Drivers of change
Advances in
technology
Healthcare
reform
Financial
pressures
Recent advances in healthcare
technology include full integrated EMRs,
decision support systems, and BI
software
PPACA and HITECH have proven to be
market disruptors that have forever
changed healthcare operations
Many organizations are facing
decreasing operating margins
Market shift towards high deductible
health plans, risk-based and value
reimbursement models and increase
in self-pay population
Changes in
payment model
Data and Analytics can
help healthcare entities
through this time of
change, and drive
improved care while
reducing costs
4© 2017 KPMG LLP, a Delaware limited liability partnership and the U.S. member firm of the KPMG network of independent member firms affiliated with KPMG International
Cooperative (“KPMG International”), a Swiss entity. All rights reserved. NDPPS 690650
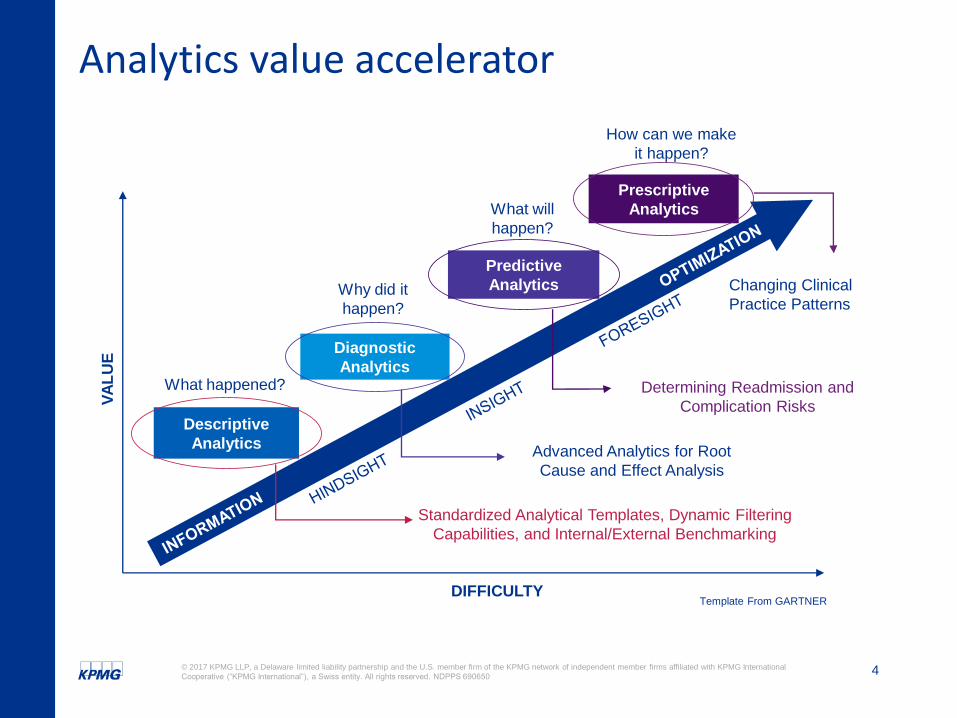
Analytics value acceleratorV
AL
UE
DIFFICULTY
Descriptive
Analytics
Diagnostic
Analytics
Predictive
Analytics
Prescriptive
Analytics
What happened?
Why did it
happen?
What will
happen?
How can we make
it happen?
Standardized Analytical Templates, Dynamic Filtering
Capabilities, and Internal/External Benchmarking
Advanced Analytics for Root
Cause and Effect Analysis
Determining Readmission and
Complication Risks
Template From GARTNER
Changing Clinical
Practice Patterns
5© 2017 KPMG LLP, a Delaware limited liability partnership and the U.S. member firm of the KPMG network of independent member firms affiliated with KPMG International
Cooperative (“KPMG International”), a Swiss entity. All rights reserved. NDPPS 690650
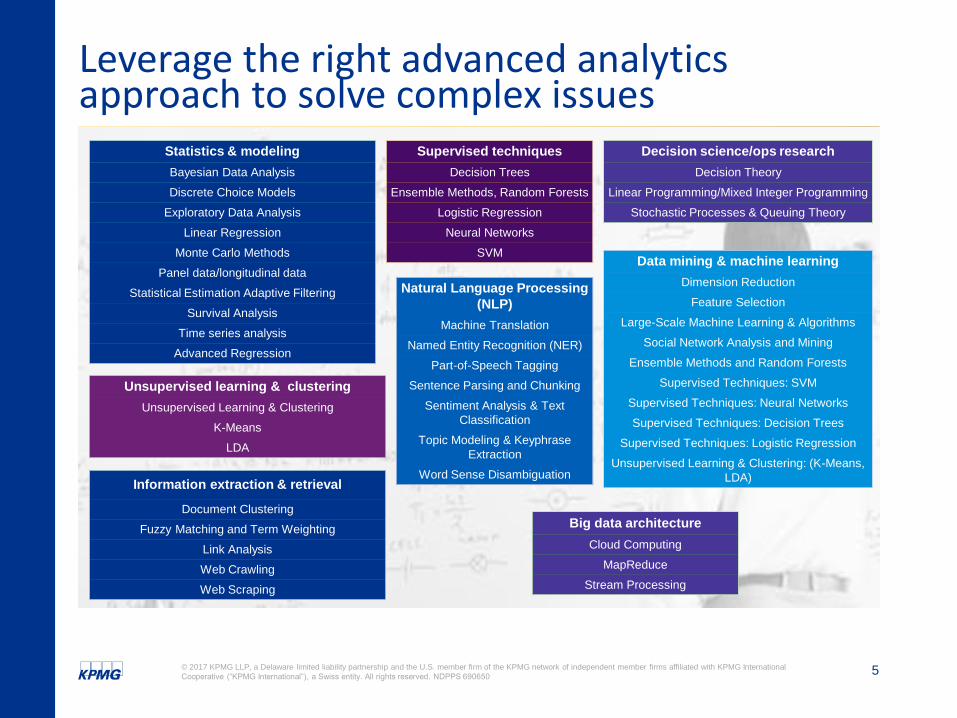
Information extraction & retrieval
Document Clustering
Fuzzy Matching and Term Weighting
Link Analysis
Web Crawling
Web Scraping
Data mining & machine learning
Dimension Reduction
Feature Selection
Large-Scale Machine Learning & Algorithms
Social Network Analysis and Mining
Ensemble Methods and Random Forests
Supervised Techniques: SVM
Supervised Techniques: Neural Networks
Supervised Techniques: Decision Trees
Supervised Techniques: Logistic Regression
Unsupervised Learning & Clustering: (K-Means,
LDA)
Unsupervised learning & clustering
Unsupervised Learning & Clustering
K-Means
LDA
Big data architecture
Cloud Computing
MapReduce
Stream Processing
Natural Language Processing
(NLP)
Machine Translation
Named Entity Recognition (NER)
Part-of-Speech Tagging
Sentence Parsing and Chunking
Sentiment Analysis & Text
Classification
Topic Modeling & Keyphrase
Extraction
Word Sense Disambiguation
Statistics & modeling
Bayesian Data Analysis
Discrete Choice Models
Exploratory Data Analysis
Linear Regression
Monte Carlo Methods
Panel data/longitudinal data
Statistical Estimation Adaptive Filtering
Survival Analysis
Time series analysis
Advanced Regression
Supervised techniques
Decision Trees
Ensemble Methods, Random Forests
Logistic Regression
Neural Networks
SVM
Decision science/ops research
Decision Theory
Linear Programming/Mixed Integer Programming
Stochastic Processes & Queuing Theory
Leverage the right advanced analytics approach to solve complex issues
6© 2017 KPMG LLP, a Delaware limited liability partnership and the U.S. member firm of the KPMG network of independent member firms affiliated with KPMG International
Cooperative (“KPMG International”), a Swiss entity. All rights reserved. NDPPS 690650
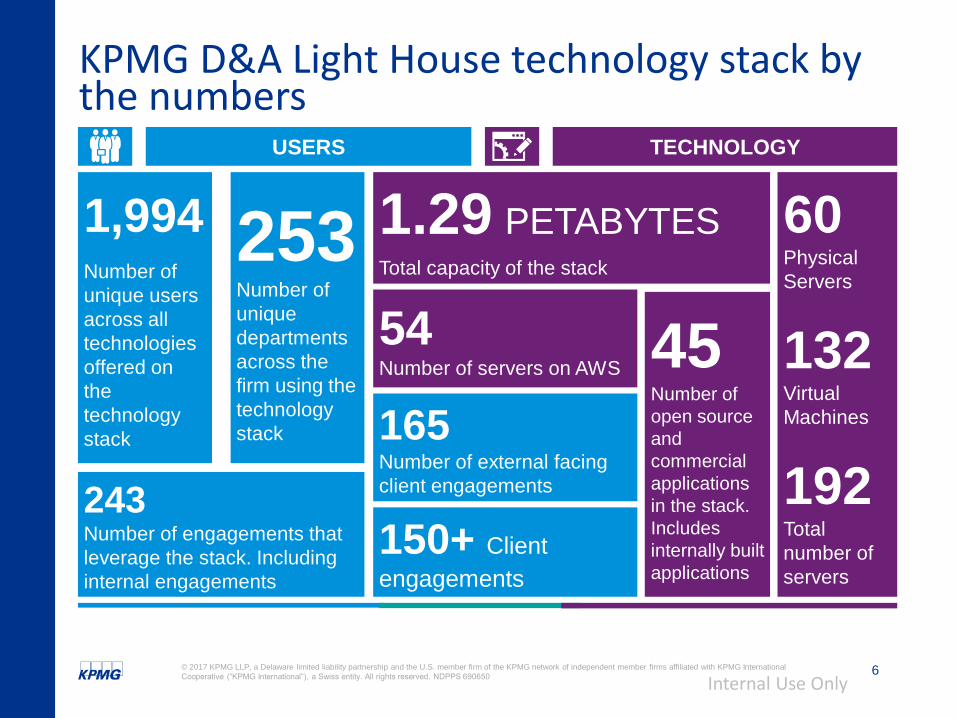
KPMG D&A Light House technology stack by the numbers
1,994Number of
unique users
across all
technologies
offered on
the
technology
stack
253Number of
unique
departments
across the
firm using the
technology
stack
243Number of engagements that
leverage the stack. Including
internal engagements
USERS
1.29 PETABYTESTotal capacity of the stack
45Number of
open source
and
commercial
applications
in the stack.
Includes
internally built
applications
60Physical
Servers
132Virtual
Machines
192Total
number of
servers
165Number of external facing
client engagements
54Number of servers on AWS
TECHNOLOGY
150+ Client
engagements
Internal Use Only
7© 2017 KPMG LLP, a Delaware limited liability partnership and the U.S. member firm of the KPMG network of independent member firms affiliated with KPMG International
Cooperative (“KPMG International”), a Swiss entity. All rights reserved. NDPPS 690650
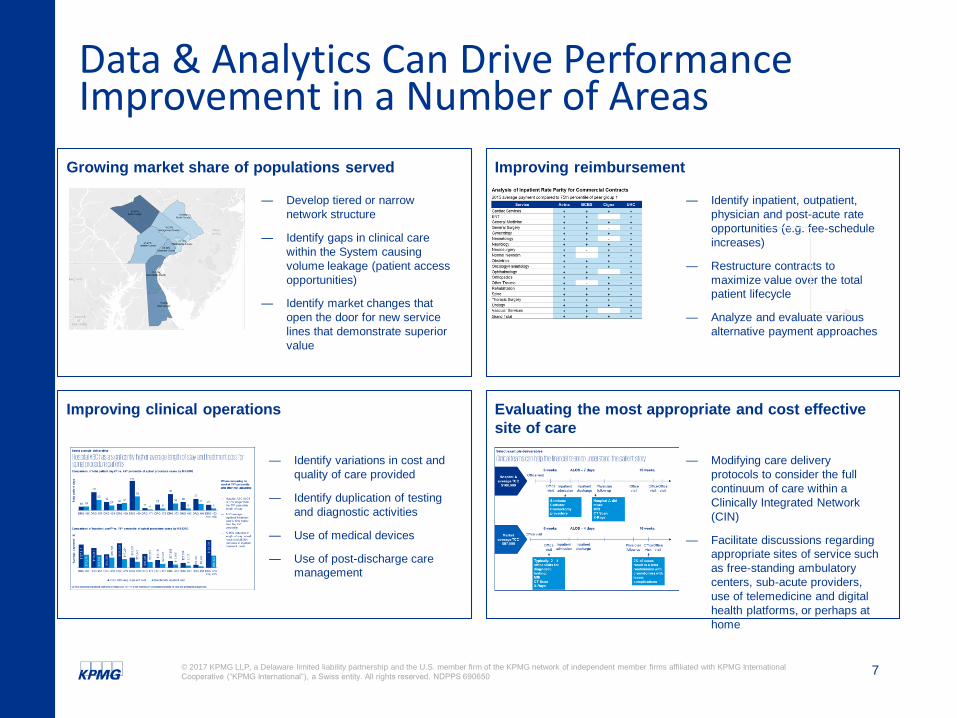
Data & Analytics Can Drive Performance Improvement in a Number of Areas
Growing market share of populations served
Improving clinical operations
Improving reimbursement
Evaluating the most appropriate and cost effective
site of care
— Develop tiered or narrow
network structure
— Identify gaps in clinical care
within the System causing
volume leakage (patient access
opportunities)
— Identify market changes that
open the door for new service
lines that demonstrate superior
value
— Identify inpatient, outpatient,
physician and post-acute rate
opportunities (e.g. fee-schedule
increases)
— Restructure contracts to
maximize value over the total
patient lifecycle
— Analyze and evaluate various
alternative payment approaches
— Identify variations in cost and
quality of care provided
— Identify duplication of testing
and diagnostic activities
— Use of medical devices
— Use of post-discharge care
management
— Modifying care delivery
protocols to consider the full
continuum of care within a
Clinically Integrated Network
(CIN)
— Facilitate discussions regarding
appropriate sites of service such
as free-standing ambulatory
centers, sub-acute providers,
use of telemedicine and digital
health platforms, or perhaps at
home
8© 2017 KPMG LLP, a Delaware limited liability partnership and the U.S. member firm of the KPMG network of independent member firms affiliated with KPMG International
Cooperative (“KPMG International”), a Swiss entity. All rights reserved. NDPPS 690650
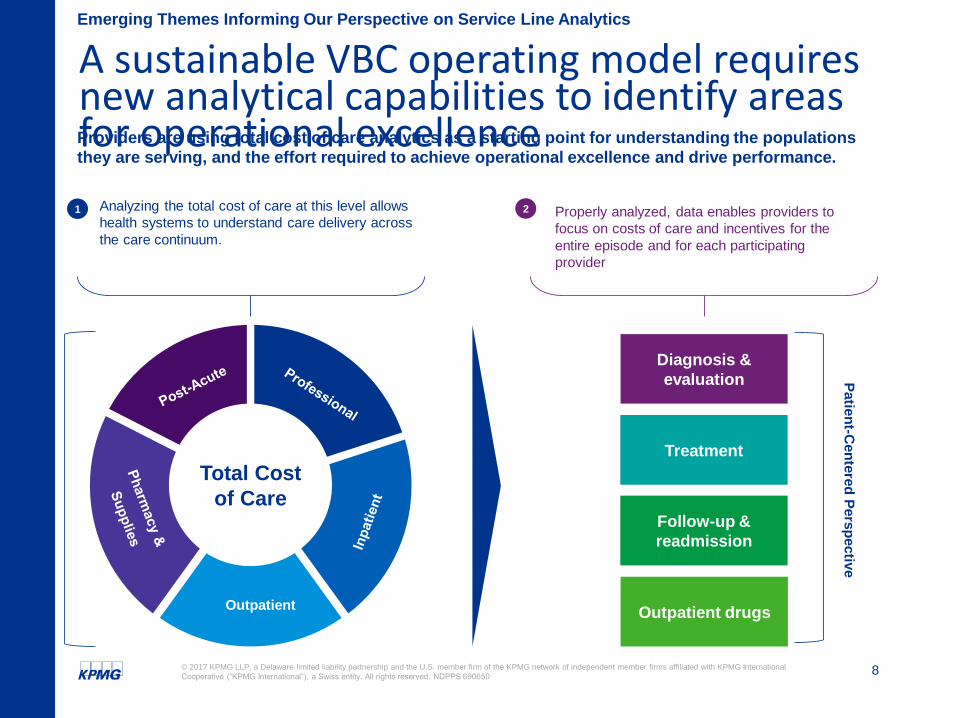
A sustainable VBC operating model requires new analytical capabilities to identify areas for operational excellence
Emerging Themes Informing Our Perspective on Service Line Analytics
Providers are using total cost of care analytics as a starting point for understanding the populations
they are serving, and the effort required to achieve operational excellence and drive performance.
Total Cost
of Care
Outpatient
Diagnosis &
evaluation
Treatment
Follow-up &
readmission
Outpatient drugs
Properly analyzed, data enables providers to
focus on costs of care and incentives for the
entire episode and for each participating
provider
Analyzing the total cost of care at this level allows
health systems to understand care delivery across
the care continuum.
Ind
ivid
ual
Sil
oes o
f C
are
Patie
nt-C
en
tere
d P
ers
pectiv
e
1 2
9© 2017 KPMG LLP, a Delaware limited liability partnership and the U.S. member firm of the KPMG network of independent member firms affiliated with KPMG International
Cooperative (“KPMG International”), a Swiss entity. All rights reserved. NDPPS 690650
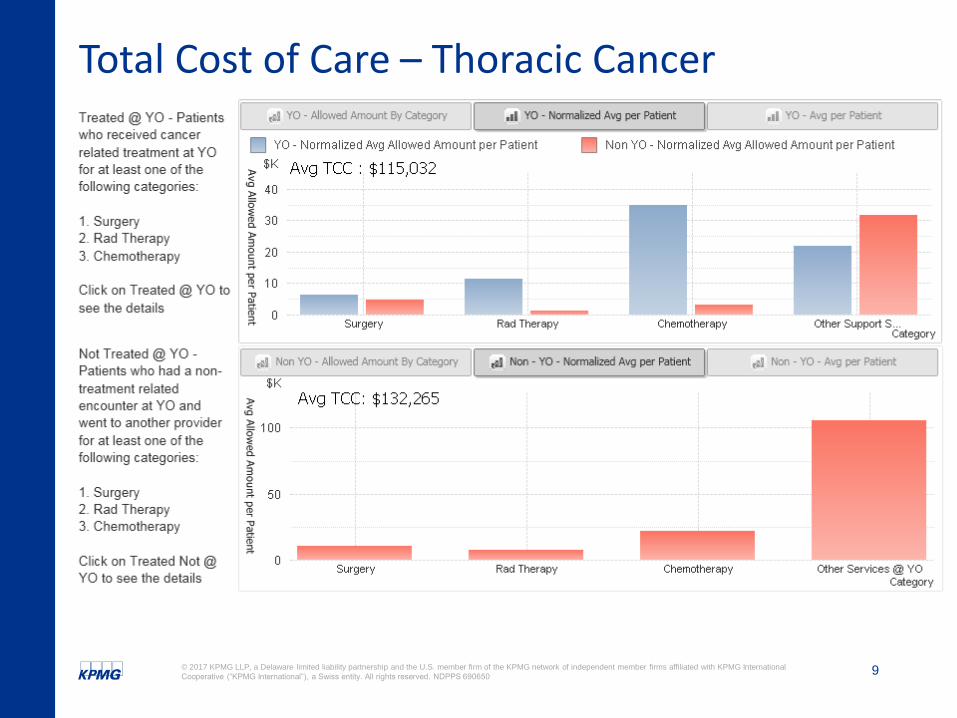
Total Cost of Care – Thoracic Cancer
10© 2017 KPMG LLP, a Delaware limited liability partnership and the U.S. member firm of the KPMG network of independent member firms affiliated with KPMG International
Cooperative (“KPMG International”), a Swiss entity. All rights reserved. NDPPS 690650
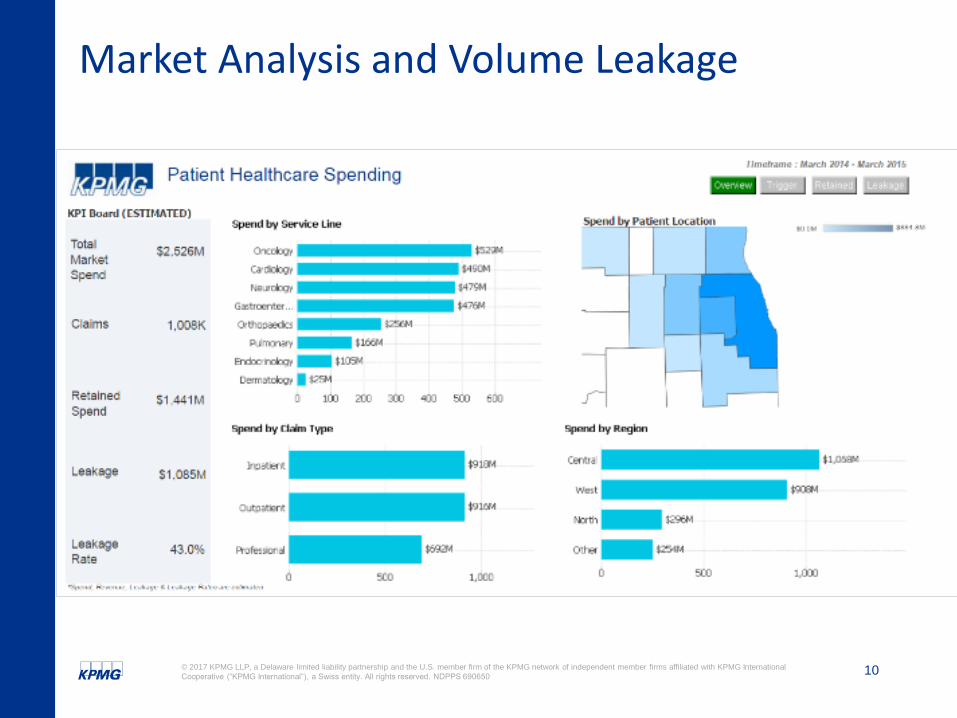
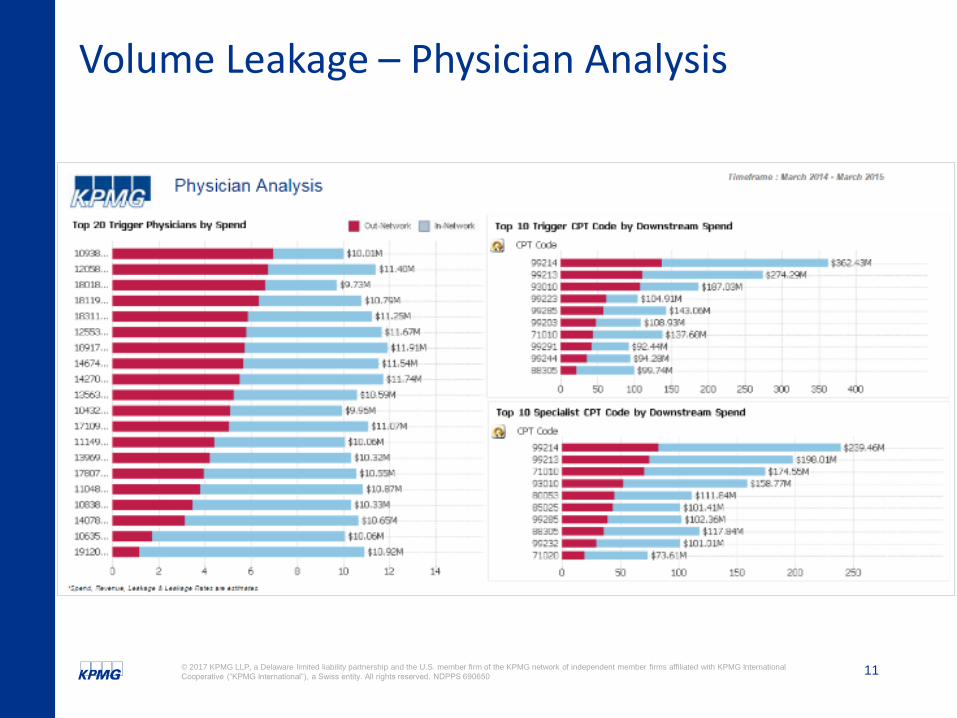
Market Analysis and Volume Leakage
11© 2017 KPMG LLP, a Delaware limited liability partnership and the U.S. member firm of the KPMG network of independent member firms affiliated with KPMG International
Cooperative (“KPMG International”), a Swiss entity. All rights reserved. NDPPS 690650
Volume Leakage – Physician Analysis
12© 2017 KPMG LLP, a Delaware limited liability partnership and the U.S. member firm of the KPMG network of independent member firms affiliated with KPMG International
Cooperative (“KPMG International”), a Swiss entity. All rights reserved. NDPPS 690650
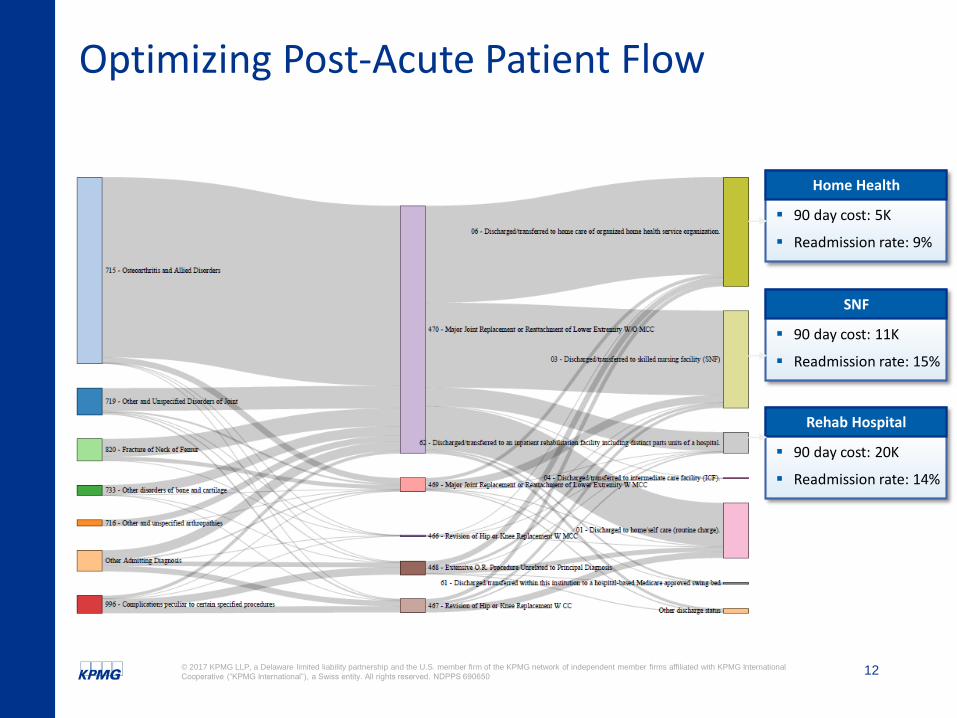
Optimizing Post-Acute Patient Flow
▪ 90 day cost: 5K
▪ Readmission rate: 9%
Home Health
▪ 90 day cost: 11K
▪ Readmission rate: 15%
SNF
▪ 90 day cost: 20K
▪ Readmission rate: 14%
Rehab Hospital
Care Continuum Optimization (CCO)
14© 2017 KPMG LLP, a Delaware limited liability partnership and the U.S. member firm of the KPMG network of independent member firms affiliated with KPMG International
Cooperative (“KPMG International”), a Swiss entity. All rights reserved. NDPPS 690650
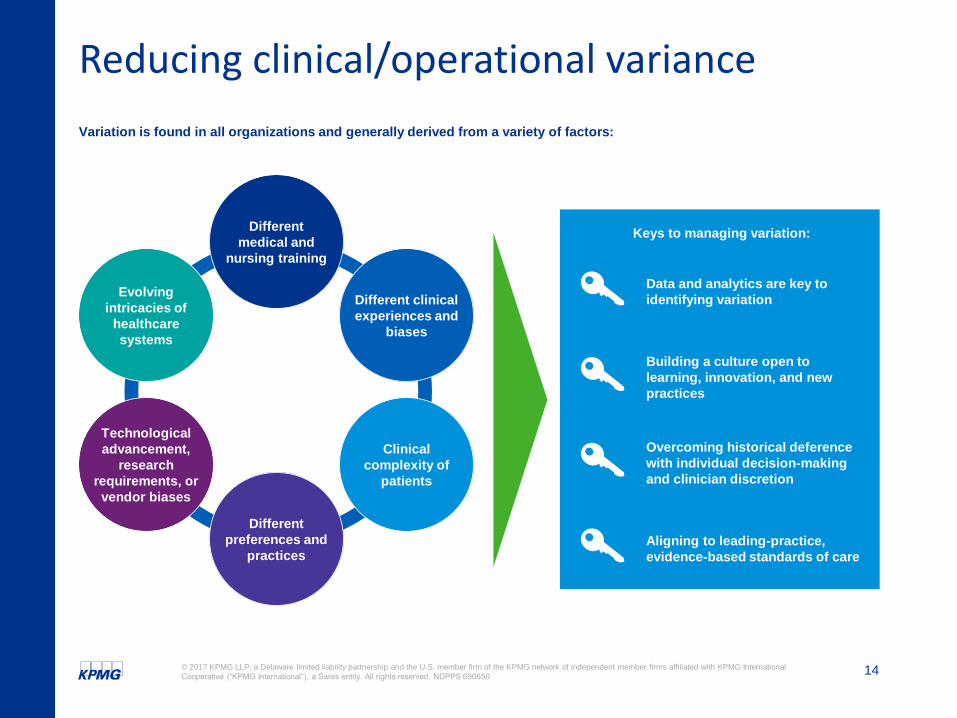
Reducing clinical/operational variance
Variation is found in all organizations and generally derived from a variety of factors:
Keys to managing variation:Different
medical and
nursing training
Different clinical
experiences and
biases
Clinical
complexity of
patients
Different
preferences and
practices
Technological
advancement,
research
requirements, or
vendor biases
Evolving
intricacies of
healthcare
systems
Data and analytics are key to
identifying variation
Building a culture open to
learning, innovation, and new
practices
Overcoming historical deference
with individual decision-making
and clinician discretion
Aligning to leading-practice,
evidence-based standards of care
15© 2017 KPMG LLP, a Delaware limited liability partnership and the U.S. member firm of the KPMG network of independent member firms affiliated with KPMG International
Cooperative (“KPMG International”), a Swiss entity. All rights reserved. NDPPS 690650
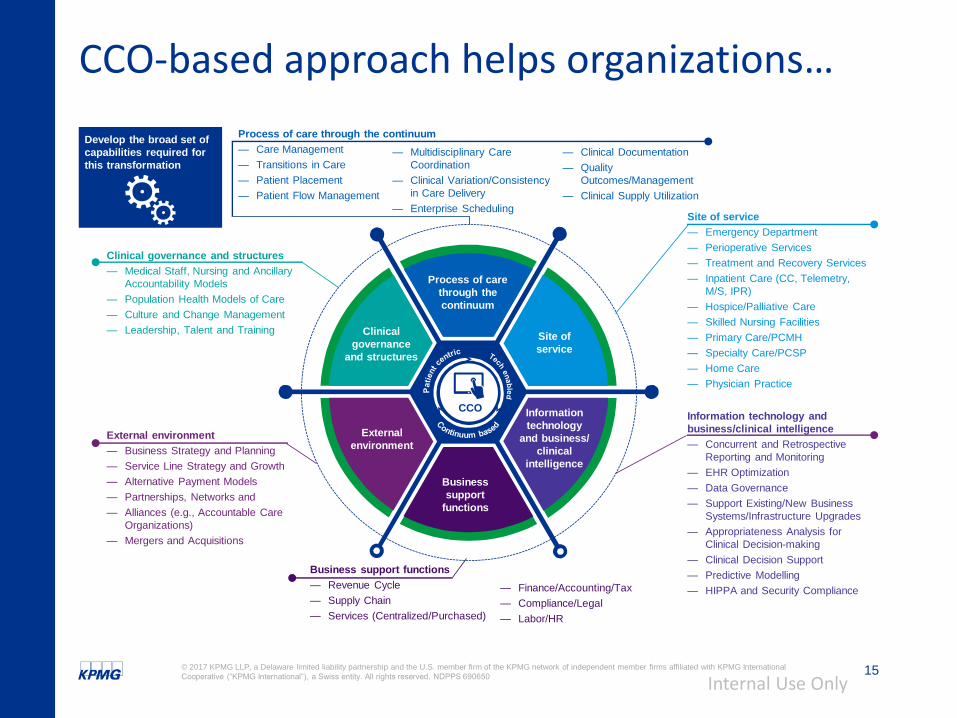
Business support functions
— Revenue Cycle
— Supply Chain
— Services (Centralized/Purchased)
Clinical governance and structures
— Medical Staff, Nursing and Ancillary
Accountability Models
— Population Health Models of Care
— Culture and Change Management
— Leadership, Talent and Training
Process of care through the continuum
— Care Management
— Transitions in Care
— Patient Placement
— Patient Flow Management
Site of service
— Emergency Department
— Perioperative Services
— Treatment and Recovery Services
— Inpatient Care (CC, Telemetry,
M/S, IPR)
— Hospice/Palliative Care
— Skilled Nursing Facilities
— Primary Care/PCMH
— Specialty Care/PCSP
— Home Care
— Physician Practice
— Finance/Accounting/Tax
— Compliance/Legal
— Labor/HR
PQMO
Process of care
through the
continuum
Site of
service
Information
technology
and business/
clinical
intelligence
External
environment
Business
support
functions
Clinical
governance
and structures
— Multidisciplinary Care
Coordination
— Clinical Variation/Consistency
in Care Delivery
— Enterprise Scheduling
— Clinical Documentation
— Quality
Outcomes/Management
— Clinical Supply Utilization
Information technology and
business/clinical intelligence
— Concurrent and Retrospective
Reporting and Monitoring
— EHR Optimization
— Data Governance
— Support Existing/New Business
Systems/Infrastructure Upgrades
— Appropriateness Analysis for
Clinical Decision-making
— Clinical Decision Support
— Predictive Modelling
— HIPPA and Security Compliance
External environment
— Business Strategy and Planning
— Service Line Strategy and Growth
— Alternative Payment Models
— Partnerships, Networks and
— Alliances (e.g., Accountable Care
Organizations)
— Mergers and Acquisitions
CCO
Develop the broad set of
capabilities required for
this transformation
CCO-based approach helps organizations…
Internal Use Only
16© 2017 KPMG LLP, a Delaware limited liability partnership and the U.S. member firm of the KPMG network of independent member firms affiliated with KPMG International
Cooperative (“KPMG International”), a Swiss entity. All rights reserved. NDPPS 690650
CCO data driven approach
Develop hypothesis
Solution helps client determine areas of process and outcome improvements by
answering questions such as:
— Are there particular discharge units that are taking longer to discharge patients?
— Are there any service charges that are getting applied unnecessarily?
— Has there been incorrect/missing clinical documentation to support accurate health
conditions?
— What is driving variation in care?
Improve business outcomes
Process and work-stream optimizations will help client measure and track the impact on
key strategic measures by
— Reduced avoidable costs
— Drive quality metrics
— Increased reimbursement
— Optimized use of resources
17© 2017 KPMG LLP, a Delaware limited liability partnership and the U.S. member firm of the KPMG network of independent member firms affiliated with KPMG International
Cooperative (“KPMG International”), a Swiss entity. All rights reserved. NDPPS 690650
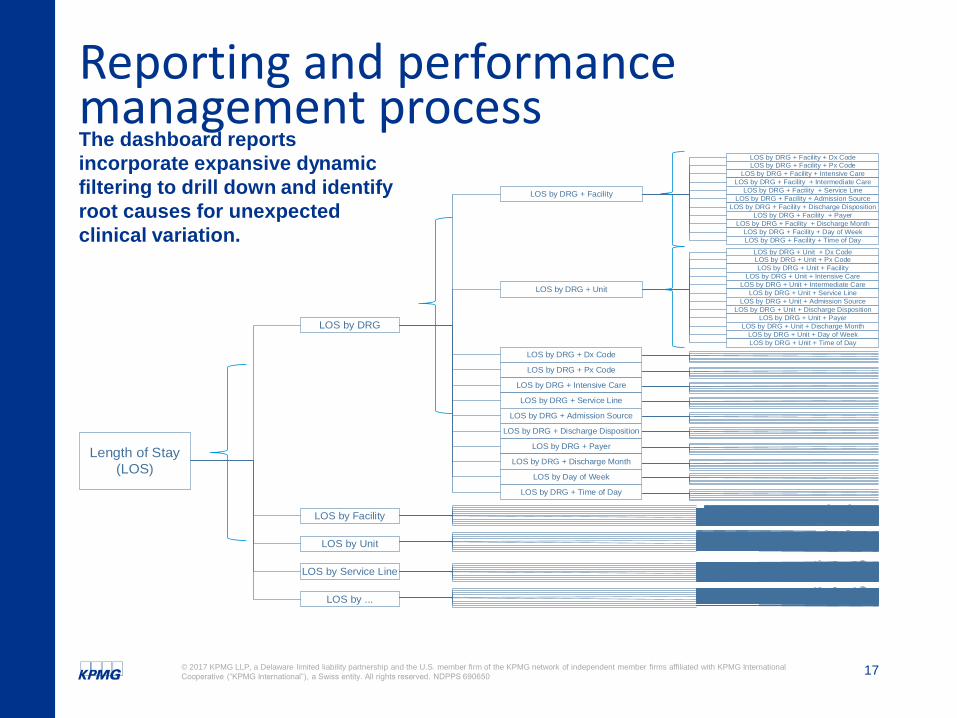
Reporting and performance management processThe dashboard reports
incorporate expansive dynamic
filtering to drill down and identify
root causes for unexpected
clinical variation.
Length of Stay
(LOS)
LOS by DRG
LOS by DRG + Dx Code
LOS by DRG + Px Code
LOS by DRG + Unit
LOS by DRG + Facility
LOS by DRG + Intensive Care
LOS by DRG + Service Line
LOS by DRG + Admission Source
LOS by DRG + Discharge Disposition
LOS by DRG + Payer
LOS by DRG + Discharge Month
LOS by Day of Week
LOS by DRG + Time of Day
LOS by DRG + Unit + Dx CodeLOS by DRG + Unit + Px Code
LOS by DRG + Unit + Facility
LOS by DRG + Unit + Intensive Care
LOS by DRG + Unit + Intermediate Care
LOS by DRG + Unit + Service Line
LOS by DRG + Unit + Admission Source
LOS by DRG + Unit + Discharge Disposition
LOS by DRG + Unit + Payer
LOS by DRG + Unit + Discharge Month
LOS by DRG + Unit + Day of Week
LOS by DRG + Unit + Time of Day
LOS by DRG + Facility + Dx CodeLOS by DRG + Facility + Px Code
LOS by DRG + Facility + Intensive Care
LOS by DRG + Facility + Intermediate Care
LOS by DRG + Facility + Service Line
LOS by DRG + Facility + Admission Source
LOS by DRG + Facility + Discharge Disposition
LOS by DRG + Facility + Payer
LOS by DRG + Facility + Discharge Month
LOS by DRG + Facility + Day of Week
LOS by DRG + Facility + Time of Day
LOS by Facility
LOS by Unit
LOS by Service Line
LOS by ...
18© 2017 KPMG LLP, a Delaware limited liability partnership and the U.S. member firm of the KPMG network of independent member firms affiliated with KPMG International
Cooperative (“KPMG International”), a Swiss entity. All rights reserved. NDPPS 690650
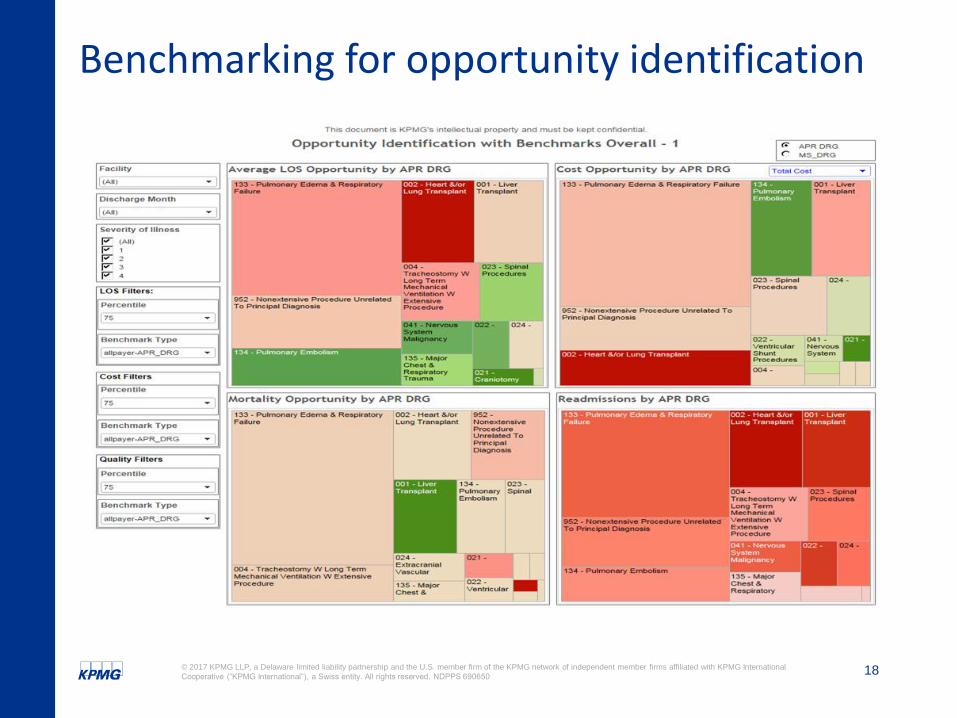
Benchmarking for opportunity identification
19© 2017 KPMG LLP, a Delaware limited liability partnership and the U.S. member firm of the KPMG network of independent member firms affiliated with KPMG International
Cooperative (“KPMG International”), a Swiss entity. All rights reserved. NDPPS 690650
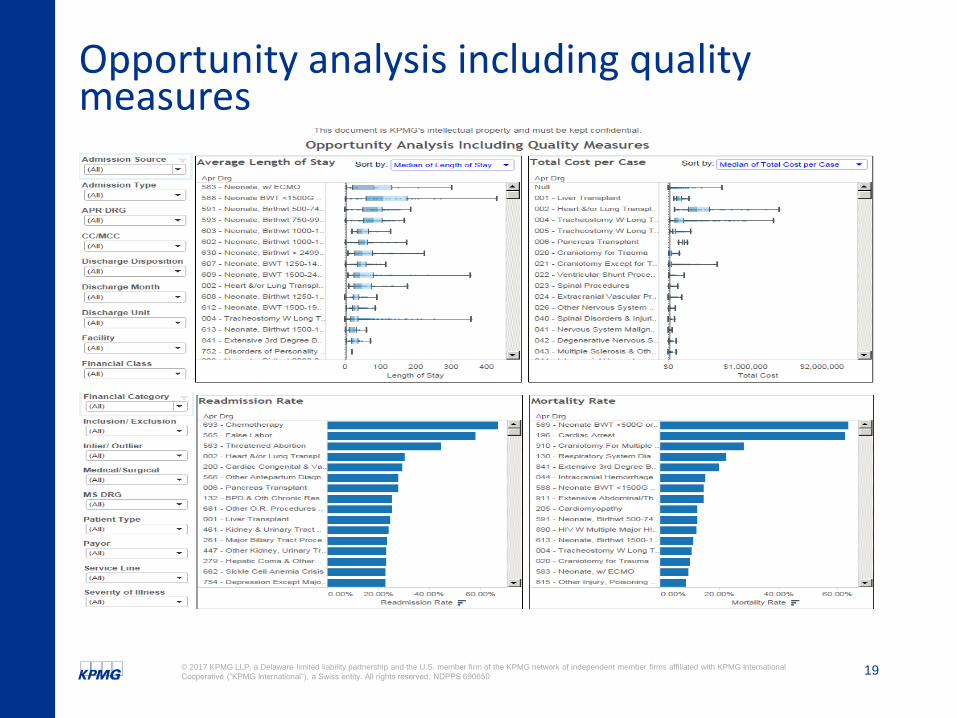
Opportunity analysis including quality measures
20© 2017 KPMG LLP, a Delaware limited liability partnership and the U.S. member firm of the KPMG network of independent member firms affiliated with KPMG International
Cooperative (“KPMG International”), a Swiss entity. All rights reserved. NDPPS 690650
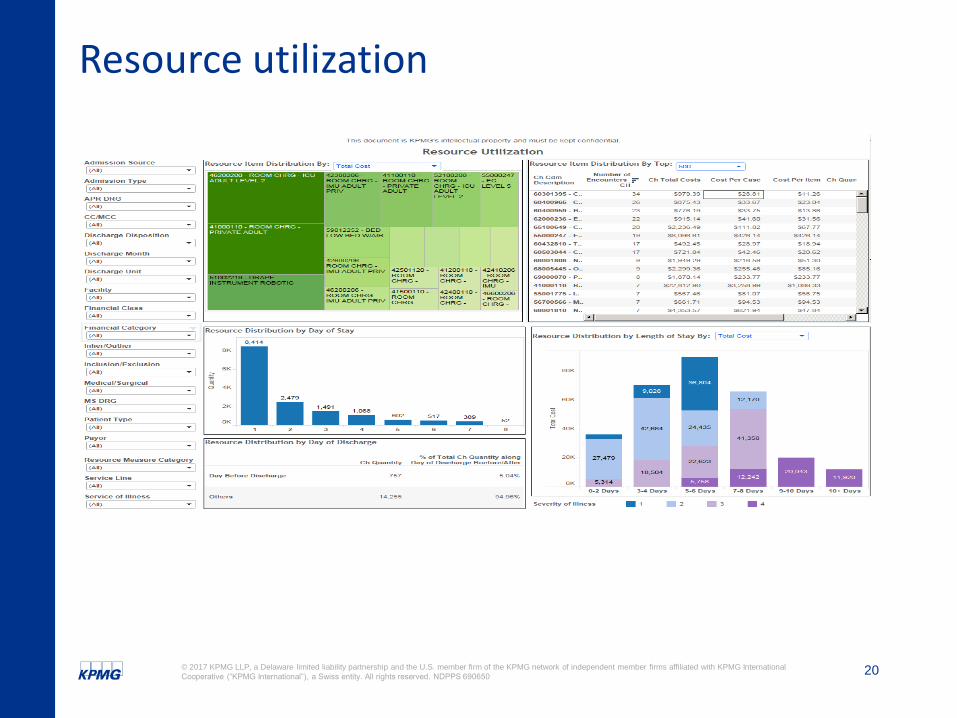
Resource utilization
21© 2017 KPMG LLP, a Delaware limited liability partnership and the U.S. member firm of the KPMG network of independent member firms affiliated with KPMG International
Cooperative (“KPMG International”), a Swiss entity. All rights reserved. NDPPS 690650
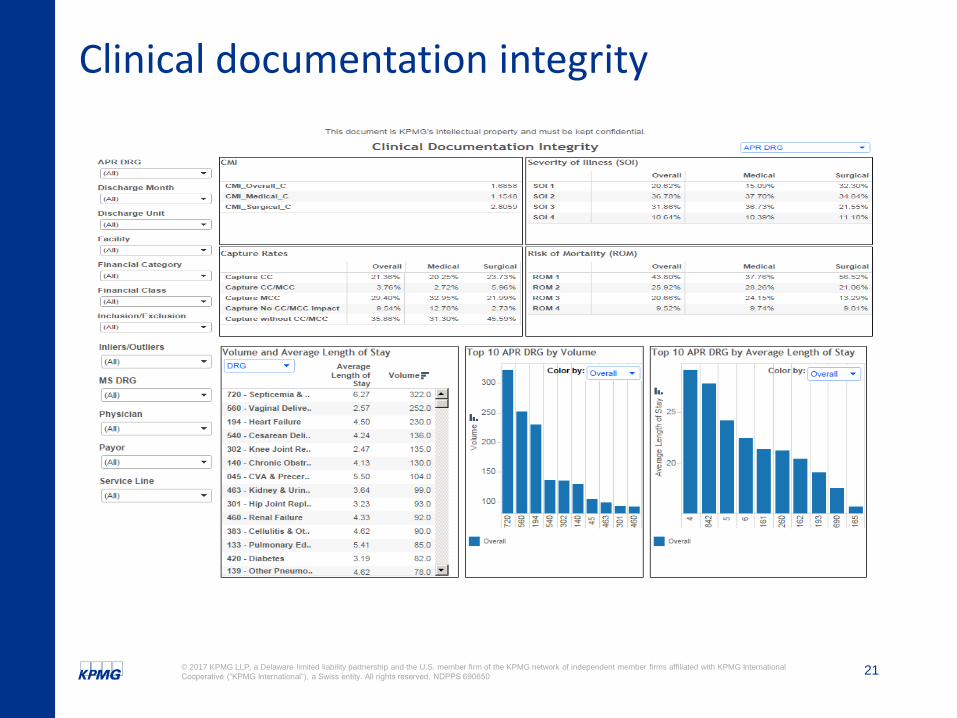
Clinical documentation integrity
22© 2017 KPMG LLP, a Delaware limited liability partnership and the U.S. member firm of the KPMG network of independent member firms affiliated with KPMG International
Cooperative (“KPMG International”), a Swiss entity. All rights reserved. NDPPS 690650
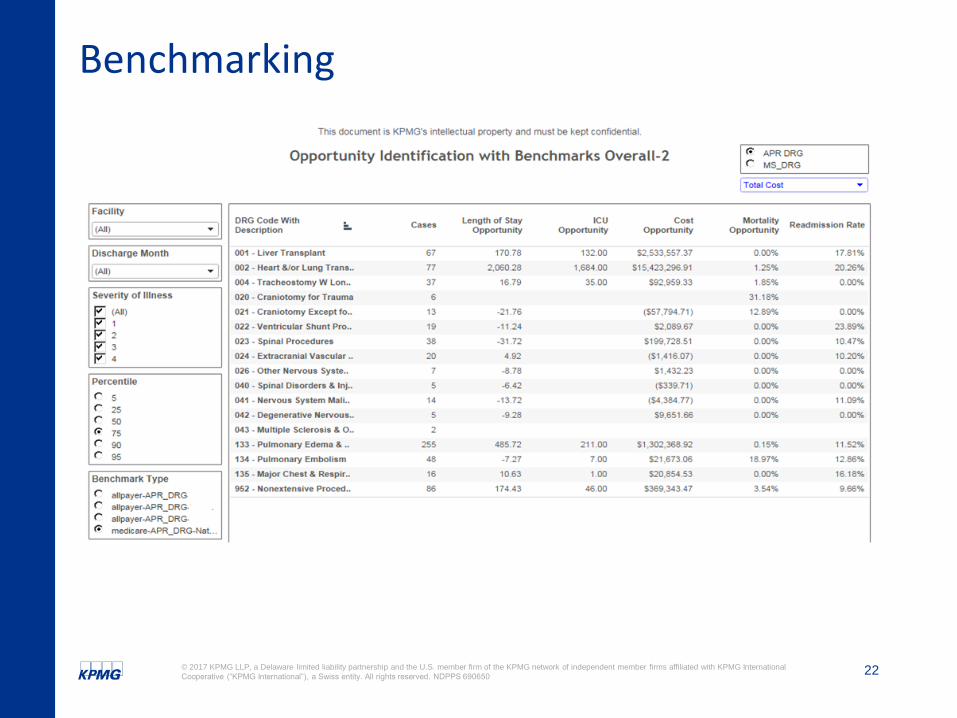
Benchmarking
23© 2017 KPMG LLP, a Delaware limited liability partnership and the U.S. member firm of the KPMG network of independent member firms affiliated with KPMG International
Cooperative (“KPMG International”), a Swiss entity. All rights reserved. NDPPS 690650
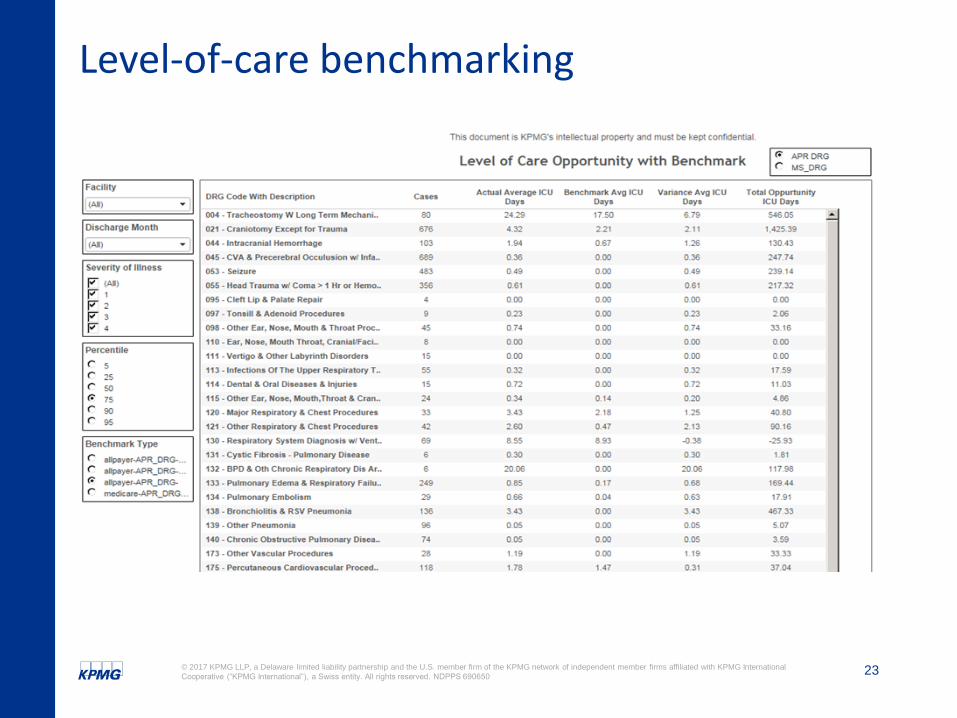
Level-of-care benchmarking
24© 2017 KPMG LLP, a Delaware limited liability partnership and the U.S. member firm of the KPMG network of independent member firms affiliated with KPMG International
Cooperative (“KPMG International”), a Swiss entity. All rights reserved. NDPPS 690650
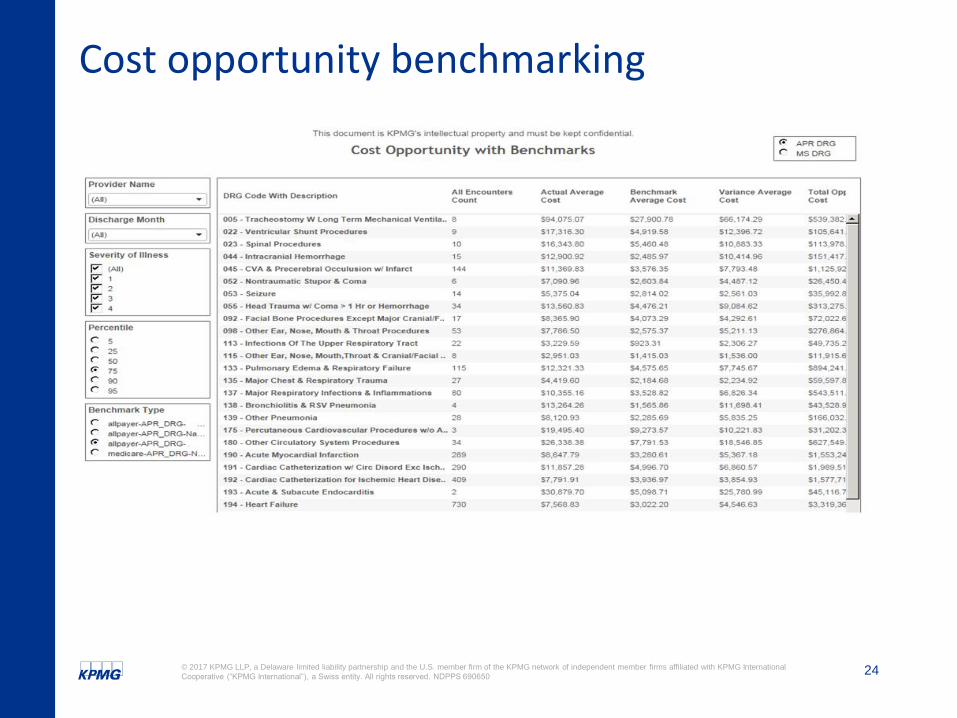
Cost opportunity benchmarking
25© 2017 KPMG LLP, a Delaware limited liability partnership and the U.S. member firm of the KPMG network of independent member firms affiliated with KPMG International
Cooperative (“KPMG International”), a Swiss entity. All rights reserved. NDPPS 690650
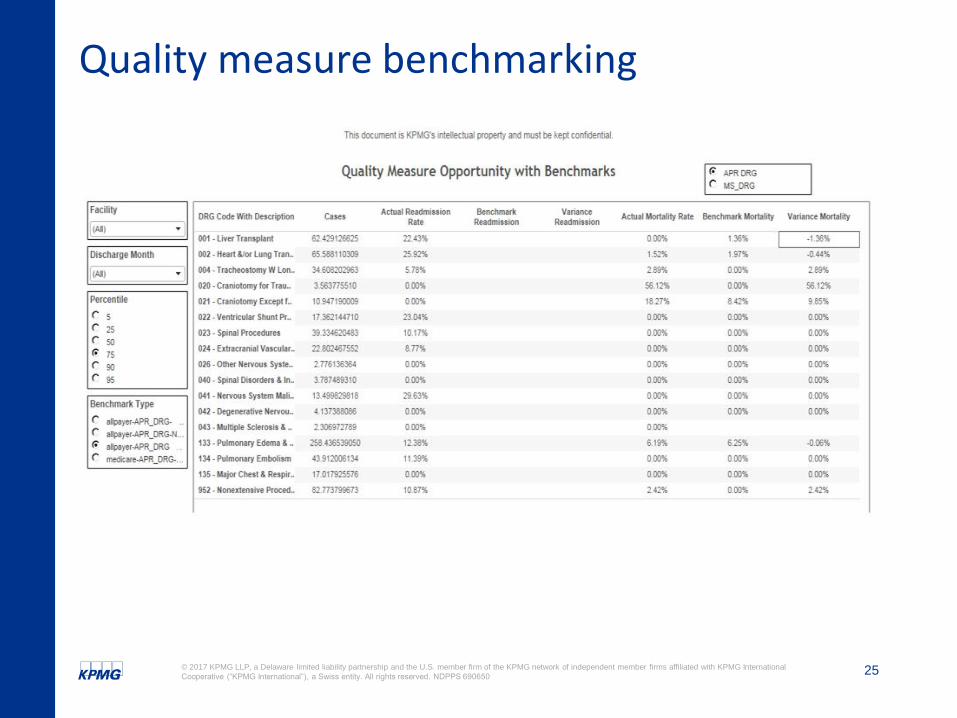
Quality measure benchmarking
26© 2017 KPMG LLP, a Delaware limited liability partnership and the U.S. member firm of the KPMG network of independent member firms affiliated with KPMG International
Cooperative (“KPMG International”), a Swiss entity. All rights reserved. NDPPS 690650
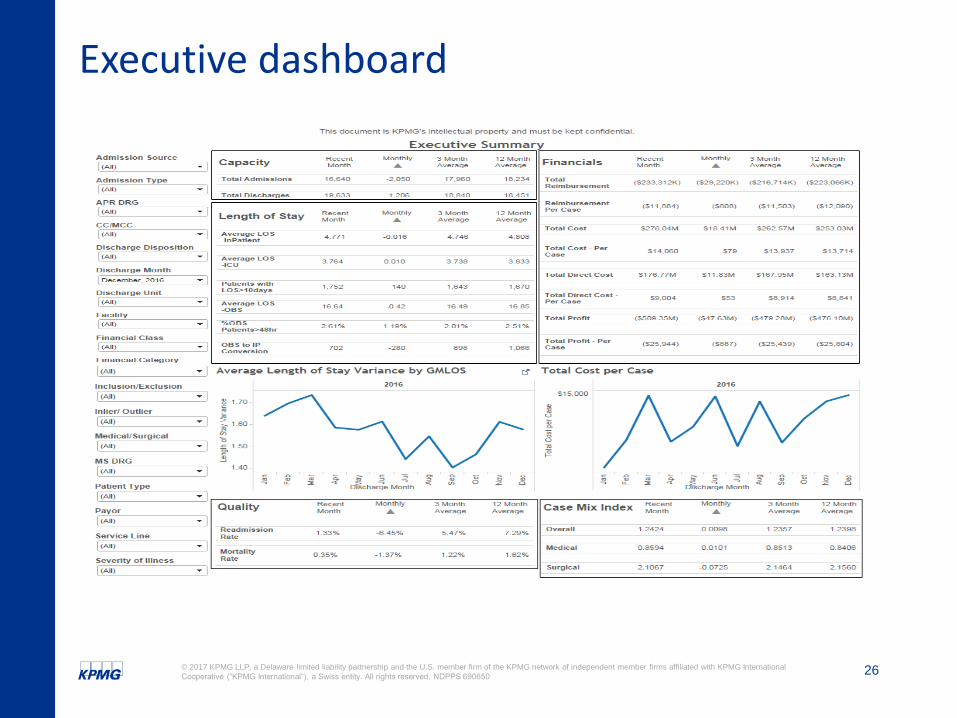
Executive dashboard
Advanced analytics
Variation of resource usage by provider
28© 2017 KPMG LLP, a Delaware limited liability partnership and the U.S. member firm of the KPMG network of independent member firms affiliated with KPMG International
Cooperative (“KPMG International”), a Swiss entity. All rights reserved. NDPPS 690650
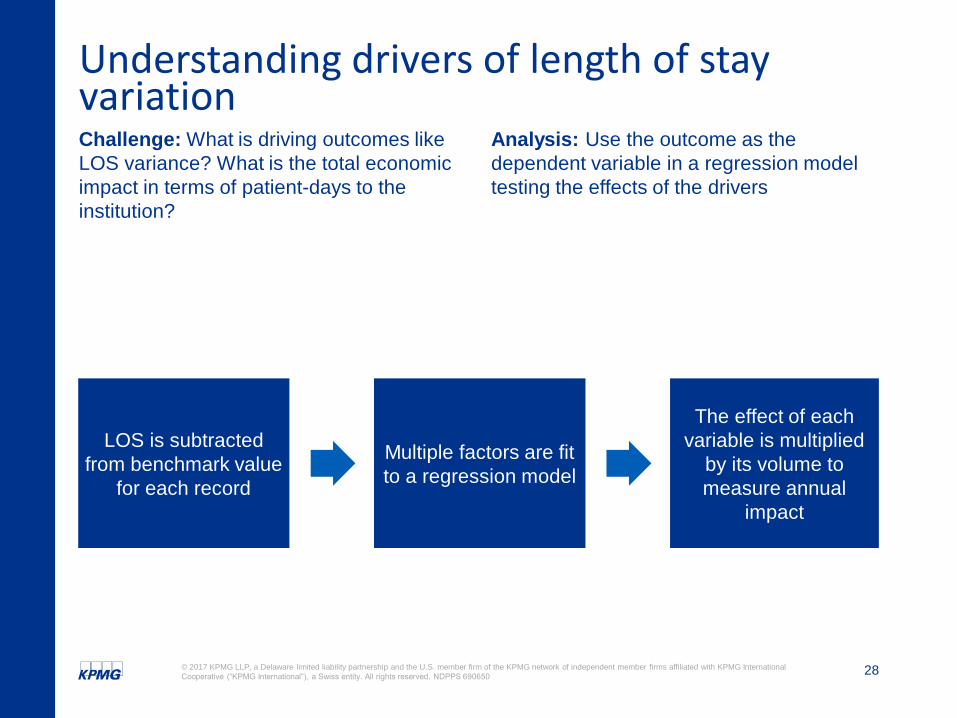
Understanding drivers of length of stay variation
LOS is subtracted
from benchmark value
for each record
Multiple factors are fit
to a regression model
The effect of each
variable is multiplied
by its volume to
measure annual
impact
Challenge: What is driving outcomes like
LOS variance? What is the total economic
impact in terms of patient-days to the
institution?
Analysis: Use the outcome as the
dependent variable in a regression model
testing the effects of the drivers
29© 2017 KPMG LLP, a Delaware limited liability partnership and the U.S. member firm of the KPMG network of independent member firms affiliated with KPMG International
Cooperative (“KPMG International”), a Swiss entity. All rights reserved. NDPPS 690650
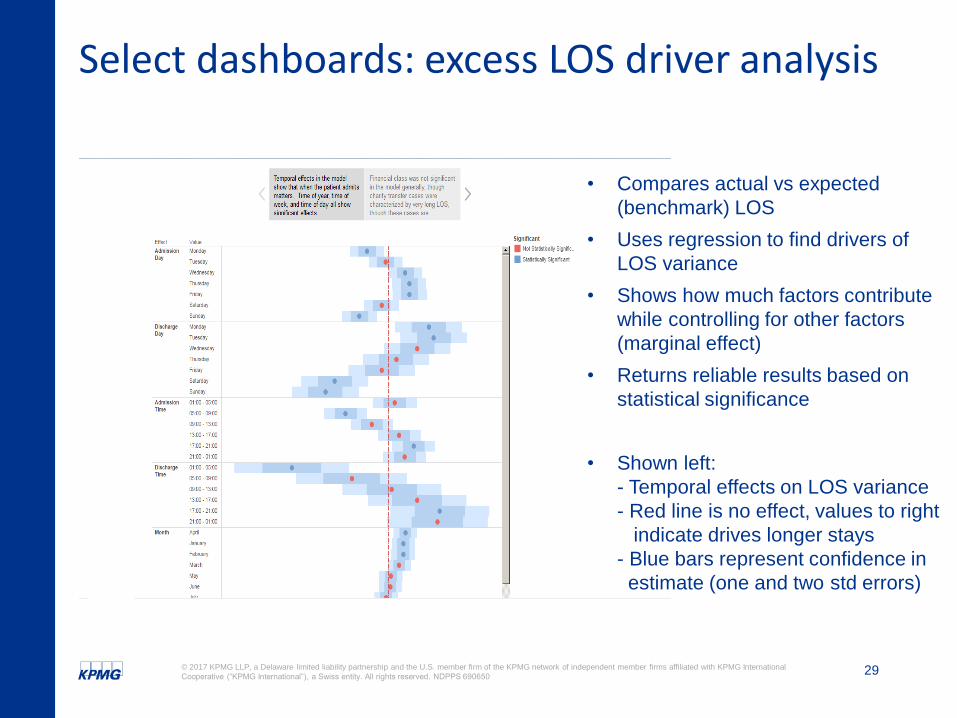
Select dashboards: excess LOS driver analysis
• Compares actual vs expected
(benchmark) LOS
• Uses regression to find drivers of
LOS variance
• Shows how much factors contribute
while controlling for other factors
(marginal effect)
• Returns reliable results based on
statistical significance
• Shown left:
- Temporal effects on LOS variance
- Red line is no effect, values to right
indicate drives longer stays
- Blue bars represent confidence in
estimate (one and two std errors)
30© 2017 KPMG LLP, a Delaware limited liability partnership and the U.S. member firm of the KPMG network of independent member firms affiliated with KPMG International
Cooperative (“KPMG International”), a Swiss entity. All rights reserved. NDPPS 690650
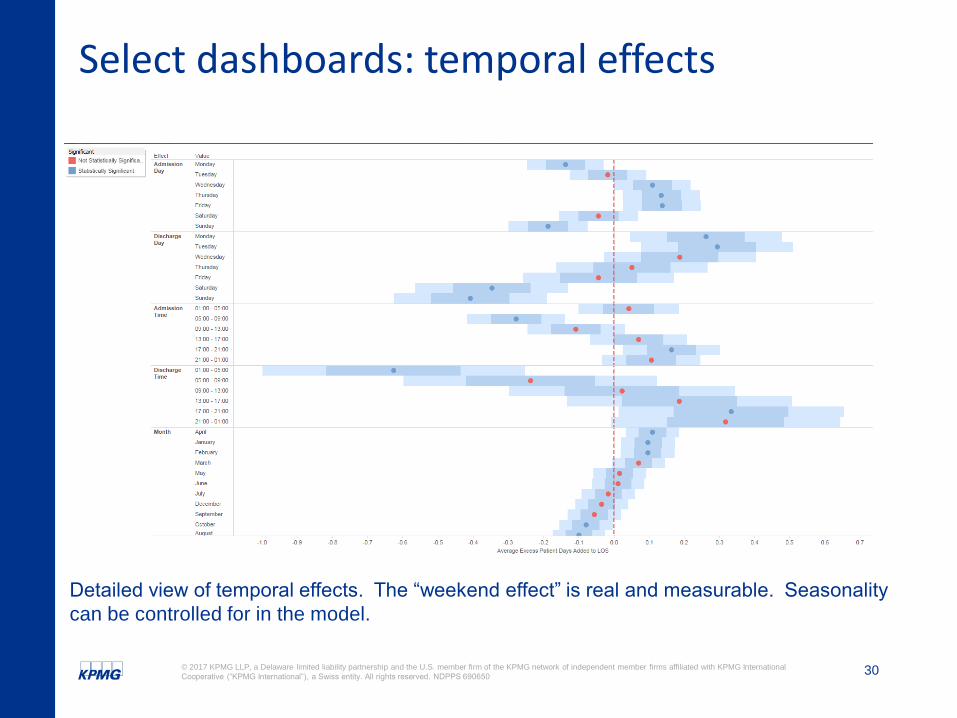
Select dashboards: temporal effects
Detailed view of temporal effects. The “weekend effect” is real and measurable. Seasonality
can be controlled for in the model.
31© 2017 KPMG LLP, a Delaware limited liability partnership and the U.S. member firm of the KPMG network of independent member firms affiliated with KPMG International
Cooperative (“KPMG International”), a Swiss entity. All rights reserved. NDPPS 690650
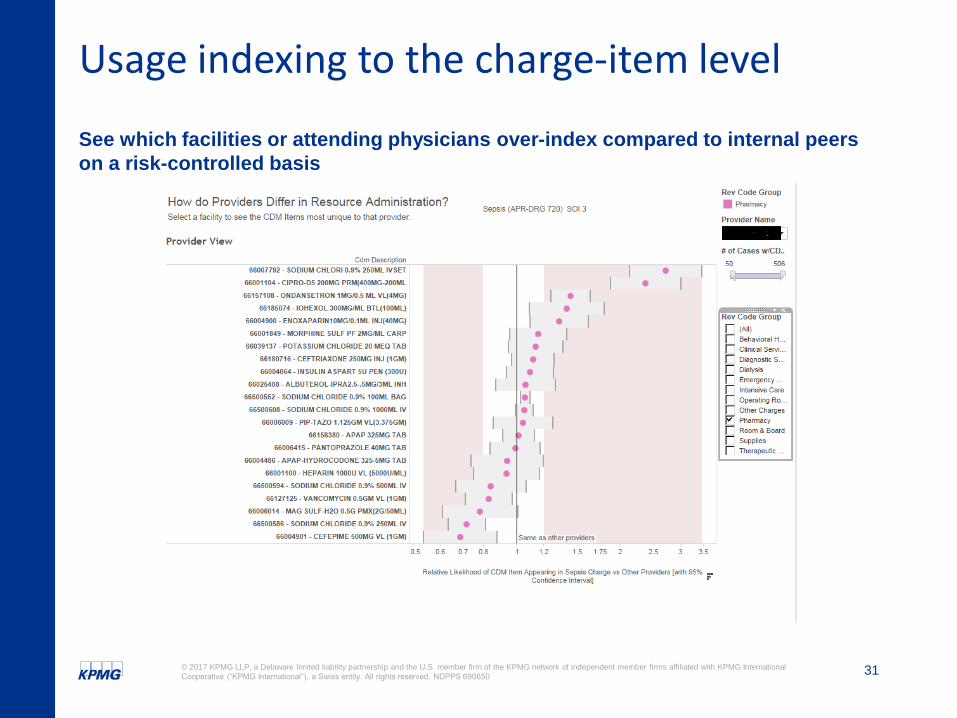
Usage indexing to the charge-item level
See which facilities or attending physicians over-index compared to internal peers
on a risk-controlled basis
32© 2017 KPMG LLP, a Delaware limited liability partnership and the U.S. member firm of the KPMG network of independent member firms affiliated with KPMG International
Cooperative (“KPMG International”), a Swiss entity. All rights reserved. NDPPS 690650
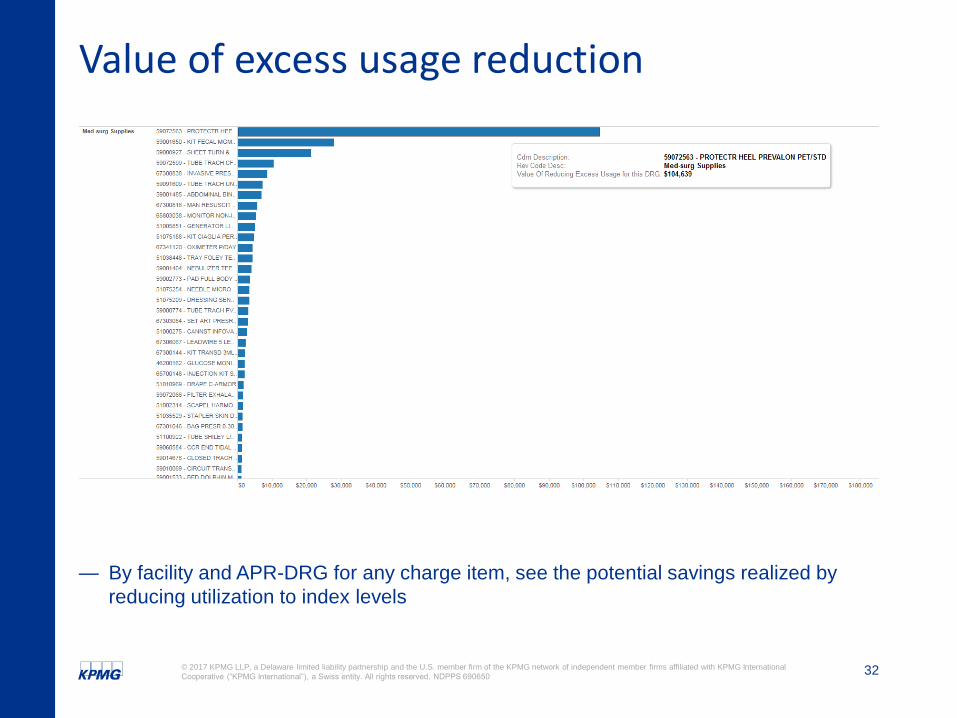
Value of excess usage reduction
— By facility and APR-DRG for any charge item, see the potential savings realized by
reducing utilization to index levels
Diagnostic and predictive modeling for outcomes
34© 2017 KPMG LLP, a Delaware limited liability partnership and the U.S. member firm of the KPMG network of independent member firms affiliated with KPMG International
Cooperative (“KPMG International”), a Swiss entity. All rights reserved. NDPPS 690650
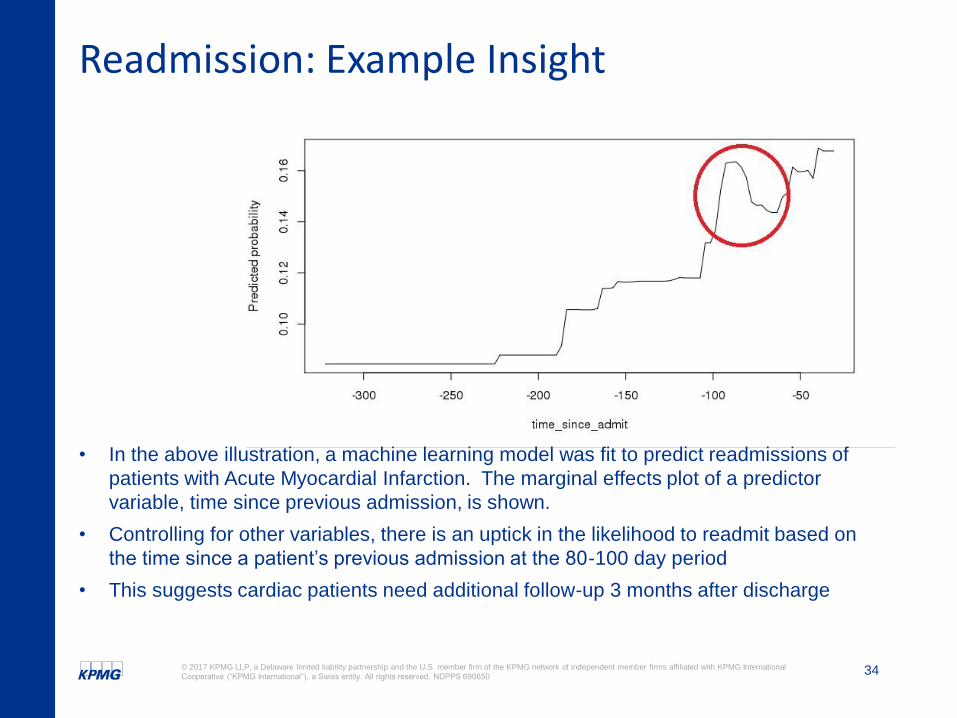
Readmission: Example Insight
• In the above illustration, a machine learning model was fit to predict readmissions of
patients with Acute Myocardial Infarction. The marginal effects plot of a predictor
variable, time since previous admission, is shown.
• Controlling for other variables, there is an uptick in the likelihood to readmit based on
the time since a patient’s previous admission at the 80-100 day period
• This suggests cardiac patients need additional follow-up 3 months after discharge

35© 2017 KPMG LLP, a Delaware limited liability partnership and the U.S. member firm of the KPMG network of independent member firms affiliated with KPMG International
Cooperative (“KPMG International”), a Swiss entity. All rights reserved. NDPPS 690650
Q & A
AskHow
Some or all of the services described herein may not be permissible for KPMG audit clients and their affiliates.The KPMG name and logo are registered trademarks or trademarks of KPMG International.
The information contained herein is of a general nature and is not intended to address the circumstances of any particular individual or entity. Although we endeavor to provide
accurate and timely information, there can be no guarantee that such information is accurate as of the date it is received or that it will continue to be accurate in the future. No one
should act upon such information without appropriate professional advice after a thorough examination of the particular situation.