Embed Size (px)
Citation preview
1
Paper 045-2013
Using SAS® Enterprise BI for Integrated Bank Reporting James Beaver, Farm Bureau Bank; Tobin Scroggins, Farm Bureau Bank;
ABSTRACT This paper shows how base SAS,SAS Enterprise Guide, ETS and SAS Enterprise BI are used to provide a comprehensive view of bank performance. Data is extracted from the G/L, loan, deposit and application systems, real time data is accessed to provide up-to the minute results on loan activity and system reports are read in to provide additional information. Proc Computab is used to create financial statements, OLAP cubes are used to provide reports on bank balance sheet components and budget comparisons on non-interest income and expense items by department, and dashboards are used to provide real time reports on loan originations. The reports are presented using SAS BI through the SAS data portal to provide real time, trend and historical reports on the bank’s performance.
INTRODUCTION Daily reporting provides management with up to date information giving them the ability to anticipate issues and proactively address them as they are developing rather than reacting to them. At Farm Bureau Bank a number of reports are produced and updated daily to provide a full picture of the current operating conditions of the bank. This paper discusses creation of the reports and the presentation of reports using SAS Enterprise BI. The development and presentation of the following reports is presented:
• Financial balance sheet and income statement
• Variance reports with actual, budgeted and difference are presented by department and line item, with the ability to drill down to the individual general ledger entry.
• Daily and monthly new account volume
• New account volume by geographic area and type.
The reports are presented using the SAS Information Portal,
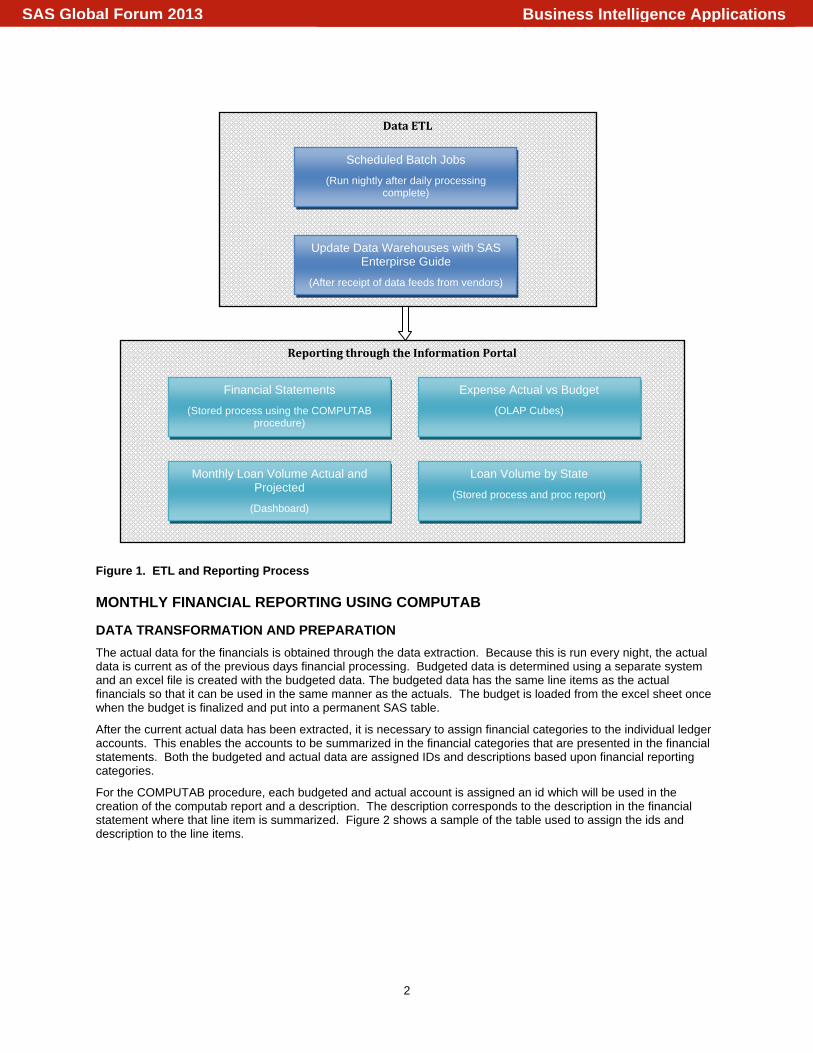
DATA EXTRACTION AND REPORT CREATION OVERVIEW The bulk of the data used to create the daily financial reports; budget vs. actual comparisons and tracking the bank’s loan volume is extracted using batch processing. The batch jobs are run overnight via Windows scheduler in base SAS. Running these programs overnight saves processing resources during peak business hours. Overnight processing also allows for reports to be ready for review at the start of business each day
In addition to the nightly processing performed in base SAS, Farm Bureau Bank analysts use Enterprise Guide as an ETL platform to update several data warehouses. The bank receives daily data feeds from credit card vendors as well as daily loan application and account files. This information is extracted, cleaned and added to application and account fact tables.
The final data extraction process is done through stored processes. The data gathered using batch processing and Enterprise Guide projects are used to give an overview of the previous day’s business. The stored processes are designed to pull data from the banking system live. This allows management to follow the current day’s loan business in real time. Live data processing is also used to determine near future work load. Knowing that a certain dollar amount of loans are soon to be advanced allows for the lending department to adjust its staffing needs accordingly.
Once the data is extracted, the various tables and cubes are updated. Then, using the information portal management has access to the reports needed to analyze bank performance.
Business Intelligence ApplicationsSAS Global Forum 2013
2
Figure 1. ETL and Reporting Process
MONTHLY FINANCIAL REPORTING USING COMPUTAB
DATA TRANSFORMATION AND PREPARATION The actual data for the financials is obtained through the data extraction. Because this is run every night, the actual data is current as of the previous days financial processing. Budgeted data is determined using a separate system and an excel file is created with the budgeted data. The budgeted data has the same line items as the actual financials so that it can be used in the same manner as the actuals. The budget is loaded from the excel sheet once when the budget is finalized and put into a permanent SAS table.
After the current actual data has been extracted, it is necessary to assign financial categories to the individual ledger accounts. This enables the accounts to be summarized in the financial categories that are presented in the financial statements. Both the budgeted and actual data are assigned IDs and descriptions based upon financial reporting categories.
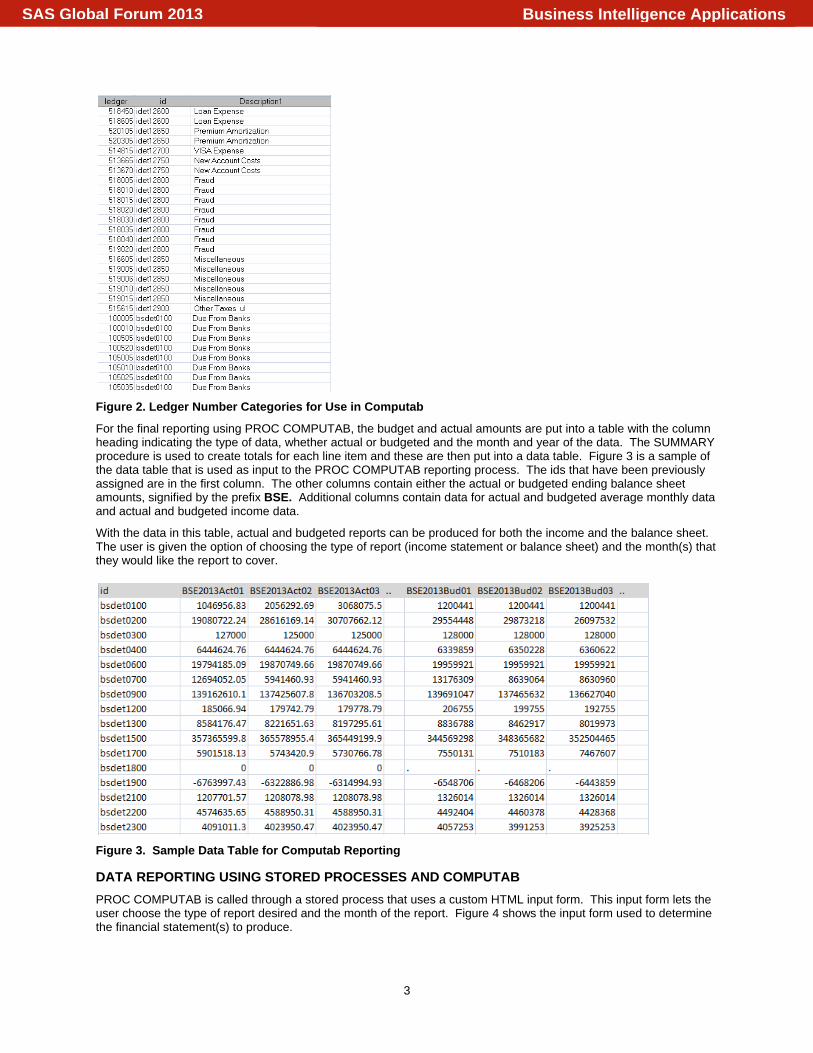
For the COMPUTAB procedure, each budgeted and actual account is assigned an id which will be used in the creation of the computab report and a description. The description corresponds to the description in the financial statement where that line item is summarized. Figure 2 shows a sample of the table used to assign the ids and description to the line items.
Reporting through the Information Portal
Data ETL
Scheduled Batch Jobs
(Run nightly after daily processing complete)
Update Data Warehouses with SAS Enterpirse Guide
(After receipt of data feeds from vendors)
Financial Statements
(Stored process using the COMPUTAB procedure)
Expense Actual vs Budget
(OLAP Cubes)
Monthly Loan Volume Actual and Projected
(Dashboard)
Loan Volume by State
(Stored process and proc report)
Business Intelligence ApplicationsSAS Global Forum 2013
3
Figure 2. Ledger Number Categories for Use in Computab
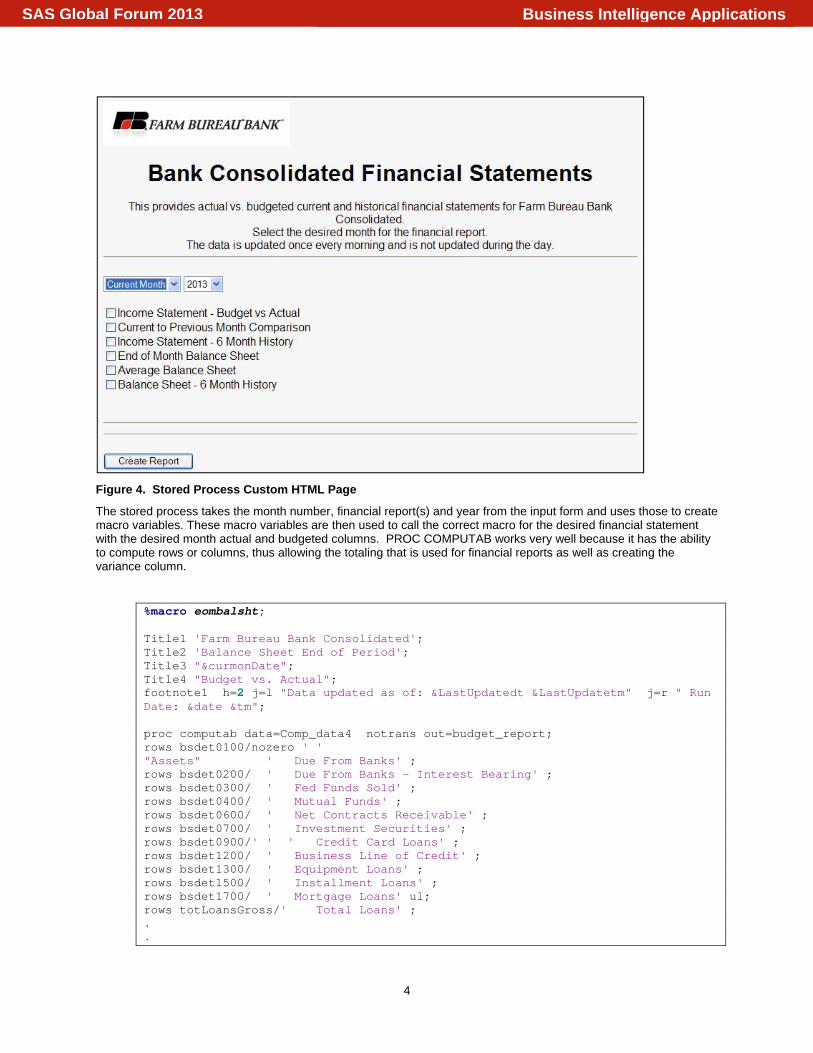
For the final reporting using PROC COMPUTAB, the budget and actual amounts are put into a table with the column heading indicating the type of data, whether actual or budgeted and the month and year of the data. The SUMMARY procedure is used to create totals for each line item and these are then put into a data table. Figure 3 is a sample of the data table that is used as input to the PROC COMPUTAB reporting process. The ids that have been previously assigned are in the first column. The other columns contain either the actual or budgeted ending balance sheet amounts, signified by the prefix BSE. Additional columns contain data for actual and budgeted average monthly data and actual and budgeted income data.
With the data in this table, actual and budgeted reports can be produced for both the income and the balance sheet. The user is given the option of choosing the type of report (income statement or balance sheet) and the month(s) that they would like the report to cover.
Figure 3. Sample Data Table for Computab Reporting
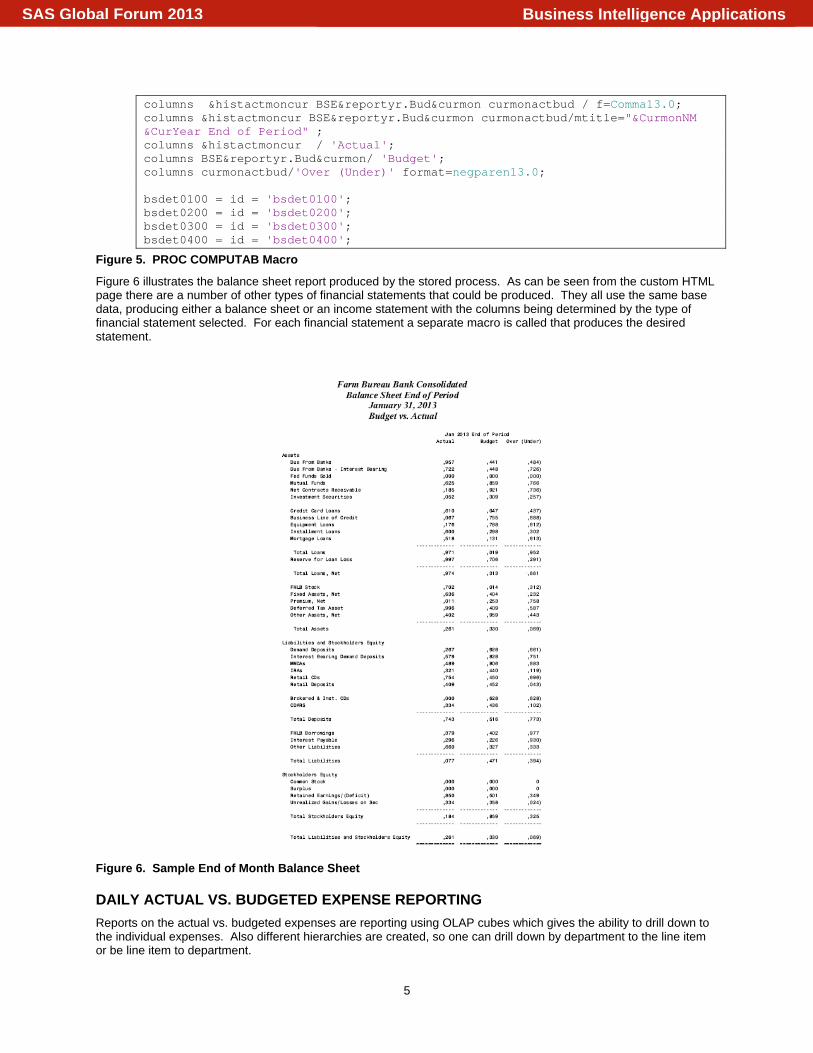
DATA REPORTING USING STORED PROCESSES AND COMPUTAB PROC COMPUTAB is called through a stored process that uses a custom HTML input form. This input form lets the user choose the type of report desired and the month of the report. Figure 4 shows the input form used to determine the financial statement(s) to produce.
Business Intelligence ApplicationsSAS Global Forum 2013
4
Figure 4. Stored Process Custom HTML Page
The stored process takes the month number, financial report(s) and year from the input form and uses those to create macro variables. These macro variables are then used to call the correct macro for the desired financial statement with the desired month actual and budgeted columns. PROC COMPUTAB works very well because it has the ability to compute rows or columns, thus allowing the totaling that is used for financial reports as well as creating the variance column.
%macro eombalsht; Title1 'Farm Bureau Bank Consolidated'; Title2 'Balance Sheet End of Period'; Title3 "&curmonDate"; Title4 "Budget vs. Actual"; footnote1 h=2 j=l "Data updated as of: &LastUpdatedt &LastUpdatetm" j=r " Run Date: &date &tm"; proc computab data=Comp_data4 notrans out=budget_report; rows bsdet0100/nozero ' ' "Assets" ' Due From Banks' ; rows bsdet0200/ ' Due From Banks - Interest Bearing' ; rows bsdet0300/ ' Fed Funds Sold' ; rows bsdet0400/ ' Mutual Funds' ; rows bsdet0600/ ' Net Contracts Receivable' ; rows bsdet0700/ ' Investment Securities' ; rows bsdet0900/' ' ' Credit Card Loans' ; rows bsdet1200/ ' Business Line of Credit' ; rows bsdet1300/ ' Equipment Loans' ; rows bsdet1500/ ' Installment Loans' ; rows bsdet1700/ ' Mortgage Loans' ul; rows totLoansGross/' Total Loans' ; . .
Business Intelligence ApplicationsSAS Global Forum 2013
5
columns &histactmoncur BSE&reportyr.Bud&curmon curmonactbud / f=Comma13.0; columns &histactmoncur BSE&reportyr.Bud&curmon curmonactbud/mtitle="&CurmonNM &CurYear End of Period" ; columns &histactmoncur / 'Actual'; columns BSE&reportyr.Bud&curmon/ 'Budget'; columns curmonactbud/'Over (Under)' format=negparen13.0; bsdet0100 = id = 'bsdet0100'; bsdet0200 = id = 'bsdet0200'; bsdet0300 = id = 'bsdet0300'; bsdet0400 = id = 'bsdet0400';
Figure 5. PROC COMPUTAB Macro
Figure 6 illustrates the balance sheet report produced by the stored process. As can be seen from the custom HTML page there are a number of other types of financial statements that could be produced. They all use the same base data, producing either a balance sheet or an income statement with the columns being determined by the type of financial statement selected. For each financial statement a separate macro is called that produces the desired statement.
Figure 6. Sample End of Month Balance Sheet
DAILY ACTUAL VS. BUDGETED EXPENSE REPORTING Reports on the actual vs. budgeted expenses are reporting using OLAP cubes which gives the ability to drill down to the individual expenses. Also different hierarchies are created, so one can drill down by department to the line item or be line item to department.
Business Intelligence ApplicationsSAS Global Forum 2013
6
DATA TRANSFORMATION The actual data for the expenses is pulled from the general ledger through the data extraction. The individual transaction data for each of the accounts reported is run every night, resulting in the actual data being current as of the previous days financial processing. Budgeted data is determined using a separate system and an excel file is created with the budgeted data. The budgeted data has the same line items as the actual financials so that it can be used in the same manner as the actuals. The budget is loaded once when the budget is finalized and put into a permanent SAS table.
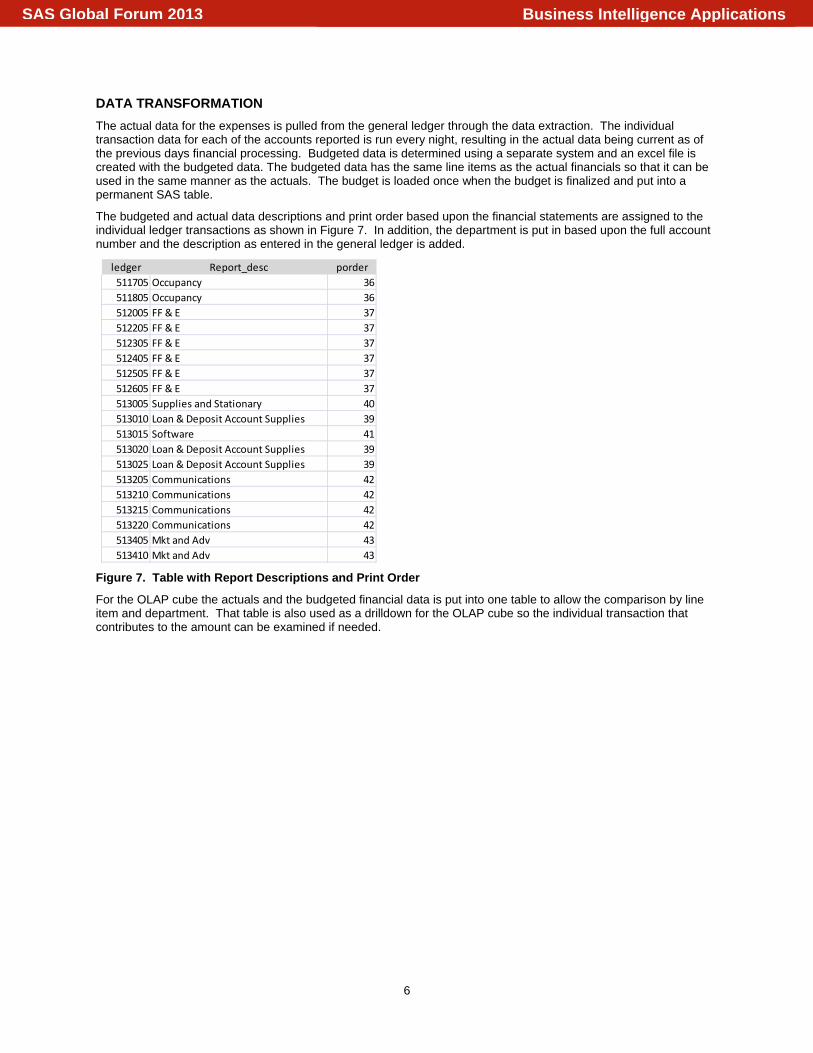
The budgeted and actual data descriptions and print order based upon the financial statements are assigned to the individual ledger transactions as shown in Figure 7. In addition, the department is put in based upon the full account number and the description as entered in the general ledger is added.
Figure 7. Table with Report Descriptions and Print Order
For the OLAP cube the actuals and the budgeted financial data is put into one table to allow the comparison by line item and department. That table is also used as a drilldown for the OLAP cube so the individual transaction that contributes to the amount can be examined if needed.
ledger Report_desc porder511705 Occupancy 36511805 Occupancy 36512005 FF & E 37512205 FF & E 37512305 FF & E 37512405 FF & E 37512505 FF & E 37512605 FF & E 37513005 Supplies and Stationary 40513010 Loan & Deposit Account Supplies 39513015 Software 41513020 Loan & Deposit Account Supplies 39513025 Loan & Deposit Account Supplies 39513205 Communications 42513210 Communications 42513215 Communications 42513220 Communications 42513405 Mkt and Adv 43513410 Mkt and Adv 43
Business Intelligence ApplicationsSAS Global Forum 2013

7
Figure 8. Detail Table for OLAP Cube
Figure 8 shows a sample of the detail table that is used to create the cube for reporting. Hierarchies are created so one could drill down from the description such as Printing to the department and then to the individual line item as well as from the department to the description and then to individual line item. The print order is used to insure that the expenses appear in the same order as they do in the financial statements.
REPORTING OLAP cubes are used for the reporting. This allows the manager to see all of the data and then drill down for a particular month and department or line item if desired.
Figure 9. Sample OLAP Cube Report for Actual vs. Budget by Department
Report_desc Deptnumname ledger description Gldescription porder department effect_dt Actual Budget budget_actualMkt and Adv 661 ‐ Deposit Products 513625 Printing IMS 43 661 10/25/2012 $7,842.04 $0.00 ActualMkt and Adv 715 ‐ Sales/Service 513625 Printing Blue Tape, Inc JS 43 715 4/19/2012 $463.75 $0.00 ActualMkt and Adv 721 ‐ Marketing 513625 Printing American Color Labs 43 721 2/16/2012 $12,629.04 $0.00 ActualMkt and Adv 721 ‐ Marketing 513625 Printing Clear Visions, Inc 43 721 2/16/2012 $26,459.28 $0.00 ActualMkt and Adv 721 ‐ Marketing 513625 Printing TWG Solutions 43 721 2/16/2012 $17,311.36 $0.00 ActualMkt and Adv 721 ‐ Marketing 513625 Printing Clear Visions, Inc 43 721 3/15/2012 $4,133.05 $0.00 ActualMkt and Adv 721 ‐ Marketing 513625 Printing American Color Labs 43 721 7/12/2012 $8,641.35 $0.00 ActualMkt and Adv 721 ‐ Marketing 513625 Printing TWG Solutions 43 721 7/12/2012 $17,588.48 $0.00 ActualMkt and Adv 721 ‐ Marketing 513625 Printing American Color Labs 43 721 8/17/2012 $1,459.68 $0.00 ActualMkt and Adv 721 ‐ Marketing 513625 Printing TWG Solutions 43 721 8/17/2012 $23,585.52 $0.00 ActualMkt and Adv 721 ‐ Marketing 513625 Printing American Color Labs 43 721 9/26/2012 $259.50 $0.00 ActualMkt and Adv 721 ‐ Marketing 513625 Printing American Color Labs 43 721 9/26/2012 $173.00 $0.00 ActualMkt and Adv 721 ‐ Marketing 513625 Printing American Color Labs 43 721 12/6/2012 $778.52 $0.00 ActualMkt and Adv 721 ‐ Marketing 513625 Printing American Color Labs 43 721 1/18/2013 $1,117.17 $0.00 ActualMkt and Adv 721 ‐ Marketing 513625 Printing Clear Visions, Inc 43 721 2/7/2013 $8,271.60 $0.00 ActualMkt and Adv 721 ‐ Marketing 513625 Printing American Color Labs 43 721 2/27/2013 $2,080.32 $0.00 ActualMkt and Adv 741 ‐ Secured Lending 513625 Printing Blue Tape, Inc LC 43 741 7/5/2012 $143.82 $0.00 ActualMkt and Adv 741 ‐ Secured Lending 513625 Printing TWG Solutions 43 741 11/23/2012 $1,898.70 $0.00 ActualMkt and Adv 511 ‐ Card Services 513635 Marketing Production CC STMNT REWARD CREDITS 43 511 6/8/2012 ($4,200.00) $0.00 ActualMkt and Adv 511 ‐ Card Services 513635 Marketing Production REVERSE ENTRY 6‐8‐12 43 511 6/11/2012 $1,400.00 $0.00 ActualMkt and Adv 511 ‐ Card Services 513635 Marketing Production CC STMNT REWARD CREDITS 43 511 6/11/2012 $6,500.00 $0.00 ActualMkt and Adv 521 ‐ Business Lending 513645 Media Clear Visions, Inc 43 521 4/19/2012 $1,276.36 $0.00 ActualMkt and Adv 721 ‐ Marketing 513645 Media American Color Labs 43 721 11/23/2012 $3,480.10 $0.00 ActualMkt and Adv 721 ‐ Marketing 513645 Media American Color Labs 43 721 11/23/2012 $9,415.56 $0.00 ActualMkt and Adv 721 ‐ Marketing 513645 Media Clear Visions, Inc 43 721 11/23/2012 $749.28 $0.00 ActualFraud 741 ‐ Secured Lending 518040 Fraud Expense ‐ IL budget_fcst 60 741 10/1/2012 $0.00 $7,500.00 BudgetFraud 741 ‐ Secured Lending 518040 Fraud Expense ‐ IL budget_fcst 60 741 11/1/2012 $0.00 $7,500.00 BudgetFraud 741 ‐ Secured Lending 518040 Fraud Expense ‐ IL budget_fcst 60 741 12/1/2012 $0.00 $7,500.00 BudgetLoan Expense 531 ‐ Collections 518205 Collection/Repo Expense budget_fcst 56 531 1/1/2012 $0.00 $6,000.00 BudgetLoan Expense 531 ‐ Collections 518205 Collection/Repo Expense budget_fcst 56 531 2/1/2012 $0.00 $6,000.00 BudgetLoan Expense 531 ‐ Collections 518205 Collection/Repo Expense budget_fcst 56 531 3/1/2012 $0.00 $6,000.00 BudgetLoan Expense 531 ‐ Collections 518205 Collection/Repo Expense budget_fcst 56 531 4/1/2012 $0.00 $6,000.00 Budget
Business Intelligence ApplicationsSAS Global Forum 2013
8
The field for the difference was calculated and it uses conditional highlighting to show whether the actual is greater or less than budget. This gives a department manager the ability to quickly see how his individual department is doing compared to budget. Because the table contains the individual items from the general ledger, if there is a question about an expense, that amount can be selected and the individual items from the underlying table will be show. This has proved particularly useful for the accounting area when they are checking expenses at the end of the month and for the managers when there is a question on one of the expenses. It also helps the managers determine if the expenses have been booked to the correct department and line item.
LOAN VOLUME TRACKING The number of new accounts and the dollar amount of booked loans are tracked on a daily, monthly, quarterly and yearly basis. Loan data is pulled nightly from the banking and lending databases using batch processing. Many of the installment loan products originated by Farm Bureau Bank come in via referrals from Farm Bureau Insurance agents across the country. Each state has sales goals which are tracked by the same time periods listed previously. Therefore, it is necessary to provide state specific reports as well as an overall bank level breakdown by state and if the account was referred by a Farm Bureau Insurance agent.
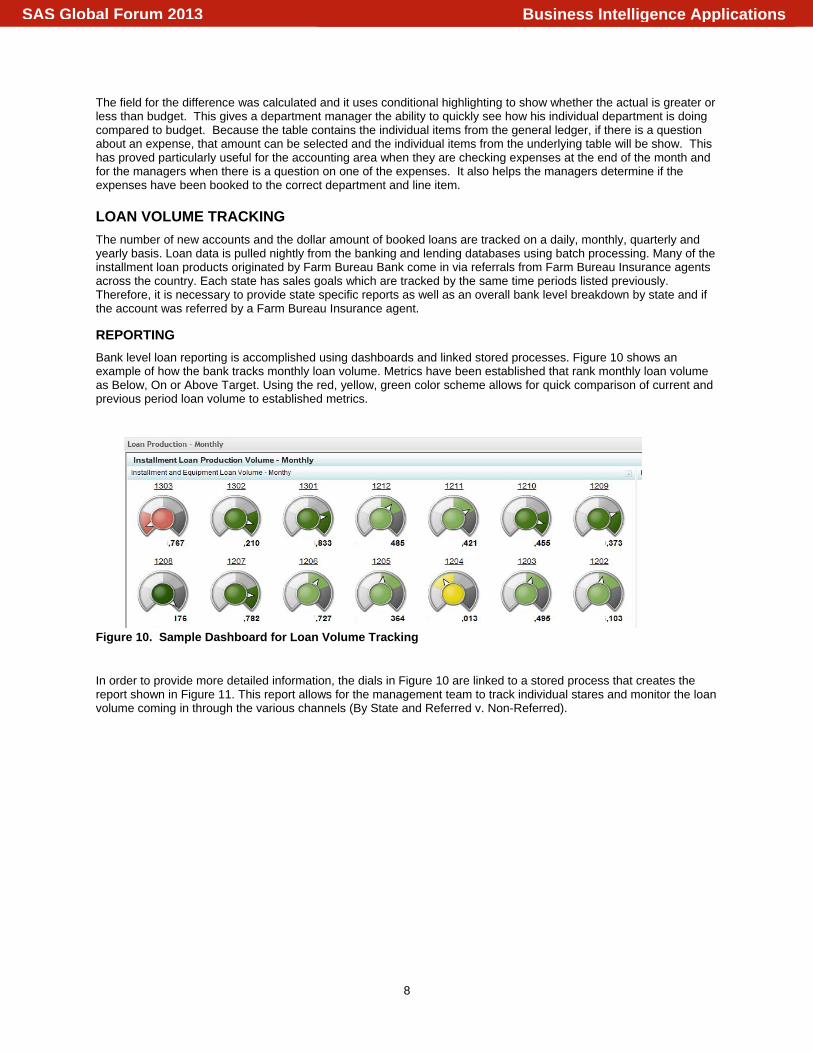
REPORTING Bank level loan reporting is accomplished using dashboards and linked stored processes. Figure 10 shows an example of how the bank tracks monthly loan volume. Metrics have been established that rank monthly loan volume as Below, On or Above Target. Using the red, yellow, green color scheme allows for quick comparison of current and previous period loan volume to established metrics.
Figure 10. Sample Dashboard for Loan Volume Tracking
In order to provide more detailed information, the dials in Figure 10 are linked to a stored process that creates the report shown in Figure 11. This report allows for the management team to track individual stares and monitor the loan volume coming in through the various channels (By State and Referred v. Non-Referred).
Business Intelligence ApplicationsSAS Global Forum 2013

9
Figure 11. Sample Report from Linked Stored Process
As well as monthly loan volume, the loan originations for the current month are projected based upon the daily average loan volume and the number of business days in the month. This is used by management for planning purposes to insure adequate funding of the loan volume.
Figure 12. Projected Monthly Loan Volume
In addition to the dashboards and stored process reports designed for the management team, e-mails are sent to State representatives for Farm Bureau Insurance via the SAS Enterprise BI server (Figure 13). Sales goals
Business Intelligence ApplicationsSAS Global Forum 2013

10
established between Farm Bureau Bank and State Representatives of Farm Bureau Insurance are tracked on a daily basis in order to judge the efficacy of state sales contests and promotions.
Figure 13. Sample E-mail for Individual State Production Goals
CONCLUSION SAS Enterprise BI provides multiple means of producing and distributing analytical reports. Through the use of SAS Enterprise BI, Farm Bureau bank is able to create various reports that are updated daily to keep management informed of the current and projected operation condition of the bank.
CONTACT INFORMATION Your comments and questions are valued and encouraged. Contact the author at:
James Beaver, PhD. Farm Bureau Bank 17300 Henderson Pass San Antonio, TX 78015 E-mail: [email protected] Tobin Scroggins Farm Bureau Bank 17300 Henderson Pass San Antonio, TX 78015 E-mail: [email protected]
SAS and all other SAS Institute Inc. product or service names are registered trademarks or trademarks of SAS Institute Inc. in the USA and other countries. ® indicates USA registration.
Other brand and product names are trademarks of their respective companies.
Business Intelligence ApplicationsSAS Global Forum 2013