Embed Size (px)
Citation preview
SAS Enterprise BI Server helps organizations overcome the deficiencies and complexity evident in most business intelligence (BI) deployments while reducing the cost of ownership. It pro vides a solid basis for vendor consoli dation and BI standardization, enabling IT to focus on more effectively aligning with the business. At the same time, it delivers user autonomy within a welldefined IT governance framework.
By providing an integrated, com plete portfolio of BI capabilities, SAS Enterprise BI Server eliminates the need to maintain multiple BI solutions. It is unique because it:
• Eliminatestheneedforconstant,ongoing integration of technologies by providing one consistent, fully integrated BI solution.
• Eliminatestheneedtomaintaindata,security and metadata in several places and formats through a single, shared metadata server that gives access to shared metadata, business rules, data and security definitions throughout the entire BI solution.
• Eliminatesthedailystruggleforcompliance by building it into the solution via integrated metadata. This pro vides consistent, reliable results that can be automatically traced back to the source.
• Eliminatestheneedforconstantand widescale IT involvement to deliver information by enabling user autonomy within a welldefined and centrally controlled IT governance framework.
With SAS, organizations reduce the costs of having effective and reliable business intelligence, ensure a future of innovation, and free IT time and resources. This enables IT to align with
the business more effectively and meet business needs faster at the lowest overall cost.
Key Benefits
• Faster, better decisions aligning IT and business. IT managers deploying SAS Enterprise BI Server can leverage previous investments, integrate BI quickly into existing environments and provide the information needed to drive the business forward as quickly as possible. This, with the added benefit of freeing resources from tedious tasks to focus on projects considered strategic to the business, ensures that IT is a driving force behind organizational success.
• Data consistency and control. Through centrally managed and shared metadata, data and security, SAS Enterprise BI Server delivers consistent representation and control of information by providing reliable results that easily can be traced back to the source. This alleviates the repetitive task of validating which reports or results are correct. In addi tion, integration with Microsoft Office allows IT to retake control of ad hoc Microsoft Excel use without impeding users’ desires for this familiar environment.
• Vendor consolidation and standardization with a comprehensive BI solution. SAS Enterprise BI Server ensures that IT has the breadth of BI capabilities to meet the needs of every type of user, including managers looking for dashboards, groups that want to view or build reports on the Web, analysts or power users who need advanced data exploration, and IT staffers who need to deploy, manage, control and maintain the entire solution.
What does SAS® Enterprise BI Server do?
SAS Enterprise BI Server enables organiza tions to achieve lower cost of ownership for BI, consolidate vendors, free IT resources for more strategic projects and obtain a faster time to intelligence. Ultimately, it leads to greater adoption of BI across the organization and enables IT to align with the business more effectively.
Why is SAS® Enterprise BI Server important?
It provides autonomy to users within a well-defined IT governance framework with a single source of metadata and a single point of administration.
For whom is SAS® Enterprise BI Server designed?
It is designed for organizations that need to simplify and speed BI deployment as well as align IT with the business to respond more quickly to user requests at the lowest overall cost.
SAS® Enterprise BI Server
Fast deployment, simple integration and consistent data
FACT SHEET
Product Overview
SAS Enterprise BI Server enables IT to deliver extensive BI capabilities on top of an open and integrated BI infrastructure that is easy to integrate into existing en vironments, deploy and maintain. Capa bilities include portals and dashboards, report viewing, report building, advanced data exploration, Microsoft Office integration, guided analysis, metadata management, guided SAS OLAP cube creation and application development. As a result, users at all levels are able to quickly and easily obtain the information needed to make decisions at the lowest overall cost to the organization.
Portal
SAS Enterprise BI Server provides a secure, rolebased portal that provides personalized interaction with information. As a result, the portal can be used to present information from the boardroom down. The portal provides a highly scal able and easytouse interface to help users quickly find the information they need. Consistent results and access to informa tion are assured with metadata search and a centralized metadata repository.
Dashboard
SAS Enterprise BI Server provides a rolebased, secure, customizable and extensible dashboard that is easy to administer and use. It provides links to reports and analytical results from SAS, SAS Strategy Management scorecards and objects, externally generated data and virtually anything addressable by a Uniform Resource Identifier (URI). The draganddrop administration means easy datatodashboard design capabilities in seconds. The dashboard displays KPIs at a glance to help users monitor anything that drives organizational performance. Based on permissions set up by IT, users can delve deeper into analysis from the portal
using SAS Business Intelligence tools and analytics products to gain insight into what caused the problem and how best to address the issues.
Business visualization
SAS Enterprise BI Server provides exten sive and robust visualization capabilities that help organizations take full advantage of information assets through dynamic, interactive visualization environments, a comprehensive library of graphics for presentations and customizable graphic generation. Busi
ness visualization deliv ers insights and surfaces relationships that are not easily discovered in tabular formats. Business users can interact with visual environments to explore ideas, investigate patterns and discover previ ously hidden facts through visual queries. Providing business users with this level of selfsufficiency reduces the overdependence on IT to service ad hoc requests, which require point solutions that are not integrated with core BI investments.
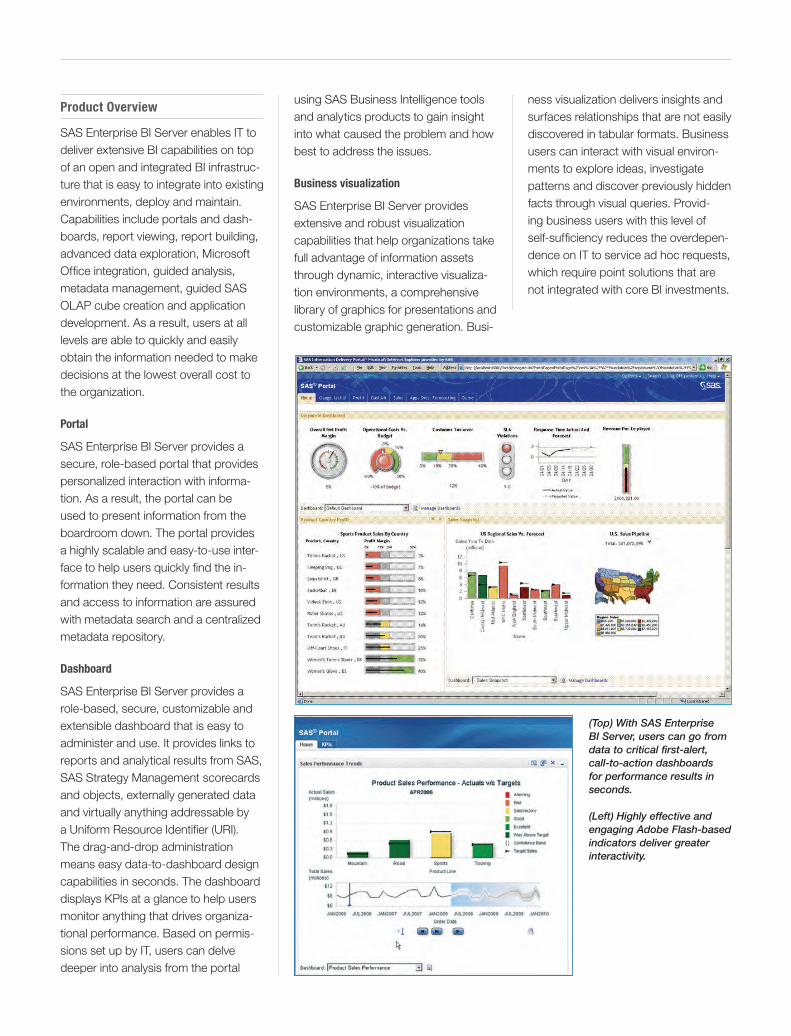
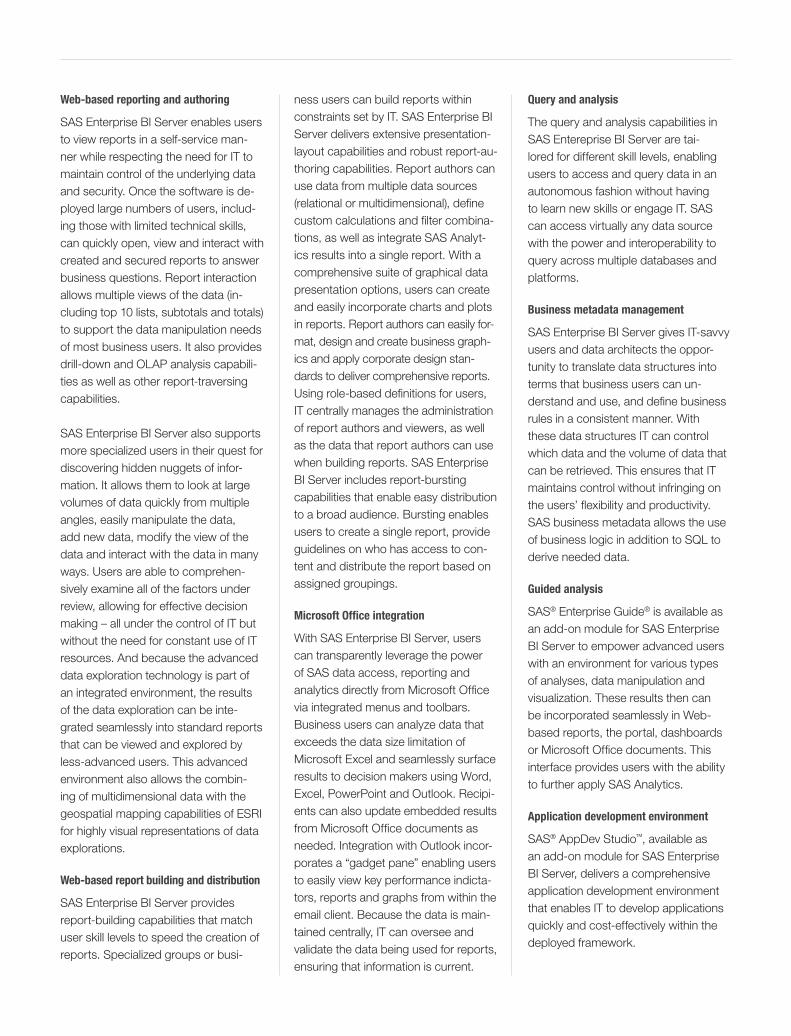
(Top) With SAS Enterprise BI Server, users can go from data to critical first-alert, call-to-action dashboards for performance results in seconds.
(Left) Highly effective and engaging Adobe Flash-based indicators deliver greater interactivity.
Web-based reporting and authoring
SAS Enterprise BI Server enables users to view reports in a selfservice manner while respecting the need for IT to main tain control of the underlying data and security. Once the software is deployed large numbers of users, including those with limited technical skills, can quickly open, view and interact with created and secured reports to answer business ques tions. Report interaction allows multiple views of the data (including top 10 lists, subtotals and totals) to support the data manipulation needs of most business us ers. It also provides drilldown and OLAP analysis capabilities as well as other reporttraversing capabilities.
SAS Enterprise BI Server also supports more specialized users in their quest for discovering hidden nuggets of information. It allows them to look at large volumes of data quickly from multiple angles, easily manipulate the data, add new data, modify the view of the data and interact with the data in many ways. Users are able to comprehensively examine all of the factors under review, allowing for effective decision making – all under the control of IT but without the need for constant use of IT resources. And because the advanced data explo ration technology is part of an integrated environment, the results of the data exploration can be integrated seamlessly into standard reports that can be viewed and explored by lessadvanced users. This advanced environment also allows the combining of multidimensional data with the geospatial mapping capa bilities of ESRI for highly visual represen tations of data explorations.
Web-based report building and distribution
SAS Enterprise BI Server provides reportbuilding capabilities that match user skill levels to speed the creation of reports. Specialized groups or busi
ness users can build reports within constraints set by IT. SAS Enterprise BI Server delivers extensive presentationlayout capabili ties and robust reportauthoring capabilities. Report authors can use data from multiple data sources (relational or multidimensional), define custom calculations and filter combinations, as well as integrate SAS Analytics results into a single report. With a comprehensive suite of graphical data presentation options, users can create and easily incorporate charts and plots in reports. Report authors can easily format, design and create business graphics and apply corporate design standards to deliver comprehensive reports. Using rolebased definitions for users, IT centrally manages the administration of report authors and viewers, as well as the data that report authors can use when building reports. SAS Enterprise BI Server includes reportbursting capabilities that enable easy distribution to a broad audience. Bursting enables users to create a single report, provide guidelines on who has access to content and distribute the report based on assigned groupings.
Microsoft Office integration
With SAS Enterprise BI Server, users can transparently leverage the power of SAS data access, reporting and analyt ics directly from Microsoft Office via integrated menus and toolbars. Business users can analyze data that exceeds the data size limitation of Microsoft Excel and seamlessly surface results to decision makers using Word, Excel, PowerPoint and Outlook. Recipients can also update embedded results from Microsoft Office docu ments as needed. Integration with Outlook incorporates a “gadget pane” enabling users to easily view key performance indictators, reports and graphs from within the email client. Because the data is maintained centrally, IT can oversee and validate the data being used for reports, ensuring that information is current.
Query and analysis
The query and analysis capabilities in SAS Entereprise BI Server are tailored for different skill levels, enabling users to ac cess and query data in an autonomous fashion without having to learn new skills or engage IT. SAS can access virtually any data source with the power and interoperability to query across multiple databases and platforms.
Business metadata management
SAS Enterprise BI Server gives ITsavvy users and data architects the opportunity to translate data structures into terms that business users can understand and use, and define business rules in a consistent manner. With these data structures IT can control which data and the volume of data that can be retrieved. This ensures that IT maintains control without infringing on the users’ flexibility and productivity. SAS business metadata allows the use of business logic in addi tion to SQL to derive needed data.
Guided analysis
SAS® Enterprise Guide® is available as an addon module for SAS Enterprise BI Server to empower advanced users with an environment for various types of analyses, data manipu lation and visualization. These results then can be incorporated seamlessly in Webbased reports, the portal, dash boards or Microsoft Office documents. This interface provides users with the ability to further apply SAS Analytics.
Application development environment
SAS® AppDev Studio™, available as an addon module for SAS Enterprise BI Server, delivers a comprehensive application development environment that enables IT to develop applications quickly and costeffectively within the deployed framework.
Key Features
Portal• Providesazero-footprint,Web-basedinterface.• Point-and-clickwizardsenableuserstocreate,deleteandreorderpages,addandremovecontent,andmodifypagelayouttoorganizecontentintheirpersonalworkspaces.
• Extensibleportalcapabilitiesincludeacomprehensivesetofportlets.Extendabletoincludenewportletscreatedin-house.• AcomprehensivesearchfacilitylocatesallcontenttypeswithinthesecurityconfinessetbyIT.• Customizablegraphicalortabulardashboardsenableuserstoeasilyunderstandkeyindicatorswiththeabilitytolinktomoredetailedinformation.• Easyaccesstovariouscontenttypes,includingreports,advanceddataexplorationsandotherstructuredandunstructuredcontentfromonelocationbasedonITsecurityrestrictions.
• LinktoreportsandanalyticalresultsfromSAS,SASforPerformanceManagementscorecardsandobjects,externallygenerateddataandvirtuallyanythingaddressablebyaURI.
• Drag-and-dropadministrationprovidesdata-to-dashboarddesigncapabilitiesinseconds.
Dashboard • Criticalfirst-alert,call-to-actiondashboardsforperformanceresults.• High-resolutionandengagingvisualizationofKPIs,forecastsandAdobeFlash-basedindicatorsdelivergreaterinteractivity.• Enhancedvisualizationstopreviewdatawithformats,KPIsandgraphicstoensureaccuracyindashboardoutput.• Linktoreports,SASStoredProcesses,portalobjects,URLsandembeddedparametersfor“deeplinking.”• Createdesktopalertstomonitoranindicator’svalue.• CreatedashboardsusingAdobeFlashbuilderinWYSIWYGfashionfromavarietyofdatasources,includingSASInformationMaps.• UsecontextualfiltersanddatabrushingdefinedinSASInformationMaps.• Role-based,secure,customizableandextensibleenvironment.• JSR168-compliantdashboardportletprovidestheflexibilitytointegratewithWebportalswithouttheneedforcustomcodingortheneedtodeployandsupportanotherportalcontainer.
• SASWebPartsforMicrosoftSharePoint2010providetheabilitytoaddSASBIdashboardsanddisplaydashboardsandKPIsataglancetohelpusersmonitororganizationalperformance.
Business visualization• Dynamicbusinessvisualizationforinteractivedataexploration,visualqueriesandmore.• Seerelationshipsthatarenoteasilydiscoveredintabularformats.• Makecomplexinterrelationshipsvisibleinaneasy-to-understandpicture.• CreatedatamoviesusingengagingAdobeFlash-basedinteractivity.• Providehighlyinteractivebusinessgraphics,includinganimatedbubbleplots,3-Dscatterplots,trellisplots,summarychartsandneedlecharts.• Generatestaticordynamicinteractive(JavaorActiveX)chartsandgraphsthatcanbeusedinthird-partyapplications.• Visuallyqueryandfilterdataforinteractivetabulationwiththeabilitytorearrangedataatwill.• Providevisualanalytics,includinginteractivesimulationsandoptimizationandstate-of-the-arttimeseriesmodeling.
Web-based reporting and authoring• ProvidesaWeb-based,interactivereportinginterfaceforinformationconsumers.• Richdesktop-likeexperiencethroughtheutilizationofAJAXprovidesmoredrag-and-dropfunctionality,resizingofobjectsonthescreen,partialscreenrefreshandcontext-sensitivemenus.
• Galleryofcommon,predefinedlayoutsandcustomtemplates.• Build,load,organize,viewandsavereportsbasedonOLAPcubesand/orrelationaldatafromoneormoredatasources.• Providemultidimensionaldataexploration:drill,rotate,filter,reorganize,sort,toggletotals,exporttovarioustargetformatsandmore.• Providerelationaldataexploration:rotate,filter,reorganize,sort,toggletotals,exporttovarioustargetformatsandmore.• PrintreportstoPDForexportformattedtablesandgraphs,orsimplydata,toExcel.• Surfacegeospatialmappinginformationandtheresultsofgeospatialanalysesintoreports.• Wizard-basedreportcreationwithenhancedgraphsandskins.• Enhancedscheduling,filteroptionsandprompts.
Web-based report building and distribution• ProvidesaWeb-based,interactivereport-buildinginterfaceforreportauthors.• Buildreportsthatmatchuserskilllevelsandtherequirementsoftheinformation.• Createaquickviewofdatathatletsyouselectadatasourceanddisplaythedefaultviewinonesimplestep.• Createsimplereports.Wizardsguidereportauthorsthroughreportcreation:
• Choosedataitemsneededfromanontechnical,IT-providedviewknownasaninformationmap.• Selectpredefinedfilters,setgroupingsandsorting,andoverridedefaultformatting.• Definereportlayout:tables,graphs,tableofcontents,footersandheaderscanbeadded.• Createcustomcalculationsandfilters.
• Createmorecomprehensivereportswithpowerfullayoutcapabilitiesforexperiencedreportauthorsandspecializedreports:• Definemultiplereportsectionswithdatafrommultipledatasources.• Choosefromagalleryofcommon,predefinedlayoutsandcustomtemplatesforaquickstart,orbeginfromablankpageandaddtables,graphsandtextmanually.
• Preciselypositionandsizegraphs,tables,text,images,etc.,withadvancedlayoutcapabilities.• Useadvancedformattingforallgraphs(size,style,decoration,data,legendplacement,etc.).• Useadvancedformattingfortext(font,size,color,alignment,etc.).• Usedynamictextinsertiontoshowinformationsuchasreportcreationdateandpromptvaluesasappropriate.• Definecustomcalculations,filtersandaggregations.
• Addhypertextlinksontext,images,tables,graphsandgroupbreaks,reportsorWebpages.• Out-of-the-boxcapabilitiessuchasreportlinkingwithinreporttablesandtheabilitytoincorporatecustomimageswithinreporttables.• SupportforembeddedHTMLindataitems,suchasimagesandhyperlinks,intabularoutput.• Linktoaspecificreportsectionwithinthesamereport.• Useconditionalhighlightingontablesandgraphstodefineexceptions.• Useavarietyofcharts:bar/3-Dbarwithmultiplelines,pie/3-Dpie,line,scatterandtilechartswiththeabilitytoaddannotatedreferencelinestographs.
• Sharereportswithlargeanddiverseaudiencesthroughreport-burstingcapabilities.• Savepredefinedreportsandinformationwithreportarchiving.• Commonpromptingframeworkallowsforthecreationorreportsthatallowprefilteringbasedonthedata,eliminatingtheneedforconstantre-creationofreportsandfiltersasnewdataitemsareadded.
• Search-infilterallowsuserstoquicklyfilterlargeamountsofdetaileddatatoseejustwhattheyneedinanefficient,productivemanner.• Multiplerepositoriesandcontentlocationindependence.• Newroleframeworkforcustomizingexistingrolesorcreatingnewrolestoauthorizecapabilities.
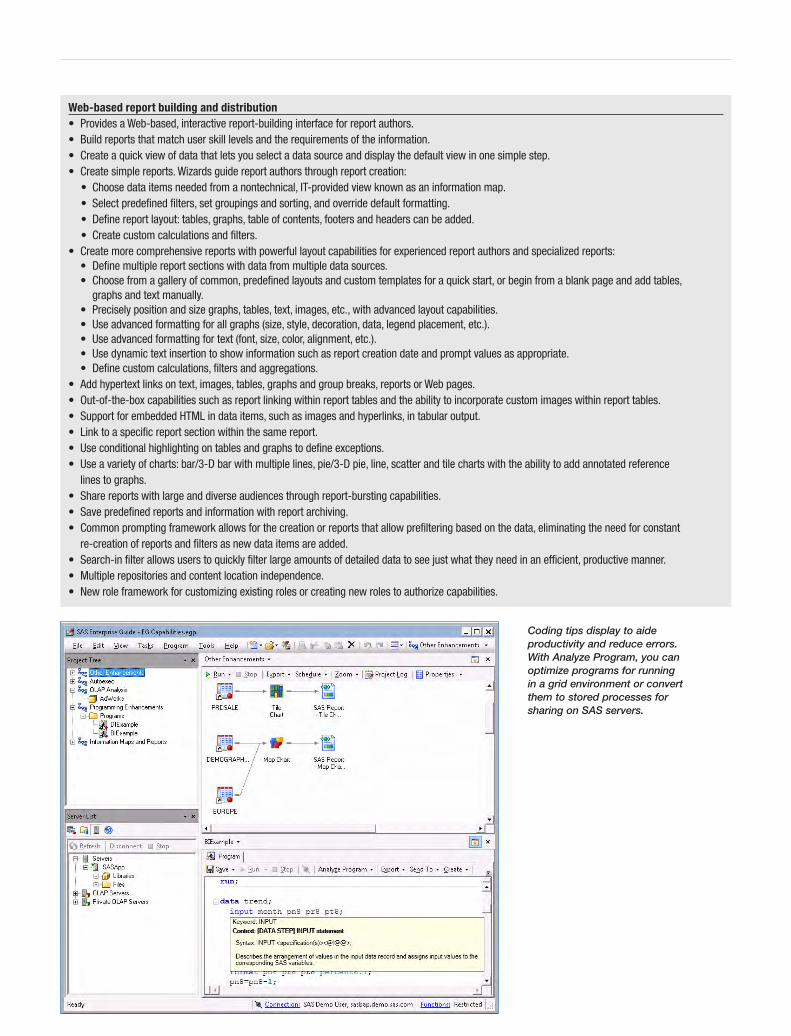
Coding tips display to aide productivity and reduce errors. With Analyze Program, you can optimize programs for running in a grid environment or convert them to stored processes for sharing on SAS servers.
Microsoft Office integration• AccessSAScapabilitiesfordataaccess,reportingandanalyticsdirectlyfromMicrosoftOfficetools,includingWord,Excel,PowerPointandOutlook.• Wizard-drivenreportcreationwithinMicrosoftOfficetools.• Provideofflineviewingofpreviouslycreatedresults.• UseMicrosoftExcelasanapplicationinsteadofanadhocdatastore.• AccessdatafromanycentrallyIT-definedenterprisedatasourceandperforma“writeback”tosourcedatausingMicrosoftExcel.• RefreshdataattheclickofabuttonfromanycentralenterprisedatasourcedefinedbyIT.• CyclethroughdatathatexceedsrowlimitationsofMicrosoftExcel.Server-sideoptimizationensureslargedatasourcesarenevertransferredasonetotheclient.
• UseallthecapabilitiesofMicrosoftExcelonthedatadisplayed,buthavetheabilitytoalwaysaccessthelatestviewofinformation.• EmbedintelligenceandinformationderivedfromSASintoMicrosoftWordandExcel.• DeliverresultsasaPDF,RTF,HTMLwithMicrosoftWord,rawdata(CSV)orHTMLintoExcelforfurthermanipulationwithnativeMicrosoftOfficefunctionality.
• Manipulatepivottablestoillustratemultidimensionaldatafromvarioussources.• DelivergraphicsresultsdirectlyintoMicrosoftWord,Excel,PowerPointandOutlookinanyoftheseformats:ActiveX,PDF,GIF,JPEGorPNG.• Refreshtablesandchartsautomaticallytogetthelatestviewofinformation,pullingfromcurrentdatathatiscentrallymaintained.• EnabledistributionofembeddedresultsondemandusingnativeMicrosoftOfficefunctionality.• UtilizethelatestMicrosoftOfficeribbon-bartechnologytologicallygrouplikeitems.• RenderreportscreatedwithSASWebReportStudioandSASEnterpriseGuideinsideofMicrosoftOffice.• ProvidetheabilitytoaddSASBIdashboardsandSASStoredProcessestoaSharePointpageusingSASWebPartsforMicrosoftSharePoint.DisplaydashboardsandKPIsataglancetoOutlookandSharePointuserssotheycanmonitororganizationalperformance.UserscandelvedeeperintoanalysisanddrilltootherSASBItoolsandanalyticsproductstogainadditionalinsight.
Query and analysis• ProvidesquerycapabilitiesforalllevelsofusersacrossmultipleBIinterfaces.• Providesazero-footprint,Web-based,interactiveinterfaceforadvanceduserslookingfornewviewsthatdefineanswerstoquestions.• Provideswizard-drivenquerycapabilitieswithintheuser-reportingenvironment.• ExploreandanalyzeOLAPcubes.• Changebusinessqueriesbyselectingbusinessitemstobedisplayedfromasidebar.• Sliceanddicemultidimensionaldatausingaspecialslicerdimensionandbyapplyingfiltersonanylevelofahierarchy.• Drillup/downthroughhierarchiesorexpand/collapseentirelevels.• Exploredatafollowingraggedorunbalancedhierarchiesthatmodeltruehierarchiesastheyareexperiencedinbusiness.• Obtaindetailedinformationforeverycell(drillthrough)withtheoptiontoexportittoMicrosoftExcel.• Rankmultidimensionaldatatoidentifytopperformersorlosers(tiescanbehandled).• Displayvisualtotals/subtotals,parentvalue,security-basedtotalsandpercentoftotals.• Calculatenewmeasuresandaddthemtoanyview.• Useconditionalhighlightingtoprovidevisualhighlightinformationinsidetablesandgraphsdependingonconditionsdefinedbytheuser.• Usetextformatting,cellformattingandtextreplacementwithfixedstringsorimagesanddisplayimagesnexttocellvalues.• UsemapsfromESRI’sArcGISServertodisplayOLAPdatajustlikeanyotherviewonthedata:• Synchronize,drillanddisplayformapandtableview.• DrillonregionsinmapstovisualizeinformationfromanOLAPdatasourceinrealtime,enablingazoomtothelevelofindividualhousesonaroad.• DrivethecolorcodingofmapsbydatafromtheOLAPdatasource.• Usemultipleselectionsinamap.
• SaveviewsasSASWebReportStudioreports,ExcelspreadsheetsorAdobePDFdocuments.Shareviewswithotheradvanceddataexplorationusers.• Removecomplexityofdatastructuresfromnontechnicalusers.• Allowqueriestobeperformedacrossmultipledatasources.• Incrementallyupdatecubesfornewdataandnewmembers.• AbilityforuserstosetOLAPquerytime-outoption.• Fast,easyandguidedOLAPcubecreation,includingahighlyscalable,integratedandopenOLAPservertoprovidethebestpossiblesupportofthevariousinterfacesthatcanusemultidimensionaldata;andapurpose-builtinterfacethatmakesiteasytobuildandmaintainSASOLAPcubes.
Business metadata management
• Mapphysicaldatastructurestobusinesstermsinaneasy-to-useinterface.• Accessdatafromvirtuallyanydatasource,includingmultiplesourcesatonce.• DefineconsistentbusinessviewsofthedataforrelationaltablesandOLAPcubes.• Createonebusinessviewoverdisparatedatabasemanagementsystemsforacombinedsetofqueryattributes.
• Combinedatafrommultiplesources.• Controlthesizeofresultsetsthatcanbereturnedtoavoidlong-runningqueries.• Captureconsistentbusinessrulesandspecifyallowableoptionsandpromptsforendusers.• Centrallymanagemetadata.• Createandmanageprompts,includingcascadingpromptsthatusedynamicallygeneratedvaluelists,repositories,controltheSASMetadataServer,defineaccesscontrols,andregisterandmanageusersandgroupsthroughasingleinterface.
Guided analysis (available as an add-on module)• Providesa.NET-basednativeWindowsapplicationforpowerusers,programmers,analystsormoreadvancedusers.• Enhanceduserinterfaceincludescontext-sensitivemenus,toolbarsandrole-baseduserdefinitions.• Providesalargenumberofprebuilttasksandtasktemplatescoveringawidevarietyoftopics.• Wizard-drivenconditionalflowlogiccapabilitiesformorerapidcreationofcomplexconditionalprocessing.• Newprogrameditorfeaturessuchasautocompleteandintegratedsyntaxhelpenhanceprogrammers’productivity.• Enhancedcomplexquerywithcomputedcolumnscreation,filteringoptionsandpreviewofresultsbringsefficiencytothequery-buildingprocess.• ViewOLAPcubesfromSASorfromothervendorsthatsupportOLEDBforOLAPandtheMDXstandard.• UseslicesofOLAPcubesforfurtheranalysis.• Easilyincorporategeospatialdataintoanalyses.• QueryandsubsetdatagraphicallyfromanyaccessiblesourceorwriteSQL/MDX.• PackageresultsintoSASStoredProcessesthatcanbeusedinallSASBusinessIntelligenceinterfacesandMicrosoftOfficetogainaccesstoanythingSAScando,allowingworktobedistributedwithoutITinvolvementwhilemaintainingsecurity.
Application development environment (available as an add-on module)• Acomprehensivestandalonedevelopmentenvironment,includingaJavaIDE,providesallrequiredSAScomponentsononemachineforeasydevelopmentandtesting.
• IncorporatesallSASAPIsandcomponentsforeasyreuseincorporatestandarddevelopmentenvironments.• Providesapowerfulsetofquick-starttemplates.• Allowsfortheeasycustomizationandextensionofanorganization’sbusinessintelligenceenvironment.
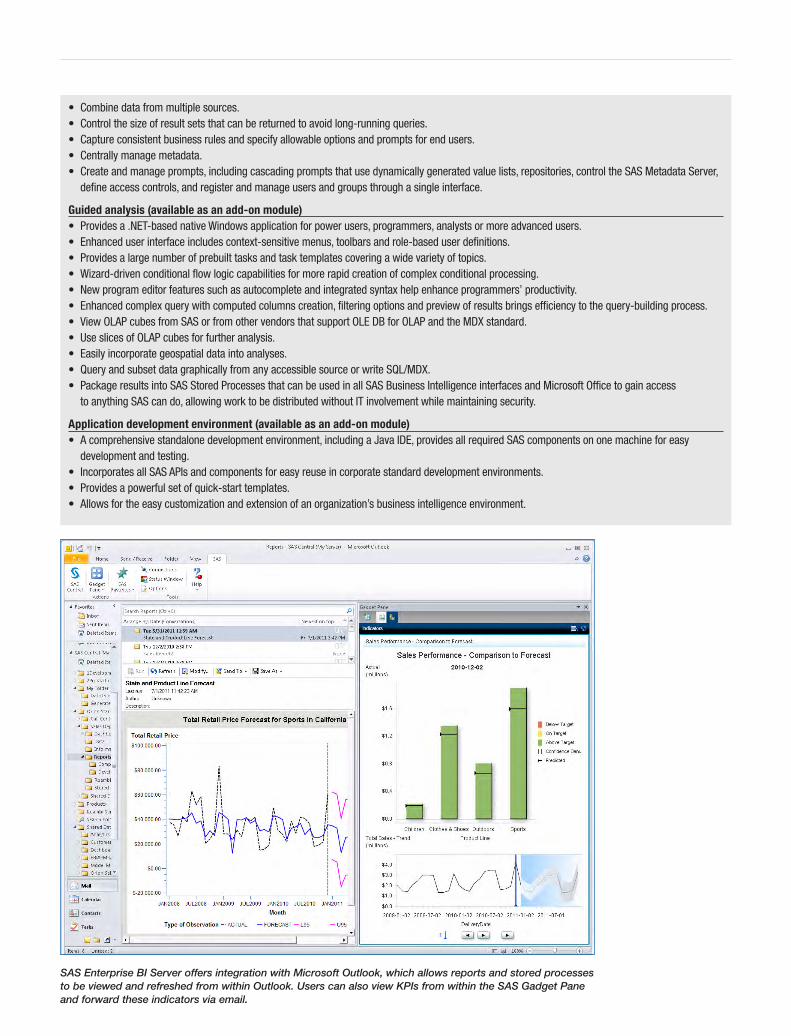
SAS Enterprise BI Server offers integration with Microsoft Outlook, which allows reports and stored processes to be viewed and refreshed from within Outlook. Users can also view KPIs from within the SAS Gadget Pane and forward these indicators via email.
SAS Institute Inc. World Headquarters +1 919 677 8000To contact your local SAS office, please visit: www.sas.com/offices
SAS and all other SAS Institute Inc. product or service names are registered trademarks or trademarks of SAS Institute Inc. in the USA and other countries. ® indicates USA registration. Other brand and product names are trademarks of their respective companies. Copyright © 2011, SAS Institute Inc. All rights reserved. 102115_S74835.0711
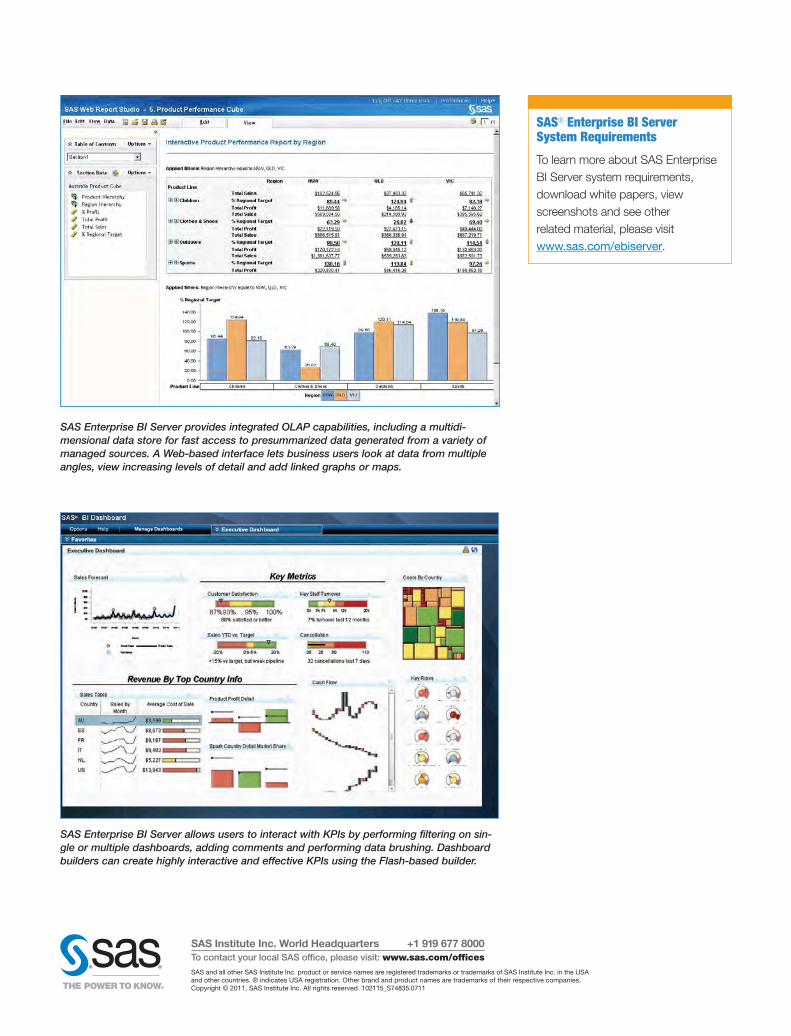
SAS Enterprise BI Server provides integrated OLAP capabilities, including a multidi-mensional data store for fast access to presummarized data generated from a variety of managed sources. A Web-based interface lets business users look at data from multiple angles, view increasing levels of detail and add linked graphs or maps.
SAS® Enterprise BI Server System Requirements
To learn more about SAS Enterprise BI Server system requirements, download white papers, view screenshots and see other related material, please visit www.sas.com/ebiserver.
SAS Enterprise BI Server allows users to interact with KPIs by performing filtering on sin-gle or multiple dashboards, adding comments and performing data brushing. Dashboard builders can create highly interactive and effective KPIs using the Flash-based builder.