Embed Size (px)
Citation preview

Guidelines for Pollutant Export Modelling inBrisbane Version 7 - Draft(Supplement to BCC Water Quality Management Guidelines)
October 2003
Stormwater quality improvementdevices: an artificial wetland, atrash rack and a grassed swale

Guidelines for Pollutant Export Modelling in Brisbane Version 7 – DraftRevision 2
i
BCC would like to acknowledge the following individuals for their contribution to the Guidelines for Pollutant ExportModelling in Brisbane Version 7- Draft:
Tim Fletcher CRC-Catchment HydrologyGraham Jenkins School of Environmental Engineering, Griffith UniversityMalcolm Eadie Ecological Engineering Pty LtdMatt Francey Melbourne WaterDale Brown Melbourne Water

Guidelines for Pollutant Export Modelling in Brisbane Version 7 – DraftRevision 2
ii
Table of Contents
1.0 INTRODUCTION 1
2.0 MUSIC 42.1 MUSIC Simulation Process 52.2 Meteorological Data 62.3 Source Nodes 8
2.3.1 Area 102.3.2 Soil Properties 112.3.3 Pollutant Concentration 13
2.4 Drainage Links 152.5 Treatment Devices 17
2.5.1 Vegetated Swales 192.5.2 Bioretention Systems 212.5.3 Buffer Strips 232.5.4 Constructed Wetlands 242.5.5 Ponds 262.5.6 Gross Pollutant Traps 282.5.7 Sediment Basins 292.5.8 Generic Treatment Node 31
2.6 Other Modelling Scenarios 322.6.1 Instream Works 322.6.2 Losses from the System 322.6.3 Rainwater Tanks 32
2.7 Requirements for Development Applications for MUSIC 33
3.0 AQUALM 353.1 AQUALM model parameters 35
3.1.1 Rainfall-runoff Model 353.1.2 Pollutant Export 383.1.3 Annual Pollutant Loads 40
3.2 Other Pollutant Loads 413.2.1 Point Loads 413.2.2 Septic Loads 41
3.3 Analysis of Treatment Options 42
4.0 GLOSSARY 43
5.0 ABBREVIATIONS 44
6.0 BIBLIOGRAPHY 45
7.0 INDEX 47
Guidelines for Pollutant Export Modelling in Brisbane Version 7 – DraftRevision 2
1
1.0 IntroductionThese guidelines are intended to assist developers and consulting engineers to establish inputparameters specific to Brisbane for use in two common stormwater quality modellingprograms: the Model for Urban Stormwater Improvement Conceptualisation (MUSIC) andAQUALM-XP. The guidelines also detail the modelling data that are recommended forinclusion in development applications. These guidelines will be used by Brisbane CityCouncil (BCC) officers when they assess development applications relating to runoff waterquality and stormwater treatment devices.
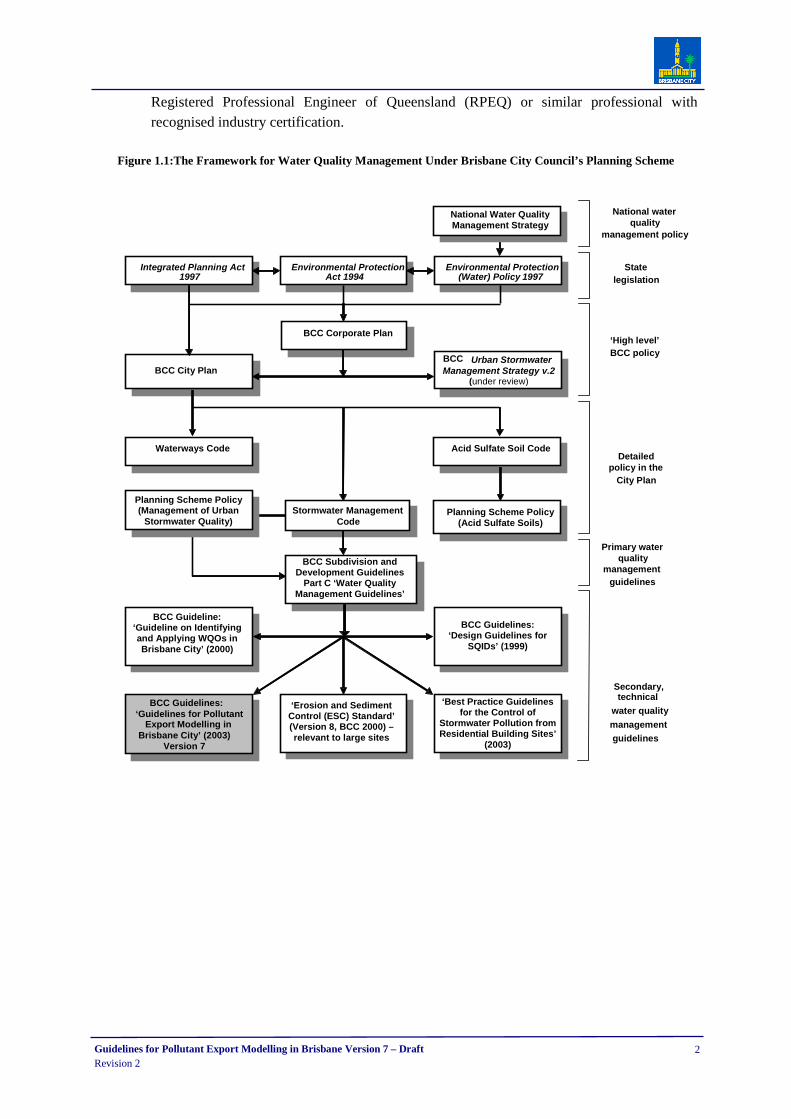
BCC has prepared these guidelines as a supplement to, rather than a substitute for, its WaterQuality Management Guidelines (BCC 2000a) and the MUSIC/ AQUALM-XP users’manuals (CRC-CH 2002; WP Software 1992) and supersedes the Guidelines for PollutantExport Modelling in Brisbane Version 6. Figure 1.1 shows where this document sits in theframework for water quality management under Brisbane City Council’s planning scheme.
Why undertake water quality modelling?
Council requires water quality modelling to be completed for some development activities(BCC 2000a). Such modelling predicts the likely water quality emanating from a catchmentand the performance of specific stormwater treatment measures. This evaluation can becompared with performance targets such as water quality objectives (WQOs), enablingstormwater managers to minimise the impacts on receiving waters of changes in land use andmanagement.
WQOs are measurable long-term goals for the quality of receiving waters. The medianannual pollutant concentrations (from combined wet and dry weather flows) generated by adevelopment during its operational phase must meet the WQOs. For further information onWQOs and their application, please consult the Guidelines on Identifying and ApplyingWater Quality Objectives in Brisbane City (BCC 2000b), the Water Quality ManagementGuidelines (BCC 2000a) and the relevant codes and policies in Brisbane City Plan 2000(BCC 2000c), hereafter referred to as City Plan.
Chapter 13 of the Draft Australian Runoff Quality (ARQ) (IEAust 2003) also providesfurther information on the philosophies of modelling of urban stormwater managementsystems.
Who should undertake water quality modelling?
The Water Quality Management Guidelines (BCC 2000a) define the process for determiningwhether water quality modelling is needed for a subdivision and development application. Ifrequired, the modelling must be undertaken by a qualified specialist with demonstratedexperience in modelling water quality or expertise in the processes upon which the model isbased. It is strongly encouraged that all submissions to BCC relating to water qualitymodelling be accompanied by a letter of certification or endorsement from either a
Guidelines for Pollutant Export Modelling in Brisbane Version 7 – DraftRevision 2
2
Registered Professional Engineer of Queensland (RPEQ) or similar professional withrecognised industry certification.
Figure 1.1:The Framework for Water Quality Management Under Brisbane City Council’s Planning Scheme
Integrated Planning Act1997
Environmental ProtectionAct 1994
Environmental Protection(Water) Policy
National Water QualityManagement Strategy
BCC Corporate Plan
Waterways Code
Code
Acid Sulfate Soil Code
‘Guidelines for PollutantExport Modelling in
Brisbane City’ (2003)Version 7
National waterquality
management policy
Statelegislation
‘High level’BCC policy
Detailedpolicy in the
City Plan
Primary waterquality
managementguidelines
Secondary,technical
water quality
managementguidelines
BCC Guidelines:
BCC Guideline:‘Guideline on Identifyingand Applying WQOs inBrisbane City’ (2000)
BCC Subdivision andDevelopment Guidelines
Part C ‘Water QualityManagement Guidelines’
BCC Guidelines:‘Design Guidelines for
SQIDs’ (1999)
‘Erosion and SedimentControl (ESC) Standard’(Version 8, BCC 2000) –relevant to large sites
‘Best Practice Guidelinesfor the Control of
Stormwater Pollution fromResidential Building Sites’
(2003)
1997
BCC City PlanBCC Urban StormwaterManagement Strategy v.2
(under review)
Stormwater ManagementPlanning Scheme Policy(Management of Urban
Stormwater Quality)Planning Scheme Policy
(Acid Sulfate Soils)
National Water QualityManagement Strategy

Guidelines for Pollutant Export Modelling in Brisbane Version 7 – DraftRevision 2
3
What models are catered for by the guidelines?
Input parameters have been produced for the two most frequently used models in Brisbane:MUSIC and AQUALM-XP.
What is the basis for the guidelines?
For approximately ten years BCC has been monitoring the quality of urban stormwater inBrisbane (BCC 1999a, 2000d, 2001a, 2002a, 2003a). The research has been used to developinput parameters for water quality modelling in Brisbane. Specifically, pollutantconcentrations and their export relationship with certain land uses have been derived.
These data are augmented by five years’ research into the efficiency of several StormwaterQuality Improvement Devices (SQIDs) including vegetated swales, wetlands and grosspollutant traps (GPTs) (BCC 2000e, 2001b, 2002b, 2003b).
A number of other monitoring programs are also being conducted in South East Queensland.Agencies currently involved in monitoring include Ipswich City Council, Gold Coast CityCouncil and the Environmental Protection Agency. Please contact these agencies for furtherinformation on their monitoring programs.
If methods or models other than MUSIC or AQUALM-XP are used to assess theperformance of stormwater management measures (e.g. XP-SWMM), practitioners need todemonstrate:
• the suitability of the model
• that the results meet the WQOs.

Guidelines for Pollutant Export Modelling in Brisbane Version 7 – DraftRevision 2
4
2.0 MUSICMUSIC is a decision support tool for stormwater managers (CRC-CH 2002). It helps them to plan and design (to conceptual level)appropriate urban stormwater management systems forcatchments. MUSIC has been developed by the CooperativeResearch Centre for Catchment Hydrology (CRC-CH) and wasreleased in May 2002.
MUSIC estimates stormwater pollution generation and simulates the performance of a groupof stormwater management measures configured in series or parallel to form a ‘treatmenttrain’. By simulating the performance of stormwater quality improvement measures MUSICdetermines if a proposed system can meet WQOs.
A users’ manual has been developed by the CRC-CH. Technical support and information ontraining sessions can be found on the CRC website: http://www.catchment.crc.org.au/
It is proposed that MUSIC will be updated once a year for the next four years, to allow forinclusion of the outcomes of new science. These updates to MUSIC may have a significantimpact on current modelling approaches and hence these guidelines will be updatedperiodically to reflect this. Users of these guidelines are advised to confirm they are usingthe most up-to-date version by contacting the Brisbane City Council, Urban ManagementDivision’s Water Resources Branch via the Brisbane City Council Call Centre on 07 34038888.
Practitioners’ Notes• MUSIC does not currently incorporate all aspects of stormwater management that
decision-makers must consider. Hydraulic analysis of stormwater drainage, life cycle costanalysis, indicators of ecosystem health and the integration of urban stormwatermanagement facilities into the urban landscape are currently omitted from the model.
• MUSIC is not a detailed design tool; it does not contain the algorithms necessary fordetailed sizing of structural stormwater quantity and/ or quality facilities.
Gui
delin
es f
or P
ollu
tant
Exp
ort
Mod
ellin
g in
Bri
sban
e V
ersi
on 7
– D
raft
Rev
isio
n 2
5
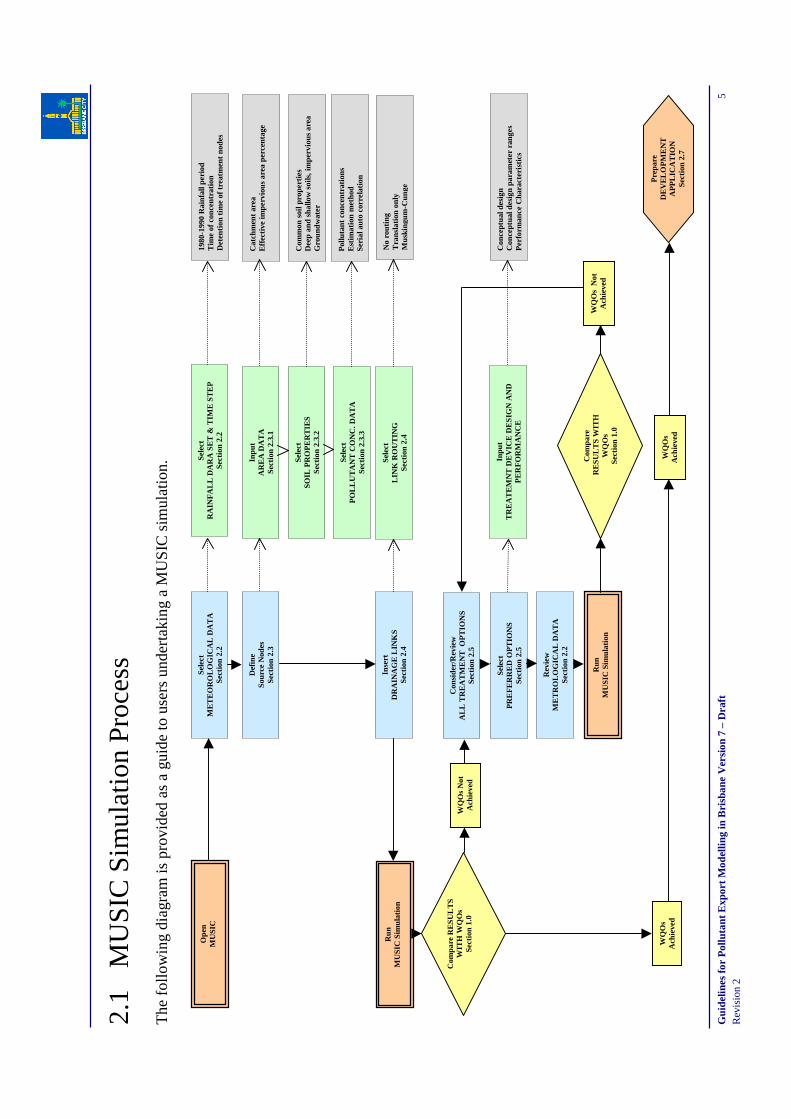
2.1
MU
SIC
Sim
ulat
ion
Proc
ess
The
fol
low
ing
diag
ram
is p
rovi
ded
as a
gui
de to
use
rs u
nder
taki
ng a
MU
SIC
sim
ulat
ion.
Ope
nM
USI
C
Run
MU
SIC
Sim
ulat
ion
Run
MU
SIC
Sim
ulat
ion
Com
pare
RE
SUL
TS
WIT
H W
QO
sSe
ctio
n 1.
0
Com
pare
RE
SUL
TS
WIT
HW
QO
sSe
ctio
n 1.
0
Sele
ctM
ET
EO
RO
LO
GIC
AL
DA
TA
Sect
ion
2.2
Def
ine
Sour
ce N
odes
Sect
ion
2.3
Sele
ctR
AIN
FA
LL
DA
RA
SE
T &
TIM
E S
TE
PSe
ctio
n 2.
2
Con
side
r/R
evie
wA
LL
TR
EA
TM
EN
T O
PT
ION
SSe
ctio
n 2.
5
Sele
ctP
RE
FE
RR
ED
OP
TIO
NS
Sect
ion
2.5
Rev
iew
ME
TR
OL
OG
ICA
L D
AT
ASe
ctio
n 2.
2
Inse
rtD
RA
INA
GE
LIN
KS
Sect
ion
2.4
Inpu
tA
RE
A D
AT
ASe
ctio
n 2.
3.1
Sele
ctSO
IL P
RO
PE
RT
IES
Sect
ion
2.3.
2
Sele
ctP
OL
LU
TA
NT
CO
NC
. DA
TA
Sect
ion
2.3.
3
Sele
ctL
INK
RO
UT
ING
Sect
ion
2.4
Inpu
tT
RE
AT
EM
NT
DE
VIC
E D
ES
IGN
AN
DP
ER
FO
RM
AN
CE
1980
-199
0 R
ainf
all p
erio
dT
ime
of c
once
ntra
tion
Det
enti
on t
ime
of t
reat
men
t no
des
Cat
chm
ent
area
Eff
ecti
ve im
perv
ious
are
a pe
rcen
tage
Com
mon
soi
l pro
pert
ies
Dee
p an
d sh
allo
w s
oils
, im
perv
ious
are
aG
roun
dwat
er
Pol
luta
nt c
once
ntra
tion
sE
stim
atio
n m
etho
dSe
rial
aut
o co
rrel
atio
n
No
rout
ing
Tra
nsla
tion
onl
yM
uski
ngum
-Cun
ge
Con
cept
ual d
esig
nC
once
ptua
l des
ign
para
met
er r
ange
sP
erfo
rman
ce C
hara
cter
isti
cs
WQ
Os
Ach
ieve
d
WQ
Os
Ach
ieve
d
WQ
Os
Not
Ach
ieve
d
WQ
Os
Not
Ach
ieve
d
Pre
pare
DE
VE
LO
PM
EN
TA
PP
LIC
AT
ION
Sect
ion
2.7

Guidelines for Pollutant Export Modelling in Brisbane Version 7 – DraftRevision 2
6
2.2 Meteorological DataThe first step in creating a MUSIC model is to select appropriate rainfall data and time steps.Meteorological data files contain recorded rainfall depths per time step over a nominatedperiod. MUSIC requires the user to select the meteorological data set (period and time step)that will be used as the basis for the runoff generation algorithms. MUSIC version 1.0 hasrainfall records for Brisbane covering the period between 1950 and 2000.
Recommended ReferencesCRC-CH 2002 Model for Urban Stormwater Improvement Conceptualisation User
Manual Version 1.00.DPI et al. 1992 Queensland Urban Drainage Manual
Meteorological Template File
Rainfall Data Set
A rainfall period of 10 years, specifically 1980-1990, should be used for all modelling fordevelopment assessment applications. This period was selected as it:
• is a long enough duration to allow the rainfall-runoff model to reach equilibrium, interms of soil stores, without a ‘warm up period’ having significant influence on theoverall simulation results
• is sufficiently long enough duration to simulate a reasonable range of climatic conditions
• provides a balance between modelling accuracy and simulation time and output file size
• represents a 10 year duration with a mean annual rainfall closest to the median value ofall the data.
Time Step
The selection of an appropriate time step is a balance between reasonable accuracy andcomputational time. Smaller time steps will reduce routing errors through small nodes butwill also result in longer computational times and larger results files. As a simple ‘rule ofthumb’ the MUSIC User Manual (CRC-CH 2002) suggests the time step should not begreater than the ‘time of concentration’ of the smallest Source Node (and preferably three tofour times smaller). However, the time step should also be selected based upon the smallestdetention time of any Treatment Nodes. When setting up your MUSIC catchment file youmay not know what (if any) treatment style you will be analysing so an iterative approachmay be required.
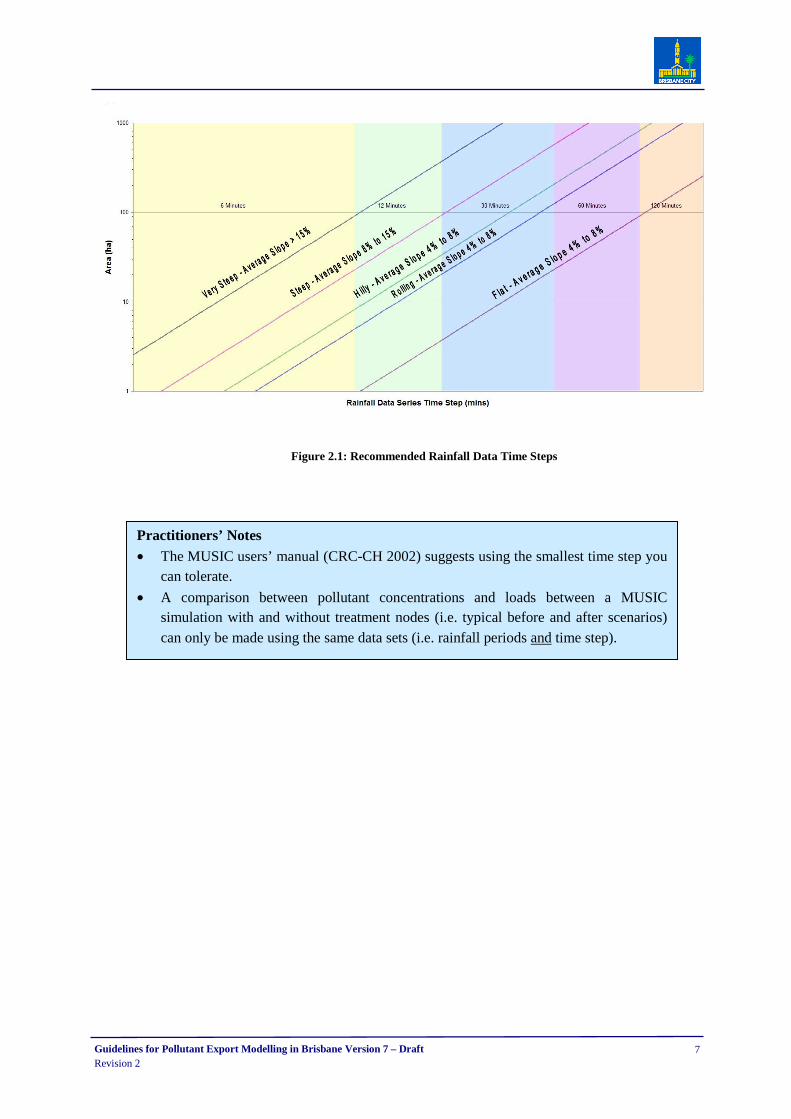
Determining the time of concentration of your smallest source node may be done usingtechniques outlined in the Queensland Urban Drainage Manual (DPI et al. 1992).Alternatively, Figure 2.1 provides a graphical summary of typical time steps (times ofconcentrations) which may be expected for differing catchment sizes and average catchmentslopes.
Guidelines for Pollutant Export Modelling in Brisbane Version 7 – DraftRevision 2
7
Figure 2.1: Recommended Rainfall Data Time Steps
Practitioners’ Notes• The MUSIC users’ manual (CRC-CH 2002) suggests using the smallest time step you
can tolerate.
• A comparison between pollutant concentrations and loads between a MUSICsimulation with and without treatment nodes (i.e. typical before and after scenarios)can only be made using the same data sets (i.e. rainfall periods and time step).

Guidelines for Pollutant Export Modelling in Brisbane Version 7 – DraftRevision 2
8
2.3 Source NodesThe second step in creating a MUSIC model is to define Source Nodes or sub-catchments.There are three generic Source Nodes in MUSIC, representing three basic land uses: Urban,Agricultural and Forested. Users can, however, create Source Nodes to simulate any type ofland use using their own effective impervious areas, soil properties and pollutantconcentrations. The data collected by BCC’s Stormwater Quality Monitoring Programhas allowed these parameters to be calibrated specifically for Brisbane for UrbanResidential, Commercial, Industrial, Rural Residential, and Forested Source Nodes.
Source Nodes for modelling Brisbane catchments are defined below. For modellingpurposes, City Plan classifications should be translated into MUSIC Source Nodes accordingto Table 2.1.
The Urban Residential Source Node in MUSIC is used to describe low to high densityresidential areas and activities servicing local neighbourhood needs. While such areas willtypically comprise a mix of land uses, including for example small nodes of commercial use,the majority of the area will consist of housing allotments, together with all associatedfacilities, such as roads, parks, school grounds, etc. It is typical for Urban Residential areasto contain less than 50% total impervious area.
The Commercial Source Node should consist mainly of a commercial precinct consisting ofcommercial enterprises not generating manufacturing wastes. Such areas will typicallyinclude associated activities such as offices and restaurants. The area of the Commercialnode will include building envelopes, parking areas, adjacent roads and road reserves. Sometypes of Special Purpose or Multipurpose Centres (as defined in City Plan) such as hospitals(SP1), major educational facilities (SP2), Suburban Centres (MP3) and Community Centres(MP4) may be modelled using this type of Source Node. Commercial areas are typified by ahigh percentage of total impervious area (e.g. approx. 70%).
The Industrial Source Node should consist of areas of light and general industry. These willtypically include activities associated with the manufacture and/ or distribution of goods (e.gheavy machinery). The area of the Industrial node will include building envelopes, parkingareas, adjacent roads and road reserves. Industrial areas are typified by a high percentage oftotal impervious area (e.g. approx. 85%). Extractive and Heavy Industry areas cannot bemodelled using this Source Node.
The Rural Residential Source Node largely applies to residential blocks on large allotments,with a high proportion of unpaved open space. Source Nodes of this type will also includeassociated activities servicing local needs, such as schools and parklands. In some cases,areas of broad hectare low intensity farming activities (where soils are not exposed) andsemi-natural broad hectare land may also be included. These nodes will typically have lessthan 30% total impervious area. City Plan classifications that can be modelled using thisSource Node may include areas of Low Density Residential, Rural, Sport and Recreation,and Environmental Protection classifications.

Guidelines for Pollutant Export Modelling in Brisbane Version 7 – DraftRevision 2
9
The Agricultural Source Node refers to areas of large scale cropping or grazing.
The Forested Source Node is to be used for natural bushland areas. This source node may beused for areas classified as Conservation areas in City Plan.
Table 2.1: Translation of City Plan Area Classifications into MUSIC Source Nodes
City Plan Area Classification MUSIC Source Node
Green Space Areas
Conservation Area Forested
Environmental Protection Area Rural Residential
Rural Area Agricultural
Sport and Recreation Area Rural Residential
Parkland Area Rural Residential
Residential Areas
Low Density Residential Urban Residential
Character Residential Area Urban Residential
Low-Medium Density Residential Area Urban Residential
Medium Density Residential Area Urban Residential
High Density Residential Area Urban Residential
Industrial Area
Future Industrial Area Industrial
Light Industrial Area Industrial
General Industrial Area Industrial
Emerging Community Areas
Emerging Community Areas Various
Special Purpose Centres Various
Community Use Areas Various
Multi-Purpose Centre Commercial

Guidelines for Pollutant Export Modelling in Brisbane Version 7 – DraftRevision 2
10
2.3.1 Area
Each MUSIC Source Node requires the total area and “effective” impervious proportions tobe defined. These values along with the rainfall data and soil properties determine the runoffgeneration from a catchment.
Recommended referencesCRC-CH 2002 Model for Urban Stormwater Improvement Conceptualisation User
Manual Version 1.00.IEAust 2003 Draft Australian Runoff QualityBCC 2000a Water Quality Management Guidelines, Part C of BCC’s Subdivision
and Development Guidelines
Parameter Ranges
Total Area
To be defined by the practitioner.
Pervious and Effective Impervious Proportions
The estimation of the percentage effective impervious area (or imperviousness in MUSIC) isdetermined as the percentage of the overall total impervious area (refer to Section 4.0 fordefinitions) as presented in Table 2.2. The total impervious area is generally determinedfrom analysis of the proposed development layout and/or GIS and aerial images. Forinstance, an urban catchment (Source Node) is observed to have a 50% total impervious areahence the % impervious for MUSIC is 16%, being 31% of 50%.
Table 2.2: MUSIC Pervious and Impervious Area Parameters
UrbanResidential
Commercial IndustrialRural
ResidentialForested
Effective Impervious Area as a% of the Total ImperviousArea
31 50 76 55 0
Practitioners' Notes• If the total impervious or pervious relationships within a single catchment are known
(or anticipated) to differ considerably across the catchment then two nodes should beused to simulate the difference in characteristics.
• Runoff generation within MUSIC is highly sensitive to the effective percentageimpervious nominated for a given Source Node. Hence, users should include a soundanalysis or reference for justification of the adopted % Impervious.

Guidelines for Pollutant Export Modelling in Brisbane Version 7 – DraftRevision 2
11
2.3.2 Soil Properties
Each MUSIC Source Node requires the definition of Soil Properties within a catchment.These values along with the rainfall data determine the runoff generation from a catchment.It should be noted that these soil parameters cannot be related to measurablecatchment characteristics such as known soil and geological properties.
Recommended ReferencesCRC-CH 2002 Model for Urban Stormwater Improvement Conceptualisation User
Manual Version 1.00.BCC 2000a Water Quality Management Guidelines, supplement to BCC’s
Subdivision and Development Guidelines
Parameter Ranges
The soil properties of a catchment have been derived through calibration using data fromBrisbane City Council’s Stormwater Monitoring Program (BCC 2003a). Table 2.3 presentsthe calibrated soil parameters for a variety of land uses across Brisbane.
Table 2.3: Recommended MUSIC Runoff Generation Parameters
ParameterUrban
ResidentialCommercial Industrial
RuralResidential
Forested
Field Capacity (mm) 200 80 80 80 80
Infiltration Capacity Coefficient a 50 200 200 200 200
Infiltration Capacity Exponent b 1 1 1 1 1
Rainfall Threshold (mm) 1 1 1 1 1
Soil Capacity (mm)* 400! 120† 120† 120† 120†
Initial Storage (%)* 10 25 25 25 25
Daily Recharge Rate (%) 25 25 25 25 25
Daily Drainage Rate (%)§ 5 5 5 5 5
Initial Depth (mm) 50 50 50 50 50
Notes: * Single pervious soil store adopted.† Shallow Soil Store! Deep Soil Store§ Refer to following Practitioners’ Notes

Guidelines for Pollutant Export Modelling in Brisbane Version 7 – DraftRevision 2
12
Practitioners’ Notes• Calibration of agricultural land use has not been possible due to the limitation of data set
presently available. It is therefore recommended that the runoff generation parameters (ie.effective impervious area and soil properties) for Rural Residential should be used.
• MUSIC’s rainfall-runoff model assumes (via Daily Drainage Rate parameter) thatgroundwater returns to surface waters as base flow downstream. For small catchmentswith no surface waters, groundwater would not discharge to surface waters within thecatchment of interest. Hence, for small catchments, particularly in upland areas the DailyDrainage Rate should be set to zero, to reflect the effective loss of that groundwater fromthe catchment.
Guidelines for Pollutant Export Modelling in Brisbane Version 7 – DraftRevision 2
13
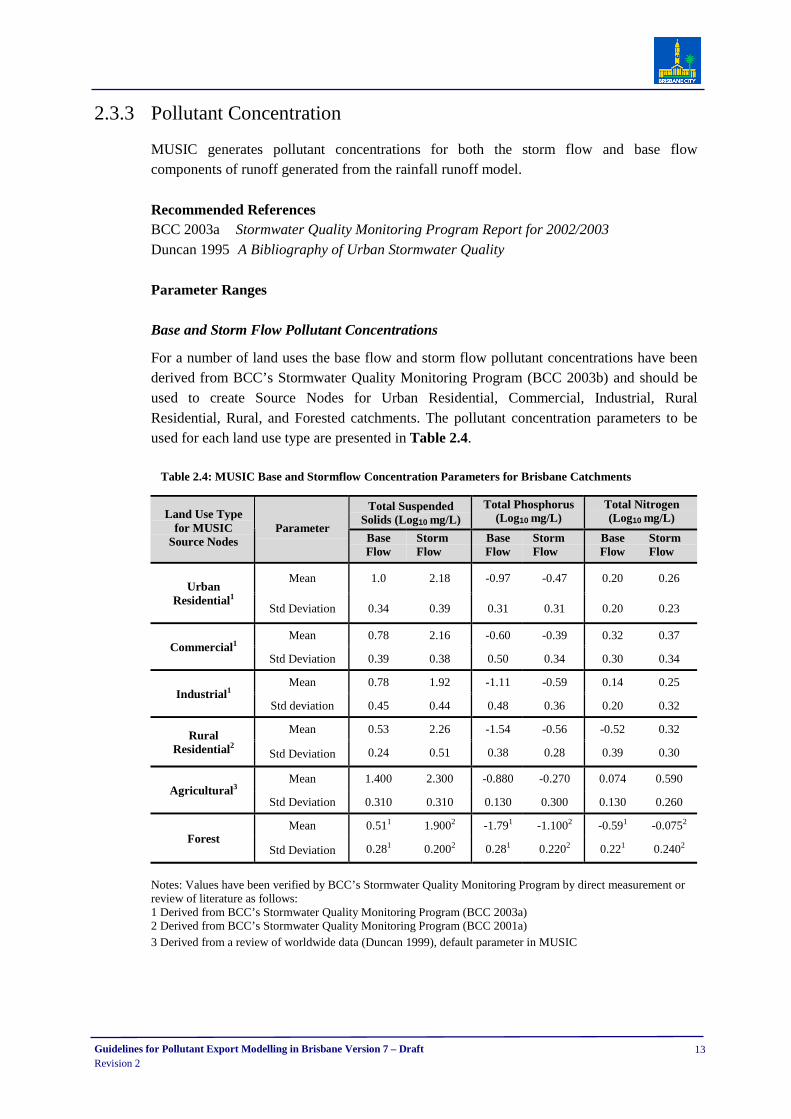
2.3.3 Pollutant Concentration
MUSIC generates pollutant concentrations for both the storm flow and base flowcomponents of runoff generated from the rainfall runoff model.
Recommended ReferencesBCC 2003a Stormwater Quality Monitoring Program Report for 2002/2003Duncan 1995 A Bibliography of Urban Stormwater Quality
Parameter Ranges
Base and Storm Flow Pollutant Concentrations
For a number of land uses the base flow and storm flow pollutant concentrations have beenderived from BCC’s Stormwater Quality Monitoring Program (BCC 2003b) and should beused to create Source Nodes for Urban Residential, Commercial, Industrial, RuralResidential, Rural, and Forested catchments. The pollutant concentration parameters to beused for each land use type are presented in Table 2.4.
Table 2.4: MUSIC Base and Stormflow Concentration Parameters for Brisbane Catchments
Total SuspendedSolids (Log10 mg/L)
Total Phosphorus(Log10 mg/L)
Total Nitrogen(Log10 mg/L)Land Use Type
for MUSICSource Nodes
ParameterBaseFlow
StormFlow
BaseFlow
StormFlow
BaseFlow
StormFlow
Mean 1.0 2.18 -0.97 -0.47 0.20 0.26Urban
Residential1
Std Deviation 0.34 0.39 0.31 0.31 0.20 0.23
Mean 0.78 2.16 -0.60 -0.39 0.32 0.37Commercial1
Std Deviation 0.39 0.38 0.50 0.34 0.30 0.34
Mean 0.78 1.92 -1.11 -0.59 0.14 0.25Industrial1
Std deviation 0.45 0.44 0.48 0.36 0.20 0.32
Mean 0.53 2.26 -1.54 -0.56 -0.52 0.32RuralResidential2
Std Deviation 0.24 0.51 0.38 0.28 0.39 0.30
Mean 1.400 2.300 -0.880 -0.270 0.074 0.590Agricultural3
Std Deviation 0.310 0.310 0.130 0.300 0.130 0.260
Mean 0.511 1.9002 -1.791 -1.1002 -0.591 -0.0752
ForestStd Deviation 0.281 0.2002 0.281 0.2202 0.221 0.2402
Notes: Values have been verified by BCC’s Stormwater Quality Monitoring Program by direct measurement orreview of literature as follows:1 Derived from BCC’s Stormwater Quality Monitoring Program (BCC 2003a)2 Derived from BCC’s Stormwater Quality Monitoring Program (BCC 2001a)3 Derived from a review of worldwide data (Duncan 1999), default parameter in MUSIC

Guidelines for Pollutant Export Modelling in Brisbane Version 7 – DraftRevision 2
14
Estimation Method
Stochastically generated data are always to be used. Stochastic generation is necessary toreflect the dynamic conditions in which stormwater treatment measures operate. Static Meanresults may also be presented in addition to the Stochastic results where this is necessary topermit a particular comparison.
Serial Autocorrelation
There is currently insufficient data to recommend a value for Serial Correlation (also calledautocorrelation) for pollutant concentrations. As a result, serial correlation for all pollutantconcentrations should be set to zero. It should be noted that when stochastic generation isselected, MUSIC automatically generates storm flow total phosphorus concentrations basedon a correlation (R2) between total phosphorus and total suspended solids.
Practitioners’ Notes• The option is always available for the proponent to develop an alternative set of
pollutant concentration data if a scientifically rigorous case can be supplied to Councilto support the claim that the proposed concentration data sets are superior to thosecontained in these guidelines.
• The use of alternative pollutant concentration data sets will only be permitted whereapproval in writing has been obtained from Council’s Water Resources Branch.Information to be supplied to Council to support this should include at a minimum,sampling details (location, type, sampling protocols, number of samples, duration,period), analysis details (laboratory, analysis methods), and catchment description (landuse proportions, impervious areas, size, slope, soil characteristics).
Guidelines for Pollutant Export Modelling in Brisbane Version 7 – DraftRevision 2
15
2.4 Drainage LinksMUSIC uses Drainage Links to join together source, treatment and junction nodes. Thesedrainage links may represent pipes, open channels or a natural watercourse. To enable moreaccurate simulation the user may specify the routing properties of each link.
Recommended ReferencesCRC-CH 2002 Model for Urban Stormwater Improvement Conceptualisation User
Manual Version 1.00.
Parameter Ranges
Routing Properties
There are three options for hydrologic routing along a link in MUSIC:1. No Routing - has no attenuation or delay of the peak flows between the source node
and the receiving node. Generally suitable when catchment source nodes are ofsimilar travel distance from the receiving node. Will typically generate conservativepeak flow values. In lieu of supporting hydrological calculations of the anticipatedrunoff characteristics it is recommended that users adopt the No Routing option forthe simulated links between source and receiving nodes (i.e. channels, pipes andnatural watercourses).
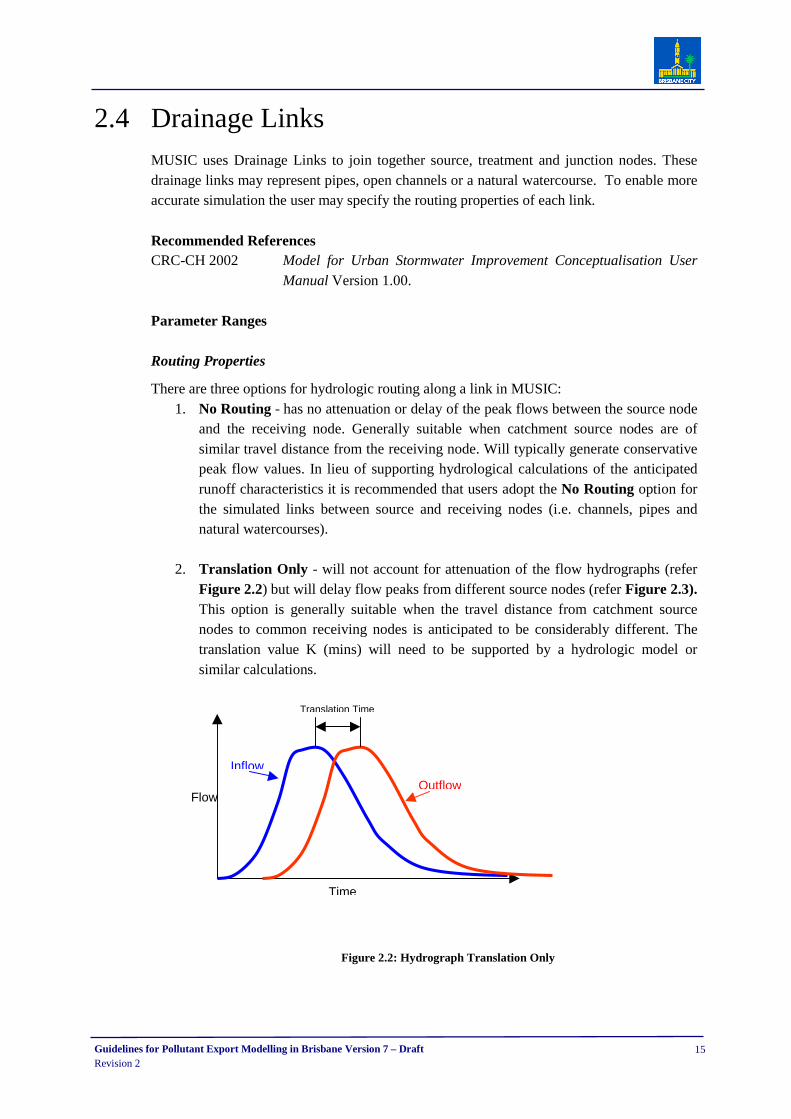
2. Translation Only - will not account for attenuation of the flow hydrographs (referFigure 2.2) but will delay flow peaks from different source nodes (refer Figure 2.3).This option is generally suitable when the travel distance from catchment sourcenodes to common receiving nodes is anticipated to be considerably different. Thetranslation value K (mins) will need to be supported by a hydrologic model orsimilar calculations.
Figure 2.2: Hydrograph Translation Only
Flow
Time
Translation Time
Inflow
Outflow
Guidelines for Pollutant Export Modelling in Brisbane Version 7 – DraftRevision 2
16
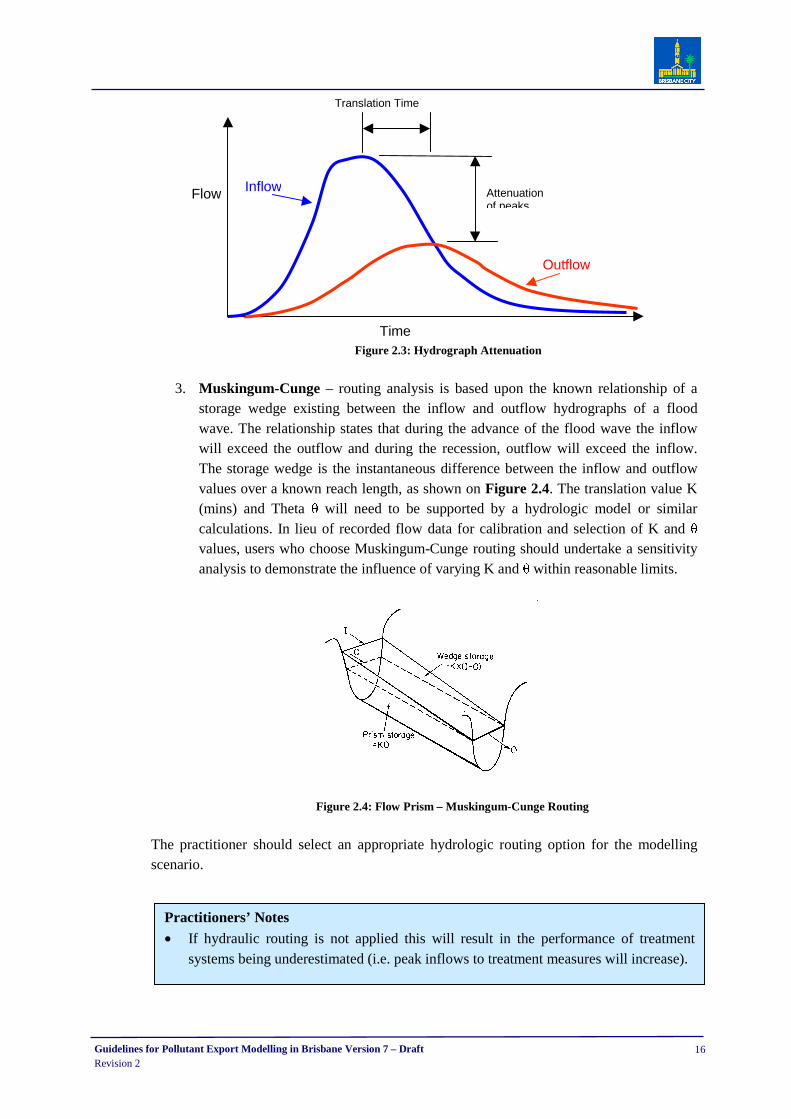
Figure 2.3: Hydrograph Attenuation
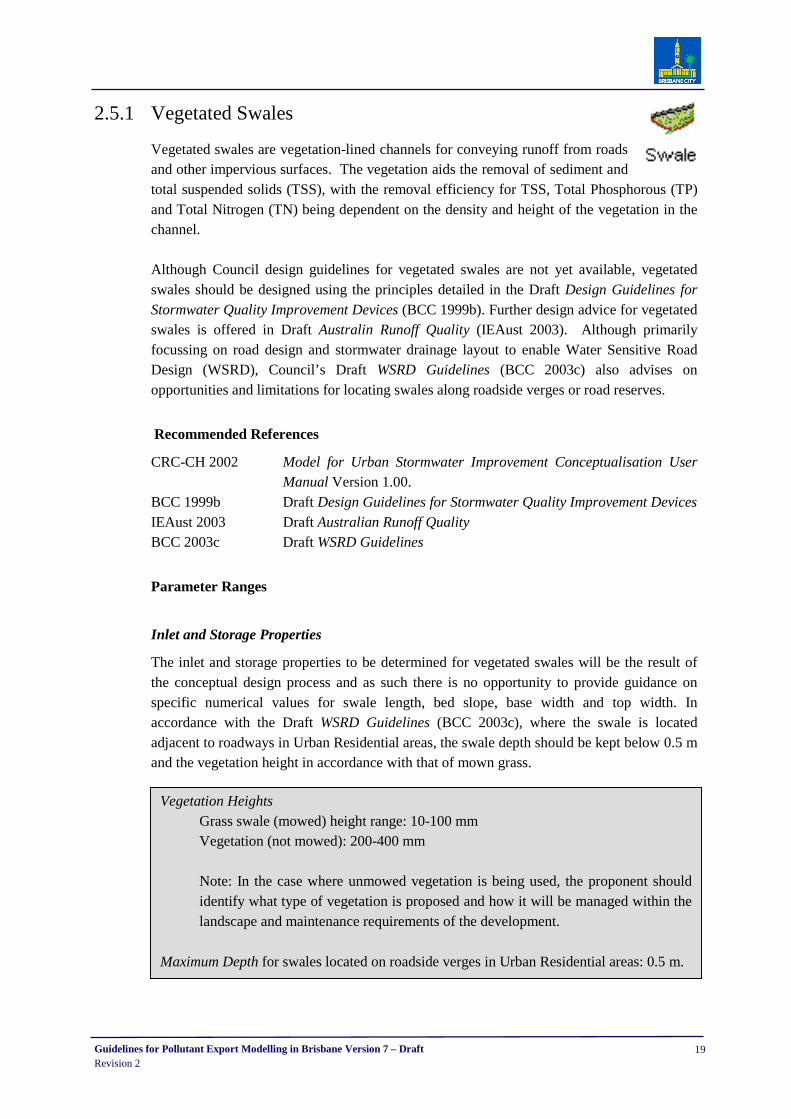
3. Muskingum-Cunge – routing analysis is based upon the known relationship of astorage wedge existing between the inflow and outflow hydrographs of a floodwave. The relationship states that during the advance of the flood wave the inflowwill exceed the outflow and during the recession, outflow will exceed the inflow.The storage wedge is the instantaneous difference between the inflow and outflowvalues over a known reach length, as shown on Figure 2.4. The translation value K(mins) and Theta θ will need to be supported by a hydrologic model or similarcalculations. In lieu of recorded flow data for calibration and selection of K and θvalues, users who choose Muskingum-Cunge routing should undertake a sensitivityanalysis to demonstrate the influence of varying K and θ within reasonable limits.
Figure 2.4: Flow Prism – Muskingum-Cunge Routing
The practitioner should select an appropriate hydrologic routing option for the modellingscenario.
Flow
Time
Inflow
Outflow
Attenuationof peaks
Translation Time
Practitioners’ Notes• If hydraulic routing is not applied this will result in the performance of treatment
systems being underestimated (i.e. peak inflows to treatment measures will increase).

Guidelines for Pollutant Export Modelling in Brisbane Version 7 – DraftRevision 2
17
2.5 Treatment DevicesOnce you have established your model and determined your base level pollutantconcentrations the next step is to compare the results against the relevant WQOs (refer toSection 1.0) then select and model appropriate treatment options.
MUSIC models the performance of seven different types of stormwater quality treatmentdevices:
• Vegetated Swales
• Bioretention Systems
• Buffer Strips
• Constructed Wetlands
• Ponds
• GPTs
• Sediment Basins.
MUSIC also provides a Generic Treatment Node which can model the performance of othertreatment measures (including non-structural measures) that are not included in the defaultrange.
The following sections provide guidance on the input parameters to be used in modelling theperformance of the treatment measures.
The section does not provide guidance on the selection and/ or design of treatment devices.All stormwater treatment devices should be designed in accordance with the Draft DesignGuidelines for Stormwater Quality Improvement Devices (BCC 1999b). Where Councildesign guidelines are not yet available, the principles contained in this document should stillbe adhered to. Further design advice for a variety of SQIDs is offered in the Draft AustralianRunoff Quality (IEAust 2003). ARQ provides an overview of current best practice in themanagement of urban stormwater in Australia including:
• procedures for estimating a range of urban stormwater contaminants
• design guidelines for commonly applied stormwater quantity and quality managementpractices
• procedures for estimating the performance of these practices
• advice with respect to the development/ consideration of integrated urban water cyclemanagement practices.
It is, however, recommended that a treatment train is adopted in providing stormwatermanagement solutions. This approach uses a sequence of treatment options to maximise thephysical and biological treatment processes required to reduce pollutants from stormwaterflows during rain events and ambient flows. In most cases it is preferable to establish atreatment train as it is rarely the case that a single treatment device will have the capabilitiesto treat all of the contaminants in stormwater.

Guidelines for Pollutant Export Modelling in Brisbane Version 7 – DraftRevision 2
18
The treatment train may include the following components:• at-source control measures such as buffer strips, grassed swales or infiltration trenches to
reduce coarse sediments and associated pollutants• GPTs to intercept coarse sediment and trash• sedimentation basins to reduce stormwater flows and remove suspended solids and
associated pollutants from high stormwater flows• wetlands to intercept fine colloidal particles and provide biological treatment of
dissolved pollutants found in low/ base flows.
Guidelines for Pollutant Export Modelling in Brisbane Version 7 – DraftRevision 2
19
2.5.1 Vegetated Swales
Vegetated swales are vegetation-lined channels for conveying runoff from roadsand other impervious surfaces. The vegetation aids the removal of sediment andtotal suspended solids (TSS), with the removal efficiency for TSS, Total Phosphorous (TP)and Total Nitrogen (TN) being dependent on the density and height of the vegetation in thechannel.
Although Council design guidelines for vegetated swales are not yet available, vegetatedswales should be designed using the principles detailed in the Draft Design Guidelines forStormwater Quality Improvement Devices (BCC 1999b). Further design advice for vegetatedswales is offered in Draft Australin Runoff Quality (IEAust 2003). Although primarilyfocussing on road design and stormwater drainage layout to enable Water Sensitive RoadDesign (WSRD), Council’s Draft WSRD Guidelines (BCC 2003c) also advises onopportunities and limitations for locating swales along roadside verges or road reserves.
Recommended References
CRC-CH 2002 Model for Urban Stormwater Improvement Conceptualisation UserManual Version 1.00.
BCC 1999b Draft Design Guidelines for Stormwater Quality Improvement DevicesIEAust 2003 Draft Australian Runoff QualityBCC 2003c Draft WSRD Guidelines
Parameter Ranges
Inlet and Storage Properties
The inlet and storage properties to be determined for vegetated swales will be the result ofthe conceptual design process and as such there is no opportunity to provide guidance onspecific numerical values for swale length, bed slope, base width and top width. Inaccordance with the Draft WSRD Guidelines (BCC 2003c), where the swale is locatedadjacent to roadways in Urban Residential areas, the swale depth should be kept below 0.5 mand the vegetation height in accordance with that of mown grass.
Vegetation HeightsGrass swale (mowed) height range: 10-100 mmVegetation (not mowed): 200-400 mm
Note: In the case where unmowed vegetation is being used, the proponent shouldidentify what type of vegetation is proposed and how it will be managed within thelandscape and maintenance requirements of the development.
Maximum Depth for swales located on roadside verges in Urban Residential areas: 0.5 m.

Guidelines for Pollutant Export Modelling in Brisbane Version 7 – DraftRevision 2
20
Advanced Properties
k and C* values for TSS, TP and TN should be set as default values.
The option is always available to develop alternative data sets for k and C* values if ascientifically rigorous case can be supplied to Council to support the claim that the proposeddata sets are superior than those contained in these guidelines.
Practitioners’ Notes• The use of alternative treatment performance data sets will only be permitted where
approval in writing has been obtained from Council’s Water Resources Branch.
• Any request to use alternative treatment performance values will require thesubmission of supporting evidence providing a detailed description of themonitoring/ experiments from which the values were derived. This may include, butis not limited to, the type of pollutants, type of swale, operating conditions, inflowconcentrations, sampling methods, analysis methods and laboratory accreditation.

Guidelines for Pollutant Export Modelling in Brisbane Version 7 – DraftRevision 2
21
2.5.2 Bioretention Systems
The fundamental principle behind the function of Bioretention Systems for stormwaterquality improvement is the use of soil and plants to delay, attenuate and facilitate theremoval of pollutants from localised catchment runoff. They promote the removal ofparticulate and soluble contaminants by passing stormwater through a filter medium, thusreducing concentrations of TSS, TP and TN.
Bioretention systems are modelled in MUSIC as surface treatment systems in which theoutlet has been replaced by the discharge characteristics associated with the soil into whichdetained water infiltrates. These systems are modelled in MUSIC as two components: (a)above-ground storage (modelled by the k-C* algorithm) and (b) below-ground filter medium(modelled by a non-linear regression function). MUSIC can therefore be used to model manytypes of Bioretention Systems including roadside swales with infiltration underdrains,unvegetated infiltration systems and vegetated ponding systems.
There are currently no design guidelines offered by BCC for designing BioretentionSystems; however, design of stormwater treatment trains including these systems shouldfollow the principles contained in Council’s Draft Design Guidelines for Stormwater QualityImprovement Devices (BCC 1999b). Further design advice for Bioretention Systems isoffered in Draft Australian Runoff Quality (IEAust 2003). Council’s Draft WSRD Guidelines(BCC 2003c) advises on design opportunities and limitations for locating BioretentionSystems on roadside verges or within road reserves.
Recommended ReferencesIEAust 2003 Draft Australian Runoff QualityPGDER 1993 Design Manual for Use of Bioretention in Storm Water Management.
(Includes specifications for the physical and chemical characteristics of theplanting soil, vegetation selection, mulch layer, slope, maximum pondingdepth, sizing of the bioretention system and maintenance)
BCC 1999b Draft Design Guidelines for Stormwater Quality Improvement DevicesBCC 2003c Draft WSRD Guidelines
Parameter Ranges
Inlet, Storage, Infiltration and Outlet Properties
The inlet, storage, infiltration and outlet properties to be determined for bioretentionsystems will be derived from the conceptual design process and as such there is noopportunity to provide guidance on specific numerical values.
Exceptions to this rule are where these systems are located on roadside verges in UrbanResidential areas, where the extended detention depth should be kept below 0.5 m inaccordance with the Draft WSRD Guidelines (BCC 2003c).
Parameters for filter particle effective diameter and hydraulic conductivity should be sourcedfrom Table 2.5.

Guidelines for Pollutant Export Modelling in Brisbane Version 7 – DraftRevision 2
22
Table 2.5: Hydraulic Conductivity for a Range of Media Particle Sizes (d50) ( IEAust 2003)
Saturated Hydraulic ConductivitySoil type Particle Size (mm)
(mm/hr) (m/s)
Gravel 2 36000 1 x 10⁻²
Coarse Sand 1 3600 1 x 10⁻³
Sand 0.7 360 1 x 10⁻⁴
Sandy Loam 0.45 180 5 x 10⁻⁵
Sandy Clay 0.01 36 1 x 10⁻⁵
Advanced PropertiesThe advanced properties for k and C* for TSS, TP and TN provided in the MUSIC programdescribe the treatment processes in the surface treatment part of the Bioretention System. Itis therefore important for the proponent to provide a full description of the system modelled.The MUSIC defaults for these parameters are set to model a Bioretention System withsurface ponding. Where the surface treatment component of the Bioretention System iscomprised of a swale, the default k and C* values for a swale detailed in Section 2.5.1 of thisguideline should be used. When alternative data sets to those in these guidelines are offeredby the proponent, a scientifically rigorous case must be supplied to Council to support theclaim that the proposed data sets are superior than those contained in these guidelines.
The number of CSTRs in series will also vary depending on the above-ground treatmentsystem modelled. Where a Bioretention System with surface ponding is used, the conceptualdesign of the above-ground treatment system must result in a layout that ensures a minimumof three CSTRs (refer to MUSIC Manual Section 5 Universal Stormwater Treatment Model,Figure 5.1).
Practitioners’ Notes• The use of alternative treatment performance data sets for k and C* than those stated
in these guidelines will only be permitted where approval in writing has been obtainedfrom Council’s Water Resources Branch.
• If bioretention systems are used without initial sediment treatment the k and C*values for TSS should be changed to perform at the same level as a sediment pond.This is normally only appropriate for large retention and infiltration systems.

Guidelines for Pollutant Export Modelling in Brisbane Version 7 – DraftRevision 2
23
2.5.3 Buffer Strips
Buffer strips are vegetated strips adjacent to drainage lines rather than constructedvegetated channels (swales). They are effective in the removal of coarse to medium sizedsediments and can be used as an effective pre-treatment measure for bioretention systems.Buffer strips should be used as a source control measure particularly for diffused runoff.
Recommended ReferencesIEAust 2003 Draft Australian Runoff Quality
Parameter Ranges
Treatment Properties
The treatment properties to be determined for buffers will derive from the conceptual designprocess and as such there is no opportunity to provide guidance on specific numerical values.
As the performance of buffer systems cannot be manipulated within MUSIC and noadditional data specific for Brisbane is available, no modification/ guidance for theperformance of buffers has been provided. It should be noted that the generic treatment nodecan be used to model alternative treatment performance of a buffer (refer to Section 2.5.8 forfurther details).
Practitioners’ Notes• Buffer strip treatment only applies to runoff from impervious surfaces.
• Natural waterways and wetlands (including those identified in City Plan) should notbe modelled as buffers.
• Buffers must be located directly downstream of a Source Node.

Guidelines for Pollutant Export Modelling in Brisbane Version 7 – DraftRevision 2
24
2.5.4 Constructed Wetlands
Constructed wetlands are artificial systems that mimic functions of natural wetlands toreduce stormwater pollutants associated with fine particulates such as TSS, metals, nutrientsand toxicants, as well as soluble contaminants.
The conceptual wetland modelled by MUSIC is a free water surface wetland that can operateas a permanently ponded or ephemeral system with two cells and low flow and high flowbypass channels. The cells sequentially consist of an inlet pond that functions like asedimentation basin and the main wetland or macrophyte cell. The low flow bypass channelis upstream of the wetland inlet zone, while the high flow bypass is in the inlet zone andoperates when the wetland macrophyte cell is full.
There are currently no design guidelines offered by BCC for the design of ConstructedWetlands; however, design of stormwater treatment trains including wetlands should followthe principles contained in Council’s Draft Design Guidelines for Stormwater QualityImprovement Devices (BCC 1999b).
Recommended ReferencesIEAust 2003 Draft Australian Runoff QualityWong et al. 1998 Managing Urban Stormwater using Constructed WetlandsNSW DLWC 1998 The Constructed Wetlands ManualBCC 1999b Draft Design Guidelines for Stormwater Quality Improvement
Devices
Parameter Ranges
Inlet, Storage and Outlet Properties
The majority of the properties (i.e. inlet, storage and outlet properties) to be determined forwetlands will be derived from the conceptual design process and as such there is limitedopportunity to provide guidance on specific numerical values. Advice on modelling wetlandsusing MUSIC should be obtained from the MUSIC users’ manual (CRC-CH 2002).
Re-use
MUSIC allows for stormwater re-use from any treatment node which has a permanent poolvolume (wetlands and ponds) to be modelled. If stormwater re-use is being used for aconsistent withdrawal (i.e. independent of evaporation) then ‘uniform daily demand’ is to beused. If re-use is evaporation-dependent then ‘demand scaled by daily PET’ is to be used(most likely for irrigation).
Advanced Properties
The default values for k, C* and C** for TSS, TP and TN provided in the MUSIC programshould be used unless sufficient supporting information is provided. Where alternative datasets are offered by the proponent, a scientifically rigorous case must be supplied to Council

Guidelines for Pollutant Export Modelling in Brisbane Version 7 – DraftRevision 2
25
to support the claim that the proposed data sets are superior than those contained in theseguidelines.
The number of CSTRs in series will vary depending on the layout of the wetland. Theconceptual design must result in a layout that ensures a minimum of four CSTRs (refer toCRC-CH 2002, Section 5, Figure 5.1).
Practitioners’ Notes• Natural waterways or wetlands (including riparian areas) should not be included as a
treatment measure.
• Any proposal for re-use must be accompanied by a brief Water Re-use Plan, whichdetails the end use of the water, required water quality for that use and proposedmonitoring (Chapter 5, IEAust 2003).
• Presently in MUSIC, no matter how you modify the wetland characteristics, you willbe unable to meet the BCC WQOs using a wetland treatment system. The problemhere lies not with the WQOs, but with the default values for the C* parameters whichare currently higher than BCCs WQOs for TP and TN. As this value represents thebackground concentration for the kinetic reaction model used in the universialstormwater treatment model (USTM), it is the lowest concentration we could expect tosee from such a treatment device. The default values set in MUSIC represent thecurrent best estimate for wetlands available to the CRC-CH. Research is currentlybeing undertaken to validate the C* for Brisbane conditions.
• The use of alternative treatment performance data sets will only be permitted whereapproval in writing has been obtained from Council’s Water Resources Branch.
• Any request to use alternative treatment performance values will require thesubmission of supporting evidence providing a detailed description of the monitoring /experiments from which the values were derived. This may include (but is not limitedto) the type of pollutants, type of wetland, operating conditions, inflow concentrations,sampling methods, analysis methods and laboratory accreditation.
Guidelines for Pollutant Export Modelling in Brisbane Version 7 – DraftRevision 2
26
2.5.5 Ponds
Ponds are stormwater treatment measures such as open water bodies (withoutsignificant shallow vegetated areas in the predominant flow paths) and ornamental ponds.Ponds normally include an inlet pond (to capture coarse sediment) and an overflow channel(to protect the pond from scouring). The treatment of stormwater is predominantly associatedwith the temporary detention of stormwater to facilitate settling of suspended solids. Othertreatment processes promoted in pond systems including phytoplankton assimilation ofsoluble nutrients and ultra-violet disinfection. These processes are currently not explicitlyincluded in the modelling algorithm.
Council’s Draft Design Guidelines for Stormwater Quality Improvement Devices (BCC1999b) provides some guidance on the design of sediment and detention basins. Furtherdesign advice for ponds is offered in Australian Runoff Quality (IEAust 2003).
Recommended ReferencesBCC 1999b Draft Design Guidelines for Stormwater Quality Improvement DevicesIEAust 2003 Draft Australian Runoff QualityVSC 1999 Urban Stormwater: Best Practice Environmental Management Guidelines
Parameter Ranges
Inlet, Storage and Outlet Properties
The inlet, storage, and outlet properties to be determined for ponds will be derived from theconceptual design process and as such there is limited opportunity to provide guidance onspecific numerical values (above what is already provided within other publications such asthe MUSIC Users Manual).
Re-use
MUSIC allows stormwater re-use from any treatment node which has a permanent poolvolume (wetlands and ponds) to be modelled. If stormwater re-use is being used for aconsistent withdrawal (i.e. independent of evaporation) then ‘uniform daily demand’ is to beused. If re-use is evaporation-dependent then ‘demand scaled by daily PET’ is to be used(most likely for irrigation).
Advanced Properties
The default values for k, C* and C** for TSS, TP and TN provided in the MUSIC programshould be used unless sufficient supporting information is provided. Where alternative datasets are offered by the proponent, a scientifically rigorous case must be supplied to Councilto support the claim that the proposed data sets are superior to those contained in theseguidelines.

Guidelines for Pollutant Export Modelling in Brisbane Version 7 – DraftRevision 2
27
The number of CSTRs in series will vary depending on layout of the pond. The conceptualdesign must result in a layout that ensures a minimum of two CSTRs (refer to CRC-CH2002, Section 5, Figure 5.1).
Practitioners’ Notes• Any proposal for re-use must be accompanied by a brief Water Re-use Plan, which
details the end use of the water, required water quality for that use and proposedmonitoring (Chapter 5, IEAust 2003).
• No matter how you modify the pond characteristics, you will not be able to meet theBCC WQOs using a pond system. The discrepancy lies not with the WQOs, but withthe default values for the C* parameters which are currently higher than BCC WQOsfor TP and TN. As this represents the background concentration for the kineticreaction model used in the USTM, it is the lowest concentration we could expect tosee from such a treatment device. The default values set in MUSIC represent thecurrent best estimate for ponds available to the CRC-CH. It is, however,recommended that practitioners examine the use of a stormwater treatment train toimprove the pollutant removal efficiency of the system.
Guidelines for Pollutant Export Modelling in Brisbane Version 7 – DraftRevision 2
28
2.5.6 Gross Pollutant Traps
A GPT is a treatment device designed to capture coarse sediment, trash andvegetation matter in stormwater. GPTs are often used as the first treatment element in astormwater treatment train. There are many different types of GPTs suitable for use in anurban catchment.
Council’s Draft Design Guidelines for Stormwater Quality Improvement Devices (BCC1999b) provide advice on the design of a number of GPTs. Further design advice forproprietary devices can be obtained from manufacturers.
Recommended References
Walker et al. 1999 Removal of Suspended Solids and Associated Pollutants by a CDSGross Pollutant Trap
BCC 1999b Draft Design Guidelines for Stormwater Quality ImprovementDevices
Allison et al. 1998 From Roads to Rivers - Gross Pollutant Removal from UrbanWaterways
IEAust 2003 Draft Australian Runoff Quality
Parameter Ranges
Inlet Properties
The inlet properties for GPTs will be derived from the conceptual design process and as suchthere is no opportunity to provide guidance on specific numerical values for low and highflow bypass.
Transfer Function
MUSIC requires the user to specify the performance of the GPT for each pollutant type.There are a variety of GPT devices available, including propriety products, all of which havevery different performance characteristics. As no additional data on the performance ofgross pollutant data specific for Brisbane is available, no modification/ guidance for theperformance of GPTs has been provided. Most manufacturers of gross pollutant traps havecompleted performance testing, the results of which are available on request. Thespecification of any treatment performance must be justified with details describing themonitoring and/or experimental conditions used to derive the values. Should performancedata for a specific device not be available reference can be made to the GPT performancestudy completed by the CRC-CH (Walker et al., 1999).
Practitioners’ Notes• All GPTs should be designed in accordance with the Design Guidelines for
Stormwater Quality Improvement Devices (BCC 1999b).

Guidelines for Pollutant Export Modelling in Brisbane Version 7 – DraftRevision 2
29
2.5.7 Sediment Basins
A sediment basin is a waterbody or pond which relies on the physicalsettling of suspended solids as the principal treatment mechanism. A sediment basin isessentially the same as a pond without an inlet pond (designed to remove coarse sediment).
Council’s Guidelines for Sediment Basin Design, Construction and Maintenance (BCC2000f) provide guidance on the design of sediment and detention basins. The Draft DesignGuidelines for Stormwater Quality Improvement Devices (BCC 1999b) also provide designadvice on sediment and detention basins.
Recommended ReferencesBCC 2000f Guidelines for Sediment Basin Design, Construction and MaintenanceBCC 1999b Draft Design Guidelines for Stormwater Quality Improvement DevicesIEAust 2003 Draft Australian Runoff Quality
Parameter Ranges
Inlet, Storage, Infiltration and Outlet Properties
The inlet, storage and outlet properties to be determined for sediment basins systems willderive from the conceptual design process and as such there is limited opportunity to provideguidance on specific numerical values (above what is already provided within otherpublications such as the MUSIC Users Manual).
Re-use
MUSIC allows stormwater re-use from any treatment node which has a permanent poolvolume (wetlands and ponds) to be modelled. If stormwater re-use is being used for aconsistent withdrawal (i.e. independent of evaporation) then ‘Uniform daily demand’ is to beused. If re-use is evaporation dependent then ‘demand scaled by daily PET’ is to be used(most likely for irrigation).
Advanced Properties
The default values for k, C* and C** for TSS, TP and TN provided in the MUSIC programshould be used unless sufficient supporting information is provided. Where alternative datasets are offered by the proponent, a scientifically rigorous case must be supplied to Councilto support the claim that the proposed data sets are superior than those contained in theseguidelines.
The number of CSTRs in series will vary depending on the layout of the sediment basin.(refer to Chapter 5 CRC-CH 2002).
Guidelines for Pollutant Export Modelling in Brisbane Version 7 – DraftRevision 2
30
Practitioners’ Notes• Any proposal for re-use must be accompanied by a brief Water Re-use Plan, which details
the end use of the water, required water quality for that use and proposed monitoring(Chapter 5, IEAust 2003).
• No matter how you modify the sediment basin characteristics, you will not be able tomeet the BCC WQOs using a sediment basin system. The discrepancy lies not with theWQOs, but with the default values for the C* parameters which are currently higher thanBCC WQOs for TSS, TP and TN. As this represents the background concentration forthe kinetic reaction model used in the USTM, it is the lowest concentration we couldexpect to see from such a treatment device. The default values set in MUSIC representthe current best estimate for sediment basins available to the CRC-CH. Practitionersshould examine the use of a stormwater treatment train to improve the efficiency of thesystem.

Guidelines for Pollutant Export Modelling in Brisbane Version 7 – DraftRevision 2
31
2.5.8 Generic Treatment Node
The Generic Treatment Node can model the performance of treatment measures that are notincluded in the default range. For example, the performance of a stormwater strategy whichuses only non-structural methods such as community education. The Generic TreatmentNode provides a flexible performance using a series of transfer functions.
Recommended ReferencesBCC 1999b Draft Design Guidelines for Stormwater Quality Improvement DevicesIEAust 2003 Draft Australian Runoff Quality
Parameter Ranges
Inlet Properties and Transfer Function
As this treatment node aims to provide for flexibility in MUSIC modelling, no guidance isprovided for the use of the generic node.
Practitioners’ Notes• The specification of any treatment performance must be justified with details
describing the monitoring and / or experimental conditions used to derive the values.

Guidelines for Pollutant Export Modelling in Brisbane Version 7 – DraftRevision 2
32
2.6 Other Modelling Scenarios
2.6.1 Instream Works
Any works within receiving waters (such as natural channel design) shall not be included asa ‘treatment device’ in any stormwater treatment train models.
2.6.2 Losses from the System
On some soil types it is reasonable to assume that there are losses to groundwater from aswale drain or infiltration trench. If losses are built into a model, a suitably qualifiedgeotechical engineer should determine and report the likely infiltration created by the swaleor infiltration tench to the surrounding groundwater. The Generic Treatment Node should beused to create a curve to represent the transfer function between inflow and infiltration. TheGeneric Treatment Node is to be placed after the treatment measure in the treatment train.
2.6.3 Rainwater Tanks
Rainwater tanks should be modelled using the pond treatment node. The re-use function inthis treatment node can then be used to simulate demand (i.e. toilet flushing). Any proposalfor stormwater re-use must be included in the Site Based Stormwater Management Plan,which details the end use of the water, proposed treatment, required water quality for that useand proposed monitoring (Chapter 5, IEAust 2003).

Guidelines for Pollutant Export Modelling in Brisbane Version 7 – DraftRevision 2
33
2.7 Requirements for Development Applications forMUSICThis section outlines the information that should be provided to BCC for MUSIC modelsaccompanying a development application.
1. All submissions to BCC relating to water quality modelling should be accompanied by aletter of certification or endorsement from a either a Registered Professional Engineer ofQueensland (RPEQ) or similar professional with recognised industry certification.
2. InterpretationAll interpretation of the results of MUSIC modelling should include a comparison withBCC WQOs. Cumulative frequency graphs, with the BCC WQOs displayed should beincluded to support the interpretation of the results. In cases where the WQOs have notbeen met, it must be demonstrated that C* values have been achieved and that bestpractice stormwater management is clearly demonstrated.
3. Conceptual DesignTo aid in the interpretation of the MUSIC modelling, a conceptual layout or setout planof the development should be provided. This plan should also provide details of anytreatment devices modelled (refer to Item 8).
4. Data FilesDigital and hard copy versions of the following should be provided:
− Clearly labelled catchment file (3 Megabyte digital file size limit)1
− MUSIC Summary Report, clearly cross-labelling all nodes and treatmentdevices to the catchment file.
5. Catchment PropertiesThe rainfall and evaporation data and duration, and time step modelled should be clearlydocumented.
6. Source NodesFor each Source Node modelled in the catchment, the following information should bedocumented:
− Source Node type (refer to Table 2.1)− Percentage effective impervious area− Percentage shallow soils− Percentage deep soils.
1 In some cases, digital versions of MUSIC simulation files may become very large. For efficient data handling and transfer toCouncil the catchment file should be saved before running. To generate an un-run version of your catchment file select allnodes and links (by dragging a cursor box over all the elements to highlight them) then copy (CRTL-C) the selection and paste(CRTL-V) into a new catchment file with the same rainfall template. Save the new un-run catchment file and submit with yourapplication.

Guidelines for Pollutant Export Modelling in Brisbane Version 7 – DraftRevision 2
34
7. Drainage LinkThe routing option and associated properties (if applicable) of all drainage links shouldbe specified.
8. Treatment DevicesA description of the type of treatment devices must be provided to support the MUSICsummary report. The design intent for any treatment system must be clearly documented.The following information is required, in addition to the summary output file (refer toitem 4), for each treatment device.
Gross Pollutant Trap− Type of device modelled− Treatment performance data− Source of data on treatment performance
Vegetated Swales− Details of vegetation type modelled− Detailed description of conceptual design
Bioretention Systems− Detailed description of conceptual design
Buffer− Assumed buffer vegetation type
Constructed Wetlands− Conceptual design drawing of the wetland- Site Based Stormwater Management Plan
Ponds and Sediment Basins− Conceptual design drawing of the pond/ sediment basin− Site Based Stormwater Management Plan
Generic Treatment Node− Type of treatment measure− Published reference for the performance of the treatment measure.
Practitioners’ Notes• Modifications to any of the parameters recommended within these guidelines must be
justified by a detailed description of the monitoring and/or experimental conditionsand results used to derive the values (refer to Sections 2.2, 2.2 and 2.5).
• Modifications will only be permitted where approval in writing has been obtainedfrom Council’s Water Resources Branch.
Guidelines for Pollutant Export Modelling in Brisbane Version 7 – DraftRevision 2
35
3.0 AQUALMThis section presents current results of rainfall-runoff relationship and pollutant export ratesfor a variety of land use categories monitored in Brisbane. AQUALM models have beencalibrated for each land use and pollutant export rates developed for use in AQUALM.
Water quality pollutant export models are normally developed to determine the effect ofdevelopment on water quality. This document will provide examples of yearly pollutantloads for various land uses.
Please note that data is available on pollutant export from a wide range of other sources (e.g.Victoria) and for parameters additional to the ones given in these guidelines. However, thevalidity of the applying relationships from other areas in the Brisbane climatic region isquestionable and should be used as a general indication only.
3.1 AQUALM model parameters
3.1.1 Rainfall-runoff Model
The first step in calibrating an AQUALM model is to establish a satisfactory rainfall-runoffmodel. Export rates for pollutants are generally a function of the runoff. It is therefore veryimportant to accurately determine the volume of runoff. Daily rainfall is input to theAQUALM model, and a number of calibration parameters are available to obtain an accuraterainfall-runoff relationship.
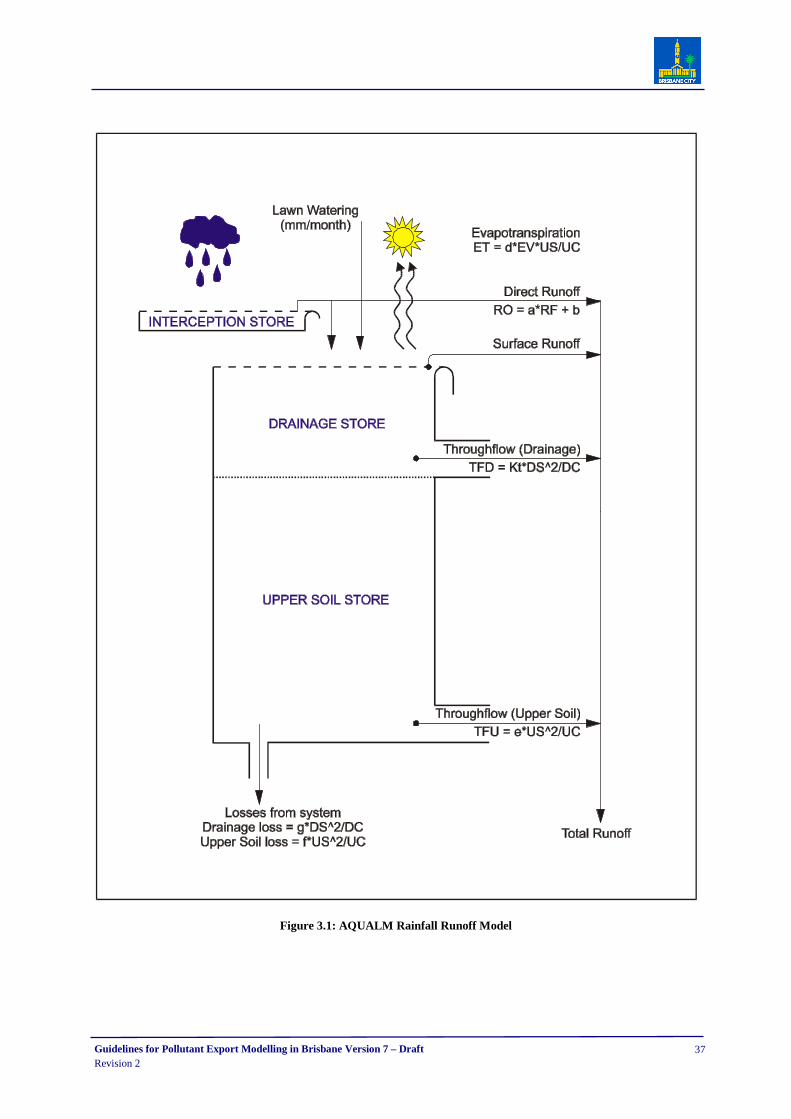
The rainfall-runoff model in AQUALM is based on a modified Boughton model. The modelconsists of three storages - an interception store, drainage store and upper soil store.Calibration of the model involves determining the depth of each of these stores, and thedegree of runoff from each store, along with the amount of lawn watering. The structure ofthe rainfall-runoff model used by AQUALM is shown on Figure 3.1: AQUALM RainfallRunoff Model. For further details regarding the rainfall-runoff model, refer to theAQUALM User Manual.
When data collected for urban, rural and forest catchments in Brisbane were analysed, it wasfound that a baseflow was consistently present despite a lack of rainfall. This suggestedsome additional source of water in the catchment other than rainfall. Where this occurred forsignificant periods after rainfall, and throughflow could not account for this flow, the lawn-watering component of the model was utilised to account for this.
Parameters to be used in the rainfall-runoff models for each land use are listed in Table 3.1:.

Guidelines for Pollutant Export Modelling in Brisbane Version 7 – DraftRevision 2
36
Table 3.1: Rainfall-runoff Parameters
Land UseDescription Parameter
Urban Commercial Industrial Rural Forest
Depth of IS IS max 10 0.5 0.5 15 15Depth of DS DS max 60 10 10 50 50Depth of US US max 50 20 7 80 110
Direct Runoff a 0.25 0.60 0.60 0.15 0.01Direct Runoff b 0.00 0.00 0.00 0.00 0.00
Evapo-trans d 0.75 0.75 0.75 0.75 0.75
DS TF Kt 0.25 0.24 0.24 0.50 0.15
US TF e 0.02 0.25 0.25 0.04 0.03
DS Loss g 0.05 0.15 0.15 0.00 0.00
US Loss f 0.10 0.15 0.15 0.20 0.30
Lawn watering(per day)
0.1 mm 0.1 mm 0.1 mm 0.5 mm 1.0 mm
Note: Do not apply lawn watering when catchment is saturated.
When developing an AQUALM model, daily rainfall data should be sourced from thenearest long-term gauge to the catchment (e.g. through the Bureau of Meteorology). It ispreferable to analyse a period of at least ten years of data, with the results for the first yearremoved from the analysis set. The first year is removed to ensure that storage levels aresatisfactory, as initial conditions usually specify empty stores.
Guidelines for Pollutant Export Modelling in Brisbane Version 7 – DraftRevision 2
37
Figure 3.1: AQUALM Rainfall Runoff Model

Guidelines for Pollutant Export Modelling in Brisbane Version 7 – DraftRevision 2
38
3.1.2 Pollutant Export
Through Council’s Stormwater Quality Monitoring Program, a rainfall-runoff model wasestablished for each land use listed in Table 3.1, and a pollutant export relationship wasdeveloped, relating pollutant load to runoff. Pollutants currently being monitored at all sitesare:
• suspended solids
• total nitrogen
• total phosphorus.
In addition other parameters including speciated nutrients, heavy metals, particle size andpesticides are being monitored on a selected basis and this data will be presented insubsequent versions of this document.
The AQUALM model provides two methods for generation of non-point source pollutantloads. The most commonly used method employs user-defined equations, where theequation can be defined in any format, although it is usually of the form:
Load = a*ROb (Eqn 1)
Where a - calibrated coefficientb - calibrated exponentRO - runoff
The model also allows the user to assign different calibrated coefficients and exponents tothe Surface Runoff (ie. direct runoff + surface runoff) and Throughflow components of thetotal daily runoff (refer Figure 3.1: AQUALM Rainfall Runoff Model). In this instanceEquation 1 takes the form:
Load = a1*SRb1+ a2*TFb2 (Eqn 2)
Where a1 - calibrated coefficient for Surface Runoffb1 - calibrated exponent for Surface Runoffa2 - calibrated coefficient for Throughflowb2 - calibrated exponent for ThroughflowSR - Surface RunoffTF - Throughflow
A different relationship should be defined for each land use, for each pollutant. Given thatmonitoring data collected in Brisbane to date shows that throughflow (or low flow) pollutantconcentrations are significantly different to storm event concentrations, Equation 2represents the preferred pollutant export generation method.
Guidelines for Pollutant Export Modelling in Brisbane Version 7 – DraftRevision 2
39
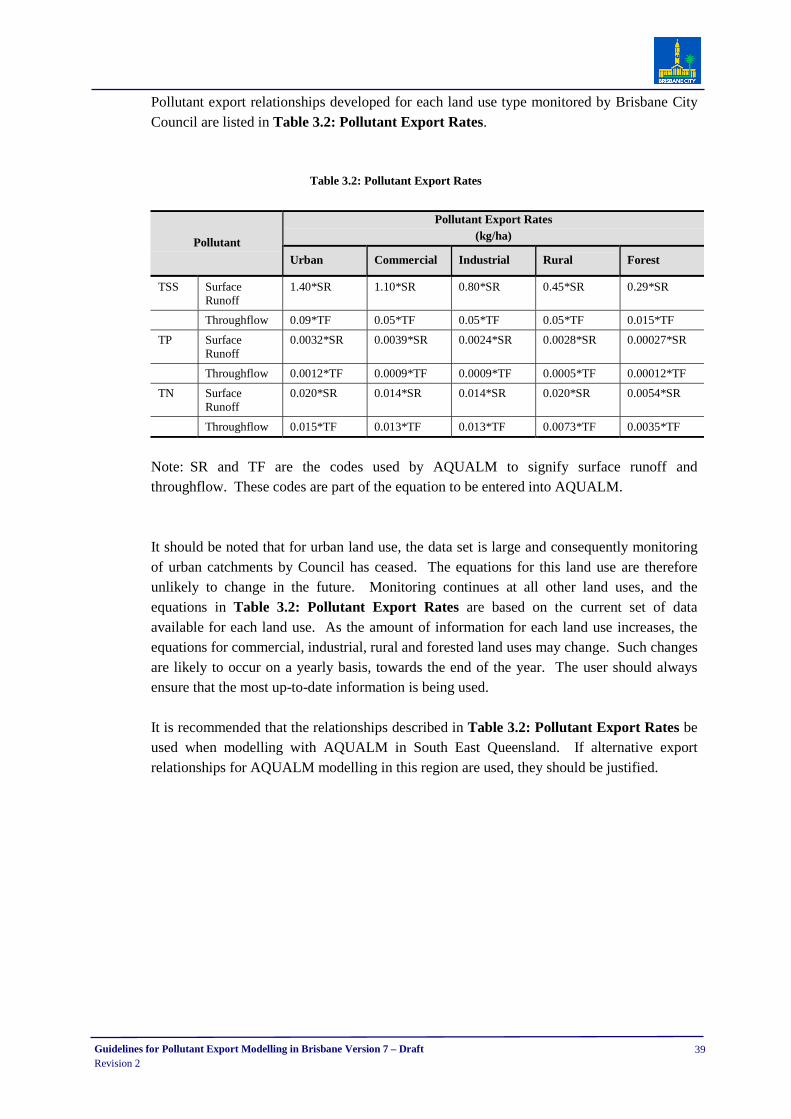
Pollutant export relationships developed for each land use type monitored by Brisbane CityCouncil are listed in Table 3.2: Pollutant Export Rates.
Table 3.2: Pollutant Export Rates
Pollutant Export Rates(kg/ha)Pollutant
Urban Commercial Industrial Rural Forest
TSS SurfaceRunoff
1.40*SR 1.10*SR 0.80*SR 0.45*SR 0.29*SR
Throughflow 0.09*TF 0.05*TF 0.05*TF 0.05*TF 0.015*TF
TP SurfaceRunoff
0.0032*SR 0.0039*SR 0.0024*SR 0.0028*SR 0.00027*SR
Throughflow 0.0012*TF 0.0009*TF 0.0009*TF 0.0005*TF 0.00012*TF
TN SurfaceRunoff
0.020*SR 0.014*SR 0.014*SR 0.020*SR 0.0054*SR
Throughflow 0.015*TF 0.013*TF 0.013*TF 0.0073*TF 0.0035*TF
Note: SR and TF are the codes used by AQUALM to signify surface runoff andthroughflow. These codes are part of the equation to be entered into AQUALM.
It should be noted that for urban land use, the data set is large and consequently monitoringof urban catchments by Council has ceased. The equations for this land use are thereforeunlikely to change in the future. Monitoring continues at all other land uses, and theequations in Table 3.2: Pollutant Export Rates are based on the current set of dataavailable for each land use. As the amount of information for each land use increases, theequations for commercial, industrial, rural and forested land uses may change. Such changesare likely to occur on a yearly basis, towards the end of the year. The user should alwaysensure that the most up-to-date information is being used.
It is recommended that the relationships described in Table 3.2: Pollutant Export Rates beused when modelling with AQUALM in South East Queensland. If alternative exportrelationships for AQUALM modelling in this region are used, they should be justified.
Guidelines for Pollutant Export Modelling in Brisbane Version 7 – DraftRevision 2
40
3.1.3 Annual Pollutant Loads
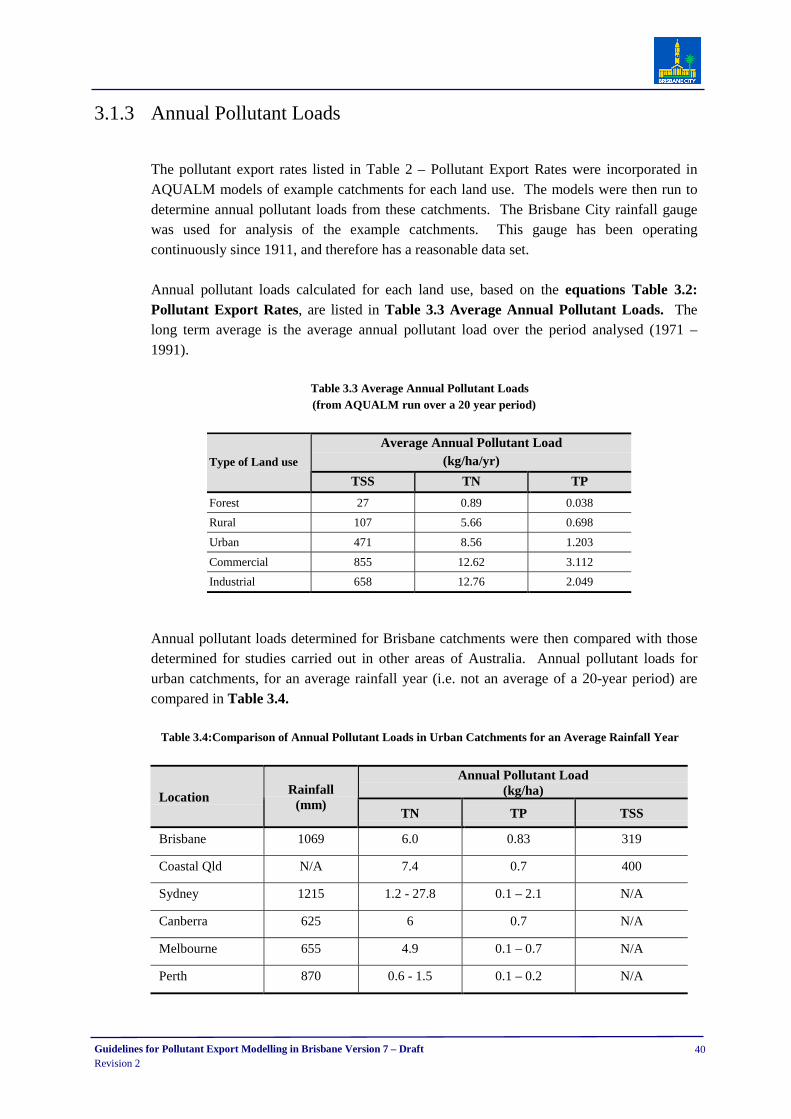
The pollutant export rates listed in Table 2 – Pollutant Export Rates were incorporated inAQUALM models of example catchments for each land use. The models were then run todetermine annual pollutant loads from these catchments. The Brisbane City rainfall gaugewas used for analysis of the example catchments. This gauge has been operatingcontinuously since 1911, and therefore has a reasonable data set.
Annual pollutant loads calculated for each land use, based on the equations Table 3.2:Pollutant Export Rates, are listed in Table 3.3 Average Annual Pollutant Loads. Thelong term average is the average annual pollutant load over the period analysed (1971 –1991).
Table 3.3 Average Annual Pollutant Loads(from AQUALM run over a 20 year period)
Average Annual Pollutant Load(kg/ha/yr)Type of Land use
TSS TN TP
Forest 27 0.89 0.038
Rural 107 5.66 0.698
Urban 471 8.56 1.203
Commercial 855 12.62 3.112
Industrial 658 12.76 2.049
Annual pollutant loads determined for Brisbane catchments were then compared with thosedetermined for studies carried out in other areas of Australia. Annual pollutant loads forurban catchments, for an average rainfall year (i.e. not an average of a 20-year period) arecompared in Table 3.4.
Table 3.4:Comparison of Annual Pollutant Loads in Urban Catchments for an Average Rainfall Year
Annual Pollutant Load(kg/ha)Location
Rainfall(mm)
TN TP TSS
Brisbane 1069 6.0 0.83 319
Coastal Qld N/A 7.4 0.7 400
Sydney 1215 1.2 - 27.8 0.1 – 2.1 N/A
Canberra 625 6 0.7 N/A
Melbourne 655 4.9 0.1 – 0.7 N/A
Perth 870 0.6 - 1.5 0.1 – 0.2 N/A
Guidelines for Pollutant Export Modelling in Brisbane Version 7 – DraftRevision 2
41
As shown by the results in the above table, pollutant loads calculated for Brisbanecatchments are comparable with those from elsewhere in Australia. Further data on otherparameters can be obtained by consulting the references given in Section 7.0, however thevalidity of applying relationships from other areas in the Brisbane climatic region isquestionable and should be used as a general indication only.
3.2 Other Pollutant Loads
3.2.1 Point Loads
Point source loads are loads that originate from a single outlet, such as outflows from sewagetreatment plants or large industry sites. These loads are simulated in AQUALM by adding adaily load to the model at the location of the outlet.
3.2.2 Septic Loads
It is common in Stormwater Management Plans on urban fringes, to have to deal withpollution from septic flows. Since AQUALM is being used to analyse the system, a methodfor incorporating septic flows in the AQUALM model is required.
Studies have previously been carried out to determine export rates for rural residential areascontaining septic systems. However, these studies do not normally list the density of septicsystems (ie. no of systems per hectare). The export rates also include the pollutant load fromother sources, such as fertiliser, animal faeces etc. This does not allow the determination ofthe number of septic systems allowable before water quality parameters are adverselyaffected, or allow for adaption of the export rates to an area with a different density of septicsystems. A method for determining the load from individual septic systems is thereforerequired.
There is very little data available on methods for determining pollutant loads due to septicsystems. A method has been developed by Jelliffe (1997), involving a daily timestep modelto determine the average yearly load of each pollutant from individual septic systems. If thesystem has been constructed recently, then it will conform to the relevant AustralianStandard (AS1547), and calculation of the yearly load is relatively simple. This daily loadthen needs to be multiplied by the number of septic systems in the sub-catchment andincluded in the AQUALM model as a point load. AQUALM then adds this load to the non-point source load of that sub-catchment.
If the septic systems are operating properly, there will be little affect on water quality in thecatchment. It is when the septic systems fail that water quality problems occur. Therefore,several scenarios need to be assessed, representing different estimates of failure rates. Forexample, a typical study might assess the affect on water quality of 10%, 20% and 30%failure rates. The failure rates should represent the type of failure rates that occur in thatarea.

Guidelines for Pollutant Export Modelling in Brisbane Version 7 – DraftRevision 2
42
Investigations are currently being undertaken to determine the properties of septic systems inthe Brisbane area, including assessment of failure rates. Loads for septic systems will bedeveloped from this information.
3.3 Analysis of Treatment OptionsPollutant removal rates for various stormwater quality treatment options (i.e. BestManagement Practices, SQIDs etc.) are currently being investigated by Brisbane CityCouncil in partnership with the Co-operative Research Centre for Catchment Hydrology.While the data available is still preliminary, Council's Water Quality ManagementGuidelines (part of the Subdivision and Development Guidelines, 2000) offer suggestedtreatment efficiencies based on the best information available at this time. The efficienciesgiven are ranges and the mid point of those ranges should be used when evaluating the likelyperformance of treatment options.
As further information becomes available, it will be included in subsequent revisions of theWater Quality Management Guidelines.
Guidelines for Pollutant Export Modelling in Brisbane Version 7 – DraftRevision 2
43
4.0 Glossaryambient flow see baseflow
baseflow dry weather flow or base runoff from the catchment due to groundwaterexfiltration or catchment activities
effective impervious area terminology used for modelling in MUSIC. Is equivalent to the directlyconnected impervious area. Expressed as a percentage of the totalcatchment area. It is a measure of the area of land that is directlyconnected to the stormwater drainage system
total impervious area the area of sealed surfaces in a catchment. Includes roofs, paths, roadsetc. Often expressed as a percentage of the total catchment area anddetermined from GIS, Aerial Image analysis or proposed developmentplans.
hydrologic routing the influence the storage characteristics of a reach have on therelationship between the inflow and outflow hydrographs. Typically,hydrologic routing is observed as an attenuation of the inflowhydrograph over a distance, resulting in reduced peaks for the outflowhydrograph.
serial correlation correlation between pollutant concentration at time ‘t’ and the previoustime step, ‘t-1’
stochastic randomly generated from within a statistically determined population
storm water quality bestmanagement practices
a range of stormwater management measures that aim to reduce theamount of stormwater runoff and export of pollutants
surface flow wetlands wetlands where water flows are predominantly across the surface of thepond rather than through media
treatment train the application of a series of physical stormwater best managementpractices to achieve improved drainage water quality
time step (MUSIC) the frequency at which the model makes its calculations – both rainfall-runoff calculations and treatment calculations. Smaller time stepsproduce more accurate calculations but require longer computationaltimes and generate larger files

Guidelines for Pollutant Export Modelling in Brisbane Version 7 – DraftRevision 2
44
5.0 AbbreviationsARQ Australian Runoff Quality
BCC Brisbane City Council
CRC-CH Cooperative Research Centre – Catchment Hydrology
CSTR Continuously Stirred Tank Reactor
DLWC Department of Land and Water Conservation (NSW)
DPI Department of Primary Industries
GIS Geographical Information System
GPTs Gross Pollutant Traps
IEAust Institute of Engineers Australia
MUSIC Model for Urban Stormwater Conceptualisation
PET Potential Evapotranspiration
PGDER Prince George’s County Department of Environmental Resources
RPEQ Registered Professional Engineer Queensland
SQID Stormwater Quality Improvement Device
TN Total Nitrogen
TP Total Phosphorus
TSS Total Suspended Solids
USTM Universal Stormwater Treatment Model
WQOs Water Quality Objectives
Guidelines for Pollutant Export Modelling in Brisbane Version 7 – DraftRevision 2
45
6.0 BibliographyAllison, RA et al. 1998, From Roads to Rivers - Gross Pollutant Removal from Urban
Waterways, CRC for Catchment Hydrology.
BCC 1999a, Stormwater Quality Monitoring Program Report for 1998/1999.
BCC 1999b, Draft Design Guidelines for Stormwater Quality Improvement Devices, BCC,Brisbane.
BCC, 2000a, Water Quality Management Guidelines, Part C of BCC’s Subdivision andDevelopment Guidelines, BCC, Brisbane,
BCC 2000b, Guidelines on Identifying and Applying Water Quality Objectives in BrisbaneCity, BCC, Brisbane.
BCC 2000c, Brisbane City Plan 2000, BCC, Brisbane.
BCC 2000d, Stormwater Quality Monitoring Program Report for 1999/2000.
BCC 2000e, SQIDS Monitoring Program Report 1999/2000.
BCC 2000f, Guidelines for Sediment Basin Design, Construction and Maintenance, BCC,Brisbane.
BCC 2001a, Stormwater Quality Monitoring Program Report for 2000/2001.
BCC 2001b, SQIDs Monitoring Program Report 2000/2001.
BCC 2002a, Stormwater Quality Monitoring Program Report for 2001/2002.
BCC 2002b, SQIDs Monitoring Program Report 2001/2002.
BCC 2003a, Stormwater Quality Monitoring Program Report for 2002/2003.
BCC 2003b, SQIDs Monitoring Program Report 2002/2003.
BCC 2003c, Draft WSRD Guidelines, BCC, Brisbane.
Chiew, Siriwardena 2003, Rainfall-Runoff Modelling in MUSIC and Suggested ParameterValues, Draft notes, Francis Chiew and Lionel Siriwardena (29 May 2003)
CRC-CH 1997, Best Practice Environmental Management Guidelines for UrbanStormwater, Cooperative Research Centre for Catchment Hydrology.

Guidelines for Pollutant Export Modelling in Brisbane Version 7 – DraftRevision 2
46
CRC-CH, 2002, Model for Urban Stormwater Improvement Conceptualisation User ManualVersion 1.00.
Cooperative Research Centre for Freshwater Ecology 1998, Design Guidelines: StormwaterPollution Control Ponds and Wetlands.
Drapper D, Tomilson R, Williams P 1999, An Investigation of the Quality of StormwaterRunoff from Road Pavements; A South-East Queensland Case Study, Presentation tothe 8th International Conference of Urban Storm Drainage, Sydney, September 1999.
Duncan HP 1995, A Bibliography of Urban Stormwater Quality, CRC-CH.
Duncan HP 1999, Urban Stormwater Quality: A Statistical Overview, CRC- CH.
IEAust 2003, Draft Australian Runoff Quality, Institute of Engineers Australia.
Jeliffe, PA 1997, Predicting Stormwater Quality from Unsewered Development, Clear Water- A Technical Response, Stormwater Industry Association Conference, Coffs Harbour,26 - 29 April 1997.
Mitchell G, Mein R., McMahon T 1999, The Reuse Potential of Urban Stormwater andWastewater, Cooperative Research Centre for Catchment Hydrology.
NSW DLWC 1998, The Constructed Wetlands Manual. Volumes 1 and 2.
Prince George’s County Department of Environmental Resources (PGDER) 1993, DesignManual for Use of Bioretention in Storm Water Management. Division ofEnvironmental Management, Watershed Protection Branch. Landover, MD.
DPI, BCC and Institute of Municipal Engineering Australia 1992, Queensland UrbanDrainage Manual, DPI, BCC and Institute of Municipal Engineering Australia.Queensland.
Victoria Stormwater Committee 1999 (VSC 1999), Urban Stormwater: Best PracticeEnvironmental Management Guidelines, CSIRO, Melbourne.
Walker TA, Allison RA, Wong THF, Wootton RM 1999, Removal of Suspended Solids andAssociated Pollutants by a CDS Gross Pollutant Trap, CRC-CH.
Wong THF, Breen PG. Somes LG and Lloyd SD 1998, Managing Urban Stormwater usingConstructed Wetlands. (Industry report 98/7). Melbourne CRC for CatchmentHydrology
WP SOFTWARE, 1992, AQUALM Users Manual.

Guidelines for Pollutant Export Modelling in Brisbane Version 7 – DraftRevision 2
47
7.0 Index
A
Agricultural ...................................................... 8, 9ambient flow ....................................................... 43AQUALM...........1, 3, 35, 36, 37, 38, 39, 40, 41, 46AQUALM-XP.................................................... 1, 3Area.................................................................. 9, 10Australian Runoff Quality .......................... 1, 44, 46autocorrelation ..................................................... 14
B
baseflow................................................... 13, 35, 43Bioretention systems ............................................ 21Buffer strips ......................................................... 23
C
catchment file................................................... 6, 33Catchment Properties ........................................... 33City Plan Area Classifications ............................... 9Commercial ...................8, 9, 10, 11, 13, 36, 39, 40conceptual design19, 21, 22, 23, 24, 25, 26, 27, 28,
29, 34Constructed wetlands ........................................... 24CRC-CH................................1, 4, 24, 25, 27, 29, 44CSTRs ................................................ 22, 25, 27, 29
D
Deep Soil........................................................ 10, 11development application .................................. 1, 33Drainage Links..................................................... 15
E
effective impervious area ....................... 10, 33, 43
F
Forest................................................. 13, 36, 39, 40Forested........................................... 8, 9, 10, 11, 13
G
generic treatment node ....................... 17, 23, 31, 32GPTs .............................................. 3, 17, 18, 28, 44gross pollutant trap............................................... 28
H
Hydrologic routing............................................. 43
I
Industrial .......................8, 9, 10, 11, 13, 36, 39, 40Inlet and Storage Properties ............................... 19
K
k and C* ......................................................... 20, 22
M
macrophyte........................................................... 24Meteorological Data............................................... 6
MUSIC1, 3, 4, 5, 6, 8, 9, 10, 11, 13, 14, 15, 17, 21,22, 23, 24, 26, 28, 29, 31, 33, 34, 43, 44, 45
Muskingum-Cunge ............................................ 16
N
natural channel design.......................................... 32non-structural ................................................. 17, 31
P
Pervious and Effective Impervious Proportions 10Point Loads .......................................................... 41pollutant export rates...................................... 35, 40pollutant export relationship ................................ 38Ponds...................................................17, 26, 34, 46
Q
Queensland Urban Drainage Manual ............... 6, 46
R
Rainfall Data Set.................................................... 6rainfall records ....................................................... 6rainfall-runoff model.............................6, 10, 35, 38Rainwater tanks.................................................... 32receiving waters ............................................... 1, 32Reuse ........................................................26, 29, 46Routing Properties .............................................. 15Rural ..............................8, 9, 10, 11, 13, 36, 39, 40Rural Residential ............................8, 9, 10, 11, 13
S
Saturated Hydraulic Conductivity........................ 22sediment basin...................................................... 29Septic Loads......................................................... 41Serial Autocorrelation......................................... 14serial correlation .......................................... 14, 43several Stormwater Quality Improvement Devices 3Shallow Soil store ................................................ 10Soil Properties...................................................... 11Source Nodes ..........................................8, 9, 13, 33SQIDs ........................................................ 3, 17, 42Static Mean .......................................................... 14Stocastically ......................................................... 14stochastic....................................................... 14, 43stochastic generation............................................ 14storm water quality best management practices
........................................................................ 43Stormwater Quality Monitoring Program... 8, 13stormwater treatment train ................................... 32surface flow wetlands......................................... 43surface runoff................................................. 38, 39
T
time of concentration ............................................. 6Time Step ......................................................... 6, 33total impervious area ............................... 8, 10, 43Transfer Function......................................... 28, 31

Guidelines for Pollutant Export Modelling in Brisbane Version 7 – DraftRevision 2
48
treatment train ................................ 4, 17, 28, 32, 43
U
Urban Residential................................................. 13
V
Vegetated swales.................................................. 19
W
Water Quality Management Guidelines........... 1, 42Water Resources Branch........................................ 4wetland......................................................24, 25, 34WQOs ........................................................ 1, 17, 33