Embed Size (px)
Citation preview
KINROSS GOLD CORPORATIONScotiabank Sales Desk Presentation
March 30, 2015
www.kinross.com1
KINROSS GOLD CORPORATIONScotiabank Sales Desk Presentation
March 30
2015
www.kinross.com2
CAUTIONARY STATEMENT ON FORWARD-LOOKING INFORMATION
All statements, other than statements of historical fact, contained or incorporated by reference in or made in giving this presentation and responses to questions, including but not limited to any information as to the future performance of Kinross, constitute “forward looking statements” within the meaning of applicable securities laws, including the provisions of the Securities Act (Ontario) and the provisions for “safe harbour” under the United States Private Securities Litigation Reform Act of 1995 and are based on expectations, estimates and projections as of the date of this presentation. Forward-looking statements contained in this presentation include those statements on slides with, and statements made under, the headings and/or titles “Kinross Value Proposition”, “2015 Outlook”, “Strong Balance Sheet”, “Attractive Growth Opportunities”, “Growth Opportunities”, “Exploration Highlights”, High-Quality Exploration Targets”, “Compelling Valuation” “The Way Forward – Principles for Building Value”, and “2014 Gold Reserve and Resource Estimates” and “Explanatory Notes: Exploration”, and include without limitation, statements with respect to: our guidance for production, production costs of sales, all-in sustaining cost and capital expenditures; expected savings pursuant to our cost review and reduction initiatives, including the continuation of the Way Forward; modifications to projects and operations and our exploration results and budget, including the Tasiast expansion project and our expectations regarding timelines for continued development; mineral reserve and mineral resource estimates; as well as references to other possible events which include, without limitation, possible events; opportunities; statements with respect to possible events or opportunities; estimates and the realization of such estimates; future exploration and development, mining activities, production and growth, including but not limited to cost and timing; success of exploration or development of operations; the future price of gold and silver; currency fluctuations; expected capital expenditures and requirements for additional capital; government regulation of mining operations and exploration; environmental risks; unanticipated reclamation expenses; and title disputes. The words “2015E”, “aim”, “anticipate”, “assumption”, “believe”, “budget”, “compelling”, “consider”, “directional”, “efforts”, “encouraging”, “estimate”, “expects”, “explore”, “forecast”, “focus”, “guidance”, “initiative”, indicate”, “intend”, “objective”, “opportunity”, “option”, “outlook”, “plan”, “potential”, “principle”, “priority”, “project”, “proposition”, “prospect”, “promising”, “pursue”, “strategy”, “study”, “target”, “think”, or “way forward”, or variations of such words and phrases or statements that certain actions, events or results may, can, could, would, should, might, indicates, achieved or will be taken, and similar expressions identify forward looking statements. Forward-looking statements are necessarily based upon a number of estimates and assumptions that, while considered reasonable by Kinross as of the date of such statements, are inherently subject to significant business, economic and competitive uncertainties and contingencies. Statements representing management’s financial and other outlook have been prepared solely for purposes of expressing their current views regarding the Company’s financial and other outlook and may not be appropriate for any other purpose. Many of these uncertainties and contingencies can affect, and could cause, Kinross’ actual results to differ materially from those expressed or implied in any forward looking statements made by, or on behalf of, Kinross. There can be no assurance that forward looking statements will prove to be accurate, as actual results and future events could differ materially from those anticipated in such statements. All of the forward looking statements made in this presentation are qualified by these cautionary statements, and those made in our filings with the securities regulators of Canada and the U.S., including but not limited to those cautionary statements made in the “Risk Factors” section of our most recently filed Annual Information Form, the “Risk Analysis” section of our FYE 2014 Management’s Discussion and Analysis, and the “Cautionary Statement on Forward-Looking Information” in our news release dated February 10, 2015, to which readers are referred and which are incorporated by reference in this presentation, all of which qualify any and all forward‐looking statements made in this presentation. These factors are not intended to represent a complete list of the factors that could affect Kinross. Kinross disclaims any intention or obligation to update or revise any forward‐looking statements or to explain any material difference between subsequent actual events and such forward‐looking statements, except to the extent required by applicable law.
Other information
Where we say "we", "us", "our", the "Company", or "Kinross" in this presentation, we mean Kinross Gold Corporation and/or one or more or all of its subsidiaries, as may be applicable. The technical information about the Company’s mineral properties (other than exploration activities) contained in this presentation has been prepared under the supervision of Mr. John Sims, an officer of the Company who is a “qualified person” within the meaning of National Instrument 43-101 (“NI 43-101”). The technical information about the Company’s exploration activities contained in this presentation, including, but not limited to drill programs and results, has been prepared under the supervision of Sylvain Guerard, and officer of the Company who is a “qualified person” within the meaning of NI 43-101.
KINROSS GOLD CORPORATIONScotiabank Sales Desk Presentation
March 30, 2015
www.kinross.com3
• Focus on operational excellence
• Quality over quantity
• Disciplined capital allocation
• Maintaining a strong balance sheet
3
THE WAY FORWARD
PRINCIPLES FOR BUILDING VALUE
www.kinross.com4
KINROSS VALUE PROPOSITION
EXCELLENT OPERATIONAL TRACK RECORD
• 10 consecutive quarters of strong results
STRONG BALANCE SHEET
• $2.5B in liquidity and conservative net debt of $1.0B
• No significant debt maturities until 2016
ATTRACTIVE FUTURE GROWTH OPPORTUNITIES
• Not proceeding with Tasiast mill expansion at present time; project continues to be an attractive growth option
• La Coipa Phase 7 pre-feasibility study expected to be complete in Q3 2015
COMPELLING VALUATION
• Attractive value opportunity relative to peers, considering annual production, cost structure, track record and relatively low-risk growth opportunities
SHARE INFORMATION
K – Toronto Stock Exchange
KGC – New York Stock Exchange
KINROSS GOLD CORPORATIONScotiabank Sales Desk Presentation
March 30, 2015
www.kinross.com5
DELIVERING OPERATIONAL EXCELLENCE
www.kinross.com6
OPERATIONAL EXCELLENCE
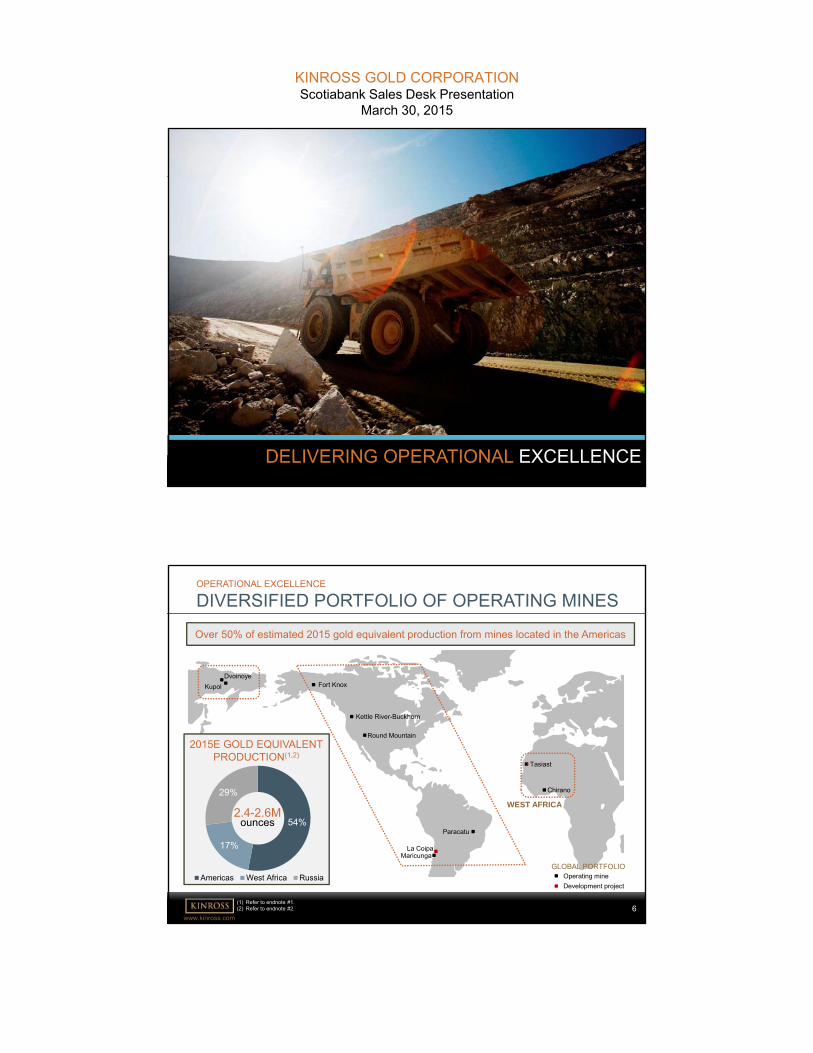
DIVERSIFIED PORTFOLIO OF OPERATING MINES
GLOBAL PORTFOLIOOperating mine
Development project
Round Mountain
Kettle River-Buckhorn
Fort Knox
La Coipa
Paracatu
Maricunga
Kupol
Dvoinoye
Chirano
Tasiast
AMERICASRUSSIA
WEST AFRICA
(3) Refer to endnote #3.
Over 50% of estimated 2015 gold equivalent production from mines located in the Americas
54%
17%
29%
Americas West Africa Russia
2.4-2.6M ounces
2015E GOLD EQUIVALENT PRODUCTION(1,2)
(1) Refer to endnote #1.(2) Refer to endnote #2.
KINROSS GOLD CORPORATIONScotiabank Sales Desk Presentation
March 30, 2015
www.kinross.com7
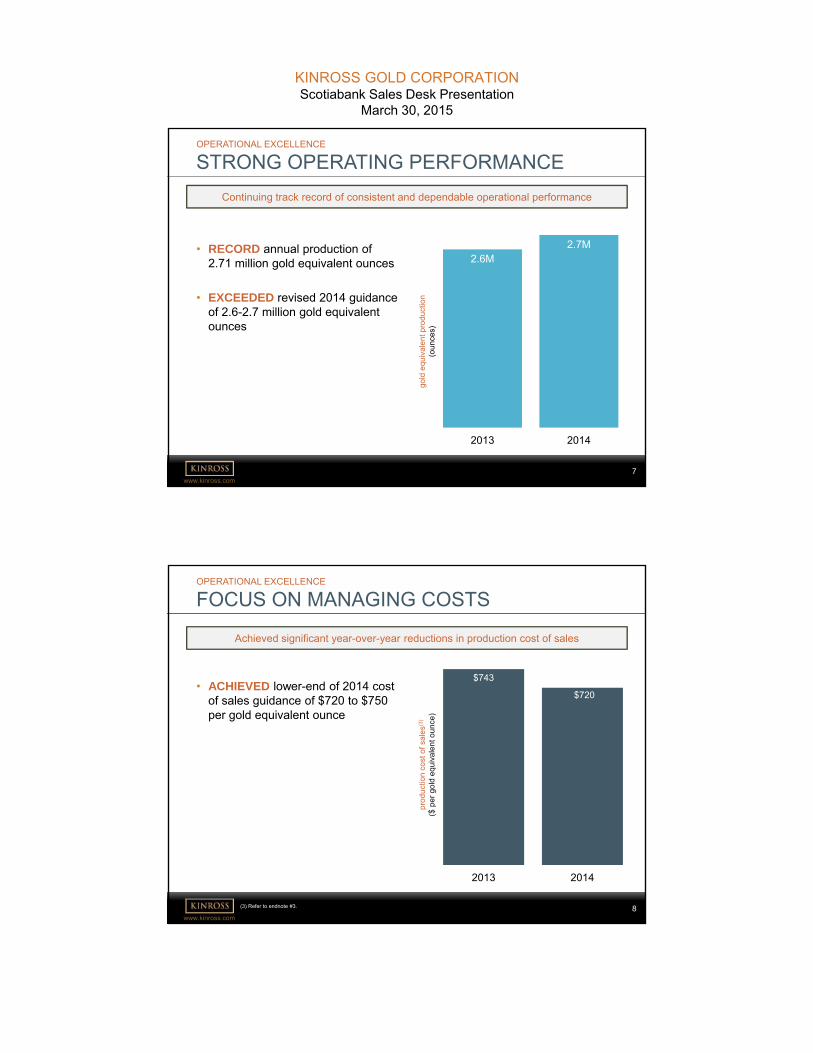
2.6M2.7M
2013 2014
OPERATIONAL EXCELLENCE
STRONG OPERATING PERFORMANCE
• RECORD annual production of 2.71 million gold equivalent ounces
• EXCEEDED revised 2014 guidance of 2.6-2.7 million gold equivalent ounces
Continuing track record of consistent and dependable operational performance
gold
equ
iva
len
t pro
du
ctio
n (o
unce
s)
www.kinross.com8
$743
$720
2013 2014
OPERATIONAL EXCELLENCE
FOCUS ON MANAGING COSTS
(3) Refer to endnote #3.
pro
du
ctio
n c
ost
of
sale
s(3)
($ p
er
gold
equ
iva
len
t ou
nce
)
Achieved significant year-over-year reductions in production cost of sales
• ACHIEVED lower-end of 2014 cost of sales guidance of $720 to $750 per gold equivalent ounce
KINROSS GOLD CORPORATIONScotiabank Sales Desk Presentation
March 30, 2015
www.kinross.com9
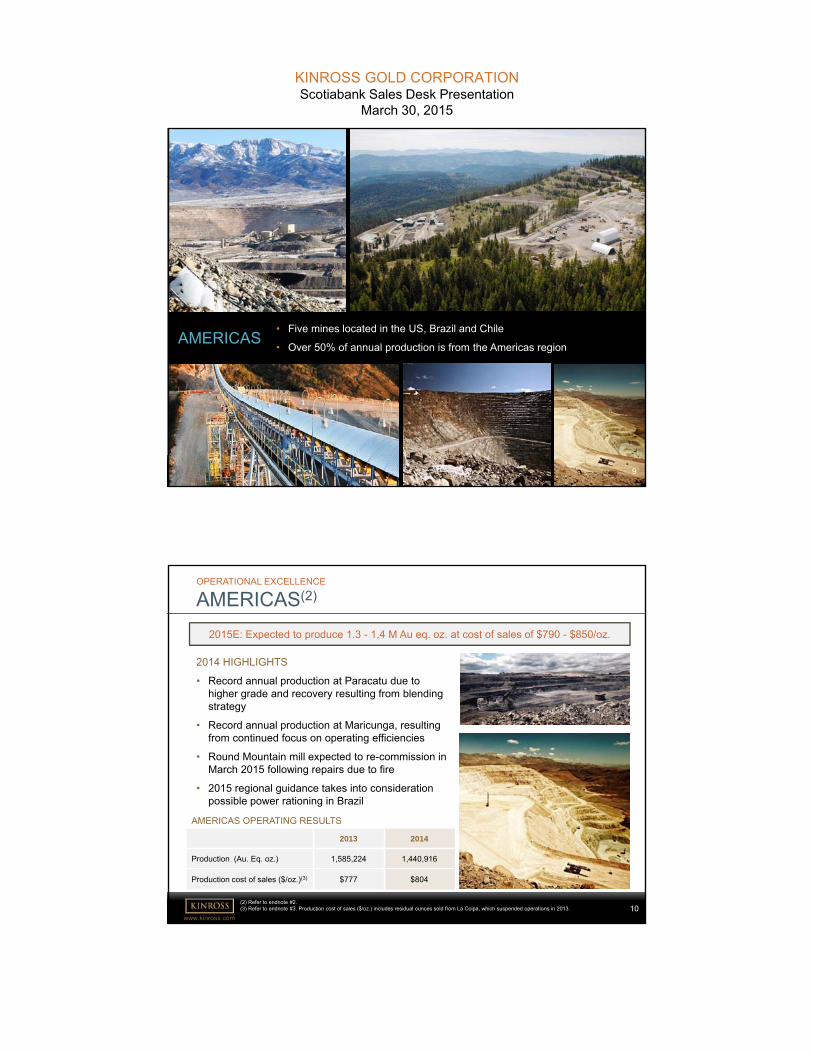
• Five mines located in the US, Brazil and Chile
• Over 50% of annual production is from the Americas regionAMERICAS
9
www.kinross.com10
OPERATIONAL EXCELLENCE
AMERICAS(2)
(2) Refer to endnote #2.(3) Refer to endnote #3. Production cost of sales ($/oz.) includes residual ounces sold from La Coipa, which suspended operations in 2013.
2013 2014
Production (Au. Eq. oz.) 1,585,224 1,440,916
Production cost of sales ($/oz.)(3) $777 $804
AMERICAS OPERATING RESULTS
2015E: Expected to produce 1.3 - 1.4 M Au eq. oz. at cost of sales of $790 - $850/oz.
2014 HIGHLIGHTS
• Record annual production at Paracatu due to higher grade and recovery resulting from blending strategy
• Record annual production at Maricunga, resulting from continued focus on operating efficiencies
• Round Mountain mill expected to re-commission in March 2015 following repairs due to fire
• 2015 regional guidance takes into consideration possible power rationing in Brazil
KINROSS GOLD CORPORATIONScotiabank Sales Desk Presentation
March 30, 2015
www.kinross.com11
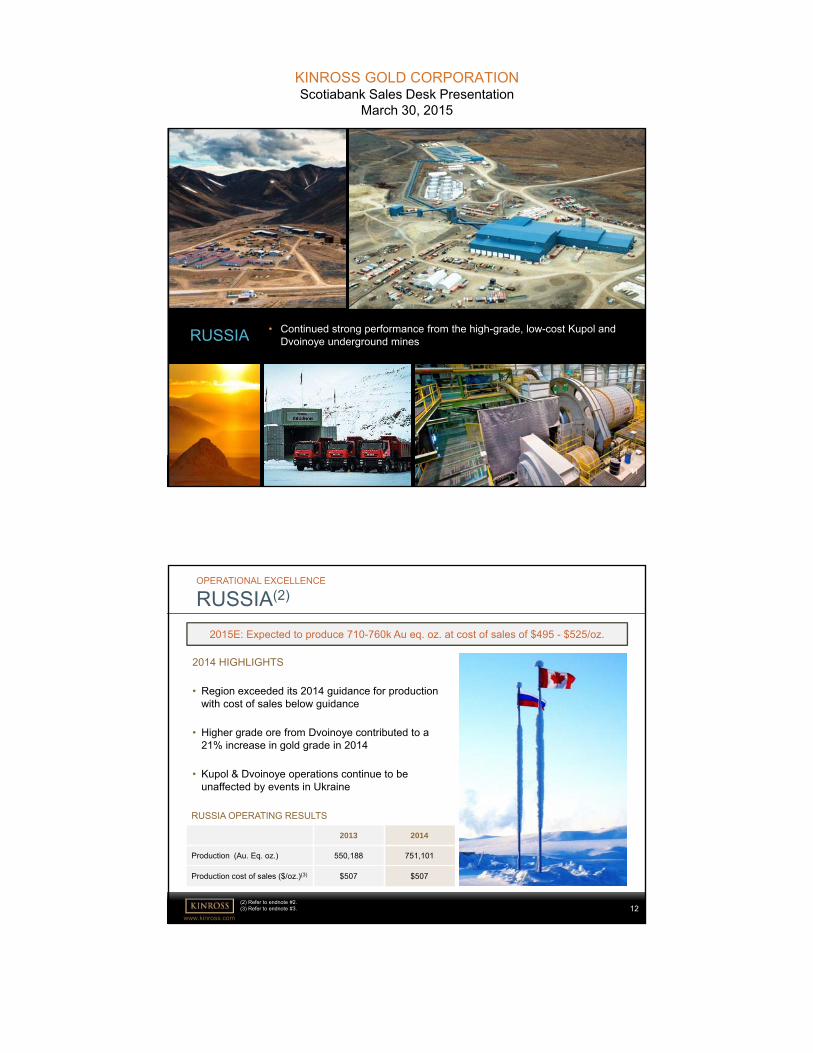
• Continued strong performance from the high-grade, low-cost Kupol and Dvoinoye underground minesRUSSIA
11
www.kinross.com12
OPERATIONAL EXCELLENCE
RUSSIA(2)
2014 HIGHLIGHTS
• Region exceeded its 2014 guidance for production with cost of sales below guidance
• Higher grade ore from Dvoinoye contributed to a 21% increase in gold grade in 2014
• Kupol & Dvoinoye operations continue to be unaffected by events in Ukraine
2015E: Expected to produce 710-760k Au eq. oz. at cost of sales of $495 - $525/oz.
RUSSIA OPERATING RESULTS
2013 2014
Production (Au. Eq. oz.) 550,188 751,101
Production cost of sales ($/oz.)(3) $507 $507
(2) Refer to endnote #2.(3) Refer to endnote #3.
KINROSS GOLD CORPORATIONScotiabank Sales Desk Presentation
March 30, 2015
www.kinross.com13
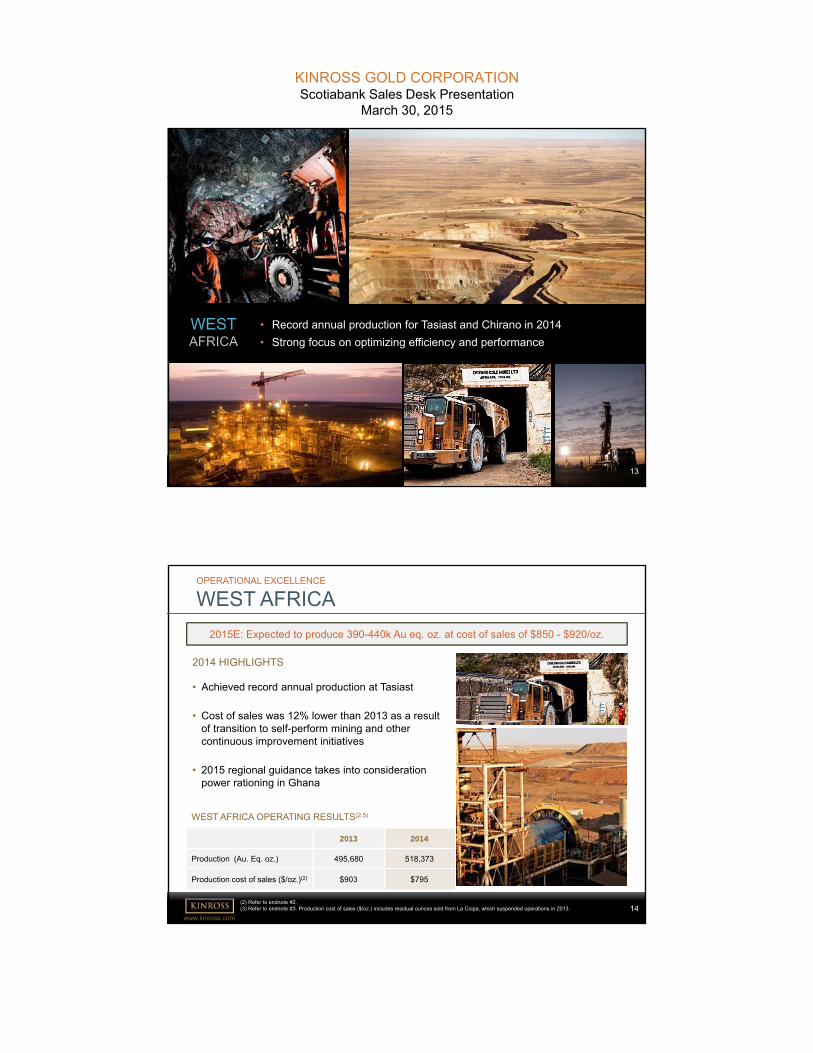
• Record annual production for Tasiast and Chirano in 2014
• Strong focus on optimizing efficiency and performance
WESTAFRICA
13
www.kinross.com14
OPERATIONAL EXCELLENCE
WEST AFRICA
2015E: Expected to produce 390-440k Au eq. oz. at cost of sales of $850 - $920/oz.
WEST AFRICA OPERATING RESULTS(2,5)
2014 HIGHLIGHTS
• Achieved record annual production at Tasiast
• Cost of sales was 12% lower than 2013 as a result of transition to self-perform mining and other continuous improvement initiatives
• 2015 regional guidance takes into consideration power rationing in Ghana
2013 2014
Production (Au. Eq. oz.) 495,680 518,373
Production cost of sales ($/oz.)(2) $903 $795
(2) Refer to endnote #2.(3) Refer to endnote #3. Production cost of sales ($/oz.) includes residual ounces sold from La Coipa, which suspended operations in 2013.
KINROSS GOLD CORPORATIONScotiabank Sales Desk Presentation
March 30, 2015
www.kinross.com15
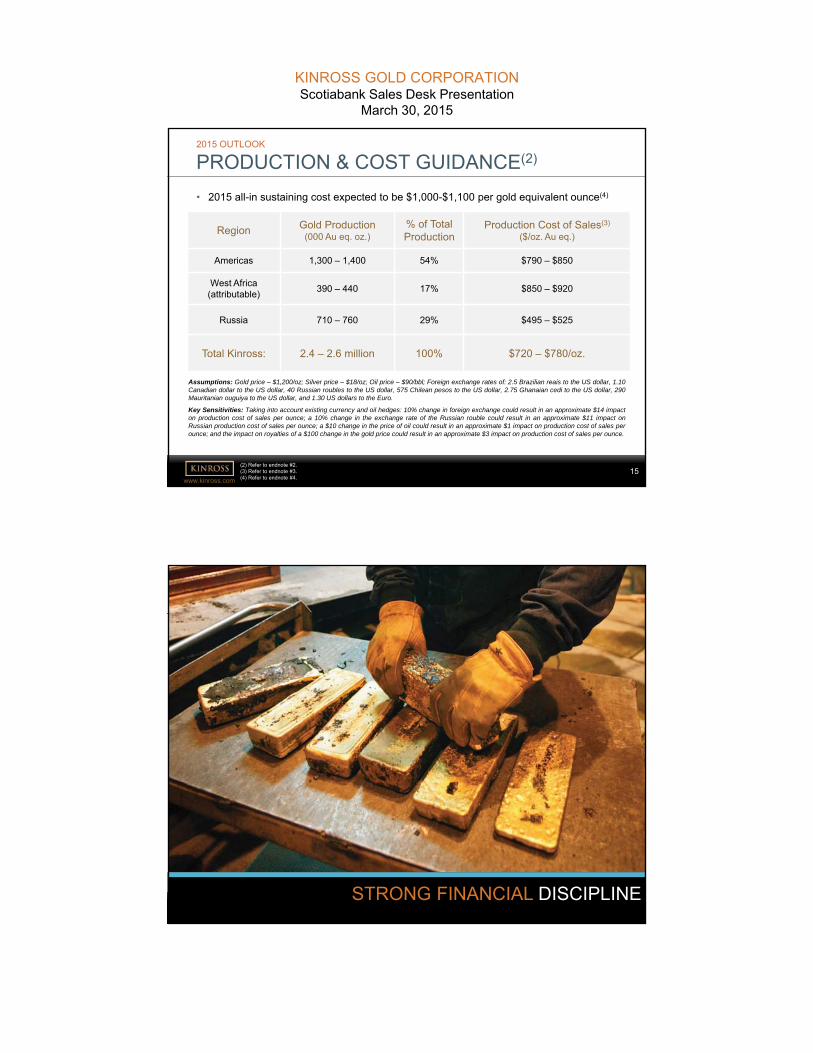
2015 OUTLOOK
PRODUCTION & COST GUIDANCE(2)
Region Gold Production(000 Au eq. oz.)
% of TotalProduction
Production Cost of Sales(3)
($/oz. Au eq.)
Americas 1,300 – 1,400 54% $790 – $850
West Africa(attributable)
390 – 440 17% $850 – $920
Russia 710 – 760 29% $495 – $525
Total Kinross: 2.4 – 2.6 million 100% $720 – $780/oz.
Assumptions: Gold price – $1,200/oz; Silver price – $18/oz; Oil price – $90/bbl; Foreign exchange rates of: 2.5 Brazilian reais to the US dollar, 1.10Canadian dollar to the US dollar, 40 Russian roubles to the US dollar, 575 Chilean pesos to the US dollar, 2.75 Ghanaian cedi to the US dollar, 290Mauritanian ouguiya to the US dollar, and 1.30 US dollars to the Euro.
Key Sensitivities: Taking into account existing currency and oil hedges: 10% change in foreign exchange could result in an approximate $14 impacton production cost of sales per ounce; a 10% change in the exchange rate of the Russian rouble could result in an approximate $11 impact onRussian production cost of sales per ounce; a $10 change in the price of oil could result in an approximate $1 impact on production cost of sales perounce; and the impact on royalties of a $100 change in the gold price could result in an approximate $3 impact on production cost of sales per ounce.
• 2015 all-in sustaining cost expected to be $1,000-$1,100 per gold equivalent ounce(4)
(2) Refer to endnote #2.(3) Refer to endnote #3. (4) Refer to endnote #4.
www.kinross.com16
STRONG FINANCIAL DISCIPLINE
KINROSS GOLD CORPORATIONScotiabank Sales Desk Presentation
March 30, 2015
www.kinross.com17
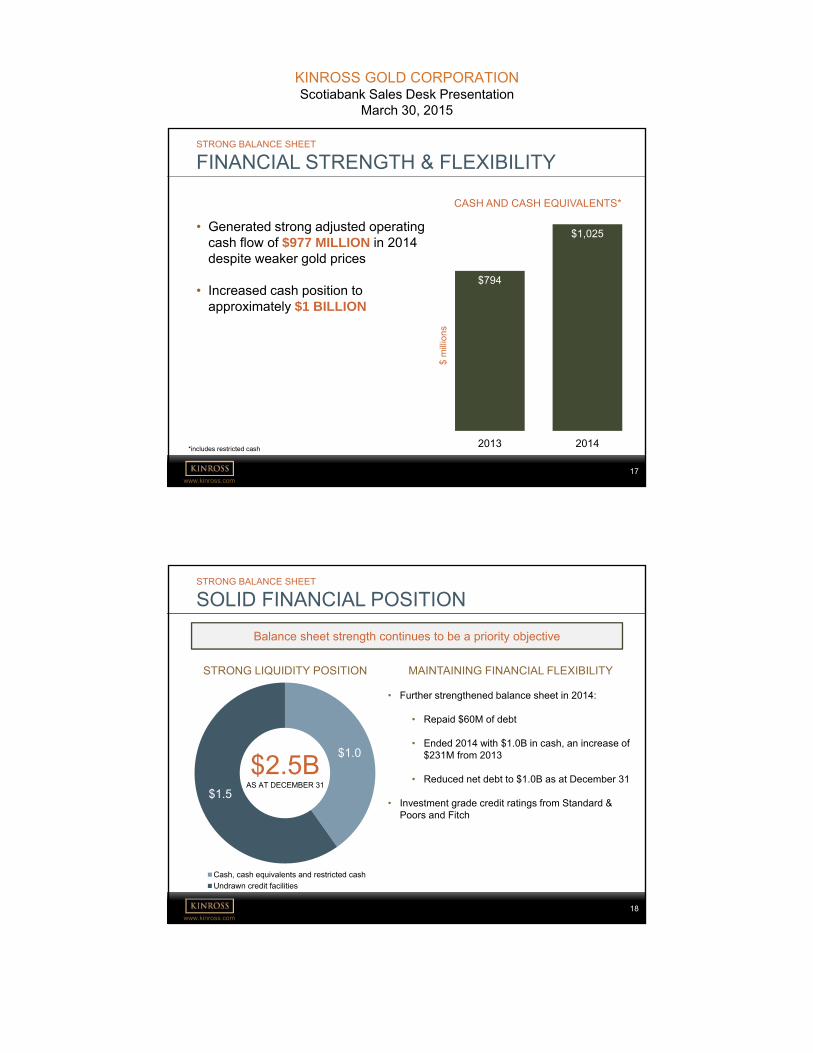
STRONG BALANCE SHEET
FINANCIAL STRENGTH & FLEXIBILITY
$794
$1,025
2013 2014
• Generated strong adjusted operating cash flow of $977 MILLION in 2014 despite weaker gold prices
• Increased cash position to approximately $1 BILLION
$ m
illio
ns
CASH AND CASH EQUIVALENTS*
*includes restricted cash
www.kinross.com18
STRONG BALANCE SHEET
SOLID FINANCIAL POSITION
$1.0
$1.5
Cash, cash equivalents and restricted cash
Undrawn credit facilities
STRONG LIQUIDITY POSITION
Balance sheet strength continues to be a priority objective
MAINTAINING FINANCIAL FLEXIBILITY
• Further strengthened balance sheet in 2014:
• Repaid $60M of debt
• Ended 2014 with $1.0B in cash, an increase of $231M from 2013
• Reduced net debt to $1.0B as at December 31
• Investment grade credit ratings from Standard & Poors and Fitch
$2.5BAS AT DECEMBER 31
KINROSS GOLD CORPORATIONScotiabank Sales Desk Presentation
March 30, 2015
www.kinross.com19
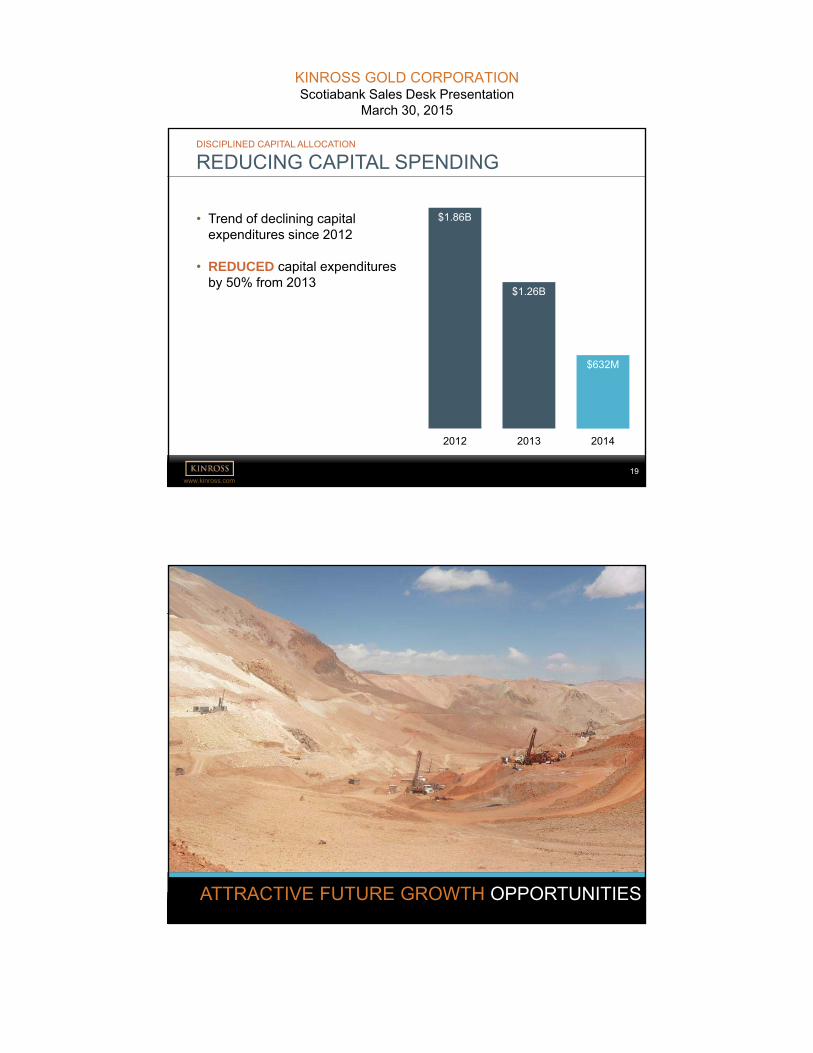
DISCIPLINED CAPITAL ALLOCATION
REDUCING CAPITAL SPENDING
$1.86B
$1.26B
$632M
2012 2013 2014
• Trend of declining capital expenditures since 2012
• REDUCED capital expenditures by 50% from 2013
www.kinross.com20
ATTRACTIVE FUTURE GROWTH OPPORTUNITIES
KINROSS GOLD CORPORATIONScotiabank Sales Desk Presentation
March 30, 2015
www.kinross.com21
MAINTAINING BALANCE SHEET STRENGTH AND FINANCIAL FLEXIBILITY OVERRIDING FACTOR
• Gold price outlook and impact on cash flow generation during 35-month construction period important factors
• Continue to believe Tasiast mill expansion offers a rare combination of large, low-cost production with relatively low execution risk
• Kinross will continue to assess market conditions with a view to possibly expanding Tasiast in the future
• Continuing effort to reduce operating costs at existing operation
ATTRACTIVE GROWTH OPPORTUNITIES
TASIAST MILL EXPANSION
Kinross not proceeding with Tasiast expansion at the present time
www.kinross.com22
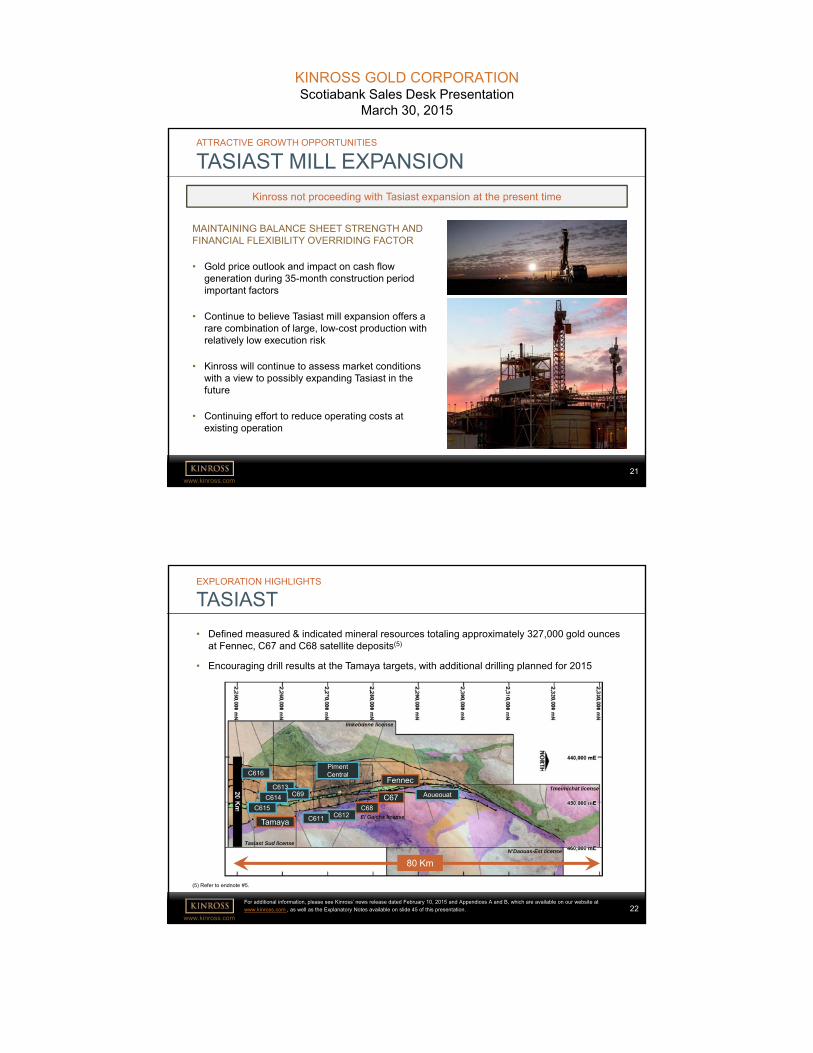
EXPLORATION HIGHLIGHTS
TASIAST
80 Km
C613
Tamaya
C69C614
C616
C615C612C611
Fennec
C67C68
Aoueouat
Piment Central
El Gaicha license
Tmeimichat license
Imkebdene license
Tasiast Sud license
N’Daouas-Est license
For additional information, please see Kinross’ news release dated February 10, 2015 and Appendices A and B, which are available on our website at
www.kinross.com , as well as the Explanatory Notes available on slide 45 of this presentation.
• Defined measured & indicated mineral resources totaling approximately 327,000 gold ounces at Fennec, C67 and C68 satellite deposits(5)
• Encouraging drill results at the Tamaya targets, with additional drilling planned for 2015
(5) Refer to endnote #5.
KINROSS GOLD CORPORATIONScotiabank Sales Desk Presentation
March 30, 2015
www.kinross.com23
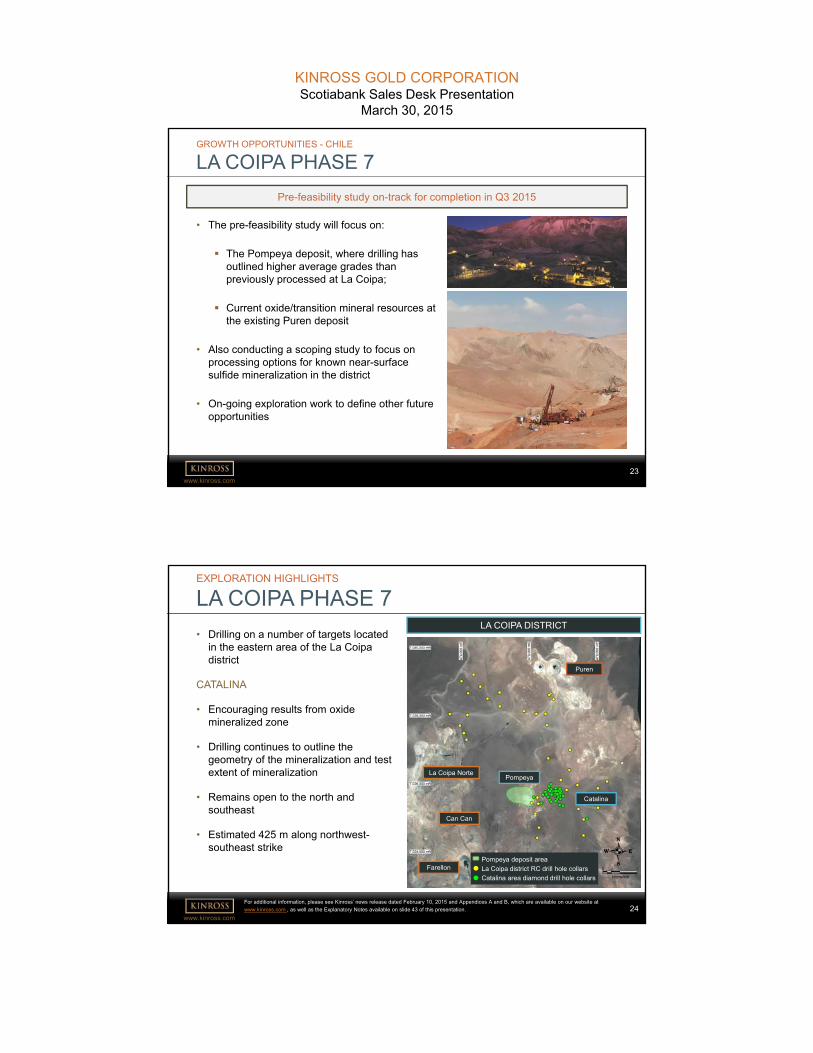
• The pre-feasibility study will focus on:
The Pompeya deposit, where drilling has outlined higher average grades than previously processed at La Coipa;
Current oxide/transition mineral resources at the existing Puren deposit
• Also conducting a scoping study to focus on processing options for known near-surface sulfide mineralization in the district
• On-going exploration work to define other future opportunities
GROWTH OPPORTUNITIES - CHILE
LA COIPA PHASE 7
Pre-feasibility study on-track for completion in Q3 2015
www.kinross.com24
EXPLORATION HIGHLIGHTS
LA COIPA PHASE 7
Pompeya
Puren
Can Can
Farellon
La Coipa Norte
Catalina
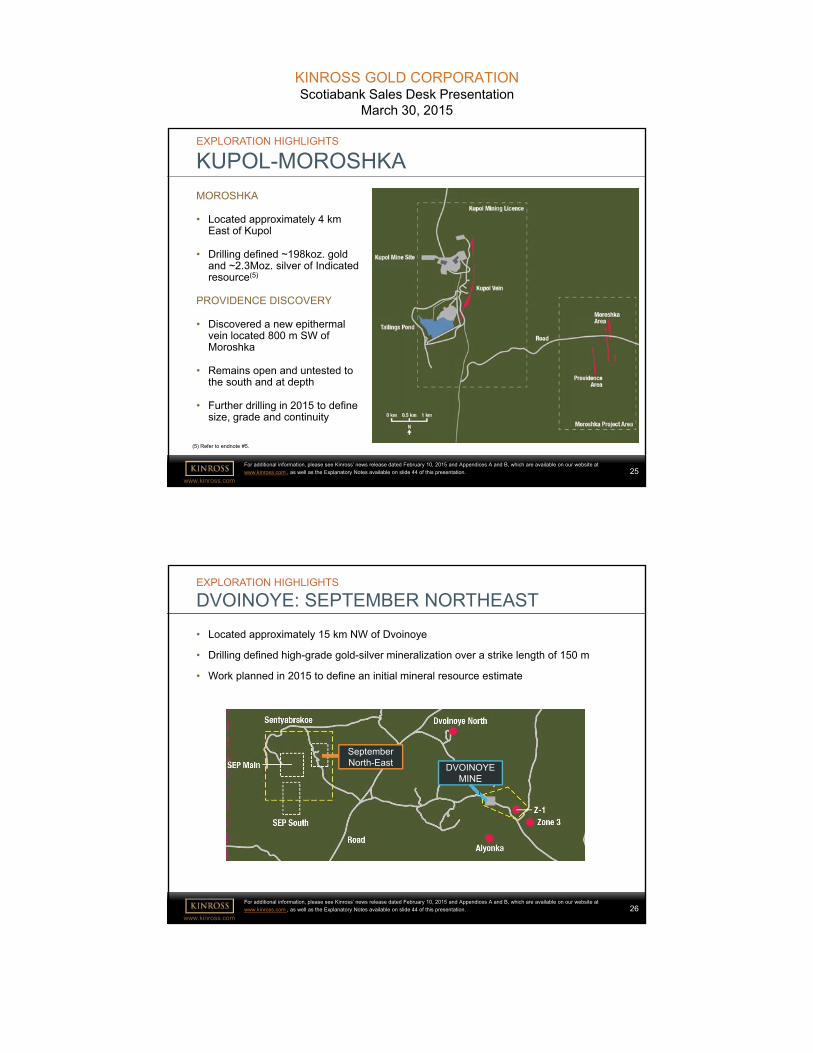
LA COIPA DISTRICT• Drilling on a number of targets located
in the eastern area of the La Coipa district
CATALINA
• Encouraging results from oxide mineralized zone
• Drilling continues to outline the geometry of the mineralization and test extent of mineralization
• Remains open to the north and southeast
• Estimated 425 m along northwest-southeast strike
For additional information, please see Kinross’ news release dated February 10, 2015 and Appendices A and B, which are available on our website at
www.kinross.com , as well as the Explanatory Notes available on slide 43 of this presentation.
Pompeya deposit area
La Coipa district RC drill hole collars
Catalina area diamond drill hole collars
KINROSS GOLD CORPORATIONScotiabank Sales Desk Presentation
March 30, 2015
www.kinross.com25
EXPLORATION HIGHLIGHTS
KUPOL-MOROSHKA
MOROSHKA
• Located approximately 4 km East of Kupol
• Drilling defined ~198koz. gold and ~2.3Moz. silver of Indicated resource(5)
PROVIDENCE DISCOVERY
• Discovered a new epithermal vein located 800 m SW of Moroshka
• Remains open and untested to the south and at depth
• Further drilling in 2015 to define size, grade and continuity
For additional information, please see Kinross’ news release dated February 10, 2015 and Appendices A and B, which are available on our website at
www.kinross.com , as well as the Explanatory Notes available on slide 44 of this presentation.
(5) Refer to endnote #5.
www.kinross.com26
EXPLORATION HIGHLIGHTS
DVOINOYE: SEPTEMBER NORTHEAST
For additional information, please see Kinross’ news release dated February 10, 2015 and Appendices A and B, which are available on our website at
www.kinross.com , as well as the Explanatory Notes available on slide 44 of this presentation.
• Located approximately 15 km NW of Dvoinoye
• Drilling defined high-grade gold-silver mineralization over a strike length of 150 m
• Work planned in 2015 to define an initial mineral resource estimate
September North-East DVOINOYE
MINE
KINROSS GOLD CORPORATIONScotiabank Sales Desk Presentation
March 30, 2015
www.kinross.com27
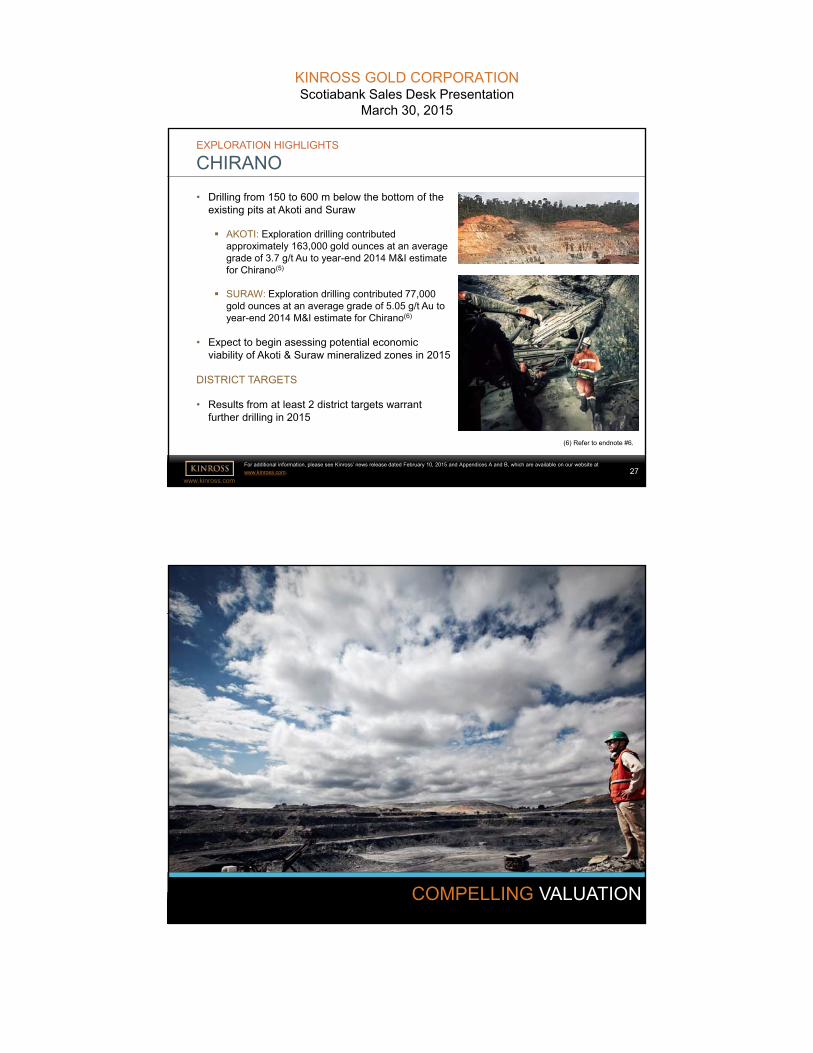
• Drilling from 150 to 600 m below the bottom of the existing pits at Akoti and Suraw
AKOTI: Exploration drilling contributed approximately 163,000 gold ounces at an average grade of 3.7 g/t Au to year-end 2014 M&I estimate for Chirano(5)
SURAW: Exploration drilling contributed 77,000 gold ounces at an average grade of 5.05 g/t Au to year-end 2014 M&I estimate for Chirano(6)
• Expect to begin asessing potential economic viability of Akoti & Suraw mineralized zones in 2015
DISTRICT TARGETS
• Results from at least 2 district targets warrant further drilling in 2015
EXPLORATION HIGHLIGHTS
CHIRANO
For additional information, please see Kinross’ news release dated February 10, 2015 and Appendices A and B, which are available on our website at
www.kinross.com.
(6) Refer to endnote #6.
www.kinross.com28
COMPELLING VALUATION
KINROSS GOLD CORPORATIONScotiabank Sales Desk Presentation
March 30, 2015
www.kinross.com29
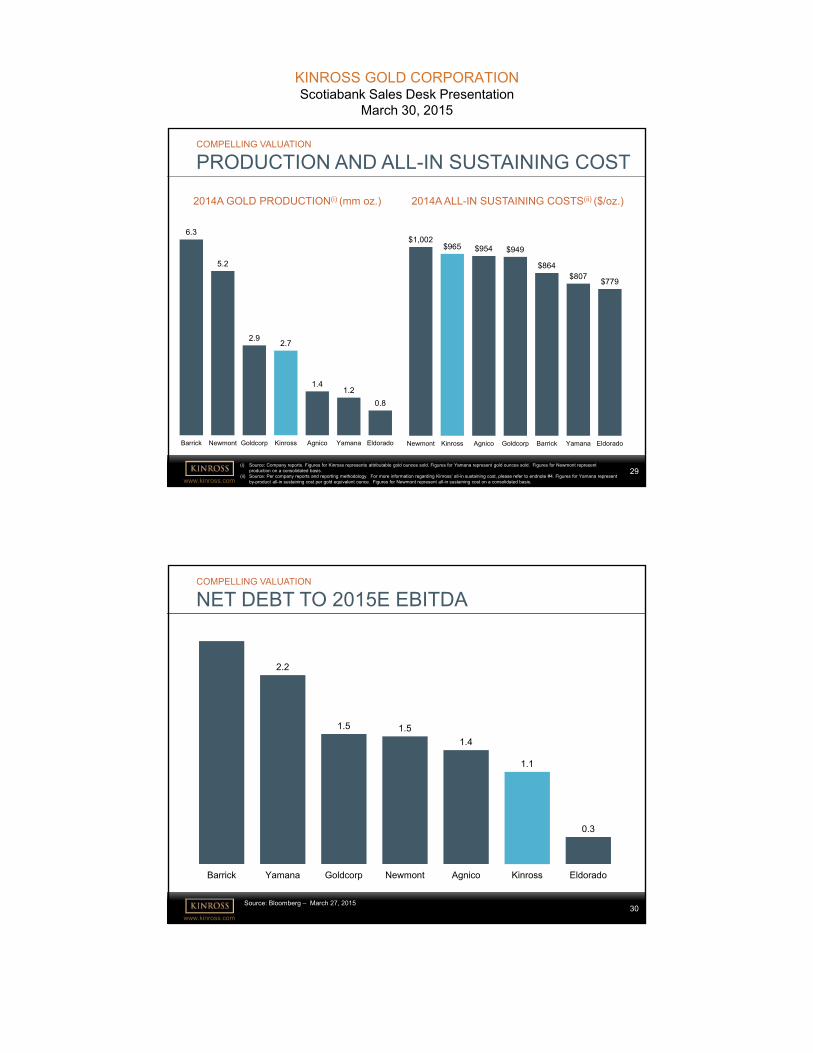
6.3
5.2
2.92.7
1.41.2
0.8
Barrick Newmont Goldcorp Kinross Agnico Yamana Eldorado
2014A GOLD PRODUCTION(i) (mm oz.)
$1,002$965 $954 $949
$864$807
$779
Newmont Kinross Agnico Goldcorp Barrick Yamana Eldorado
2014A ALL-IN SUSTAINING COSTS(ii) ($/oz.)
(i) Source: Company reports. Figures for Kinross represents attributable gold ounces sold. Figures for Yamana represent gold ounces sold. Figures for Newmont represent production on a consolidated basis.
(ii) Source: Per company reports and reporting methodology. For more information regarding Kinross’ all-in sustaining cost, please refer to endnote #4. Figures for Yamana represent by-product all-in sustaining cost per gold equivalent ounce. Figures for Newmont represent all-in sustaining cost on a consolidated basis.
COMPELLING VALUATION
PRODUCTION AND ALL-IN SUSTAINING COST
www.kinross.com30
COMPELLING VALUATION
NET DEBT TO 2015E EBITDA
Source: Bloomberg – March 27, 2015
2.2
1.5 1.5
1.4
1.1
0.3
Barrick Yamana Goldcorp Newmont Agnico Kinross Eldorado
KINROSS GOLD CORPORATIONScotiabank Sales Desk Presentation
March 30, 2015
www.kinross.com31
COMPELLING VALUATION
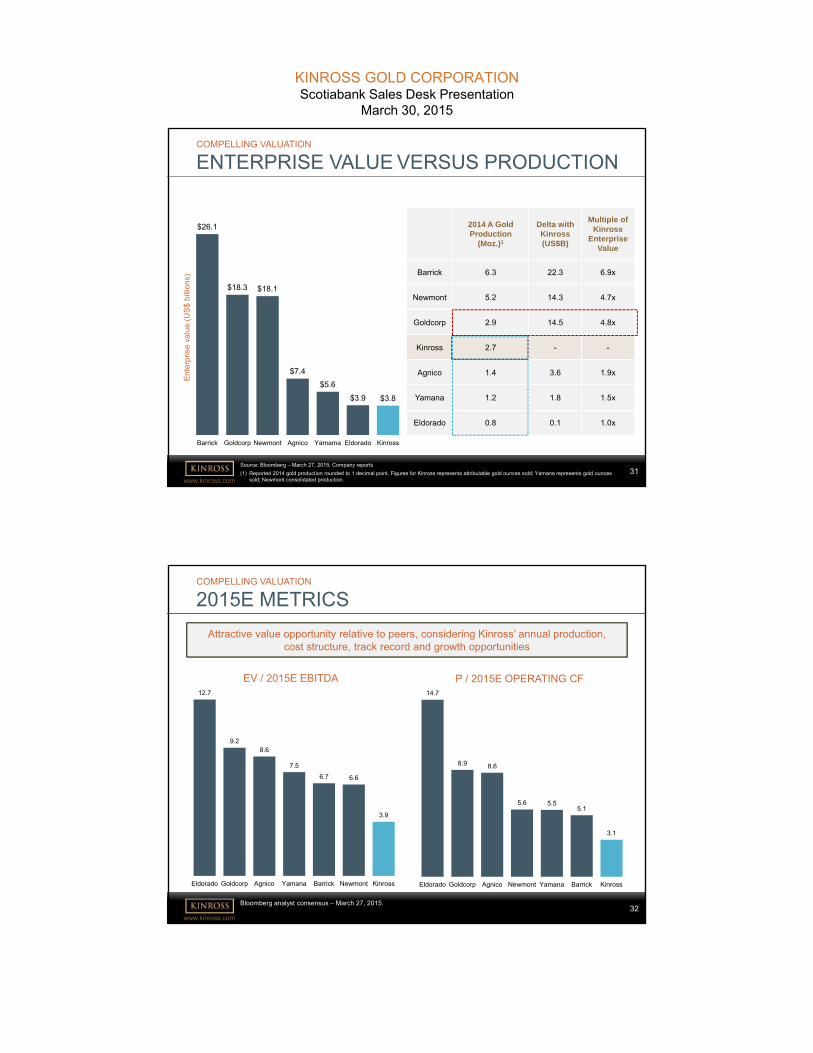
ENTERPRISE VALUE VERSUS PRODUCTION
2014 A Gold Production
(Moz.)1
Delta with Kinross(US$B)
Multiple ofKinross
EnterpriseValue
Barrick 6.3 22.3 6.9x
Newmont 5.2 14.3 4.7x
Goldcorp 2.9 14.5 4.8x
Kinross 2.7 - -
Agnico 1.4 3.6 1.9x
Yamana 1.2 1.8 1.5x
Eldorado 0.8 0.1 1.0x
Source: Bloomberg – March 27, 2015; Company reports
(1) Reported 2014 gold production rounded to 1 decimal point. Figures for Kinross represents attributable gold ounces sold; Yamana represents gold ounces sold; Newmont consolidated production.
$26.1
$18.3 $18.1
$7.4
$5.6
$3.9 $3.8
Barrick Goldcorp Newmont Agnico Yamama Eldorado Kinross
En
terp
rise
va
lue
(U
S$
bill
ion
s)
www.kinross.com32
Bloomberg analyst consensus – March 27, 2015.
COMPELLING VALUATION
2015E METRICS
Attractive value opportunity relative to peers, considering Kinross’ annual production, cost structure, track record and growth opportunities
EV / 2015E EBITDA P / 2015E OPERATING CF12.7
9.28.6
7.5
6.7 6.6
3.9
Eldorado Goldcorp Agnico Yamana Barrick Newmont Kinross
14.7
8.9 8.6
5.6 5.55.1
3.1
Eldorado Goldcorp Agnico Newmont Yamana Barrick Kinross
KINROSS GOLD CORPORATIONScotiabank Sales Desk Presentation
March 30, 2015
www.kinross.com33
• Focus on operational excellence
• Quality over quantity
• Disciplined capital allocation
• Maintaining a strong balance sheet
33
THE WAY FORWARD
PRINCIPLES FOR BUILDING VALUE
www.kinross.com34
APPENDIX
KINROSS GOLD CORPORATIONScotiabank Sales Desk Presentation
March 30, 2015
www.kinross.com35
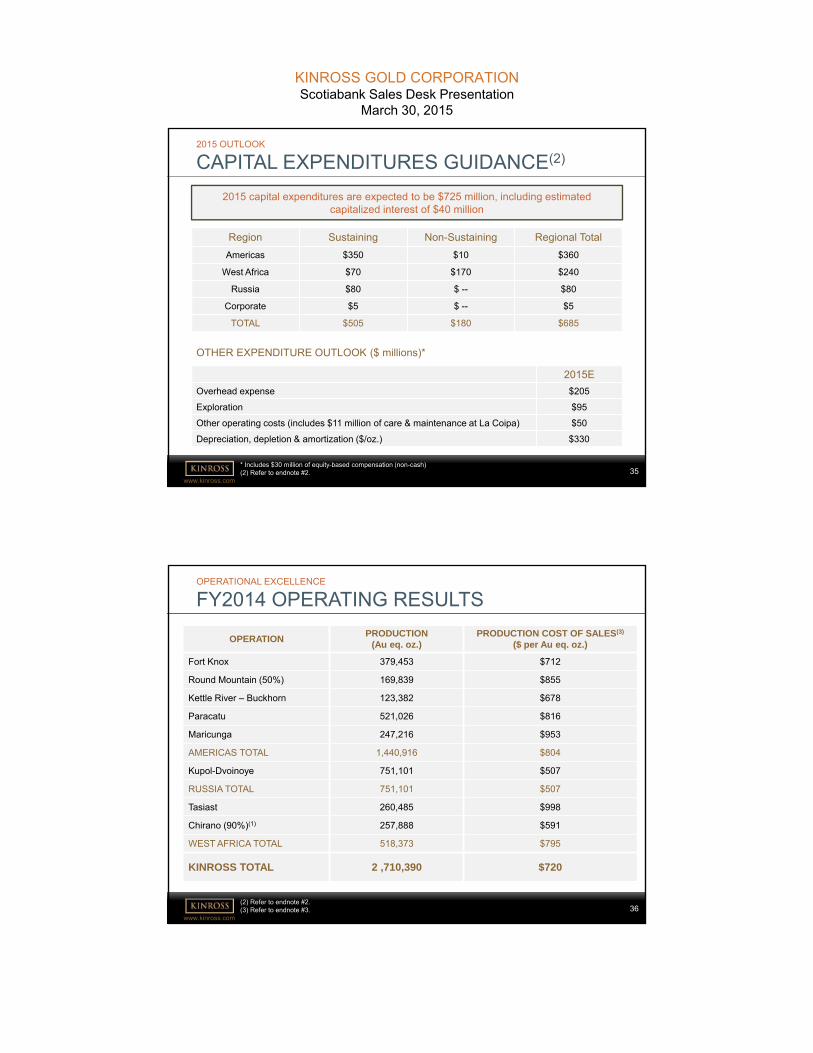
2015 OUTLOOK
CAPITAL EXPENDITURES GUIDANCE(2)
Region Sustaining Non-Sustaining Regional Total
Americas $350 $10 $360
West Africa $70 $170 $240
Russia $80 $ -- $80
Corporate $5 $ -- $5
TOTAL $505 $180 $685
OTHER EXPENDITURE OUTLOOK ($ millions)*
2015E
Overhead expense $205
Exploration $95
Other operating costs (includes $11 million of care & maintenance at La Coipa) $50
Depreciation, depletion & amortization ($/oz.) $330
2015 capital expenditures are expected to be $725 million, including estimated capitalized interest of $40 million
* Includes $30 million of equity-based compensation (non-cash)(2) Refer to endnote #2.
www.kinross.com36
OPERATIONPRODUCTION
(Au eq. oz.)PRODUCTION COST OF SALES(3)
($ per Au eq. oz.)
Fort Knox 379,453 $712
Round Mountain (50%) 169,839 $855
Kettle River – Buckhorn 123,382 $678
Paracatu 521,026 $816
Maricunga 247,216 $953
AMERICAS TOTAL 1,440,916 $804
Kupol-Dvoinoye 751,101 $507
RUSSIA TOTAL 751,101 $507
Tasiast 260,485 $998
Chirano (90%)(1) 257,888 $591
WEST AFRICA TOTAL 518,373 $795
KINROSS TOTAL 2 ,710,390 $720
OPERATIONAL EXCELLENCE
FY2014 OPERATING RESULTS
(2) Refer to endnote #2.(3) Refer to endnote #3.
KINROSS GOLD CORPORATIONScotiabank Sales Desk Presentation
March 30, 2015
www.kinross.com37
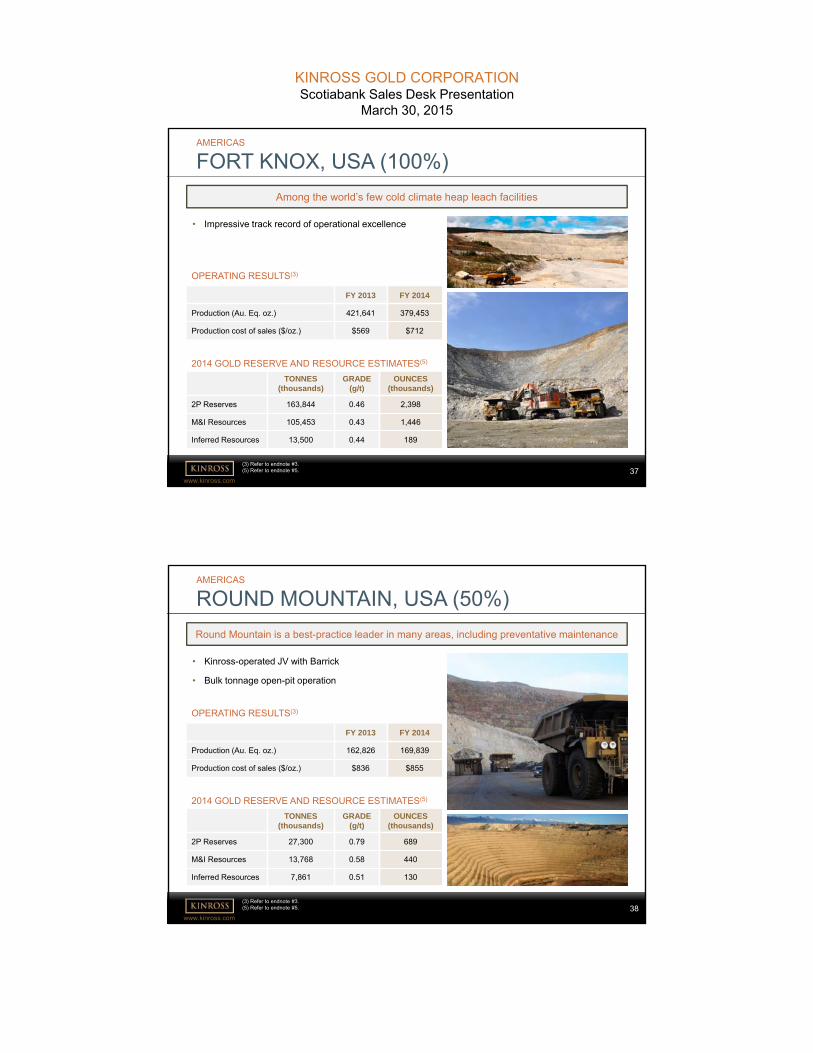
• Impressive track record of operational excellence
AMERICAS
FORT KNOX, USA (100%)
TONNES(thousands)
GRADE (g/t)
OUNCES(thousands)
2P Reserves 163,844 0.46 2,398
M&I Resources 105,453 0.43 1,446
Inferred Resources 13,500 0.44 189
(3) Refer to endnote #3.(5) Refer to endnote #5.
FY 2013 FY 2014
Production (Au. Eq. oz.) 421,641 379,453
Production cost of sales ($/oz.) $569 $712
OPERATING RESULTS(3)
2014 GOLD RESERVE AND RESOURCE ESTIMATES(5)
Among the world’s few cold climate heap leach facilities
www.kinross.com38
• Kinross-operated JV with Barrick
• Bulk tonnage open-pit operation
AMERICAS
ROUND MOUNTAIN, USA (50%)
TONNES(thousands)
GRADE (g/t)
OUNCES(thousands)
2P Reserves 27,300 0.79 689
M&I Resources 13,768 0.58 440
Inferred Resources 7,861 0.51 130
FY 2013 FY 2014
Production (Au. Eq. oz.) 162,826 169,839
Production cost of sales ($/oz.) $836 $855
Round Mountain is a best-practice leader in many areas, including preventative maintenance
(3) Refer to endnote #3.(5) Refer to endnote #5.
OPERATING RESULTS(3)
2014 GOLD RESERVE AND RESOURCE ESTIMATES(5)
KINROSS GOLD CORPORATIONScotiabank Sales Desk Presentation
March 30, 2015
www.kinross.com39
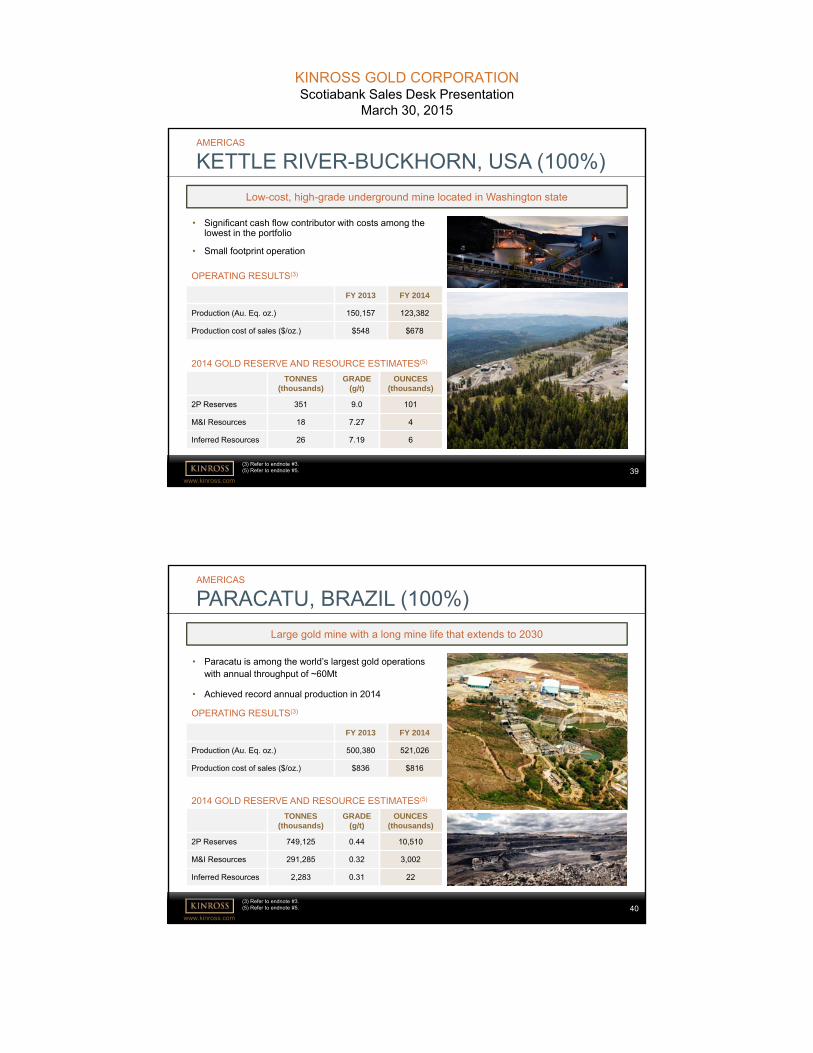
• Significant cash flow contributor with costs among the lowest in the portfolio
• Small footprint operation
AMERICAS
KETTLE RIVER-BUCKHORN, USA (100%)
TONNES(thousands)
GRADE (g/t)
OUNCES(thousands)
2P Reserves 351 9.0 101
M&I Resources 18 7.27 4
Inferred Resources 26 7.19 6
FY 2013 FY 2014
Production (Au. Eq. oz.) 150,157 123,382
Production cost of sales ($/oz.) $548 $678
Low-cost, high-grade underground mine located in Washington state
(3) Refer to endnote #3.(5) Refer to endnote #5.
OPERATING RESULTS(3)
2014 GOLD RESERVE AND RESOURCE ESTIMATES(5)
www.kinross.com40
• Paracatu is among the world’s largest gold operations with annual throughput of ~60Mt
• Achieved record annual production in 2014
AMERICAS
PARACATU, BRAZIL (100%)
TONNES(thousands)
GRADE (g/t)
OUNCES(thousands)
2P Reserves 749,125 0.44 10,510
M&I Resources 291,285 0.32 3,002
Inferred Resources 2,283 0.31 22
FY 2013 FY 2014
Production (Au. Eq. oz.) 500,380 521,026
Production cost of sales ($/oz.) $836 $816
Large gold mine with a long mine life that extends to 2030
(3) Refer to endnote #3.(5) Refer to endnote #5.
OPERATING RESULTS(3)
2014 GOLD RESERVE AND RESOURCE ESTIMATES(5)
KINROSS GOLD CORPORATIONScotiabank Sales Desk Presentation
March 30, 2015
www.kinross.com41
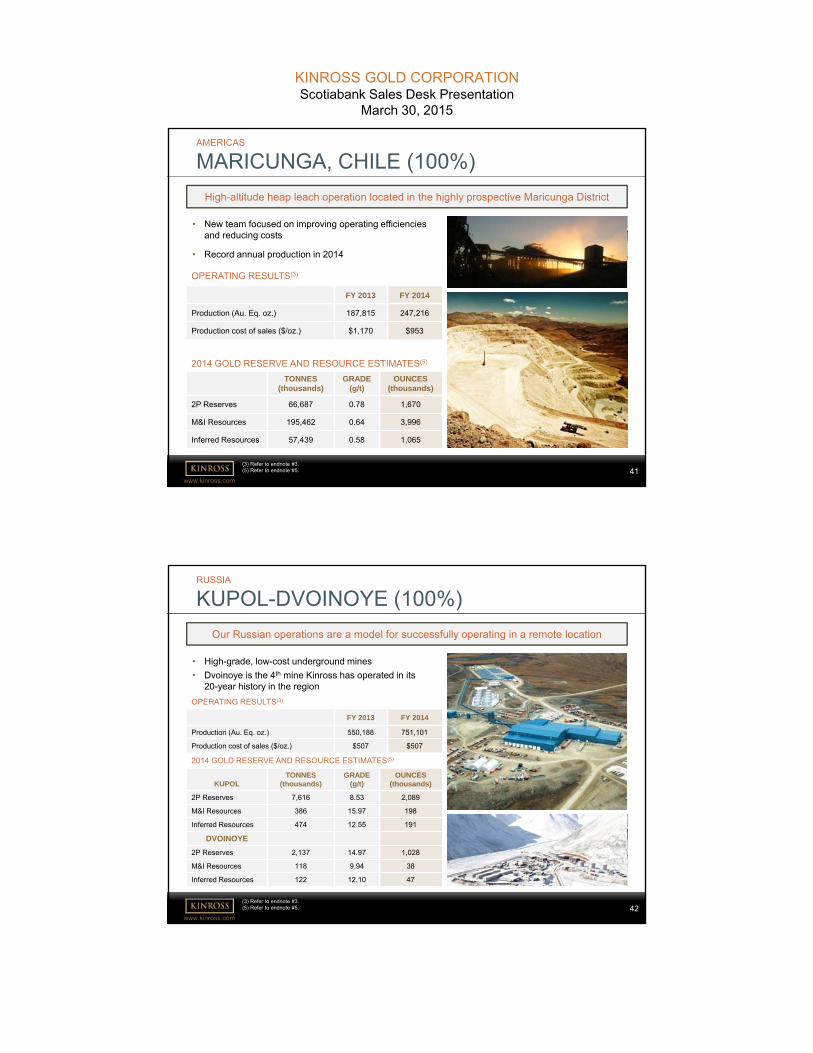
• New team focused on improving operating efficiencies and reducing costs
• Record annual production in 2014
AMERICAS
MARICUNGA, CHILE (100%)
TONNES(thousands)
GRADE (g/t)
OUNCES(thousands)
2P Reserves 66,687 0.78 1,670
M&I Resources 195,462 0.64 3,996
Inferred Resources 57,439 0.58 1,065
FY 2013 FY 2014
Production (Au. Eq. oz.) 187,815 247,216
Production cost of sales ($/oz.) $1,170 $953
High-altitude heap leach operation located in the highly prospective Maricunga District
(3) Refer to endnote #3.(5) Refer to endnote #5.
OPERATING RESULTS(3)
2014 GOLD RESERVE AND RESOURCE ESTIMATES(5)
www.kinross.com42
• High-grade, low-cost underground mines
• Dvoinoye is the 4th mine Kinross has operated in its 20-year history in the region
RUSSIA
KUPOL-DVOINOYE (100%)
KUPOLTONNES
(thousands)GRADE
(g/t)OUNCES
(thousands)
2P Reserves 7,616 8.53 2,089
M&I Resources 386 15.97 198
Inferred Resources 474 12.55 191
DVOINOYE
2P Reserves 2,137 14.97 1,028
M&I Resources 118 9.94 38
Inferred Resources 122 12.10 47
FY 2013 FY 2014
Production (Au. Eq. oz.) 550,188 751,101
Production cost of sales ($/oz.) $507 $507
OPERATING RESULTS(3)
2014 GOLD RESERVE AND RESOURCE ESTIMATES(5)
Our Russian operations are a model for successfully operating in a remote location
(3) Refer to endnote #3.(5) Refer to endnote #5.
KINROSS GOLD CORPORATIONScotiabank Sales Desk Presentation
March 30, 2015
www.kinross.com43
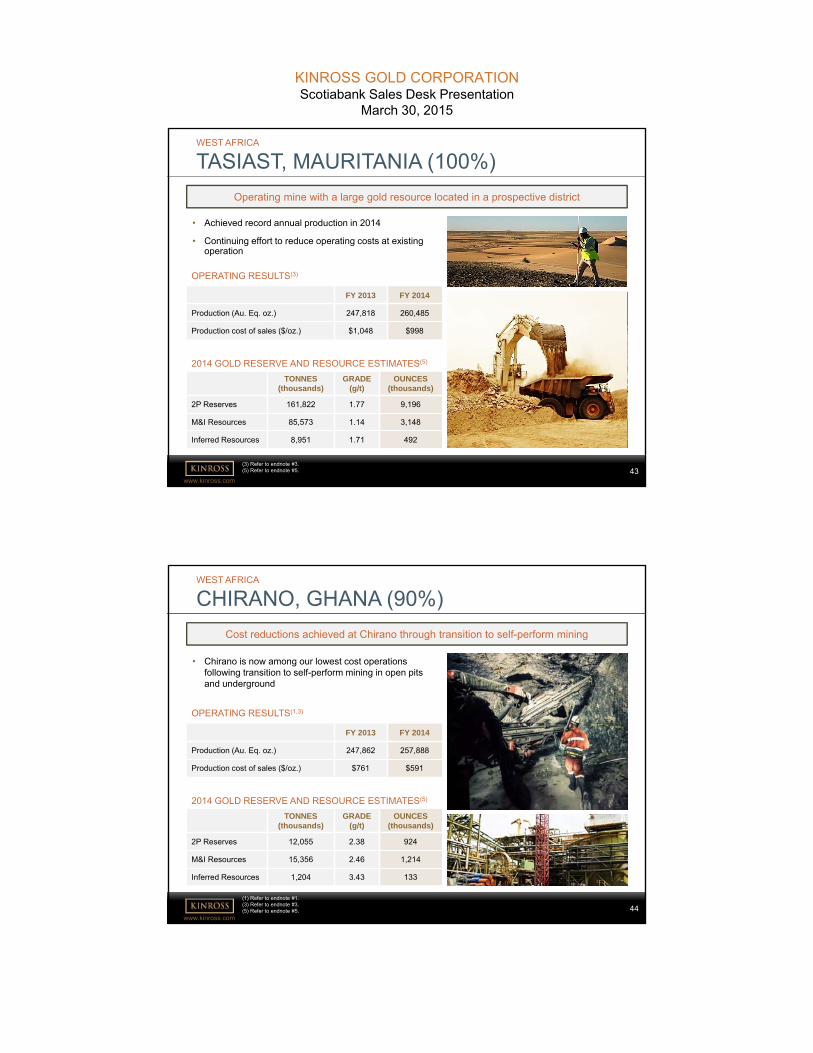
• Achieved record annual production in 2014
• Continuing effort to reduce operating costs at existing operation
WEST AFRICA
TASIAST, MAURITANIA (100%)
TONNES(thousands)
GRADE (g/t)
OUNCES(thousands)
2P Reserves 161,822 1.77 9,196
M&I Resources 85,573 1.14 3,148
Inferred Resources 8,951 1.71 492
FY 2013 FY 2014
Production (Au. Eq. oz.) 247,818 260,485
Production cost of sales ($/oz.) $1,048 $998
Operating mine with a large gold resource located in a prospective district
(3) Refer to endnote #3.(5) Refer to endnote #5.
OPERATING RESULTS(3)
2014 GOLD RESERVE AND RESOURCE ESTIMATES(5)
www.kinross.com44
• Chirano is now among our lowest cost operations following transition to self-perform mining in open pits and underground
WEST AFRICA
CHIRANO, GHANA (90%)
TONNES(thousands)
GRADE (g/t)
OUNCES(thousands)
2P Reserves 12,055 2.38 924
M&I Resources 15,356 2.46 1,214
Inferred Resources 1,204 3.43 133
FY 2013 FY 2014
Production (Au. Eq. oz.) 247,862 257,888
Production cost of sales ($/oz.) $761 $591
Cost reductions achieved at Chirano through transition to self-perform mining
(1) Refer to endnote #1.(3) Refer to endnote #3.(5) Refer to endnote #5.
OPERATING RESULTS(1,3)
2014 GOLD RESERVE AND RESOURCE ESTIMATES(5)
KINROSS GOLD CORPORATIONScotiabank Sales Desk Presentation
March 30, 2015
www.kinross.com45
ENDNOTES1) Unless otherwise noted, gold equivalent production, gold equivalent ounces sold and production cost of sales figures
in this presentation are based on Kinross’ 90% share of Chirano production and sales.
2) For more information regarding Kinross’ production, cost and capital expenditures outlook for 2015, please refer to thenews release dated February 10, 2015, available on our website at www.kinross.com. Kinross’ outlook for 2015represents forward-looking information and users are cautioned that actual results may vary. Please refer to the risksand assumptions contained in the Cautionary Statement on Forward-Looking Information on slide 2 of thispresentation.
3) Attributable production cost of sales per gold equivalent ounce sold is a non-GAAP measure. For more informationand a reconciliation of this non-GAAP measure for the three and twelve months ended December 31, 2014 and 2013,please refer to the news release dated February 10, 2015, under the heading “Reconciliation of non-GAAP financialmeasures”, available on our website at www.kinross.com.
4) All-in sustaining cost is a non-GAAP measure. For more information and a reconciliation of this non-GAAP measurefor the three and twelve months ended December 31, 2014 and 2013, please refer to the news release dated February10, 2015, under the heading “Reconciliation of non-GAAP financial measures”, available on our website atwww.kinross.com.
5) For more information regarding Kinross’ mineral reserves and mineral resources, please refer to our Annual MineralReserve and Mineral Resource Statement as at December 31, 2014 contained in our news release dated February 10,2015, which is available on our website at www.kinross.com.
www.kinross.com46
EXPLANATORY NOTES: EXPLORATIONLa Coipa Exploration Results
Results are reported for 45 diamond drill core holes completed at Catalina in the La Coipa District. All results for the exploration drill campaign are reported as Au grams per tonne (Au g/t), Ag grams per tonne (Ag g/t) and as Au Equivalent grams per tonne (Au Eq g/t). Au Eq is calculated using Ag g/t / 63.64 and added to the Au g/t assay result. La Coipa composites are calculated using weighted average of Au Eq equal to or above 0.3 gram per tonne. No more than 2 metres of internal waste (<0.3 grams per tonne) is accepted and high grade samples were not cut. Down hole intercepts widths are reported only, due to the irregular nature of the mineralization. Au and Ag were analyzed for by using fire assay with an atomic absorption finish. NSI means “no significant intercept”.
Samples were collected in two metre intervals for diamond core along the entire length of the drill hole. Core samples were sawed in half lengthwise, with half placed in a plastic sample bag and sent to the lab, with the remaining half stored on site in core boxes. QA/QC standards, duplicates and blanks were inserted into the sample stream according to best practice standards. Seven different standards were used, with all of them certified for gold (Au) and copper (Cu), and certified values for silver (Ag) in three of the seven standards. Field duplicates consisted of quarter sawn core, half remaining from the initial split from the original sample.
All samples were sent to Laboratory Geoanalitica Limitada in Coquimbo, Chile, an ISO 9002 certified laboratory. Gold and silver values were obtained through a 30 gram fire assay and atomic absorption (AA) finish. Lower detection limits were 0.01 g/t for gold, and 0.5 g/t for silver. Except as noted below, the technical information about the Company’s drilling and exploration activities at La Coipa contained in this news release has been prepared under the supervision of and verified by Mr. Sylvain Guerard, an officer with the Company who is a “qualified person” within the meaning of National Instrument 43-101. The drill hole data base including collar, survey, geology and assay information were reviewed by the “qualified person” and the composite assay information independently calculated and verified for accuracy of reporting. Assay certificates for the information disclosed in this news release were verified by the Regional Director Exploration, Americas, but not by Mr. Guerard as the “qualified person”.
KINROSS GOLD CORPORATIONScotiabank Sales Desk Presentation
March 30, 2015
www.kinross.com47
EXPLANATORY NOTES: EXPLORATIONKupol & Dvoinoye Exploration Results
All 28 drill holes in 2014 at Providence were diamond drill core holes (HQ or NQ core diameter). The Providence vein dips sub-vertically, therefore, drill holes are angled between minus 50° and 75° to the east and west.
The composite intervals reported for Providence diamond drill core are selected mainly by geological parameters but some of the intervals are included taking into account the elevated Au and Ag values of the assay data. The intervals are calculated by taking a weighted average of all gold and silver fire assay values included. No more than three consecutive metres of internal waste (<1 grams per tonne) is accepted. High grade samples are not excluded from the calculation. All composite assay intervals are reported as down-hole widths and are not considered true thickness.
Results reported for September Northeast (NE) are from 81 diamond drill core holes completed during 2014 and 38 surface trenches (stripped pavement).
Composite assay intervals reported for September NE diamond drill core results are calculated by taking a weighted average of all gold fire assay values equal to or above 2.0 gram per tonne gold. No more than three consecutive metres of internal waste (<2.0 grams per tonne) is accepted, high grade samples are not cut. True widths are estimated to be on average greater than 80% of the drilled intercept.
Results for the exploration drill campaign are reported as Au grams per tonne (Au g/t), Ag grams per tonne (Ag g/t) and as Au Equivalent grams per tonne (Au Eq g/t). Au Eq is calculated using Ag g/t / 63.64 and added to the Au g/t assay result.
Abbreviations used are:
NSI - No Significant Intersection;
BDL - Below Detection Limit;
TNS - Trench Not sampled
The reader is referred to the Kupol NI 43-101 Technical Report dated May 9, 2011, available under the Company’s profile at www.sedar.com, for a full description of drilling methods, sampling procedures and QA/QC protocols. Samples from Providence and September NE are prepared and analyzed by fire assay using a 50 gram charge with a gravimetric finish at the Kupol mine site analytical laboratory in compliance with industry standards. Field duplicate samples are taken and blanks and standards are added to every batch submitted.
The technical information about the Company’s drilling and exploration activities at Kupol and Dvoinoye contained in this news release has been prepared under the supervision of and verified by Mr. Sylvain Guerard, an officer with the Company who is a “qualified person” within the meaning of National Instrument 43-101. The drill hole data base including collar, survey, geology and assay information were reviewed by the “qualified person” and the composite assay information independently calculated and verified for accuracy of reporting. Assay certificates for the information disclosed in this news release were verified by the Regional Director Exploration, Russia, but not by Mr. Guerard as the “qualified person”.
www.kinross.com48
EXPLANATORY NOTES: EXPLORATIONTasiast Exploration Results
Drill hole identifiers ending with suffix DD are diamond drill core holes (HQ diameter) and those ending with suffix RC are reverse circulation (RC) holes. Holes with “A” prefixing DD or RC are diamond core or reverse circulation re-drills of the original hole where significant deviation would have resulted in that hole missing the intended target.
Results provided for Tasiast include all exploration drill holes for which assay results were available from Tamaya at the time of preparation of this news release. Composite assay intervals reported for exploration drilling at Tasiast are calculated by taking a weighted average of all gold fire assay values equal to or above 0.3 g/t gold. No more than three consecutive metres of internal waste (<0.3 g/t gold) are accepted and high grade samples are cut to 20 grams per tonne gold. All assay intervals are reported as down-hole widths. True widths are estimated to be on average greater than 90% of the drilled intercept.
Composite intervals for reconnaissance reverse circulation holes are calculated by applying a 0.3 gram per tonne cut-off, no more than 6 metres of internal waste and no top cut. All assay intervals are reported as down-hole thicknesses. There is insufficient information on all targets to provide estimates of true thickness.
The reader is referred to the Tasiast NI 43-101 Technical Report dated March 31, 2014, available under the Company’s profile at www.sedar.com, for a full description of drilling methods, sampling procedures and QA/QC protocols. Samples from Tasiast are prepared and analyzed by fire assay using a 50 gram charge with an AAS finish at ALS (Tasiast mine site, Johannesburg, South Africa and Vancouver, Canada) in compliance with industry standards. Field duplicate samples are taken and blanks and standards are added to every batch submitted. Selected samples from this lab are check assayed each month at other ALS and third party commercial laboratories worldwide.
The technical information about the Company’s drilling and exploration activities at Tasiast contained in this news release has been prepared under the supervision of and verified by Mr. Sylvain Guerard, an officer with the Company who is a “qualified person” within the meaning of National Instrument 43-101. The drill hole data base including collar, survey, geology and assay information were reviewed by the “qualified person” and the composite assay information independently calculated and verified for accuracy of reporting. Assay certificates for the information disclosed in this news release were verified by the Regional Director Exploration, Africa, but not by Mr. Guerard as the “qualified person”.
KINROSS GOLD CORPORATIONScotiabank Sales Desk Presentation
March 30, 2015
www.kinross.com49
KINROSS GOLD CORPORATION
25 York Street, 17th Floor │Toronto, ON │ M5J 2V5
www.kinross.com