Embed Size (px)
Citation preview

http://apm.sagepub.com/Applied Psychological Measurement
http://apm.sagepub.com/content/36/3/189The online version of this article can be found at:
DOI: 10.1177/0146621612439620
2012 36: 189Applied Psychological MeasurementSamuel Greiff, Sascha Wüstenberg and Joachim Funke
Dynamic Problem Solving : A New Assessment Perspective
Published by:
http://www.sagepublications.com
can be found at:Applied Psychological MeasurementAdditional services and information for
http://apm.sagepub.com/cgi/alertsEmail Alerts:
http://apm.sagepub.com/subscriptionsSubscriptions:
http://www.sagepub.com/journalsReprints.navReprints:
http://www.sagepub.com/journalsPermissions.navPermissions:
http://apm.sagepub.com/content/36/3/189.refs.htmlCitations:
What is This?
- Apr 25, 2012Version of Record >>
at Universitat Heidelberg on May 2, 2012apm.sagepub.comDownloaded from

Article
Applied Psychological Measurement36(3) 189–213
� The Author(s) 2012Reprints and permission:
sagepub.com/journalsPermissions.navDOI: 10.1177/0146621612439620
http://apm.sagepub.com
Dynamic Problem Solving: ANew Assessment Perspective
Samuel Greiff1, Sascha Wustenberg1, andJoachim Funke1
Abstract
This article addresses two unsolved measurement issues in dynamic problem solving (DPS)research: (a) unsystematic construction of DPS tests making a comparison of results obtained indifferent studies difficult and (b) use of time-intensive single tasks leading to severe reliabilityproblems. To solve these issues, the MicroDYN approach is presented, which combines (a) theformal framework of linear structural equation models as a systematic way to construct taskswith (b) multiple and independent tasks to increase reliability. Results indicated that the assumedmeasurement model that comprised three dimensions, information retrieval, model building, andforecasting, fitted the data well (n = 114 students) and could be replicated in another sample (n =140), showing excellent reliability estimates for all dimensions. Predictive validity of schoolgrades was excellent for model building but nonexistent for the other two MicroDYN dimensionsand for an additional measure of DPS. Implications are discussed.
Keywords
dynamic problem solving, complex problem solving, psychometrics, MicroDYN, finite state auto-maton, dynamic linear equations, measurement
On virtually a daily basis, the electronic market is overstocked with new technical devices such
as mobile phones, offering supposedly much-needed and more convenient applications. At the
same time, their handling might be different from previous devices. You—as a user—have to
find out how to switch off the keyboard lock, how to toggle between different menus, or how to
surf the Internet with such a new device. In the 21st century, it is taken for granted that anybody
can handle unfamiliar technologies and use them to master daily life. One has to get along with
technical artifacts at work (e.g., handling new computer systems), while traveling (e.g., buying
tickets from a ticket vending machine), or at home (e.g., regulating an air conditioner). These
skills display a newly arisen demand almost unknown to people living 30 years ago but neces-
sary in today’s world.
Theoretical Background
In psychology, dealing with such unfamiliar systems or situations is subsumed within the con-
struct of problem solving. Problem solving in general is defined as cognitive processing directed
1University of Heidelberg, Germany
Corresponding author:
Samuel Greiff, University of Heidelberg, Hauptstraße 47-51, Room 132-A, Heidelberg 69117, Germany
Email: [email protected]
at Universitat Heidelberg on May 2, 2012apm.sagepub.comDownloaded from
at transforming a given situation into a goal situation when no obvious method of solution is
available (Mayer & Wittrock, 2006). However, problems may differ in what is needed to bridge
this gap. For instance, Funke (2001) distinguished dynamic problems and static problems.
Whereas in static problems, all information necessary to solve the problem is available at the
outset, in dynamic problems, a problem solver has to gather information by directly interacting
with the problem before solving it. Depending on the underlying theoretical understanding, defi-
nitions of problem solving in general and dynamic problem solving (DPS) in particular vary
greatly (Funke, 2003). The authors focus on the definition of Buchner (1995), who emphasized
the dynamic aspect of users’ interactions with a problem as an essential part of DPS:
Complex [i.e., dynamic] problem solving is the successful interaction with task environments that are
dynamic (i.e., change as a function of user’s intervention and/or as a function of time) and in which
some, if not all, of the environment’s regularities can only be revealed by successful exploration and
integration of the information gained in that process.
This definition can be applied to real-world problem situations such as the handling of a new
mobile phone mentioned above: A successful interaction with the task environment (i.e., the
mobile phone) is possible only if the environment regularities (i.e., the connections between dif-
ferent menus) can be revealed by successful exploration (i.e., pressing buttons to toggle between
menus) and integration of the information (i.e., creating a mental representation of the menu
structure). While doing so, one has to interact with the mobile phone that dynamically changes
its state due to the inputs given. Because of these dynamic interactions between problem solver
and problem task (i.e., not a single decision but a series of decisions dependent on each other
and dependent on time), this type of problem-solving process is in line with Buchner’s (1995)
definition and is referred to as dynamic problem solving.
In fact, DPS is considered a core skill and is encountered almost anywhere in daily life
(Jonassen, Engle, Cheng, & Salas, 2007). It should predict germane performance outcomes such
as school achievement or professional success. For constructs of comparable relevance (e.g.,
intelligence), scientifically accepted measurement devices have been constructed and validated
thoroughly (McGrew, 2009). Therefore, this could be expected for DPS as well. Surprisingly
enough, no adequate measurement device has yet been developed and validated (Greiff &
Funke, 2009; Kluge, 2008). The authors state that this lack of existing measurement devices is
due to two major shortcomings: In the assessment of DPS, researchers have (a) not made sys-
tematic use of formal frameworks to produce comparable problem-solving tasks (Funke, 2001)
and (b) used measures based on a single problem-solving task (Greiff, 2012). As is outlined, (a)
tasks systematically based on formal frameworks allow comparing results between different
studies and (b) using multiple tasks considerably enhances reliability of DPS measures. The
authors conceptually present MicroDYN, an assessment approach combining (a) and (b), and
provide empirical evidence of its benefit in assessing DPS.
Formal Frameworks
Over the last 30 years, experimental research has produced a variety of findings on DPS largely
by using measures based on tasks constructed unsystematically and ad hoc. These tasks are often
composed of a large number of elements, time-delayed effects, nonlinear relations, and complex
structures. For instance, Dorner (1980, 1986) showed that in dealing with complex problem
situations such as the problem-solving task Lohhausen, persons tended to produce intellectual
emergency reactions. That is, problem solvers acted on a reduced intellectual capacity produc-
ing fast and nondeliberate actions and failed to test their hypotheses. However, from a
190 Applied Psychological Measurement 36(3)
at Universitat Heidelberg on May 2, 2012apm.sagepub.comDownloaded from

psychometric perspective, Funke (2001) criticized the unsystematic construction of these mea-
sures (e.g., in Lohhausen; Dorner, 1986) because they varied considerably in their underlying
system structure rendering it impossible to compare empirical results of different studies. Thus,
Funke suggested constructing tasks based on formal frameworks to allow a systematic descrip-
tion of a task’s structure enabling researchers to construct similar tasks as well as to compare
problem solvers’ performance across different studies.
Funke (2001) introduced the two formal frameworks of linear structural equations (LSEs)
and finite state automata (FSA). These frameworks were widely received and contributed
greatly to the development of many well-established DPS tasks. The majority of these tasks is
based on LSE systems and consists of quantitative connections between elements of a system,
labeled as input and output variables. That is, increasing an input variable might in turn decrease
or increase one or more output variables (e.g., ColorSIM, Kluge, 2008; MultiFlux, Kroner,
Plass, & Leutner, 2005). Some other tasks are based on FSA (e.g., Space Shuttle, Klieme,
Funke, Leutner, Reimann, & Wirth, 2001) and are composed of a number of states that differ in
their quality. That is, changing the state of one element (e.g., by pressing a button on a mobile
phone) might in turn change the state of another element or of the entire device (e.g., the direc-
tory is opened). In fact, any dynamic task can be formally described by either LSE, FSA, or a
combination of both, independent of the semantics it is embedded into.
In the context of LSE systems (see Figure 1), input variables (in Figure 1: X1, X2, X3) influ-
ence output variables (in Figure 1: Y1, Y2, Y3) where only the former can be actively manipu-
lated by the problem solver (Greiff & Funke, 2010). However, output variables may also be
related to each other, labeled side effect (in Figure 1: Y2 to Y3). An output variable that is
related to itself with a weight different to 1 is labeled eigendynamic (first-order autoregressive
process; in Figure 1: Y1 to Y1). An eigendynamic with a weight smaller than 1 describes a
shrinkage effect, whereas an eigendynamic with a weight larger than 1 describes a growth
effect. Relations from input to output variables are labeled direct effects (e.g., relations from Xn
to Yn), whereas relations between output variables (i.e., side effects, eigendynamics) are labeled
indirect effects.
Any LSE system is fully described by linear equations. The number of equations necessary
is equal to the number of output variables, which are denoted by a Y, while input variables are
denoted by an X. For the particular example in Figure 1, Equations 1 to 3 are needed:
Y1 t + 1ð Þ= a13X1 tð Þ + a23Y1 tð Þ, ð1Þ
Y2 t + 1ð Þ= a33X2 tð Þ + Y2 tð Þ, ð2Þ
Y3 t + 1ð Þ= a43X2 tð Þ+ a53X3 tð Þ+ a63Y2 tð Þ; ð3Þ
where t = discrete time steps, ai = arbitrary path coefficients, ai 6¼ 0, and a2 6¼ 1.
When using LSE systems, three different dimensions of DPS can be measured that are related
to Dorner’s (1986) theory of operational intelligence. According to Dorner, a successful prob-
lem solver should be able to (1) collect information (i.e., dimension of information retrieval),
(2) integrate and structure information (i.e., model building), and (3) make prognoses (i.e., fore-
casting). Within LSE systems, these three aspects of problem-solving ability are allocated to
three different phases (compare Kroner et al., 2005). First, (1) participants have some time to
explore the system. At this stage, only input and output variables are presented to participants
and the relations between them as displayed in Figure 1 are not visible. While exploring, partici-
pants have to use adequate strategies to derive information about the system structure. This pro-
cess of using strategies assesses the ability of (1) information retrieval. Either simultaneously or
subsequently, (2) participants are instructed to identify the relations between variables based on
Greiff et al. 191
at Universitat Heidelberg on May 2, 2012apm.sagepub.comDownloaded from

their observations. This is done either by drawing the assumed interconnections between vari-
ables into a model (e.g., Buhner, Kroner, & Ziegler, 2008) or by asking questions about the
underlying system’s structure (e.g., Kluge, 2008; Kroner et al., 2005). Thereby, (2) model build-
ing is assessed. In a final stage, (3) participants are asked to achieve given target values in the
output variables by entering correct values into the input variables within a given number of
steps, indicating performance in (3) forecasting.
Even though the overarching procedure and the specified design principles inherent in the
LSE formalism are considered essential in DPS research, one of its major advantages has
been overlooked until now: LSE systems allow for the employment of a sufficient number of
comparable tasks presented successively as a test composed of several tasks. From a psycho-
metric point of view, having independent tasks subsumed as a test is a necessary prerequisite
of a reliable and valid assessment. However, problem-solving research has yet failed to do so
because only single tasks have been used (e.g., MultiFlux, Kroner et al., 2005). Within these
single tasks, just one performance indicator can be derived, which informs about how appro-
priate this task was solved (e.g., in a dichotomous scoring, task solved or not). If examinees’
DPS score is based on no more than one task, only little information about their ability is
gained. Consequently, this one-task testing is likely to reduce reliability. In contrast, using
several independent tasks allows the reliable measurement of DPS as sufficient information
about examinees’ ability is gathered.
Multiple Tasks
Kluge (2008) was among the first who administered more than one task with different underly-
ing structures to participants. Although her study was based on an experimental between-subject
Figure 1. Example of the structure of a typical MicroDYN system displaying three input (X1, X2, X3)and three output (Y1, Y2, Y3) variables
192 Applied Psychological Measurement 36(3)
at Universitat Heidelberg on May 2, 2012apm.sagepub.comDownloaded from

design and not intended to measure individual DPS performance with a psychometric test, it
emphasized the importance of using tasks of varying difficulty when evaluating performance in
DPS. More specifically, Kluge used three different versions of the LSE task ColorSIM either
with low, medium, or high difficulty to allow for a direct check of the relation between partici-
pants’ individual DPS performances and task difficulty. Difficulty was varied by changing the
number of relations between input and output variables. As expected, participants’ performance
in ColorSIM, as well as the correlation between DPS performance and general mental ability
decreased with higher task difficulty (easy, r = .45; medium, r = .37; difficult, r = .30). Kluge
concluded that developers of DPS tasks should carefully investigate difficulty when studying
predictive validity:
But studying the predictive validity of MWs [i.e., microworlds, a synonym for DPS tasks], for example,
will not prove informative until there is careful investigation of such factors as difficulty, which con-
founds performance and distorts individual scores. (p. 178)
By this, she rightly emphasized the importance of investigating difficulty. However, the con-
clusion about difficulty confounding performance does not seem appropriate. The high predic-
tive validity in the easy condition is likely to be due to the fact that this version of ColorSIM
was on average targeted best at participants’ competency levels. That is, the correlation between
test performance and general mental ability probably decreased with higher task difficulty
because variance of participants’ problem-solving performance was restricted in the more diffi-
cult tasks (i.e., a majority of participants performed low). Does this mean that only tasks with
appropriate difficulty should be used to assess DPS? No, it does not. Confronting examinees
with tasks ranging from easy to difficult is a principle at the very heart of testing in psychology,
as it allows them to display their individual level of performance (Embretson & Reise, 2000).
Therefore, the authors conclude that a valid and fair test of DPS requires multiple tasks with a
broad range of difficulty allowing each participant to display his or her individual level of per-
formance. This also enhances the diagnostic information about participants’ ability, which leads
to an increased reliability of the measures used. Thus, in addition to the prerequisite introduced
by Funke (2001) of (a) using tasks based on a formal framework to guarantee comparability,
the authors add a second prerequisite of (b) using multiple, independent tasks of varying diffi-
culty targeted at examinees’ DPS ability to increase reliability.
The MicroDYN Approach
The MicroDYN approach incorporates both aspects by using multiple tasks that are embedded
in the formal framework of LSE systems to assess individual DPS performance in a sound man-
ner. In doing so, it overcomes the fundamental psychometric shortcomings of (a) constructing
tasks unsystematically and (b) using only single tasks to assess DPS ability. The concept of pre-
senting only single tasks was partially motivated by the implicit idea that time on task had to be
sufficiently long when dealing with complex situations. For instance, ColorSIM, MultiFlux, and
Space Shuttle all lasted between 30 and 60 min, which clearly limited the number of employable
tasks to one with regard to testing time. In the MicroDYN approach, the presumption that DPS
requires a substantial amount of testing time for each task was abandoned to present a sufficient
number of less time-consuming tasks lasting only 5 min each. The principle of using several
tasks with a short time on task is ecologically valid because successful interaction with unknown
task environments in real life seldom lasts longer than a few minutes (e.g., buying a ticket at a
new vending machine).
Greiff et al. 193
at Universitat Heidelberg on May 2, 2012apm.sagepub.comDownloaded from

Similar to other tasks within the LSE framework (e.g., ColorSIM, MultiFlux), MicroDYN
tasks are embedded into fictitious semantics (e.g., imaginary animals that have to be fed with
different sort of food) and variables are labeled without deep semantic meaning (e.g., a chemical
laboratory with Substances A, B, C, D related to Elements W, X, Y, Z; see Figure 2) yielding
the advantage of largely avoiding the activation of prior knowledge. Thus, only knowledge that
participants acquire during test employment is relevant, whereas specific knowledge gathered
beforehand is negligible and does not influence performance supporting the domain-unspecific
nature of the construct measured in the MicroDYN approach.
A specific MicroDYN test within the MicroDYN approach is composed of a set of multiple
tasks based on the LSE formalism without deep semantic meaning. Such a typical MicroDYN
test would include approximately 10 independent tasks, each lasting about 5 min summing to an
overall testing time of approximately 1 hour. Different exemplars of MicroDYN tests are easily
constructed by varying task difficulty and/or semantic embedding of the tasks.
As an example, the authors describe the specific procedure of a task within the MicroDYN
approach by a virtual chemical laboratory as shown in Figure 2, although MicroDYN tasks can
include a broad variety of different semantic embeddings (e.g., feeding pets, advertising prod-
ucts, etc.). The chemical laboratory cover story was also part of the study reported in the present
article. There, different kinds of substances (input variables labeled A, B, C, D) influence four
substances (output variables labeled W, X, Y, Z) in a complex manner invisible to the problem
solver.
The procedure within a MicroDYN task is the same that is generally applied in LSE systems
(compare Kroner et al., 2005). Thus, three dimensions of DPS are directly connected to three
phases: Participants have to (a) apply adequate strategies to explore an unknown task (Phase 1:
information retrieval), (b) generate knowledge about the relations between input and output
variables (Phase 2: model building), and (c) apply this knowledge to reach target values (Phase
3: forecasting).
During Phase 1, information retrieval, participants explore the laboratory and the connec-
tions between variables. Relations between input and output variables are to be discovered by
manipulating input variables on the left side of the display in Figure 2 and by observing the
resulting changes on the right side. The laboratory works in discrete steps and participants can
forward to the next step by pressing the ‘‘next step’’ button. In addition, a timer in the upper
right corner displays the time remaining for exploration. By pressing the ‘‘reset’’ or ‘‘undo’’
buttons, participants can either transfer the laboratory into its original state or undo their last
manipulation. In addition, the current step and the assignment (‘‘Explore the laboratory’’ in
Figure 2) are displayed.
Phase 2, model building, takes place simultaneously to Phase 1. Participants are instructed to
generate hypotheses about the relations between substances and elements and to represent their
conclusions in a causal diagram (Funke, 2001), which is depicted in the lower right part of the
screen (Figure 2). They do so by first clicking on the assumed origin of an effect (e.g.,
Substance A) and then on its target (e.g., Element X). Once drawn, a path is easily deleted by
double clicking on it. In Phase 1 and 2, participants are told explicitly that they are not required
to achieve certain values at this stage but that they will be asked to do so later.
During Phase 3, forecasting, participants have to achieve given target values within a maxi-
mum of four control steps. Target values are displayed in brackets next to each output variable.
The limitation of only four control steps is introduced to allow for dynamic effects (i.e., side
effects and eigendynamics) to unfold in a way that participants have to counteract them and to
maintain standardized control over testing, which is easily disturbed by system dynamics. In
this phase, participants are faced with the task to transfer declarative and explicit knowledge
into procedural actions and, at the same time, to respond to dynamic changes of the system. By
194 Applied Psychological Measurement 36(3)
at Universitat Heidelberg on May 2, 2012apm.sagepub.comDownloaded from

evaluating participants’ performance, the ability to use knowledge, to plan actions, and to react
to dynamic changes is assessed.
Research Questions
The MicroDYN approach is based (a) on the formal framework of LSE systems and additionally
incorporates (b) the use of multiple, independent tasks to increase reliability. Combining aspects
(a) and (b) enables us to test the internal structure of MicroDYN and its convergent and predic-
tive validity empirically.
To do so, the authors report results of two studies. The main study deals with both research
questions, internal structure and construct validity, and uses a specific set of tasks, the
MicroDYN test Laboratory, in which all tasks used were semantically embedded in the context
of a chemical laboratory (Figure 2). Study 2 is used to cross-validate the results on the internal
structure from the main study and to show that different exemplars of MicroDYN tests con-
structed within the overarching MicroDYN approach yield comparable results. Thus, in
Study 2, the MicroDYN test Aquarium is used, which has a different semantic embedding (i.e.,
aquarium instead of laboratory) and different LSEs (see the ‘Method’ section and Appendix),
Figure 2. Screenshot of a MicroDYN taskNote: Input (labeled A, B, C, D) and output (labeled W, X, Y, Z) variables are shown in the upper left and upper right
areas, respectively. The model drawn by participants is located in the lower right area and a history displaying past
exploration steps in the lower left area. The screenshot displays Phase 1 (exploration).
Greiff et al. 195
at Universitat Heidelberg on May 2, 2012apm.sagepub.comDownloaded from

thereby varying both semantic embedding and task difficulty. Showing that MicroDYN tests
based on different semantics and system structures were psychometrically comparable empha-
sizes the variety of the MicroDYN approach. Study 2 is only shortly outlined, whereas proce-
dure and results of the main study are presented in detail.
With regard to the internal structure of the MicroDYN test, the authors suggest that a multidi-
mensional model with the theoretically derived dimensions information retrieval, model build-
ing, and forecasting fits the data best. In a second model, the authors test a more parsimonious
g-factor model, which implies that a single latent variable is sufficient to account for the covar-
iation between all indicators. To explore the second research question, construct validity, latent
connections to Space Shuttle, (a DPS task based on FSA), and to school grades are evaluated.
The authors are not aware of any other attempt to test scalability of DPS and its validity on a
latent level within the approach of confirmatory factor analysis (CFA).
Method
Sample
Testing took place at the University of Heidelberg. Data of 114 German university students
majoring in psychology (87 female, 27 male) were available for analysis.1 Their mean age was
22.36 (SD = 4.72). Students were mostly in their 2nd year of study and received partial course
credit for participation and an additional 5 e (approximately US$7) when they worked conscien-
tious. Missing data occurred only due to software problems (e.g., data were not saved properly)
and were missing completely at random (MCAR).
Design
Test execution was divided into two sessions, each lasting approximately 90 min. Time
between the sessions varied between 2 and 5 days. At the first session, participants worked on
MicroDYN and provided demographic data. At the second session, participants processed the
DPS measure Space Shuttle and provided school grades in self-report. In addition, participants
answered several questionnaires (e.g., on metacognition and personality) that are not discussed
in this article.
Material
Besides demographic data and school grades, data on two DPS measures were collected: on the
MicroDYN test Laboratory within the MicroDYN approach and on the FSA Space Shuttle to
validate the former.
MicroDYN test laboratory. Claiming to measure individual DPS ability, the MicroDYN test
Laboratory was administered entirely computer based, and all participants’ actions were auto-
matically logged. It was composed of 11 independent tasks and 2 trial tasks. Each of these tasks
was embedded in the context of a virtual chemical laboratory (see Figure 2). This background
was chosen to provide a realistic and motivating setup on one hand and to guarantee only mini-
mal activation of prior knowledge on the other hand. To provide tasks with a broad range of dif-
ficulty, the underlying structure was changed with regard to the number of connections between
substances and elements (e.g., 3, 4, or 5), the type of interconnection (e.g., indirect effects are
more difficult than direct effects; Funke, 2001), and their path strength (e.g., .2 or .5). The spe-
cific set of tasks and their underlying equations are reported in the appendix. The procedure for
each task was identical: 3.5 min of unguided exploration (information retrieval) with
196 Applied Psychological Measurement 36(3)
at Universitat Heidelberg on May 2, 2012apm.sagepub.comDownloaded from

simultaneous model drawing (model building) was followed by 1.5 min of controlling (forecast-
ing), in which participants applied their acquired knowledge (i.e., their structural model). The
overall testing time took approximately 70 min for 11 tasks each lasting 5 min and for about
12 min of instruction. The test started with elaborate instructions on how to handle the pro-
gram (i.e., how to operate the surface) and on how the three phases were separated to famil-
iarize participants with the new task format. During these instructions, participants were
walked through two trial laboratory tasks in which they encountered all relations between
substances and elements they had to deal with during testing. At no point during the instruc-
tions any information was given on how to best explore, understand, or control the tasks. The
trial tasks were not included in the statistical analyses.
In summary, the MicroDYN test Laboratory was composed of 11 different tasks with 33 items
yielding 33 performance indicators: 11 on information retrieval, model building, and forecasting,
respectively. The three phases were repeated for all 11 tasks in exactly the same way. Performance
in one task was independent of performance in any other task.
Space Shuttle. The computer simulation Space Shuttle (Wirth & Klieme, 2003) required par-
ticipants to understand and control two subsystems that were constructed analogously: a space
shuttle and a space vessel. Space Shuttle was used for the first time in the German national
extension of PISA 2000 to capture students’ DPS abilities and therefore served as a reference
point for validating the MicroDYN approach against a measurement device already used in
large-scale assessments. Space Shuttle started with 15 min of unguided exploration followed by
16 knowledge items (equivalent of model building) and 22 control items (equivalent of fore-
casting), summing to approximately 45 min of testing time. The general limitations of measur-
ing DPS with single tasks outlined earlier also apply to Space Shuttle.
School grades. Students were asked to report their final mathematics and German grades from
high school. These two grades were used as indicators for a latent school grade factor. Other
grades were not available for study purposes. Trost (2000) showed that the correlation between
self-reported and actual school grades is close to 1 for German participants.
Demographic data. Demographic variables (e.g., gender, age, year of study) were collected
for control purposes only. There was no significant impact of these on any of the performance
measures.
Dependent Variables and ScoringMicroDYN test laboratory. Valid performance indicators for each of the three dimensions,
information retrieval, model building, and forecasting, had to be derived. DPS research has
mainly used continuous indicators (e.g., Funke, 1985; Kluge, 2008) trying to disentangle per-
formance attributable to participants’ competency, to system characteristics, or to guessing. For
instance, Funke (1985) decided to weight the number of relations, which were correctly or
incorrectly identified by participants, in a way that punished guessing. Similarly, Kluge (2008)
took in her assessment of forecasting into account that in some tasks, even random actions by
the participant may result in drawing closer to given target values and assigned weighted cor-
rections to performance scores considering that in some systems, random inputs might be more
helpful than in others. In summary, all these indicators include weights computed by specific
algorithms, which influence the derived performance indicators to an unknown extent. Thus,
the authors decided to choose a conservative approach by using clearly defined and ordinal-
scaled categories, although results remained largely unchanged when the authors used weighted
indicators such as the ones proposed by Funke or Kluge. Differences were only observed as
slight reductions in factor loadings and in reliability estimates, suggesting an increase in error
variance in comparison to the ordinal scoring chosen in this study. Scoring was done
Greiff et al. 197
at Universitat Heidelberg on May 2, 2012apm.sagepub.comDownloaded from
automatically by computer-based algorithms and nonambiguous, as scores for the three dimen-
sions were directly computed from the actions participants provided while interacting with the
tasks.
1. (1) Use of strategy, information retrieval, was scored based on how systematically parti-
cipants explored a system. To retrieve complete information on a system and to derive
correct knowledge about it, participants had to make use of the VOTAT strategy (vary
one thing at a time; Vollmeyer & Rheinberg, 1999). VOTAT allows for the direct obser-
vation of isolated effects on output variables by manipulating only one input variable at a
time (Figure 2). Participants were assumed to have mastered VOTAT when they applied
it to each input variable during exploration. In addition to VOTAT, participants had to
apply idle rounds, in which they set all input variables to 0 to discover dynamics inherent
in the system (i.e., side effects and eigendynamics). If participants left this active nonin-
tervention out, effects due to their own manipulations could not be separated from effects
due to system dynamics. These steps with all input variables set to 0 were labeled idle
rounds. If participants used VOTAT consistently and applied at least one idle round, they
were scored in the highest category (i.e., Category 2). Applying VOTAT consistently
without using idle rounds was scored in the medium category (i.e., Category 1) and no or
an inconsistent use of VOTAT was specified in the lowest category (i.e., Category 0).
An example of such an inefficient exploration strategy would be to manipulate two or
three input variables simultaneously. Then, changes in the output variables could not be
attributed to specific input variables. Both (2) model building and (3) forecasting were
scored dichotomously as right (i.e., Category 1) or wrong (i.e., Category 0). A full score
in model building (i.e., Category 1) was given if participants included all existing rela-
tions and correct weights between variables into their causal model but did not include
any nonexistent relations or incorrect weights. A full score (i.e., Category 1) in forecast-
ing was given if target values of all output variables were reached after no more than four
steps. In summary, each task was scored with respect to its three phases, yielding 33
items overall within the 11 tasks of the MicroDYN test Laboratory.
Space Shuttle. All 16 knowledge items and 22 control items were scored dichotomously right
or wrong as suggested in the manual.
School grades. School grades ranged from 1 (excellent) to 6 (poor) as usual in German
schools. However, when calculating relations to other variables, grades were reversed so that
higher numerical values reflected better performance.
Hypotheses
This study is the first attempt to scale a DPS test based on the MicroDYN approach (i.e., the
MicroDYN test Laboratory), rendering hypotheses and results essentially preliminary.
Hypothesis 1 (internal structure): (a) The three theoretically derived dimensions informa-
tion retrieval, model building, and forecasting are shown empirically. The data will fit a
model with three dimensions. Each dimension is measured at least with acceptable relia-
bility. (b) The data will fit the three-dimensional model significantly better than a one-
dimensional g-factor model.
Furthermore, the authors expect that Hypotheses 1a and 1b are replicated in a second sample
when using the MicroDYN exemplar Aquarium, which is used in cross-validation Study 2.
198 Applied Psychological Measurement 36(3)
at Universitat Heidelberg on May 2, 2012apm.sagepub.comDownloaded from

Hypothesis 2 (construct validity): (a) Model building predicts knowledge in Space Shuttle.
(b) Forecasting predicts control in Space Shuttle. (c) The three dimensions predict school
grades. The correlation is highest for model building, owing to its affinity to logical think-
ing and high-level reasoning. (d) On an overall level, the three dimensions predict school
grades significantly better than the two Space Shuttle dimensions.
Statistical Analysis
The authors analyzed data by using the structural equation modeling (SEM; Bollen, 1989)
approach. Compared with other methods such as cluster analysis or multidimensional scal-
ing, which are mostly used to discover similarity or proximity of a given number of stimuli
(Dunn-Rankin, Knezek, Wallace, & Zhang, 2004), in SEM, researchers can posit relations
among specific latent variables, for instance, by testing the usefulness of three theoretically
derived dimensions of DPS compared with alternative models with fewer dimensions
(Raykov & Marcoulides, 2006). Within SEM, the authors used CFA to test the assumed
three-dimensional internal structure, and they used latent structural regression models to
investigate its construct validity. Whereas in CFA, it is only assumed that the dimensions
are correlated, in structural regression models, hypothesized relations among constructs (i.e.,
latent regressions between the MicroDYN test Laboratory, Space Shuttle, and school grades,
respectively) can be postulated and tested (Raykov & Marcoulides, 2006). According to
Daniel (2000), CFA is one of the most powerful tools for exploring the ability dimensions
underlying cognitive tests.
The variables within all analyses were ordinal item scores based on independent tasks. That
is, in each task, three ordinal scores were derived. The authors applied the weighted least squares
means and variance adjusted (WLSMV) estimator (L. Muthen & Muthen, 2007) that uses poly-
choric correlations between manifest ordinal variables to estimate parameters of latent variables.
WLSMV, the method of choice for ordinal data (Beauducel & Herzberg, 2005; B. Muthen,
1993), is a robust weighted least squares estimator using a diagonal weight matrix that does not
maximize the likelihood function (L. Muthen & Muthen, 2007). Thus, only non-likelihood-based
fit statistics, such as the Comparative Fit Index (CFI), the Tucker Lewis Index (TLI), and the
Root Mean Square Error of Approximation (RMSEA), were available, whereas the likelihood-
based ones, such as the Akaike Information Criterion (AIC) and the Bayesian Information
Criterion (BIC) were not. SEM calculations were conducted in MPlus 5.0 (L. Muthen & Muthen,
2007).
Results
Descriptive Statistics
Frequencies for all three dimensions are summarized in Table 1. Obviously, item difficulties
varied considerably for model building and forecasting even in this highly capable sample.
Whereas some systems were easy to understand and control, systems incorporating indirect
effects were much more difficult. Interestingly, easy to understand tasks were not necessarily
easy to control and vice versa. Information retrieval, which reflects the use of appropriate stra-
tegies, appeared to be the least challenging competency. More than 95% of the students tested
used the VOTAT strategy systematically, and the vast majority considered idle rounds as impor-
tant aspect of exploring an unknown system. Differences in mean levels and variation between
the dimensions are shown in the task statistics (Table 2) and suggest that model building and
Greiff et al. 199
at Universitat Heidelberg on May 2, 2012apm.sagepub.comDownloaded from

forecasting performance depended strongly on system structure (SD = 0.21 and 0.27) whereas
information retrieval was constant throughout testing (SD = 0.05).
Internal Structure
Hypothesis 1a: The three-dimensional model with information retrieval, model building,
and forecasting is depicted in Figure 3. Each of these dimensions was measured by
11 items. The residuals of the three items within a task were not allowed to correlate.
The model showed a good fit (Table 3) according to the criteria by Hu and Bentler
(1999): CFI and TLI both exceeded .95 and RMSEA was just within the recom-
mended .06 limit (Hu & Bentler, 1995) not considering that RMSEA is too conserva-
tive in small samples (Yu, 2002).
When evaluating model fit in SEM, contrary to conventional inference testing, beta error level
is relevant, and thus, power needs to be evaluated carefully (Ullman, 2007). MacCallum,
Browne, and Sugawara (1996) derived a practical method for RMSEA power calculation and
Table 1. Relative Frequencies for the Dimensions Model Building, Forecasting, and Information Retrieval(n = 114)
Dimension 1:Model building
Dimension 2:Forecasting
Dimension 3: Informationretrieval
0 False 1 Correct 0 False 1 Correct 0 No VOTAT 1 VOTAT 2 VOTAT & 0
Task 1 .33 .67 .31 .69 .04 .22 .74Task 2 .58 .21 .44 .56 .04 .17 .79Task 3 .69 .31 .94 .06 .03 .13 .84Task 4 .93 .07 .95 .05 .01 .14 .85Task 5 .87 .13 .66 .34 .02 .20 .78Task 6 .46 .54 .38 .62 .03 .21 .76Task 7 .61 .39 .36 .64 .03 .21 .76Task 8 .69 .31 .78 .22 .01 .20 .79Task 9 .84 .16 .44 .56 .02 .16 .82Task 10 .45 .55 .96 .04 .01 .14 .85Task 11 .41 .59 .36 .64 .01 .15 .84
Note: VOTAT = vary one thing at a time. VOTAT & 0 describes consistent use of the optimal VOTAT strategy and the
additional use of idle rounds necessary to detect indirect effects.
Table 2. Item Statistics and Reliability Estimates for Model Building, Forecasting, and InformationRetrieval in the Main Study (n = 114)
Item statistics Reliability estimates
M SD a
Model building 0.36 .21 .85Forecasting 0.40 .27 .95Information retrieval 1.78 .05 .85
Note: a = Cronbach’s a; range for model building and forecasting: 0 to 1, for information retrieval: 0 to 2.
200 Applied Psychological Measurement 36(3)
at Universitat Heidelberg on May 2, 2012apm.sagepub.comDownloaded from

suggested testing the empirical RMSEA against prescribed values. To evaluate power, the
authors tested the empirical RMSEAs against poor fit (i.e., RMSEA � .10) and exact fit
(RMSEA = .00). Calculated power is displayed in Table 4. The power of rejecting a poor model
fit was marginally sufficient (1 2 b = .67), whereas an exact fit could not be rejected (1 2 b =
.35) for the three-dimensional model. These calculations did not take into account that RMSEA
might be too conservative in this analysis (Yu, 2002). Procedures for other fit indices are not
available (MacCallum et al., 1996).
Correlations between the dimensions (Figure 3) were strong and did not differ from each
other (p . .05). Their size was comparable with correlations of first-order factors for other con-
structs and allowed an empirical distinction between dimensions even though they shared a large
amount of variance. Factor loadings and communalities h2 are displayed in more detail in Table 5.
Generally, communalities were above the recommended level of .40 (Hair, Anderson, Tatham, &
Black, 1998). Only Task 10 showed a low factor loading on forecasting, most likely due to its high
difficulty and its skewed distribution. Cronbach’s a is displayed in Table 2 and showed excellent
reliability estimates for every dimension. Thus, Hypothesis 1a was supported.
Hypothesis 1b: The authors tested a model including a g-factor with one general problem-
solving ability factor (Table 3). Power calculations (Table 4) showed no separation from a
poor fit and a secure rejection of an exact fit for RMSEA. A x2-difference test adjusted for
the WLSMV estimator (L. Muthen & Muthen, 2007) indicated that the g-factor model
fitted the data significantly worse than the three-dimensional model (x2 = 33.40; df = 2;
p \ .0001). In addition, communalities were lower for almost all items than in the three-
dimensional model. Generally, modeling the MicroDYN test Laboratory on three dimen-
sions appeared much more appropriate than modeling it on one dimension. Thus,
Hypothesis 1b was supported. However, sample size was small, making results on internal
structure preliminary. Therefore, results were cross-validated using the MicroDYN test
Aquarium, including a different set of tasks within the MicroDYN approach in Study 2,
which is reported in the following sections after results on Hypothesis 2 from the main
study.
Prior Analysis to Construct Validity: Measurement Model of Space Shuttle and SchoolGrades
Space Shuttle. Contrary to the PISA results (Klieme et al., 2001), Space Shuttle initially
showed no two-factor solution (knowledge and control) in CFA: Model fit and factor loadings
were unacceptable. Thus, items showing either low factor loadings (rif \ .30) or cross loadings
(rif . .50 on both factors) were successively excluded from further analyses. The remaining
eight knowledge (M = 0.56; SD = 0.20) and eight control items (M = 0.77; SD = 0.16) showed
Table 3. Goodness of Fit Indices for Two Measurement Models and the Structural Model in the MainStudy (n = 114)
x2 df p x2/ df CFI TLI RMSEA
MicroDYN–3d 40.47 28 .06 1.45 .98 .99 .06MicroDYN–1d 55.40 28 \.001 1.98 .94 .95 .10Structural model 80.19 51 .001 1.57 .96 .97 .06
Note: df = degrees of freedom; CFI = Comparative Fit Index; TLI = Tucker Lewis Index; RMSEA = Root Mean Square
Error of Approximation; MicroDYN-3d = three-dimensional model; MicroDYN-1d = one-dimensional model. x2 and
df are estimated by weighted least squares means and variance..
Greiff et al. 201
at Universitat Heidelberg on May 2, 2012apm.sagepub.comDownloaded from

Figure 3. Internal structure of MicroDYN including intercorrelations and communalities (n = 114)Note: Standard error in brackets. Variances of the latent variables were set to 1.0. Residuals of the items within a task
(not depicted) were not allowed to correlate.
*p \ .05. **p \ .01.
Table 4. Power Calculations on Two Measurement Models and the Structural Model in the Main Study(n = 114)
RMSEAemp
H0: RMSEAemp vs.H1: RMSEA . .10
H0: RMSEA = .00 vs.H1: RMSEAemp
MicroDYN–3d .06 .67 .35MicroDYN–1d .10 .02 .92Structural model .06 .84 .59
Note: RMSEA = Root Mean Square Error of Approximation. In column 1, the empirically observed RMSEA is depicted
(index: emp). In column 2, the power (i.e., probability) to separate the model from a model with poor fit (i.e.,
RMSEA > .10) is depicted. In column 3, the power to separate the model from a model with perfect fit (i.e., RMSEA =
.00) is depicted.
202 Applied Psychological Measurement 36(3)
at Universitat Heidelberg on May 2, 2012apm.sagepub.comDownloaded from

marginally appropriate model fit (x2 = 38.21; df = 20; p = .01; CFI = .97; TLI = .97; RMSEA =
.09). Factor loadings and communalities are shown in Table 6. The correlation between the
latent factors was .70 (p \ .01). Cronbach’s a was .64 for knowledge and .68 for control.
School grades. Despite the highly selective sample, mathematics and German grades showed
considerable variation. The average grade was 1.79 (SD = 1.03) for mathematics and 1.58 (SD =
0.72) for German on a grade scale from 1 = excellent to 6 = poor. The factor loadings on a com-
mon factor were .81 for mathematics and .69 for German, respectively (both ps \ .01).
Construct Validity
Hypotheses on construct validity were evaluated within a structural model relating the
MicroDYN test Laboratory to Space Shuttle and school grades. The structural part of the model
without the observed variables is displayed in Figure 4 and showed a good fit (Table 3). In this
structural model, factor loadings of the observed variables changed only marginally (on the
Table 5. Factor Loadings and Communalities for Model Building, Forecasting, and Information Retrievalin the Main Study (n = 114)
Model building Forecasting Information retrieval
Factor loading h2 Factor loading h2 Factor loading h2
Task 1 .90 .81 .83 .69 .88 .77Task 2 .80 .64 .96 .91 .88 .77Task 3 .81 .66 .61 .37 .90 .81Task 4 .86 .74 .55 .30 .99 .97Tasks .80 .64 .54 .29 .90 .81Task 6 .82 .67 .82 .67 .76 .57Task 7 .75 .56 .94 .88 .92 .85Task 8 .72 .51 .67 .45 .89 .79Task 9 .90 .81 .69 .48 .91 .83Task 10 .82 .67 .27 .07 .91 .83Task 11 .85 .72 .78 .61 .94 .88
Note: All loadings are significant at p \ .01.
Table 6. Factor Loadings and Communalities for Knowledge and Control in Space Shuttle in the MainStudy (n = 114).
Knowledge Control
Space Shuttle Factor loading h2 Space Shuttle Factor loading h2
Item 1 .53 .28 Item 9 .88 .77Item 2 .66 .44 Item 10 .95 .90Item 3 .48 .23 Item 11 .78 .61Item 4 .70 .49 Item 12 .83 .69Item 5 .62 .38 Item 13 .92 .85Item 6 .80 .64 Item 14 .90 .81Item 7 .81 .66 Item 15 .95 .90Item 8 .73 .53 Item 16 .97 .94
Note: All loadings are significant at p \ .01.
Greiff et al. 203
at Universitat Heidelberg on May 2, 2012apm.sagepub.comDownloaded from

2nd decimal) compared with the measurement model within CFA (Table 3). The power to
detect misfit through RMSEA was sufficient (Table 4).
Hypothesis 2a: Model building significantly predicted knowledge in Space Shuttle (path
coefficient = .40; p \ .05). The relation was moderate and supported Hypothesis 2a.
Hypothesis 2b: Forecasting significantly predicted control in Space Shuttle (path coeffi-
cient = .39; p \ .05). The relation was moderate and supported Hypothesis 2b.
Hypothesis 2c: Model building significantly predicted school grades (path coefficient = .71;
p \ .01). This relation was strong whereas forecasting and information retrieval did not
predict school grades. To show the additional benefit in prediction when assessing three
dimensions in comparison with a general factor, the authors tested a model in which all
dimensions were subsumed under a second-order factor of DPS. This factor as well as the
residual of model building (i.e., aspects in model building not captured by the second-
order factor) predicted school grades. The path coefficient of the residual of model build-
ing (path coefficient = .29; p \ .05) was comparable with the path coefficient of the
second-order factor (path coefficient = .31; p \ .01) indicating that model building signif-
icantly contributed to the predictive validity of DPS beyond the second-order factor. Path
coefficients of the residuals of information retrieval and forecasting on school grades
were still nonsignificant. The global model fit in this model was acceptable (x2 = 63.97;
Figure 4. Structural model including MicroDYN, Space Shuttle, and school grades (n = 114)Note: Manifest variables are not depicted. Displayed path coefficients and intercorrelations are all statistically different
from zero. Variances of the latent variables were set to 1.0.
*p \ .05. **p \ .01.
204 Applied Psychological Measurement 36(3)
at Universitat Heidelberg on May 2, 2012apm.sagepub.comDownloaded from

df = 38; p = .005; CFI = .96; TLI = .97; RMSEA = .07). Hypothesis 2c was partially
supported.
Hypothesis 2d: In the overall model as well as in any bivariate model (i.e., school grades
and one predictor), only model building predicted school grades significantly. Space
Shuttle did not predict school grades and neither did the procedural dimensions forecast-
ing and information retrieval, supporting Hypothesis 2d. Thus, Hypothesis 2d was par-
tially supported.
In addition, forecasting predicted knowledge (path coefficient = .49; p \ .05) and informa-
tion retrieval predicted control in Space Shuttle (path coefficient = .68; p \ .01). Both relations
were not hypothesized beforehand.
Results on Hypothesis 2 did not exhibit any significant changes when the MicroDYN test
Laboratory was parceled to reduce the amount of estimated parameters. In this analysis, rela-
tions between variables and significance levels remained unchanged. The parceling procedure
was comparable with the one reported in Kroner et al. (2005) and the 11 items of each dimen-
sion were subsumed under three parcels. Two out of these three parcels contained four items,
whereas one parcel contained only three items. Parcels did not differ significantly in mean
difficulty.
Study 2: Replication of the Internal Structure With the MicroDYNTest Aquarium
The authors cross-validated the three-dimensional structure found in the main study in a second
sample to show that the MicroDYN approach neither depended on a specific semantic embed-
ding nor on specific task difficulties realized in a MicroDYN test but provided an overarching
measurement framework. Furthermore, by including this second study, the authors tried to
strengthen their results on internal structure, which were based on an arguably small sample
size (n = 114). The sample of the second study2 (n = 140) consisted of German university stu-
dents majoring in different fields with less restrictive selection procedures than in the main
sample, which majored largely in psychology involving highly competitive selection processes.
Therefore, the tasks used in the second sample were designed to be less difficult (e.g., tasks had
less relations between variables). In addition, as a different semantic embedding, the
MicroDYN test Aquarium was chosen. Within this specific test, fictitious fish food were used
as input variables, whereas different fictitious fish species were used as output variables.
Instructions, scoring, and test employment remained completely unaltered. The authors
expected that results on internal structure in this second study were comparable with the results
of the main study. In fact, also in Study 2, a three-dimensional model with the dimensions
information retrieval, model building, and forecasting showed a good fit (x2 = 86.47; df = 55;
p \ .001; CFI = .99; TLI = .99; RMSEA = .06). Cronbach’s a was .93 for information retrie-
val, .87 for model building, and .86 for forecasting, respectively. The scale intercorrelations in
the three-dimensional model were .62 (information retrieval with forecasting), .73 (information
retrieval with model building), and .88 (model building with forecasting; all ps \ .01). Power
calculations, factor loadings, and communalities were comparable with the ones reported for
the main sample and well within the range of satisfactory values. The fit for the three-
dimensional model was significantly better (x2 difference test: x2 = 48.37; df = 2; p \ .0001)
than the not acceptable fit of the one-dimensional model with a general first-order DPS factor
(x2 = 154.27; df = 52; p \ .001; CFI = .95; TLI = .95; RMSEA = .12). Thus, the three-
dimensional structure found in the MicroDYN test Laboratory was replicated in a second
Greiff et al. 205
at Universitat Heidelberg on May 2, 2012apm.sagepub.comDownloaded from

sample using the MicroDYN Test Aquarium, exhibiting comparable results and speaking well
for the MicroDYN approach.
Discussion
The authors criticized shortcomings of DPS research from a psychometric point of view and
claimed to overcome them by integrating (a) the LSE formalism (Funke, 2001) and (b) mul-
tiple tasks into the MicroDYN approach to test internal structure, reliability, and construct
validity. Essentially supporting their hypotheses, the assumed measurement model compris-
ing the three dimensions, information retrieval, model building, and forecasting, fit the data
well, whereas a one-dimensional model led to a significant deterioration in fit. This internal
structure was observed in the main sample of n = 114 and cross-validated in an additional
sample of n = 140 tested with a different test exemplar based on the MicroDYN approach.
Reliability estimates were excellent for all dimensions and in both samples. Thus, the
MicroDYN approach proved its value by showing comparable results in two studies that
included different MicroDYN tests based on different semantic covers and composed of
tasks with varying difficulty.
When relating the MicroDYN test Laboratory to Space Shuttle, a traditional DPS test,
latent correlations were substantial indicating convergent validity between the two measures
and supporting the concept of less time-consuming and independent tasks in the MicroDYN
approach. More specifically, the corresponding dimensions model building and knowledge
(Space Shuttle), as well as forecasting and control (Space Shuttle), were related to each
other. Although not hypothesized a priori, there was a significant prediction of control in
Space Shuttle by information retrieval. As information retrieval assesses the quality of input
strategies, it slightly resembles control items in Space Shuttle both requiring procedural
interventions into a dynamic system. Furthermore, forecasting predicted knowledge (Space
Shuttle). This might be due to the kind of knowledge items used in Space Shuttle. There, a
specific initial state and an intervention were given, and participants were asked to identify
the subsequent state. This could be considered a one-step control item similar to forecasting.
Apparently, distinguishing the concepts of knowledge and control in Space Shuttle was not
sufficiently explicit within the task. Regarding predictive validity of school performance as
another aspect of construct validity, the MicroDYN dimension model building was strongly
related to school grades, but there was no substantial prediction for the other MicroDYN
dimensions or for Space Shuttle as additional measure of DPS. The overall pattern indicated
that introducing multiple tasks indeed led to a gain in validity (likely mediated by higher
reliability), higher order cognitive reasoning, which is necessary for developing representa-
tions of a system (i.e., model building), reflected cognitive processes needed for successful
performance in school, and procedural aspects of cognitive capacity as measured in informa-
tion retrieval and forecasting were not mirrored in school grades.
Some other results were remarkable due to their practical implications. (a) Mean perfor-
mance on information retrieval (i.e., use of adequate strategies) was considerably higher than
mean performance on the two remaining dimensions. Even though excellent in exploring
unknown systems, transferring information into a correct model or into accurate control perfor-
mance proved to be considerably more difficult. This provides a starting point when fostering
DPS ability: Training efforts should aim both at how to generate information and at how to use
that information when deriving viable models. This is in line with Chen and Klahr (1999), who
trained participants in conducting experiments that allow for causal inferences (i.e., the VOTAT
strategy). They report that knowledge gathered during training was successfully transferred to
different contexts. That is, the experimental group performed better than the control group in
206 Applied Psychological Measurement 36(3)
at Universitat Heidelberg on May 2, 2012apm.sagepub.comDownloaded from

tasks comparable with the original one but also in generalizing the knowledge gained across
various tasks. Contrary to research on strategic learning (Vollmeyer & Rheinberg, 1999), in this
study, participants either applied VOTAT or did not. Changing strategies was almost nonexis-
tent. This is probably due to the graphical layout of MicroDYN tasks suggesting the use of
VOTAT and due to the highly capable samples. This interpretation can be related to (b) the
slightly lower correlations between dimensions in the second sample: The higher the general
cognitive ability of a population, the better the insights gathered during one phase are trans-
ferred to another as indicated by a higher correlation in the first sample of information retrieval
with model building and forecasting, respectively. (c) Furthermore, explicit knowledge assessed
in model building explained performance in school grades even beyond the general DPS factor.
Thus, it is highly advisable to design DPS tasks in a way that would allow the measurement of
several dimensions of DPS ability.
Results presented here are not yet sufficient to establish DPS as distinct from other con-
structs. Former research has questioned the mere existence of DPS. Suß (1999), for instance,
claimed it to be only a jumble of intelligence and prior knowledge, and supported this
assumption empirically. However, one point not considered by Suß is that when solutions
for a problem are routinely available and thus rely on prior knowledge and specific content,
important characteristics of a problem are lost. Funke (2003) denoted these situations a rou-
tine task. The authors claim that the dynamic interaction with an unknown environment is at
the heart of DPS, and in the tasks chosen by Suß, prior knowledge concealed genuine fea-
tures of a problem situation. As a consequence, DPS did not come fully into play. The
MicroDYN approach, on the contrary, enables a pure measurement of general DPS, activat-
ing only minimal prior knowledge.
How DPS and intelligence relate to each other has also been extensively disputed (Kroner
et al., 2005; Putz-Osterloh, 1985; Suß, 1999). This dispute has remained inconclusive largely
due to continuing measurement issues in DPS. In fact, contradictory results might well have
descended from different operationalizations and poor psychometric features of DPS tests
(Suß, 1999). Conceptually, the definition of DPS underlying MicroDYN (Buchner, 1995)
and the definition of general intelligence are easily separated, whereas this is not necessarily
true empirically. Tentative results from another study not reported here showed medium to
high correlations between the three dimensions of MicroDYN and general intelligence (mea-
sured by the Advanced Progressive Matrices; Raven, 1962) with model building explaining
approximately 10% of the variance in school grades beyond intelligence. This is not surpris-
ing considering the frequency with which unknown situations have to be mastered in daily
school life (Beckmann & Guthke, 1995). Apparently, it was only the psychometric link that
had been missing thus far to properly separate DPS and intelligence. But does the MicroDYN
approach as an advance in measuring DPS truly lead to an improved understanding of
the construct under study? The authors argue that inconclusive evidence in DPS research
has been largely due to a neglect of measurement issues. A reliable and valid measurement
instrument incorporating advantages of formal frameworks (Funke, 2001) and using
multiple independent tasks is a precondition for discovering the significance of DPS in cogni-
tive research. At the same time, fundamental questions still remain unanswered, and
further research is needed to elaborate on the relations between DPS and other cognitive
constructs.
Three particular shortcomings in this study need consideration. (a) The samples drawn
were not representative and generalizability was therefore reduced (Brennan, 1983) even
though variance on all measures was sufficient and the reliabilities of the MicroDYN dimen-
sions were excellent. The authors can only speculate about how internal structure and con-
struct validity might change in a representative sample, but it is likely that predictive power
Greiff et al. 207
at Universitat Heidelberg on May 2, 2012apm.sagepub.comDownloaded from
would increase whereas the internal structure might become less distinct. In addition, the
sample size was arguably small at n = 114 and usually would not be considered sufficient
for latent analyses. However, the internal structure was replicated in a second sample (n =
140) with a different MicroDYN test version supporting its empirical stability. Furthermore,
Hu and Bentler (1999) showed that also in small samples, stable models can be derived and
power analyses to detect misfit were satisfactory with regard to RMSEA yielding sufficient
probabilities to identify incorrectly specified models. (b) Distinguishing general intelligence
(e.g., as measured by the Advanced Progressive Matrices; Raven, 1962) and DPS empiri-
cally was not the focus of this study, but the first results mentioned earlier indicate differen-
tial validity. Whereas intelligence tests aim to assess basic cognitive skills, DPS taps into
higher order cognitive reasoning involving declarative and procedural aspects (Funke,
2003). Theoretical and empirical separation of these constructs, however, still needs further
attention. (c) The operationalization chosen in MicroDYN is narrow and does not fully
acknowledge the concept of DPS in its entire width, although this is also the case for other
constructs such as intelligence: Whereas the concept of intelligence is broad and overarch-
ing, this is not true for its accompanying tests (Sternberg, 2000). Consequently, the wide-
spread use of intelligence tests is argued for because of their high predictive validity and
their practical use and not because of their theoretical value (Sternberg, 2000). In line with
this argument, the authors propose to view MicroDYN as one feasible operationalization of
DPS that does not claim to capture all relevant dimensions suggested in the literature. The
authors are aware that the MicroDYN approach could be broadened regarding the nature of
the tasks (e.g., by including FSA) and the theoretical approach (e.g., by incorporating other
theoretical approaches such as multiple space models; Klahr & Dunbar, 1988), but the
authors suggest to evaluate the MicroDYN approach with regard to its measurement charac-
teristics and its construct validity, which have proved useful in this study.
The authors agree with Kluge’s (2008) bottom line that ‘‘it is useful to apply well-known
measurement standards to MWs (Microworlds). Otherwise, the performance of test takers is
contaminated . . . unknown to, or ignored by, the test developer or practitioner in personnel stan-
dard’’ (p. 178). When assessing DPS in personnel or student selection, in evaluation of teaching,
or in prediction of professional performance, sticking to established standards of measurement
is indisputable. The price paid for this is the loss of large tasks with a confusing number of vari-
ables and a long time on task. Instead, the use of less time-consuming tasks becomes necessary
to achieve item independency and to check scalability. Is it truly a loss to waive tasks that are so
well established in the research area? The authors do not think so. Results of this study encour-
age this point of view.
We encounter problem solving every single day—at school, at work, and at home. Without
our ability to become familiar with new systems, to understand them, and finally, to influence
them as we desire, we would be utterly lost. This is why DPS research has been around for a
long time. But without a reliable and valid measurement device, all its assets are only tentative
and inconclusive. This cannot be the desire of any research field. It is the authors’ wish that
more researchers get involved in the proper measurement of DPS in an attempt to tame this
monstrous beast by mapping it on a scale and not allowing it to run around loosely in different
disguises.
208 Applied Psychological Measurement 36(3)
at Universitat Heidelberg on May 2, 2012apm.sagepub.comDownloaded from

Ap
pen
dix
Syst
emSt
ruct
ure
for
the
2Tr
ialI
tem
san
dth
e11
Mic
roD
YNItem
sin
the
Mai
nSt
udy
and
inSt
udy
2
Linea
rst
ruct
ura
leq
uat
ions–
mai
nst
udy
Linea
rst
ruct
ura
leq
uat
ions
–St
udy
2
Task
1W
t+
1=
13
Wt2
0.5
3A
t+
03
Bt+
03
Ct+
03
Dt
Xt+
1=
1.2
3X
t+
03
At+
03
Bt+
03
Ct+
03
Dt
Yt+
1=
13
Yt+
03
At+
03
Bt+
0.2
3C
t+
03
Dt
Zt+
1=
13
Zt+
03
At+
03
Bt+
0.2
3C
t+
03
Dt
Wt+
1=
13
Wt+
03
At+
03
Bt+
03
Ct+
03
Dt
Xt+
1=
13
Xt+
03
At+
0.5
3B
t+
03
Ct+
03
Dt
Yt
+1
=1
3Y
t+
03
At+
03
Bt+
03
Ct+
03
Dt
Zt
+1
=1
3Z
t+
03
At+
03
Bt+
03
Ct+
0.2
3D
t
Task
2W
t+
1=
13
Wt+
0.2
3A
t+
03
Bt+
03
Ct+
03
Dt
Xt+
1=
13
Xt+
0.2
3A
t+
03
Bt+
03
Ct+
03
Dt
Yt+
1=
13
Yt+
03
At+
03
Bt+
0.2
3C
t+
0.2
3D
t
Zt+
1=
1.5
3Z
t+
03
At+
03
Bt+
03
Ct+
03
Dt
Wt+
1=
13
Wt+
0.5
3A
t+
03
Bt+
03
Ct+
03
Dt
Xt
+1
=1
3X
t+
03
At+
03
Bt+
03
Ct+
03
Dt
Yt
+1
=1
3Y
t+
03
At+
03
Bt+
0.2
3C
t+
0.2
3D
t
Zt
+1
=1
3Z
t+
03
At+
03
Bt+
03
Ct+
03
Dt
Task
3W
t+
1=
13
Wt+
03
At+
03
Bt+
03
Ct+
03
Dt
Xt
+1
=0.5
3X
t+
03
At+
0.5
3B
t+
03
Ct+
03
Dt
Yt
+1
=1
3Y
t+
03
At+
03
Bt+
0.2
3C
t+
03
Dt
Zt
+1
=1
3Z
t+
03
At+
03
Bt+
0.2
3C
t+
03
Dt
Wt+
1=
13
Wt+
0.5
3A
t+
0.5
3B
t+
03
Ct+
03
Dt
Xt
+1
=1
3X
t+
03
At+
03
Bt+
03
Ct+
03
Dt
Yt
+1
=1
3Y
t+
03
At+
03
Bt+
03
Ct+
03
Dt
Zt
+1
=1
3Z
t+
03
At+
03
Bt+
03
Ct+
0.2
3D
t
Task
4W
t+
1=
13
Wt+
03
At+
03
Bt+
03
Ct+
03
Dt
Xt
+1
=1.5
3X
t+
03
At+
0.5
3B
t+
03
Ct+
03
Dt
Yt
+1
=1
3Y
t+
03
At+
03
Bt+
0.2
3C
t+
03
Dt
Zt
+1
=1
3Z
t+
03
At+
03
Bt+
0.2
3C
t+
03
Dt
Wt+
1=
13
Wt+
03
At+
03
Bt+
03
Ct+
03
Dt
Xt
+1
=1
3X
t+
03
At+
0.2
3B
t+
03
Ct+
03
Dt
Yt
+1
=1
3Y
t+
03
At+
0.2
3B
t+
03
Ct+
03
Dt
Zt
+1
=1.5
3Z
t+
03
At+
03
Bt+
03
Ct+
03
Dt
Task
5W
t+
1=
13
Wt+
0.5
3A
t+
03
Bt+
03
Ct+
03
Dt
Xt
+1
=1
3X
t+
03
At+
0.5
3B
t+
03
Ct+
03
Dt
Yt
+1
=1
3Y
t+
03
At+
03
Bt+
0.2
3C
t+
03
Dt
Zt
+1
=1
3Z
t+
03
At+
03
Bt+
0.2
3C
t+
03
Dt
Wt+
1=
1.2
3W
t+
03
At+
03
Bt+
03
Ct+
03
Dt
Xt
+1
=1
3X
t+
03
At+
0.5
3B
t+
03
Ct+
03
Dt
Yt
+1
=1
3Y
t+
03
At+
03
Bt+
03
Ct+
03
Dt
Zt
+1
=1
3Z
t+
03
At+
03
Bt+
03
Ct+
03
Dt
Task
6W
t+
1=
13
Wt2
0.5
3A
t+
03
Bt+
03
Ct+
03
Dt
Xt
+1
=1
3X
t+
03
At+
0.5
3B
t+
03
Ct+
03
Dt
Yt
+1
=1
3Y
t+
03
At+
03
Bt+
0.2
3C
t+
03
Dt
Zt
+1
=1
3Z
t+
03
At+
03
Bt+
0.2
3C
t+
03
Dt
Wt+
1=
13
Wt+
03
At+
03
Bt+
03
Ct+
03
Dt
Xt
+1
=1
3X
t+
03
At+
03
Bt+
03
Ct+
03
Dt+
0.5
3W
t
Yt
+1
=1
3Y
t+
03
At+
03
Bt+
0.2
3C
t+
03
Dt
Zt
+1
=1
3Z
t+
03
At+
03
Bt+
03
Ct+
03
Dt
Task
7W
t+
1=
13
Wt2
0.5
3A
t+
03
Bt+
03
Ct+
03
Dt
Xt
+1
=1.2
3X
t+
03
At+
03
Bt+
03
Ct+
03
Dt
Yt
+1
=1
3Y
t+
03
At+
03
Bt+
0.2
3C
t+
0.2
3D
t
Zt
+1
=1
3Z
t+
03
At+
03
Bt+
03
Ct+
03
Dt
Wt+
1=
13
Wt+
0.2
3A
t+
0.2
3B
t+
03
Ct+
03
Dt
Xt
+1
=1
3X
t+
03
At+
03
Bt+
03
Ct+
03
Dt
Yt
+1
=1
3Y
t+
03
At+
03
Bt+
03
Ct+
03
Dt
Zt
+1
=1
3Z
t+
03
At+
03
Bt+
03
Ct+
03
Dt+
0.5
3Y
t
Task
8W
t+
1=
13
Wt2
0.5
3A
t+
03
Bt+
03
Ct+
03
Dt
Xt
+1
=1.2
3X
t+
03
At+
03
Bt+
03
Ct+
03
Dt
Yt
+1
=1
3Y
t+
03
At+
03
Bt+
0.2
3C
t+
0.2
3D
t
Zt
+1
=1
3Z
t+
03
At+
03
Bt+
03
Ct+
03
Dt
Wt+
1=
13
Wt+
03
At+
03
Bt+
03
Ct+
03
Dt
Xt
+1
=1.5
3X
t+
03
At+
03
Bt+
03
Ct+
03
Dt
Yt
+1
=1
3Y
t+
03
At+
03
Bt+
03
Ct+
03
Dt
Zt
+1
=1
3Z
t+
03
At+
03
Bt+
03
Ct+
03
Dt+
0.2
3Y
t
(con
tinue
d)
209
at Universitat Heidelberg on May 2, 2012apm.sagepub.comDownloaded from
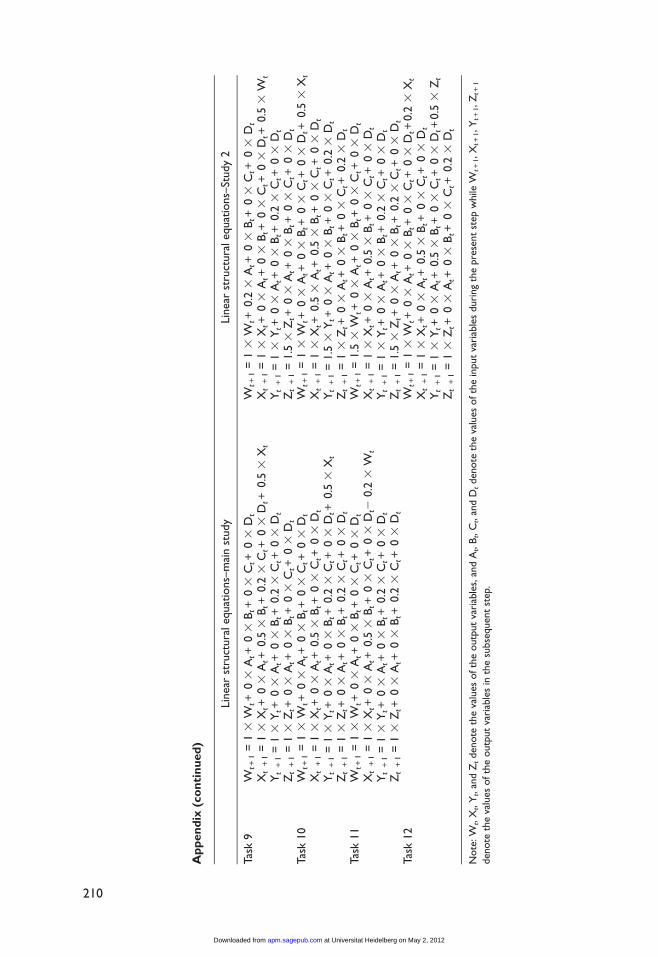
Ap
pen
dix
(co
nti
nu
ed
)
Linea
rst
ruct
ura
leq
uat
ions–
mai
nst
udy
Linea
rst
ruct
ura
leq
uat
ions
–St
udy
2
Task
9W
t+
1=
13
Wt+
03
At+
03
Bt+
03
Ct+
03
Dt
Xt
+1
=1
3X
t+
03
At+
0.5
3B
t+
0.2
3C
t+
03
Dt+
0.5
3X
t
Yt
+1
=1
3Y
t+
03
At+
03
Bt+
0.2
3C
t+
03
Dt
Zt
+1
=1
3Z
t+
03
At+
03
Bt+
03
Ct+
03
Dt
Wt+
1=
13
Wt+
0.2
3A
t+
03
Bt+
03
Ct+
03
Dt
Xt
+1
=1
3X
t+
03
At+
03
Bt+
03
Ct+
03
Dt+
0.5
3W
t
Yt
+1
=1
3Y
t+
03
At+
03
Bt+
0.2
3C
t+
03
Dt
Zt
+1
=1.5
3Z
t+
03
At+
03
Bt+
03
Ct+
03
Dt
Task
10
Wt+
1=
13
Wt+
03
At+
03
Bt+
03
Ct+
03
Dt
Xt
+1
=1
3X
t+
03
At+
0.5
3B
t+
03
Ct+
03
Dt
Yt
+1
=1
3Y
t+
03
At+
03
Bt+
0.2
3C
t+
03
Dt+
0.5
3X
t
Zt
+1
=1
3Z
t+
03
At+
03
Bt+
0.2
3C
t+
03
Dt
Wt+
1=
13
Wt+
03
At+
03
Bt+
03
Ct+
03
Dt+
0.5
3X
t
Xt
+1
=1
3X
t+
0.5
3A
t+
0.5
3B
t+
03
Ct+
03
Dt
Yt
+1
=1.5
3Y
t+
03
At+
03
Bt+
03
Ct+
0.2
3D
t
Zt
+1
=1
3Z
t+
03
At+
03
Bt+
03
Ct+
0.2
3D
t
Task
11
Wt+
1=
13
Wt+
03
At+
03
Bt+
03
Ct+
03
Dt
Xt
+1
=1
3X
t+
03
At+
0.5
3B
t+
03
Ct+
03
Dt2
0.2
3W
t
Yt
+1
=1
3Y
t+
03
At+
03
Bt+
0.2
3C
t+
03
Dt
Zt
+1
=1
3Z
t+
03
At+
03
Bt+
0.2
3C
t+
03
Dt
Wt+
1=
1.5
3W
t+
03
At+
03
Bt+
03
Ct+
03
Dt
Xt
+1
=1
3X
t+
03
At+
0.5
3B
t+
03
Ct+
03
Dt
Yt
+1
=1
3Y
t+
03
At+
03
Bt+
0.2
3C
t+
03
Dt
Zt
+1
=1.5
3Z
t+
03
At+
03
Bt+
0.2
3C
t+
03
Dt
Task
12
Wt+
1=
13
Wt+
03
At+
03
Bt+
03
Ct+
03
Dt+
0.2
3X
t
Xt
+1
=1
3X
t+
03
At+
0.5
3B
t+
03
Ct+
03
Dt
Yt
+1
=1
3Y
t+
03
At+
0.5
3B
t+
03
Ct+
03
Dt+
0.5
3Z
t
Zt
+1
=1
3Z
t+
03
At+
03
Bt+
03
Ct+
0.2
3D
t
Note
:W
t,X
t,Y
t,an
dZ
tden
ote
the
valu
esofth
eoutp
ut
vari
able
s,an
dA
t,B
t,C
t,an
dD
tden
ote
the
valu
esofth
ein
put
vari
able
sduri
ng
the
pre
sent
step
while
Wt+
1,X
t+
1,Y
t+
1,Z
t+
1
den
ote
the
valu
esofth
eoutp
ut
vari
able
sin
the
subse
quen
tst
ep.
210
at Universitat Heidelberg on May 2, 2012apm.sagepub.comDownloaded from

Acknowledgment
The authors gratefully thank Andreas Fischer for his comments.
Declaration of Conflicting Interests
The author(s) declared no potential conflicts of interest with respect to the research, authorship, and/or pub-
lication of this article.
Funding
The author(s) disclosed receipt of the following financial support for the research, authorship, and/or pub-
lication of this article: This research was funded by a grant of the German Research Foundation (DFG Fu
173/14).
Notes
1. Data collection was conducted within a PhD project at the University of Heidelberg, Germany. All
information provided refer to the main study. Information concerning the cross-validation of Study 2
is provided after results of the main study are reported.
2. Parts of these data have been published in a German article on international educational studies
(Leutner, Fleischer, Wirth, Greiff, & Funke, in press). Further details on the sample can be obtained
there.
References
Beauducel, A., & Herzberg, P. Y. (2005). On the performance of maximum likelihood versus means and
variance adjusted weighted least squares estimation in CFA. Structural Equation Modeling, 13, 186-
203.
Beckmann, J. F., & Guthke, J. (1995). Complex problem solving, intelligence, and learning ability. In
P. A. Frensch & J. Funke (Eds.), Complex problem solving: The European perspective (pp. 177-200).
Hillsdale, NJ: Erlbaum.
Bollen, K. A. (1989). Structural equations with latent variables. New York, NY: Wiley.
Brennan, R. L. (1983). Elements of generalizability theory. Iowa City, IA: American College Testing.
Buchner, A. (1995). Basic topics and approaches to the study of complex problem solving. In P. A.
Frensch & J. Funke (Eds.), Complex problem solving: The European perspective (pp. 27-63). Hillsdale,
NJ: Erlbaum.
Buhner, M., Kroner, S., & Ziegler, M. (2008). Working memory, visual–spatial intelligence and their
relationship to problem-solving. Intelligence, 36, 672-680.
Chen, Z., & Klahr, D. (1999). All other things being equal: Acquisition and transfer of the control of
variables strategy. Child Development, 70, 1098-1120.
Daniel, M. H. (2000). Interpretation of intelligence test scores. In R. J. Sternberg (Ed.), Handbook of
intelligence. Cambridge, England: Cambridge University Press.
Dorner, D. (1980). On the difficulties people have in dealing with complexity. Simulation & Games, 11,
87-106.
Dorner, D. (1986). Diagnostik der operativen Intelligenz [On the diagnostics of operative intelligence].
Diagnostica, 32, 290-308.
Dunn-Rankin, P., Knezek, G. A., Wallace, S., & Zhang, S. (2004). Scaling methods (2nd ed.). Mahwah,
NJ: Erlbaum.
Embretson, S. E., & Reise, S. P. (2000). Item response theory for psychologists. Mahwah, NJ: Erlbaum.
Funke, J. (1985). Steuerung dynamischer Systeme durch Aufbau und Anwendung subjektiver
Kausalmodelle [Controlling dynamic systems creating and using subjective causal models]. Zeitschrift
fur Psychologie, 193, 435-457.
Greiff et al. 211
at Universitat Heidelberg on May 2, 2012apm.sagepub.comDownloaded from

Funke, J. (2001). Dynamic systems as tools for analysing human judgement. Thinking & Reasoning, 7, 69-
89.
Funke, J. (2003). Problemlosendes Denken [Problem-solving thinking]. Stuttgart, Germany: Kohlhammer.
Greiff, S. (2012). Individualdiagnostik der komplexen Problemlosefahigkeit [Individual diagnostics of
complex problem solving]. Munster, Germany: Waxmann.
Greiff, S., & Funke, J. (2009). Measuring complex problem solving—The MicroDYN approach. In
F. Scheuermann (Ed.), The transition to computer-based assessment—Lessons learned from large-
scale surveys and implications for testing. Luxembourg, Luxembourg: Office for Official Publications
of the European Communities.
Greiff, S., & Funke, J. (2010). Systematische Erforschung komplexer Problemlosefahigkeit anhand
minimal komplexer Systeme [Systematic research on complex problem solving competency using
minimal complex systems]. Zeitschrift fur Padagogik, 56(Beiheft), 216-227.
Hair, J. F., Anderson, R. E., Tatham, R. L., & Black, W. (1998). Multivariate data analysis. Upper Saddle
River, NJ: Prentice Hall.
Hu, L., & Bentler, P. M. (1995). Evaluating model fit. In R. H. Hoyle (Ed.), Structural equation modeling
(pp. 76-99). London, England: SAGE.
Hu, L., & Bentler, P. M. (1999). Cutoff criteria for fit indexes in covariance structure analysis:
Conventionale criteria versus new alternatives. Structural Equation Modeling, 6, 1-55.
Jonassen, D. H., Engle, R. W., Cheng, P. C.-H., & Salas, E. (2007). Research agenda for the future: What
we need to learn about complex, scientific problem solving. In D. H. Jonassen (Ed.), Learning to solve
complex scientific problems (pp. 341-362). New York, NY: Erlbaum.
Klahr, D., & Dunbar, K. (1988). Dual space search during scientific reasoning. Cognitive Science, 12, 1-48.
Klieme, E., Funke, J., Leutner, D., Reimann, P., & Wirth, J. (2001). Problemlosen als facherubergreifende
Kompetenz. Konzeption und erste Resultate aus einer Schulleistungsstudie [Problem solving as
crosscurricular competency. Conception and first results out of a school performance study]. Zeitschrift
fur Padagogik, 47, 179-200.
Kluge, A. (2008). Performance assessment with microworlds and their difficulty. Applied Psychological
Measurement, 32, 156-180.
Kroner, S., Plass, J. L., & Leutner, D. (2005). Intelligence assessment with computer simulations.
Intelligence, 33, 347-368.
Leutner, D., Fleischer, J., Wirth, J., Greiff, S., & Funke, J. (2012). Analytisches und dynamisches
Problemlosen im Lichte internationaler Schulleistungsvergleichsstudien: Untersuchungen zur
Dimensionalitat [Analytical and dynamic problem solving from an international educational studies
perspective]. Psychologische Rundschau, 63 (1), 34-42.
MacCallum, R. C., Browne, M. W., & Sugawara, H. M. (1996). Power analysis and determination of
sample size for covariance structure modeling. Psychological Methods, 1, 130-149.
Mayer, R. E., & Wittrock, M. C. (2006). Problem solving. In P. A. Alexander & P. H. Winne (Eds.),
Handbook of educational psychology (pp. 287-303). Mahwah, NJ: Erlbaum.
McGrew, K. S. (2009). CHC theory and the human cognitive abilities project: Standing on the shoulders of
the giants of psychometric intelligence research. Intelligence, 37, 1-10.
Muthen, B. O. (1993). Goodness of fit with categorical and other non-normal variables. In K. A. Bollen &
J. S. Long (Eds.), Testing structural equation models (pp. 205-243). Newbury Park, CA: SAGE.
Muthen, L. K., & Muthen, B. O. (2007). MPlus user’s guide. Los Angeles, CA: Author.
Putz-Osterloh, W. (1985). Selbstreflexionen, Testintelligenz und interindividuelle Unterschiede bei der
Bewaltigung komplexer Probleme [Self-reflections, test intelligence and interindividual differences in
solving complex problems]. Sprache & Kognition, 4, 203-216.
Raven, J. C. (1962). Advanced progressive matrices. London, England: Lewis.
Raykov, T., & Marcoulides, G. A. (2006). A first course in structural equation modeling. New York, NY:
Psychology Press.
Sternberg, R. J. (Ed.). (2000). Handbook of intelligence. Cambridge, England: Cambridge University
Press.
Suß, H.-M. (1999). Intelligenz und komplexes Problemlosen–Perspektiven fur eine Kooperation zwischen
differentiell-psychometrischer und kognitionspsychologischer Forschung [Intelligence and complex
212 Applied Psychological Measurement 36(3)
at Universitat Heidelberg on May 2, 2012apm.sagepub.comDownloaded from

problem solving—Perspectives for a cooperation between differential-psychometric and cognition-
psychological research]. Psychologische Rundschau, 50, 220-228.
Trost, G. (2000). Prediction of excellence in school, higher education, and work. In K. A. Heller, F.
J. Monks, R. J. Sternberg, & R. Subotnik (Eds.), International handbook of giftedness and talent
(pp. 317-327). Oxford, England: Pergamon.
Ullman, J. B. (2007). Structural equation modeling. In B. G. Tabachnick & L. S. Fidell (Eds.), Using
multivariate statistics (pp. 676-780). Boston, MA: Pearson.
Vollmeyer, R., & Rheinberg, F. (1999). Motivation and metacognition when learning a complex system.
European Journal of Psychology of Education, 14, 541-554.
Wirth, J., & Klieme, E. (2003). Computer-based assessment of problem solving competence. Assessment
in Education: Principles, Policy, & Practice, 10, 329-345.
Yu, C.-Y. (2002). Evaluating cutoff criteria of model fit indices for latent variable models with binary and
continuous outcomes. Los Angeles: University of California.
Greiff et al. 213
at Universitat Heidelberg on May 2, 2012apm.sagepub.comDownloaded from