Embed Size (px)
DESCRIPTION
gder
Citation preview

RATING OF THE STEEL SECTOR
How we did it
Green Rating Project, June 2012
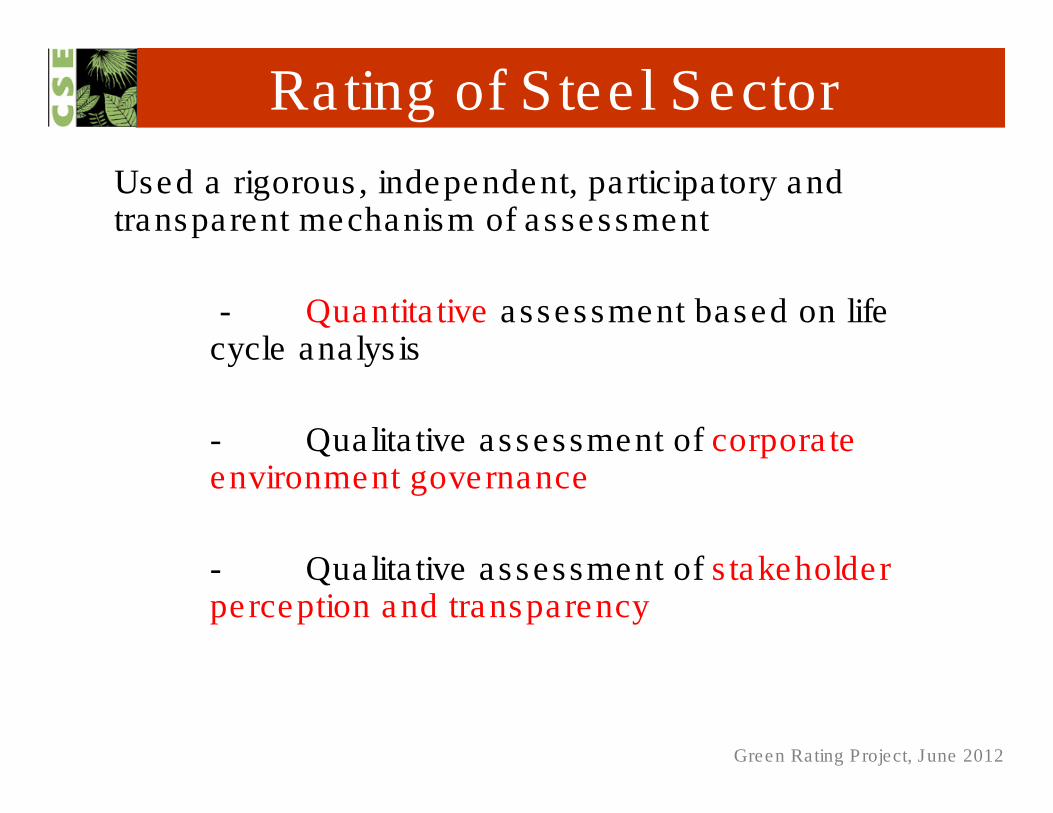
Rating of Steel Sector
Used a rigorous, independent, participatory and transparent mechanism of assessment
- Quantitative assessment based on life cycle analysis
- Qualitative assessment of corporate environment governance
- Qualitative assessment of stakeholder perception and transparency
Green Rating Project, June 2012
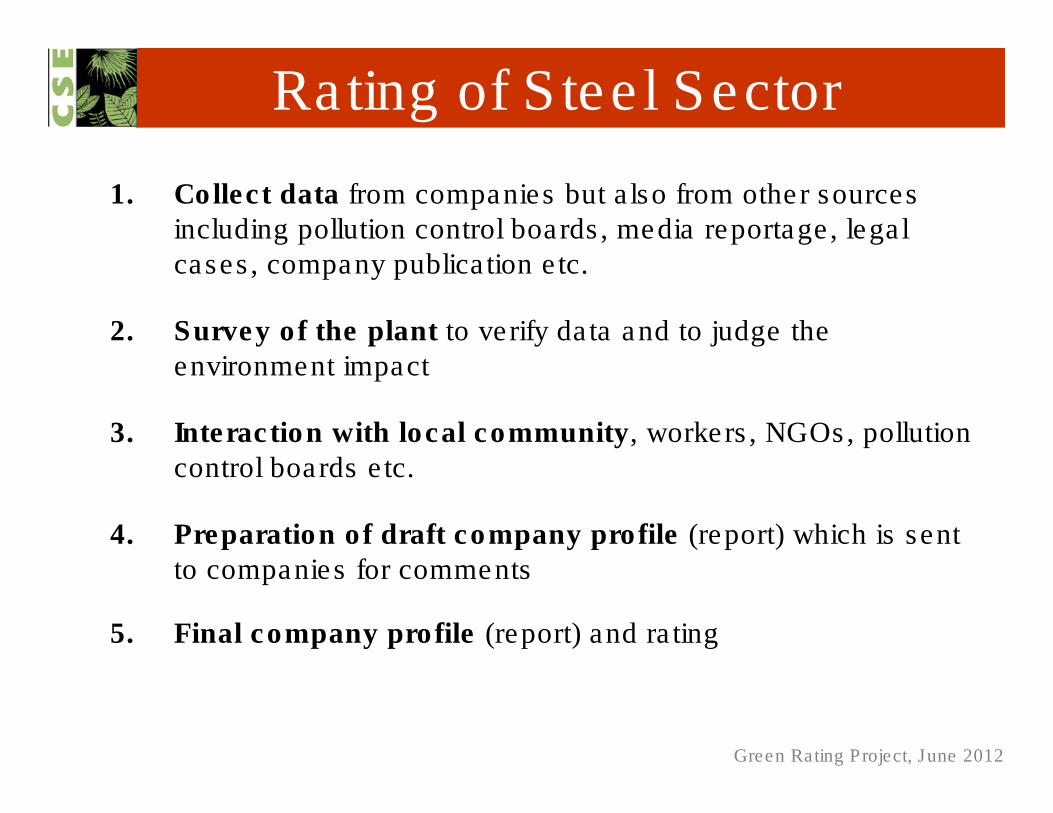
Rating of Steel Sector
1. Collect data from companies but also from other sources including pollution control boards, media reportage, legal
cases, company publication etc.
2. Survey of the plant to verify data and to judge the
environment impact
3. Interaction with local community, workers, NGOs, pollution
control boards etc.
4. Preparation of draft company profile (report) which is sent
to companies for comments
5. Final company profile (report) and rating

Green Rating Project, June 2012
Technical Advise & Assurance
Technical advisory panel
To assist in rating methodology, assessment, data
verification and provide independent assurance.

Green Rating Project, June 2012
Pushing for changeScores Awards Category Criteria
Above 75% 5 Leaves award
Performance far exceeding compliance
requirements
Global best technology
Best management practices
50% to 75% 4 Leaves award
Good Compliance
Good technology and performance
Strong management practices
35% to 49.9 % 3 Leaves award
Average performance of compliance
Average technology and performance
Average management practices
25% to 34.9 % 2 Leaves award
Below average compliance conditions
Below average technology and performance
Basic management practices
15% to 24.9 % 1 Leaf award
Poor performanceFrequent cases of non-compliance
In adequate management practices
Less than 15% No award
Regular non-compliance; non participationPoor performance and management
practices
Green Rating Project, June 2012
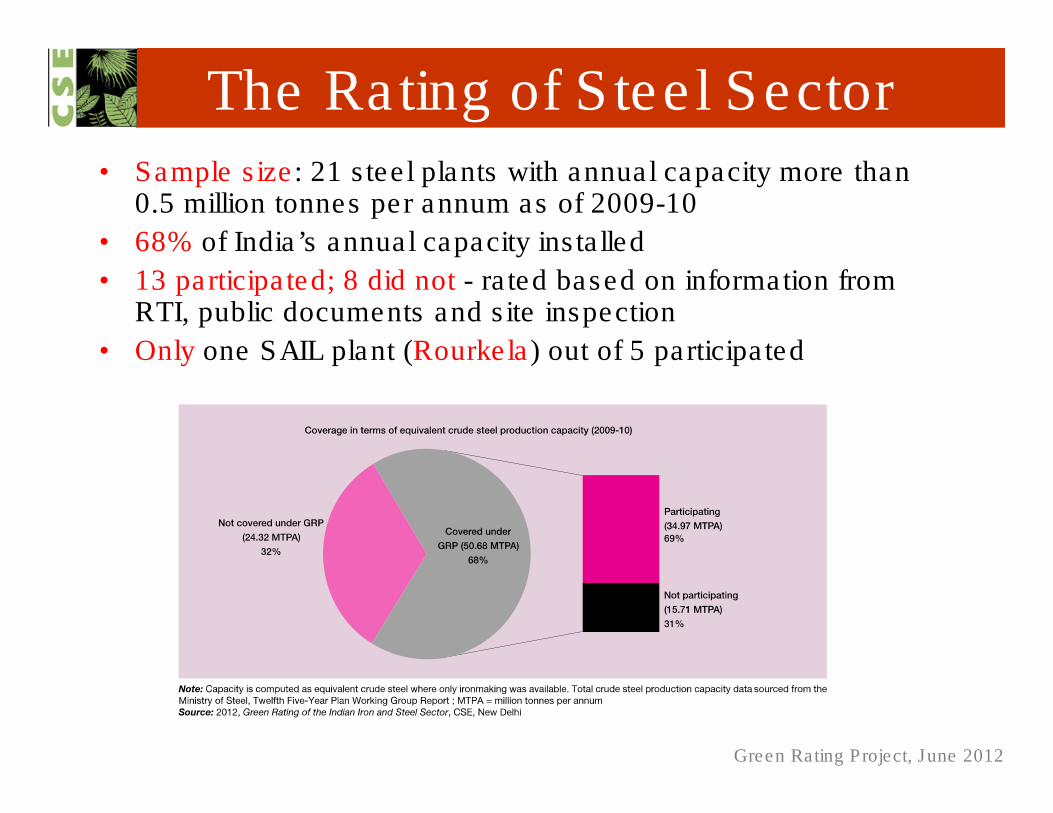
The Rating of Steel Sector
• Sample size: 21 steel plants with annual capacity more than 0.5 million tonnes per annum as of 2009-10
• 68% of India’s annual capacity installed
• 13 participated; 8 did not - rated based on information from RTI, public documents and site inspection
• Only one SAIL plant (Rourkela) out of 5 participated

Green Rating Project, June 2012
Boundary selection
• Our rating methodology accounts for the multiple
process routes used for making steel
• We have considered production phase only and rating is site specific
• Raw material sourcing (mining) is not included as many plants do not own captive mines
• Product use and disposal phase not included because of
wide applications, no data and because of ‘low impact’due to recyclable nature of steel
Green Rating Project, June 2012
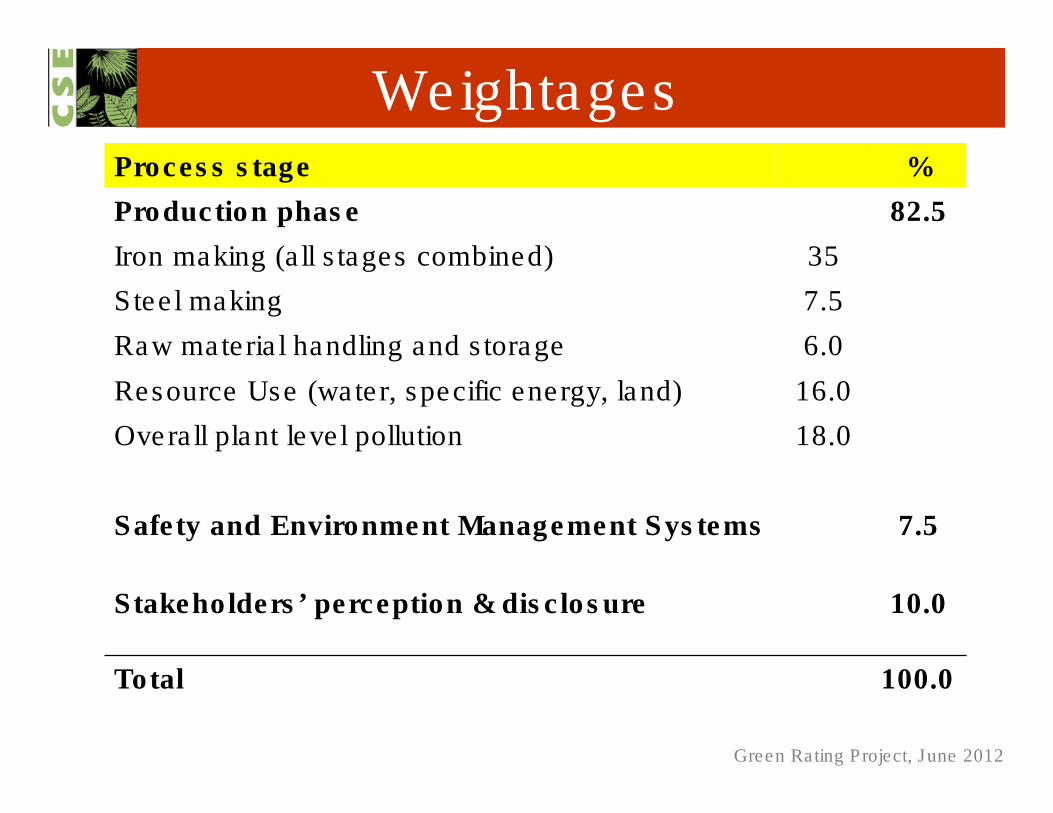
WeightagesProcess stage %
Production phase 82.5
Iron making (all stages combined) 35
Steel making 7.5
Raw material handling and storage 6.0
Resource Use (water, specific energy, land) 16.0
Overall plant level pollution 18.0
Safety and Environment Management Systems 7.5
Stakeholders’ perception & disclosure 10.0
Total 100.0

Green Rating Project, June 2012
Rating Weightages and CriteriaTechnology Neutral
Apple to apple comparison:
- blast furnace to blast furnace best practice
- coal DRI to coal DRI best practice, and so on
Process Weightages
Means (or technology):
25%
Outcomes (compliance
and efficiency performance)
(75%)
BottomlineNo matter what technology is adopted,
performance matters most

Green Rating Project, June 2012
Iron making: BF-BOF
INDICATORS %
Raw material preparation 23
• Coke making 14
• Ore Agglomeration (Sinter/pellets) 9
Blast furnace 12
Total 35

Green Rating Project, June 2012
Raw material preparation - Indicator
• By-product coke ovens: Coke oven stack particulate matter emissions
• Non–compliance to norms
Green Rating Project, June 2012
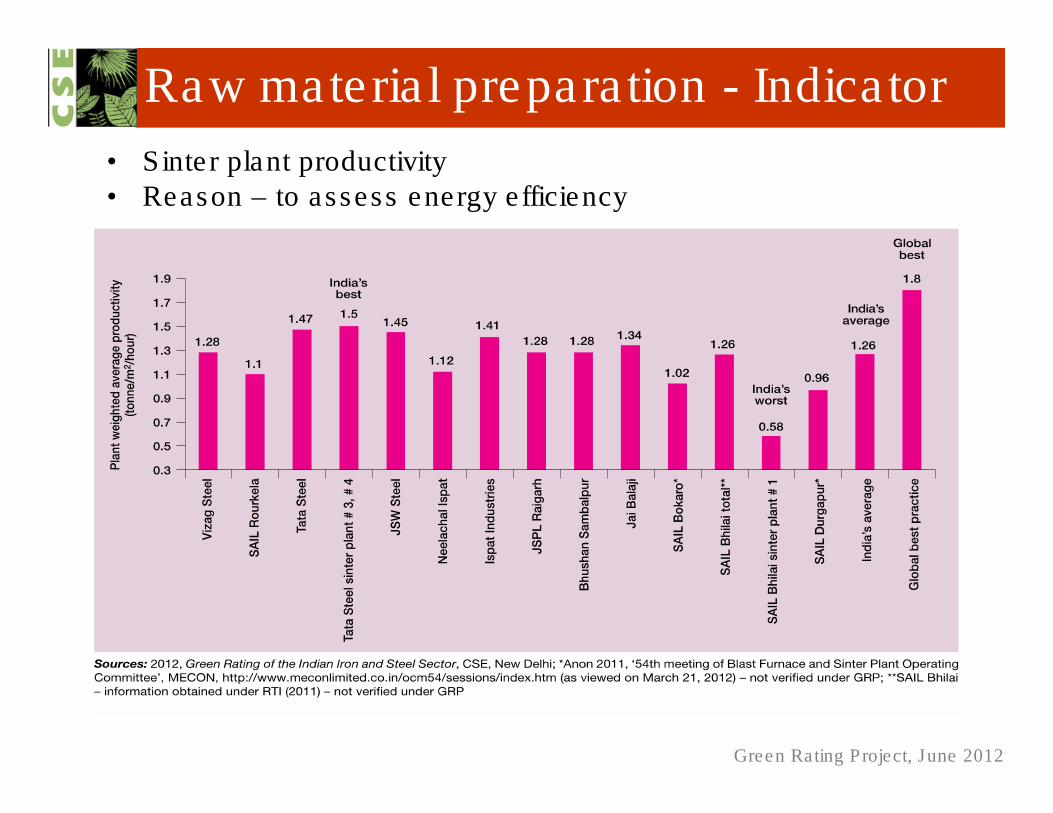
• Sinter plant productivity
• Reason – to assess energy efficiency
Raw material preparation - Indicator

Green Rating Project, June 2012
Raw material preparation - Scoring
Plant %
Vizag Steel 39.1
Tata Steel 34.5
JSW Steel 33.8
Neeclachal Ispat 29.9
SAIL Rourkela 21.5
SAIL Bhilai 9.7
SAIL Bokaro 6.6
SAIL Durgapur 5.9
SAIL IISCO Burnpur 5.9
BYPRODUCT COKE OVENS
Plant %
Ispat Industries, Dolvi 33.2
Jindal Steel & Power, Raigarh 31.9
JSW Steel, Vijaynagar 28.8
Tata Steel 28.6
Bhushan Power, Sambalpur 25.6
Vizag Steel 24.8
Neelachal Ispat 23.2
SAIL Rourkela 17.4
Jai Balaji Durgapur 11.4
SAIL Bhilai 10.1
SAIL Durgapur 9.6
SAIL Bokaro 7.6
Bhushan Steel Dhenkanal 2.8
Jayaswal Neco 0.0
SINTER PLANTS

Green Rating Project, June 2012
Iron process
Blast Furnace
Coal based
sponge iron
Gas based
sponge iron
Corex
IRON

Green Rating Project, June 2012
Iron process - Indicator
• Blast Furnace – Design top pressure
• Reason – to assess high productivity and energy efficiency
Green Rating Project, June 2012
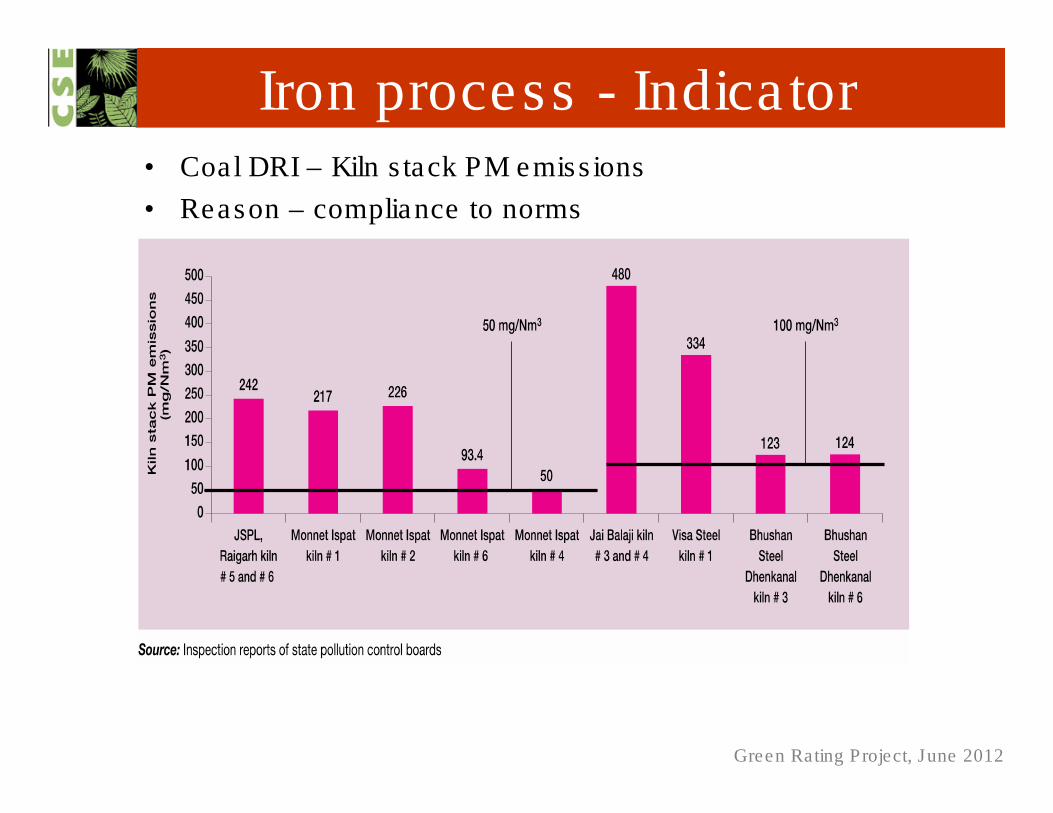
Iron process - Indicator• Coal DRI – Kiln stack PM emissions
• Reason – compliance to norms

Green Rating Project, June 2012
Iron process - Scoring
Plant %
Bhushan Power, Sambalpur 44.6
Ispat Industries, Dolvi 44.5
Jindal Steel and Power, Raigarh 42.6
Tata Steel 38.0
JSW Steel, Vijaynagar 33.0
Jai Balaji Durgapur 32.3
Vizag Steel 29.1
Neelachal Ispat 20.7
SAIL Rourkela 15.2
Visa Steel 15.2
Usha Martin 12.0
Jayaswal Neco <15.0
SAIL Bhilai <15.0
SAIL Bokaro <15.0
SAIL Durgapur <15.0
SAIL IISCO Burnpur <15.0
Bhushan Steel Dhenkanal <15.0
BLAST FURNACE COAL DRI (SPONGE IRON)
Plant %
Godawari Ispat 24.1
Visa Steel 17.9
Jindal Steel and Power, Raigarh 16.7
Bhushan Power, Sambalpur 13.2
Jai Balaji, Durgapur 11.0
Usha Martin 11.0
Jayaswal Neco 3.2
Monnet Ispat 2.4
Bhushan Steel, Dhenkanal 2.2

Green Rating Project, June 2012
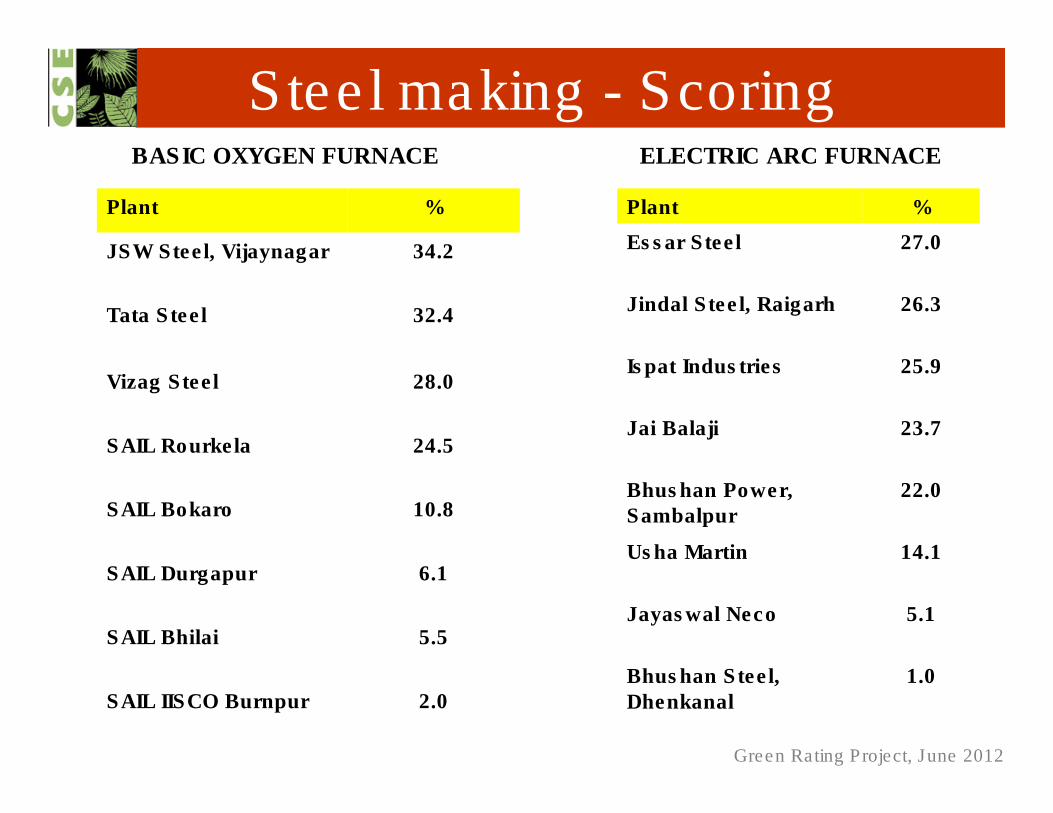
Steel Making
Basic Oxygen
Furnace
Electric Arc
Furnace
Electric
Induction
Furnace
LIQUID STEEL

Green Rating Project, June 2012
Steel making - Indicator• Specific BOF waste gas recovery rate
• Reason – to assess energy recovery and use

Green Rating Project, June 2012
Steel making - Indicator
• Electric Arc Furnace – Specific slag generation rate
• Reason – to asses process efficiency and solid waste generation
Green Rating Project, June 2012
Steel making - Scoring
Plant %
JSW Steel, Vijaynagar 34.2
Tata Steel 32.4
Vizag Steel 28.0
SAIL Rourkela 24.5
SAIL Bokaro 10.8
SAIL Durgapur 6.1
SAIL Bhilai 5.5
SAIL IISCO Burnpur 2.0
BASIC OXYGEN FURNACE ELECTRIC ARC FURNACE
Plant %
Essar Steel 27.0
Jindal Steel, Raigarh 26.3
Ispat Industries 25.9
Jai Balaji 23.7
Bhushan Power,
Sambalpur
22.0
Usha Martin 14.1
Jayaswal Neco 5.1
Bhushan Steel,
Dhenkanal
1.0
Green Rating Project, June 2012
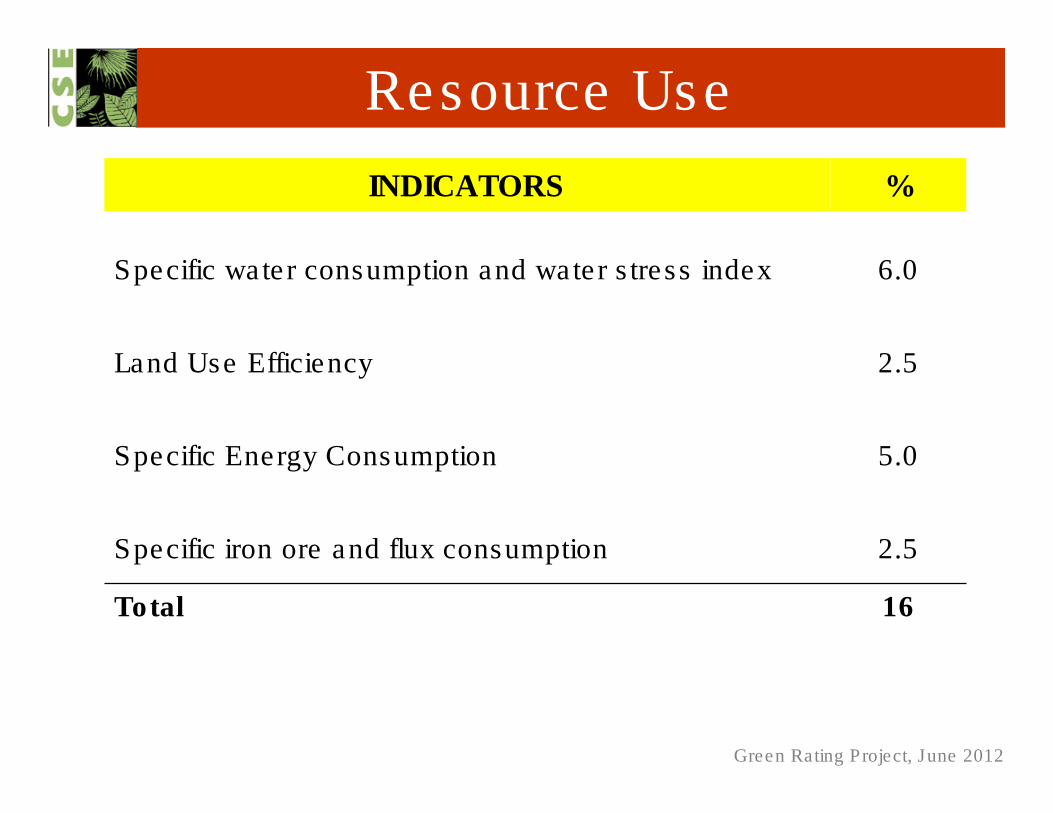
Resource Use
INDICATORS %
Specific water consumption and water stress index 6.0
Land Use Efficiency 2.5
Specific Energy Consumption 5.0
Specific iron ore and flux consumption 2.5
Total 16

Green Rating Project, June 2012
Resource use - Indicator• Specific plant level water consumption
• Reason – to assess how water efficient are plants

Green Rating Project, June 2012
Resource use - Indicator
• Land use efficiency
• Reason – is land being efficiently used

Green Rating Project, June 2012
Overall Pollution Impact
INDICATORS %
Ambient Air Quality compliance and stack emissions
management
6.0
Water Pollution management 4.0
Solid waste management 6.0
Carbon emissions intensity 2.0
Total 18
Green Rating Project, June 2012
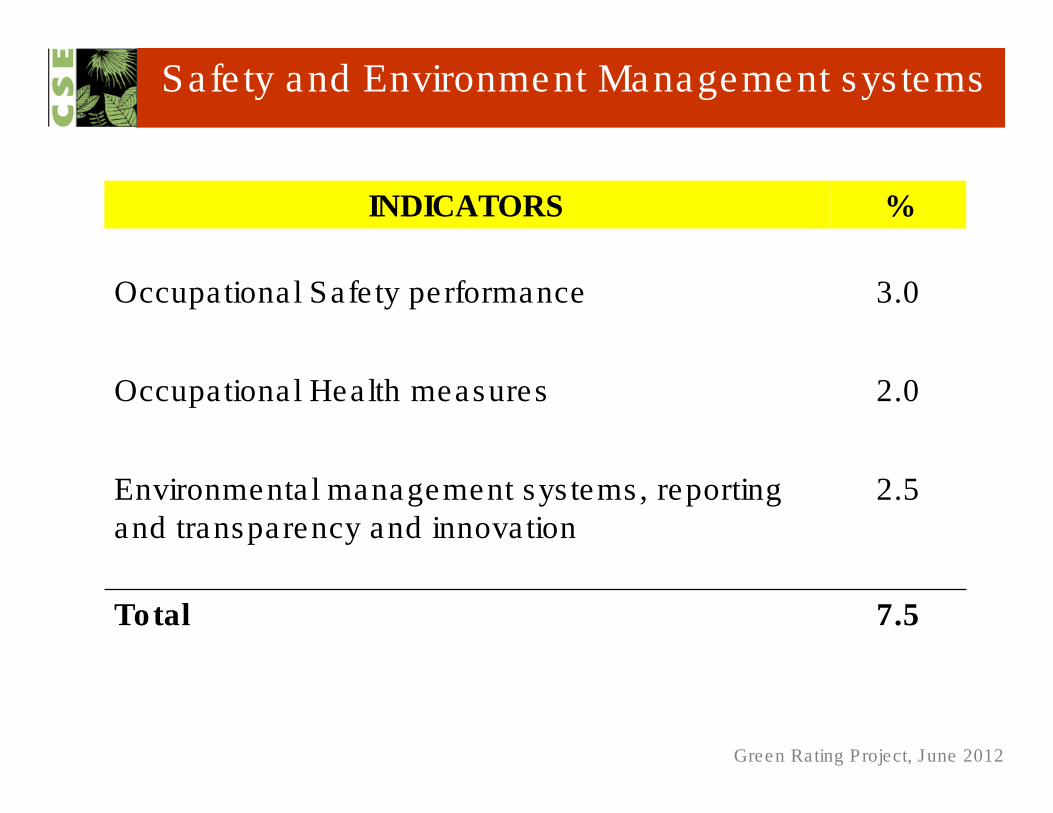
Safety and Environment Management systems
INDICATORS %
Occupational Safety performance 3.0
Occupational Health measures 2.0
Environmental management systems, reporting
and transparency and innovation
2.5
Total 7.5
Green Rating Project, June 2012
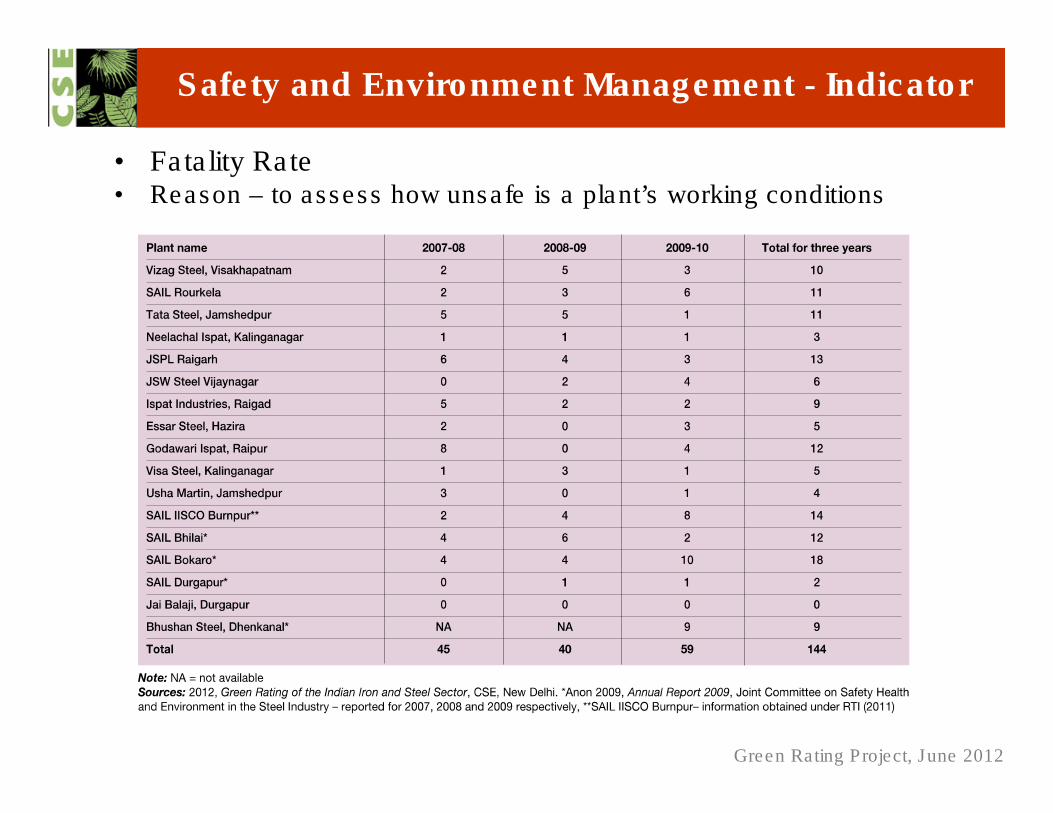
Safety and Environment Management - Indicator
• Fatality Rate• Reason – to assess how unsafe is a plant’s working conditions

Green Rating Project, June 2012
Stakeholders’ Perception
INDICATORS %
Pollution Control Board’s perception 2.5
Local Community's perception on environment and sustainable development
3.0
Local Community's perception on rehabilitation and resettlement and other social concerns
2.0
Primary surveyor's perception, transparency during GRP survey and overall involvement
2.5
Total 10.0

Green Rating Project, June 2012
Summary
• More than 150 parameters; technology, process
performance, efficiency, pollution, compliance,
management systems etc.
• 2 years of rigorous assessment
• With hope that this will drive the steel sector
towards better social and environmental practices.