Embed Size (px)
Citation preview
1
Specific expression and regulation of the new MIA-related gene MIA2 in
hepatocytes
Bosserhoff AK 1, Moser M 4, Schölmerich J 2, Buettner R 3, Hellerbrand C 2
1Institute of Pathology and 2Department of Internal Medicine I, University of
Regensburg, 3Institute of Pathology, University of Bonn, 4Dept. of Molecular
Medicine, MPI of Biochemistry, Germany
Running title: MIA2 expression
Key words: MIA2, HNF-1, transcriptional regulation, hepatocytes
Corresponding author:
Anja Katrin Bosserhoff, Ph.D.
Institut of Pathology, Molecular Pathology
University of Regensburg
D-93042 Regensburg
Germany
Phone: +49-941-944-6705
Fax.: +49-941-944-6602
e-mail: [email protected]
Copyright 2003 by The American Society for Biochemistry and Molecular Biology, Inc.
JBC Papers in Press. Published on February 13, 2003 as Manuscript M212639200 by guest on February 17, 2018
http://ww
w.jbc.org/
Dow
nloaded from
2
Summary
The novel human gene MIA2 encoding a MIA („melanoma inhibitory activity“)
homologous protein was identified by a gene bank search. MIA2, together with MIA,
OTOR and TANGO, belongs to the novel MIA gene family sharing important
structural features, significant homology at both the nucleotide and protein level, and
similar genomic organization.
In situ hybridization, RT-PCR and Northern Blots presented a highly tissue-specific
MIA2 expression pattern in the liver. Promoter studies analyzing transcriptional
regulation of MIA2 revealed an HNF-1 binding site at position -236 controlling
hepatocyte specific expression. Mutation of the site led to a complete loss of
promoter activity in HepG2 cell. Further sites detected in the MIA2 promoter were
consensus binding sites for smad and Stat3. Consistently, stimulation of MIA2 mRNA
expression occurred by treatment with IL-6, TGF-ß and conditioned medium from
activated hepatic stellate cells. In accordance with these results, MIA2 mRNA was
found to be increased in liver tissue of patients with chronic hepatitis C infection
compared to controls. MIA2 mRNA levels were significantly higher in patients with
severe fibrosis or inflammation than in patients with less severe fibrosis or
inflammation.
In summary our data indicate that MIA2 represents a potential novel acute phase
protein and MIA2 expression responds to liver damage. The increased transcription
in more severe chronic liver disease, suggests that MIA2 may serve as a marker of
hepatic disease activity and severity.
by guest on February 17, 2018http://w
ww
.jbc.org/D
ownloaded from
3
Introduction
Melanoma inhibitory activity (MIA) protein was identified previously within growth-
inhibiting activities purified from the tissue culture supernatant of the human
melanoma cell line HTZ-19 (1). MIA is translated as a 131 amino acid precursor
molecule and processed into a mature 107 amino acid protein after cleavage of a
hydrophobic secretion signal. The position within the human genome was mapped to
chromosome 19q13.32-13.33 (2). MIA mRNA was identified independently by
differential display approaches comparing melanoma cell lines and also comparing
differentiated and dedifferentiated cartilage cells in vitro. Therefore, MIA has also
been referred to as cartilage derived retinoic acid-sensitive protein (CD-RAP) (3).
Subsequent studies of murine embryos and murine adult tissues demonstrated
specific mRNA expression patterns in cartilage, but not in any other non-neoplastic
tissue (4). Functionally, MIA was initially purified and described to exert antitumor
activity by inhibiting proliferation of melanoma cell lines in vitro (5). However, further
studies revealed expression patterns inconsistent with a tumor suppressor.
Expression of the wild-type MIA protein gene was not detected in normal skin and
melanocytes but was associated with progression of melanocytic tumors. More
recently, it was suggested that the MIA protein specifically inhibits attachment of
melanoma cells to fibronectin and laminin and thereby masks the binding site of
integrins to these extracellular matrix (ECM) components and promotes invasion in
vitro (6). Additional in vivo studies revealed the importance of MIA for metastasis of
malignant melanomas (7;8). Furthermore, we and others have shown that MIA
adopts an SH3 domain-like structure and interacts directly with fibronectin (6;9).
Recently, a MIA-homologous protein, OTOR (FDP, MIAL), was identified and
mapped to chromosome 20p11. For this protein a homology of 59% to MIA was
determined. OTOR expression was reported to be highly tissue specific and
restricted to cochlea and eye (10-12). The detection of OTOR stimulated us to search
for further homologous proteins. Here we describe a novel MIA-homologue,
designated MIA2, and define its expression pattern and regulation in hepatocytes.
Interestingly, we found specific expression in the liver and mechanisms of
transcriptional regulation that identify MIA2 as a potential novel acute phase protein.
Furthermore, our analysis of the expression levels of MIA2 in patients with chronic
by guest on February 17, 2018http://w
ww
.jbc.org/D
ownloaded from
4
hepatitis C infection may suggest that MIA2 can serve as a marker of hepatic disease
activity and severity.
by guest on February 17, 2018http://w
ww
.jbc.org/D
ownloaded from
5
Experimental procedures
Cell lines and tissue culture
The following cell lines were used: Mel Im, Mel Ei, Mel Wei, SK-Mel 28, Mel Ho
(DSMZ ACC 62), HTZ-19d, Mel Ju, Mel Juso (DSMZ ACC 74) (human melanoma,
(13)), human primary melanocytes NHEM (14), HeLa (human cervix carcinoma,
ATCC CRL-7923), HepG2 (ATCC HB-8065), HCT 116 (ATCC CCL-247), CaCo-2
(ATCC HTB-37), SW48 (ATCC CCL-231), LoVo (ATCC CCL-229), SW480 (ATCC
CCL-228), HT29 (ATCC HTB-38) (human colon carcinoma cell lines), U266 (B-
lymphocytes, ATCC TIB-196), Jurkat (T-lymphocytes, ATCC TIB-152).
Cells were grown at 37°C / 5% CO2 in DMEM (Dulbecco’s modified Eagle medium;
Gibco, Eggenstein, Germany) supplemented with penicillin (100 U/ml), streptomycine
(10µg/ml) (both Sigma, Deisenhofen, Germany) and 10% fetal calf serum (Gibco)
and splitted 1:2 at confluence. Cells were detached by incubation with 0.05% trypsin,
0.04% EDTA (Sigma) in PBS for 5 minutes at 37 °C.
Primary human and murine hepatocytes, hepatic stellate cells (HSC) and Kupffer
cells were isolated from human liver specimens obtained during resection of
metastasis of non-hepatic tumors or rat livers, respectively. Exclusion criteria were
known liver disease or histological evidence for liver fibrosis or inflammation in
surrounding non-tumorous liver tissue. The cell isolation and subsequent culturing
was performed as described before (15-17). Hepatic stellate cells (HSC) were
activated by culturing on plastic for 14 days (17).
Primary human fibroblasts were isolated and cultured as described previously (18).
Stimulation of cells
HepG2 cells were treated with the following cytokines: TNF-a [10ng/ml], IL-1
[2ng/ml], IL-6 [30 ng/ml], TGF-ß1 [2 ng/ml], LPS [10µg/ml], PMA [10 nM] or with
alcohol (0.1% ethanol) (all obtained from Sigma, Deisenhofen, Germany) for 6, 16
and 32 hours.
To obtain conditioned medium of activated human HSC, the cells were seeded in T75
culture flasks (BD Biosciences, Bedford, USA) and cultured in serum free medium for
24h (12ml/ T75 flask). Some cells were additionally treated with LPS [10µg/ml] for the
24h incubation period. 12ml of pure HSC-medium or medium supplemented with LPS
[10µg/ml] were filled into empty T75 flasks and incubated in parallel for 24h to serve
by guest on February 17, 2018http://w
ww
.jbc.org/D
ownloaded from
6
as controls. Supernatants and controls were collected and saved at -70° before
stimulation of HepG2 cells. HepG2 cells were seeded in 6 well plates and incubated
with 2ml of the conditioned media for 6, 16 and 32 hours.
Patients and controls
Subjects included 11 patients (9 men, 2 women; age: 20-52 years, median: 35.5) with
chronic hepatitis C infection (positive for HCV-RNA and anti-HCV) and no prior
interferon-treatment. Exclusion criteria were coinfections with Human
Immunodeficiency Virus (HIV), Hepatitis B Virus (HBV), or other concomitant liver
disease. Liver biopsies were taken and histological staging and grading was
performed according to the score proposed by Desmet and Scheuer (19). Parts of
the biopsies were used for RNA isolation.
Human liver specimens obtained during resection of metastasis of non-hepatic
tumors served as controls. Exclusion criteria were known liver disease or histological
evidence for liver fibrosis or inflammation in surrounding non-tumorous liver tissue.
RNA was isolated from surrounding non-tumorous liver tissue.
RT-PCR analysis
For RT-PCR total cellular RNA was isolated from cultured cells, from multiple tissues
of C57BL/6 mice or from human liver tissue using the RNeasy kit (QIAGEN, Hilden,
Germany). The integrity of the RNA preparations was controlled on an 1%
agarose/formaldehyde gel and subsequently cDNAs were generated by reverse
transcription. First strand cDNA was synthesized using 2µg of the isolated total RNA,
1µg random primer (Pharmacia), 4µl 5x First Strand Buffer (Gibco), 2µl 10mM DTT,
1µl 10mM dNTPs and 1µl Superscript Plus (Gibco) in a total of 20µl. To screen for
mRNA expression semi-quantitative PCR was performed (PTC-200, Biozym) using
the primer sequences MIA2for: ATG GCA AAA TTT GGC GTT C and MIA2rev: CCT
GCC CAC AAA TCT TCC with ß-actin and GAPDH for standardization. Two µl of the
cDNA preparation were applied to the PCR reaction. The following PCR program was
used: 5min at 94°C, 32 cycles of 30sec at 94°C, 45sec at 58°C and 2min at 72°C,
final extension of 5min at 72°C. PCR products were separated on a 1.8% agarose
gel, stained with ethidium bromide and documented.
Further, MIA2 mRNA expression in primary human hepatocytes was analyzed in
comparison to the mRNA expression of alpha-1- antitrypsin (alpha1-AT), alpha 2-
by guest on February 17, 2018http://w
ww
.jbc.org/D
ownloaded from
7
macrogobulin (alpha2-MG), alpha 1-acid glycoprotein (alpha1-AG) and alpha 1
antichymotrypsin (alpha1-ACT) by semi-quantitative PCR. The following pairs of
primers were used: alpha1-AT forw: GGG AGA GAC CCT TTG AAG TCA and
alpha1-AT rev: AAG AAG ATG GCG GTG GCA T; alpha2-MG forw: CAG TGG AGA
AGG AAC AAG CG and alpha2-MG rev: TTG GTG GCA GTT TCA GGG ATA;
alpha1-AG forw: ACA CCA CCT ACC TGA ATG TCC and alpha1-AG rev: ACT CTC
CCA GTT GCT CCT TG; and alpha1-ACT forw: GCC CAT AAT ACC ACC CTG ACA
and alpha1-ACT rev: TAC AGC CTC TTG GCA TCC TC. For comparison of these
acute phase proteins and MIA-2 mRNA expression 1µl of the cDNA preparation were
applied to the PCR and the PCR program was adapted to 28 cycles.
To precisely quantify the expression of MIA2 the real-time PCR LightCycler system
(Roche) was used. For PCR 1 to 3µl cDNA preparation, 2.4 µl 25mM MgCl2, 0.5µM
of forward and reverse primer and 2µl of SybrGreen LightCycler Mix in a total of 20µl
were applied. The following PCR program was performed: 60sec 95°C (initial
denaturation); 20°C/sec temperature transition rate up to 95°C for 15 sec, 10 sec
58°C, 22sec 72°C, 10 sec 82°C acquisition mode single, repeated for 40 times
(amplification). MgCl2 concentration and annealing temperature were optimized for
each primer set. The PCR reaction was evaluated by melting curve analysis following
the manufacturer’s instructions and checking the PCR products on 1.8% agarose
gels. Each quantitative PCR was performed at least in duplicate for 2 sets of RNA
preparations.
Northern blots
Multiple Tissue Expression Arrays (Clontech) were hybridized following the
manufacturer’s description. As probes cDNA fragments of hMIA2 were
phospholabeled using a Klenow DNA polymerase-based random primer labeling kit
(Biorad, Richmond, USA).
In situ hybridization
In situ hybridization was performed as previously described (4). A 350bp fragment of
mMIA2 was cloned into pBluescript (Clontech) for riboprobe synthesis. The
riboprobes were synthesized by in vitro transcription using T7 and T3 RNA
polymerase, respectively, and labeled by incorporation of 33P-UTP.
by guest on February 17, 2018http://w
ww
.jbc.org/D
ownloaded from
8
Promoter constructs, transfections and luciferase assays
The 5’ flanking regions of the human MIA2 gene from residue -840 to -6, -707 to –6
and -218 to -6, respectively, were amplified by PCR, inserted into the plasmid pGL3-
basic (Promega) and resequenced.
2x 10⁵ cells (HepG2, fibroblasts) were seeded into each well of a 6-well plate and
transiently transfected with 1µg plasmid DNA using the lipofectamine plus method
(Gibco) following the manufacturer’s description. 24 hours after transfection the cells
were lysed and the luciferase activity in the lysate was measured. To normalize
transfection efficiency, 0.5µg of an pRL-TK plasmid (Promega) was cotransfected
and renilla luciferase activity measured by a luminometric assay (Promega).
Site-directed mutagenesis
Mutations in the 707bp human MIA2 promoter region (707mut) destroying the HNF1
binding site were introduced using a site-directed mutagenesis kit (Clontech) as
described by the manufacturer.
Gel mobility-shift assays
Complementary synthetic oligonucleotides corresponding to the HNF1 site in the
MIA2 promoter region and to the HNF1 consensus binding site (Geneka, Montreal,
Canada) were hybridized and phospholabeled (MIA2-HNF1 for: ATC CTT GTT AAT
TAT TAA ACC CTT AGG, MIA2-HNF1 rev: CCT AAG GGT TTA ATA ATT AAC AAG
GAT; HNF1_cons for: CCA GTT AAT GAT TAA CCA CTG GC; HNF1_cons rev:
GCC AGT GGT TAA TCA TTA ACT GG). Nuclear extracts were prepared from
HepG2, primary fibroblasts, Mel Im and Mel Ju cells and gel shifts were performed as
described previously (20). Competition experiments were performed using a 50-fold
excess of the same binding site, a mutated binding site (HNF1_mut for: CCA GGC
GAT GAG CGA CCA CTG GC, HNF1_mut rev: GCC AGT GGT CGC TCA TCG CCT
GG) or an unrelated binding site. Supershifting was performed using an anti-HNF1
antibody (Geneka).
by guest on February 17, 2018http://w
ww
.jbc.org/D
ownloaded from
9
Statistical analysis
Statistical numbers and results are expressed as mean ±SD. Statistical significance
between two groups was determined by using the Student’s t test. A p value <0.05
was considered statistically significant.
by guest on February 17, 2018http://w
ww
.jbc.org/D
ownloaded from
10
Results
We identified the MIA2 gene as a homologue of MIA (Melanoma Inhibitory Activity)
by a gene search. MIA2, together with MIA, OTOR and TANGO, belongs to a novel
MIA gene family sharing important structural features, including an SH3-fold domain
and two intramolecular disulfide bonds, and similar genomic organization. The four
members share 34-45% amino acid identity and 47-59% cDNA sequence identity
(figure 1A). Surprisingly, MIA2 contains an additional C-terminal region of 422 amino
acids having no homology to known proteins. MIA2 therefore encodes a mature
protein of 522 amino acids in addition to the hydrophobic secretory signal sequence
(figure 1B). Structure modeling and protein folding recognition studies confirm the
highly conserved SH3 structure in the N-terminus present also in MIA and OTOR
(which are both known to be secreted proteins).
To analyze expression patterns of MIA2, RT-PCR studies of adult human and murine
tissues and in situ hybridization of murine embryo sections were performed. In
general, RT-PCR studies with primers specific for MIA2 reveal a consistent
expression pattern for both human and murine tissues. In contrast to MIA, which is
exclusively expressed in cartilage but not in any other non-neoplastic tissue, and
OTOR, which shows a highly restricted expression pattern in cochlea, eye and
cartilage, the novel MIA related gene, MIA2, is expressed specifically in liver (table 1)
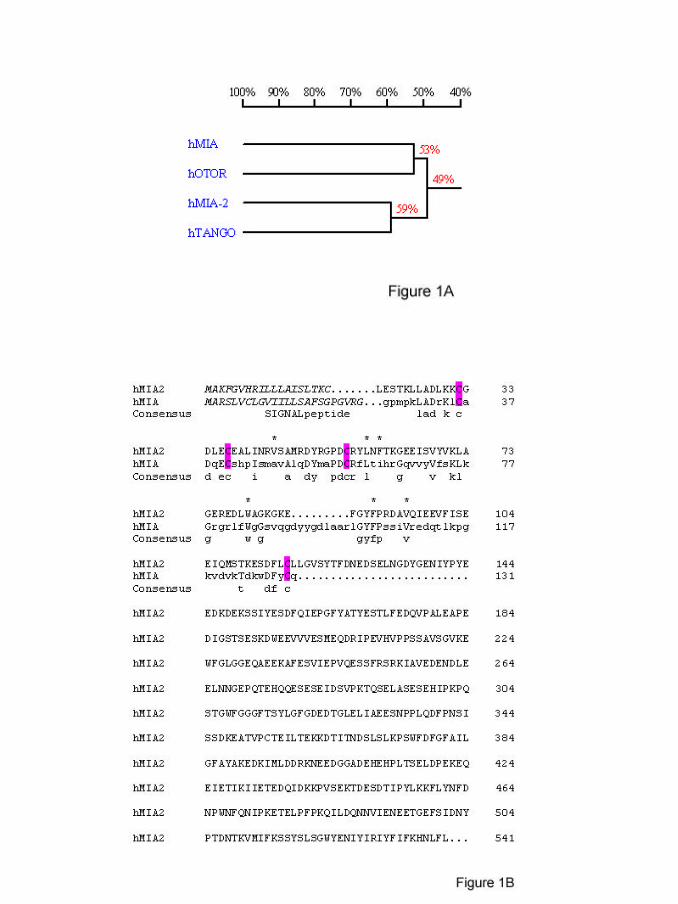
and at very low levels in testis. The RT-PCR analysis was verified by in situ
hybridization to mouse embryo sections of different embryonic stages between E12.5
and E14.5 using radiolabeled cRNA probes. Consistent with the RT-PCR strong
MIA2 expression was found in the developing liver (figure 2). Comparison between
adult and fetal (gestational day 20) murine livers revealed approximately five fold
higher MIA2 mRNA expression levels in adult liver (data not shown).
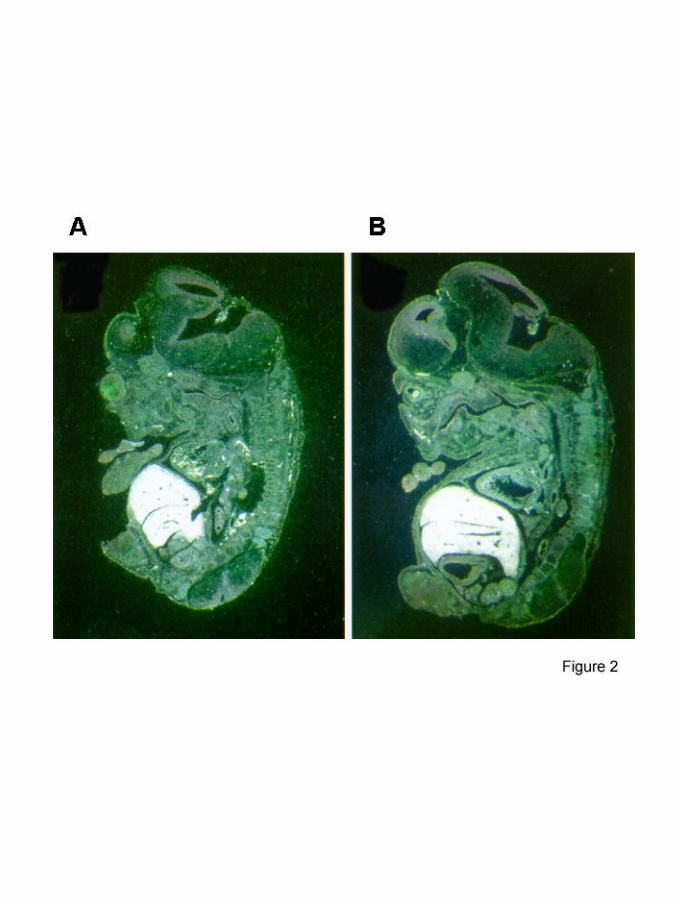
Next we analyzed parenchymal and non-parenchymal human liver cells and found
strong MIA2 expression in primary hepatocytes but not in Kupffer cells or quiescent
or activated hepatic stellate cells (figure 3A). Identical results were obtained with
murine hepatic cells (data not shown). To estimate MIA2 mRNA expression relatively
to several known acute phase proteins, semiquantitative PCR analysis was
performed using first strand cDNA from primary human hepatocytes. MIA2 mRNA
expression revealed to be lower than alpha 1 antichymotrypsin mRNA expression,
but similar as the mRNA expression of alpha-1- antitrypsin, alpha 2-macrogobulin
by guest on February 17, 2018http://w
ww
.jbc.org/D
ownloaded from
11
and alpha 1-acid glycoprotein, respectively (data not shown). Furthermore, several
tumor cell lines were studied and expression was detected only in the hepatoma cell
line HepG2 (figure 3B).
These data indicated highly specific expression of MIA2 in hepatocytes and prompted
us to further analyze the underlying gene regulatory mechanism.
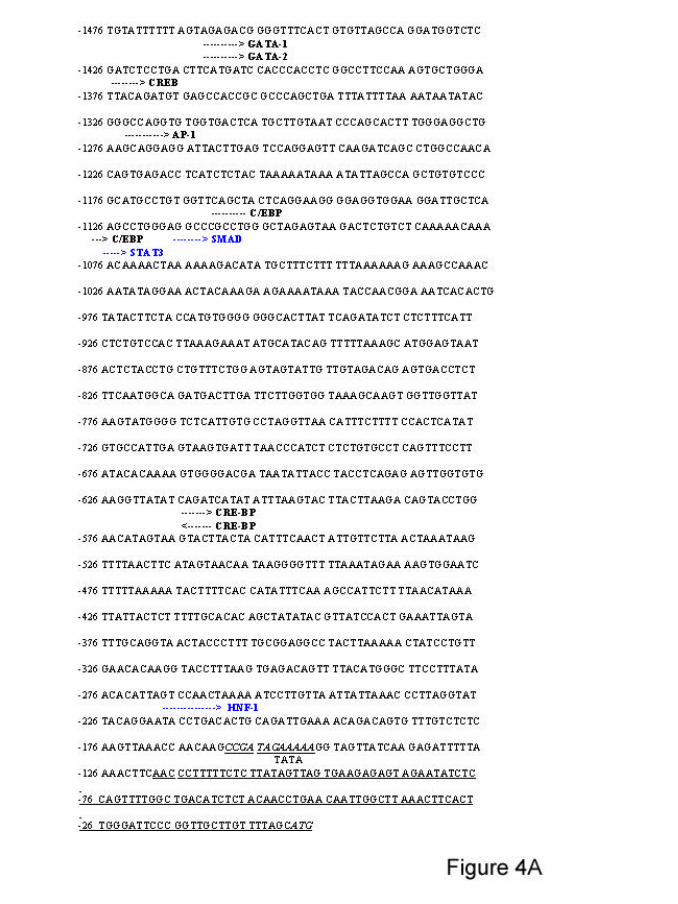
Preliminary insight into putative cis-regulatory elements of the MIA2 promoter were
obtained by data bank searches of the genomic 5’ flanking region. Analysis of
1500bp indicated several consensus binding sites for transcription factors (figure 4A).
Most importantly, a HNF1 site was found at –253 to –240 (relative to the adenine of
the start codon). Further STAT, smad, GATA-1, GATA-2, CREB and AP-1 binding
sites were localized. Gene bank search revealed EST clones identical to MIA2 with a
5’ untranslated region of -120 indicating that these sequences are indeed being
transcribed. Consistently, a consensus TATA box sequence is located 29 bases
further upstream suggesting that transcription initiation occurs at residue -120 or very
close.
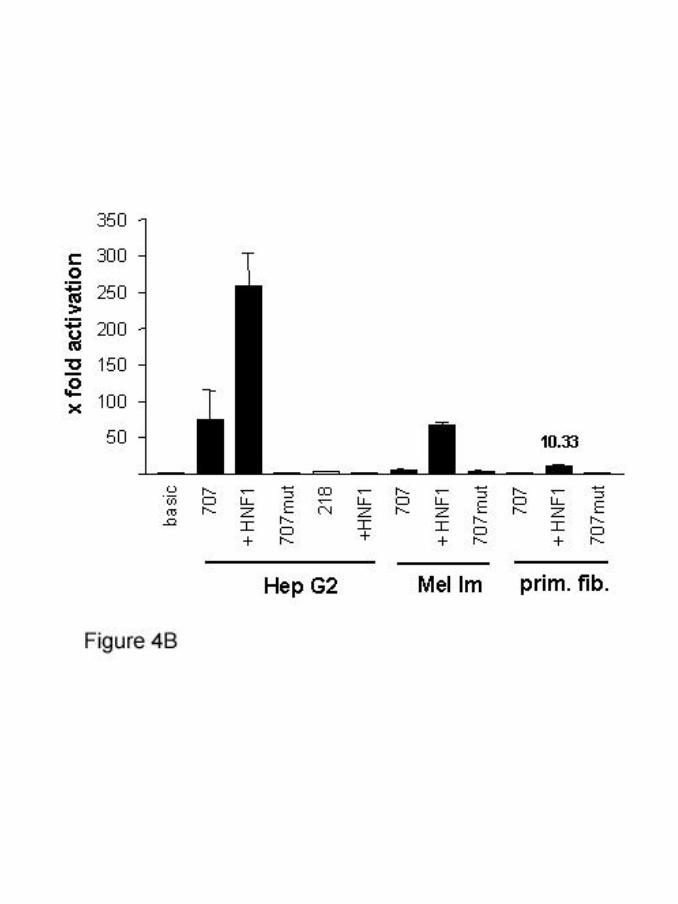
707 and 218bp of the promoter region were subcloned into pGL3-basic, a
promoterless luciferase reporter construct. Reporter gene assays revealed strong
activity of the promoter construct -707 in HepG2 cells but not in primary human
fibroblasts or melanoma cells (Mel Im) (figure 4B). Activity of the promoter could be
further enhanced in HepG2 by transfection of an HNF1 expression plasmid.
Interestingly, transfection of HNF1 into Mel Im melanoma cells and into human
fibroblasts was sufficient to significantly activate the MIA2 promoter. The 218bp
promoter construct (lacking the HNF1 site) was neither active in HepG2 cells nor
inducible by HNF1 (figure 4B). Further, mutation of the HNF1 site in the 707 reporter
construct by site directed mutagenesis entirely inactivated promoter activity in HepG2
cells.
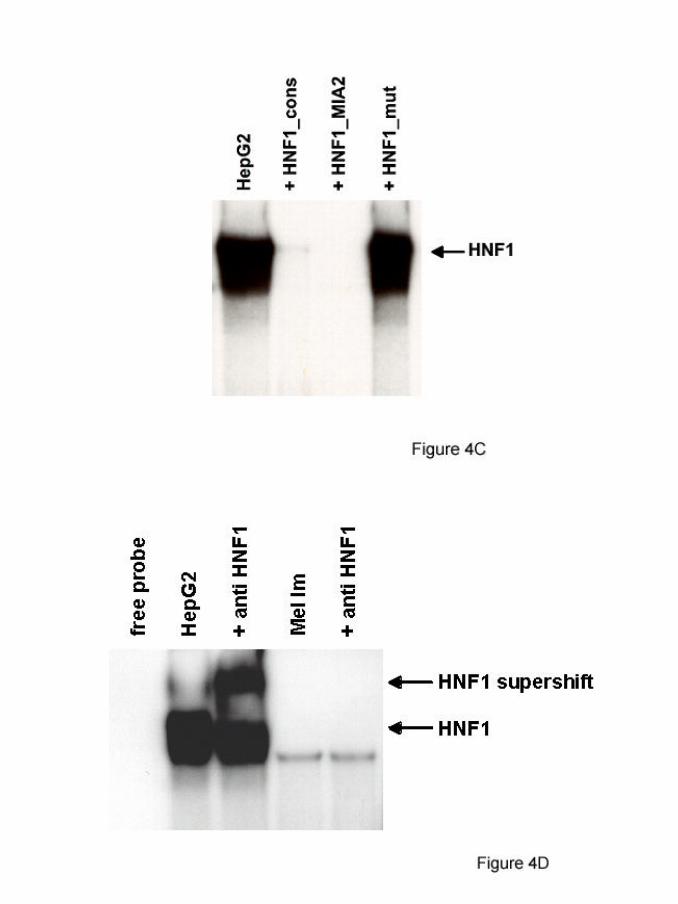
To confirm site specific binding of HNF1 to the putative binding site at –253 to –240
in the MIA2 promoter gel shift assays were performed. Binding of HNF1 present in
HepG2 nuclear extracts to a consensus HNF1 site was competed by an oligomeric
binding site spanning the HNF1 site in the MIA2 promoter (figure 4C). Additionally,
by guest on February 17, 2018http://w
ww
.jbc.org/D
ownloaded from
12
super shifting experiments using an anti-HNF1 antibody confirmed binding of HNF1
to the MIA2 promoter in HepG2 but not in Mel Im melanoma cells (figure 4D).
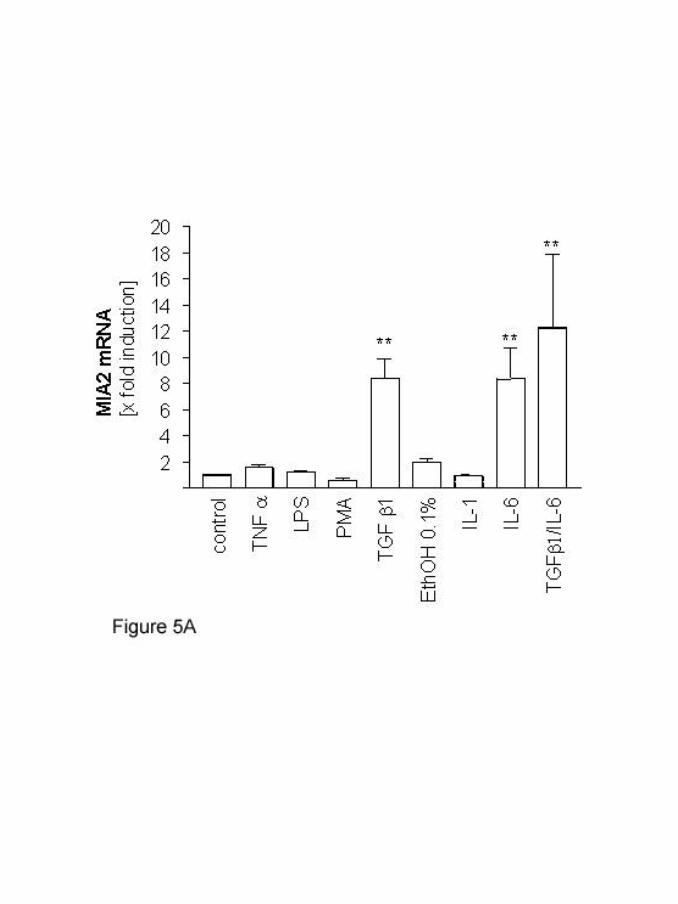
We next aimed to investigate whether cytokines, known to be elevated during liver
diseases (interleukin-1 (IL-1), interleukin-6 (IL-6), interleukin-1ß (IL-1β), tumor
necrosis factor alpha (TNFa), transforming growth factor beta1 (TGF-β1)),
lipopolysaccaride (LPS), alcohol and phorbolmyristylacetate (PMA) were also
involved in regulating hepatic MIA2 mRNA expression. Only IL-6 and TGF-ß
increased the MIA2-specific RT-PCR signal in isolated human hepatocytes and in
HepG2 cells. As measured by quantitative RT-PCR analysis, both IL-6 and TGF-ß
induced MIA2-specific mRNA approximately 8.5-fold. Combined treatment with both
cytokines even further induced MIA2- mRNA expression by approximately 12.3-fold
(figure 5A). Induction of MIA2-mRNA expression occurred already 6h after
stimulation and maximal stimulation was observed after 16h (data not shown).
Regulation of MIA2 mRNA expression by the cytokines IL-6 and TGFβ1 is in
accordance with the STAT3 (IL-6 regulation) and smad (TGF β regulation) consensus
binding sites in the MIA2 promoter. In chronic liver diseases both cytokines are
mainly expressed by activated hepatic stellate cells or activated myofibroblasts.
These cells play a major role in the pathophysiology of chronic liver disease.
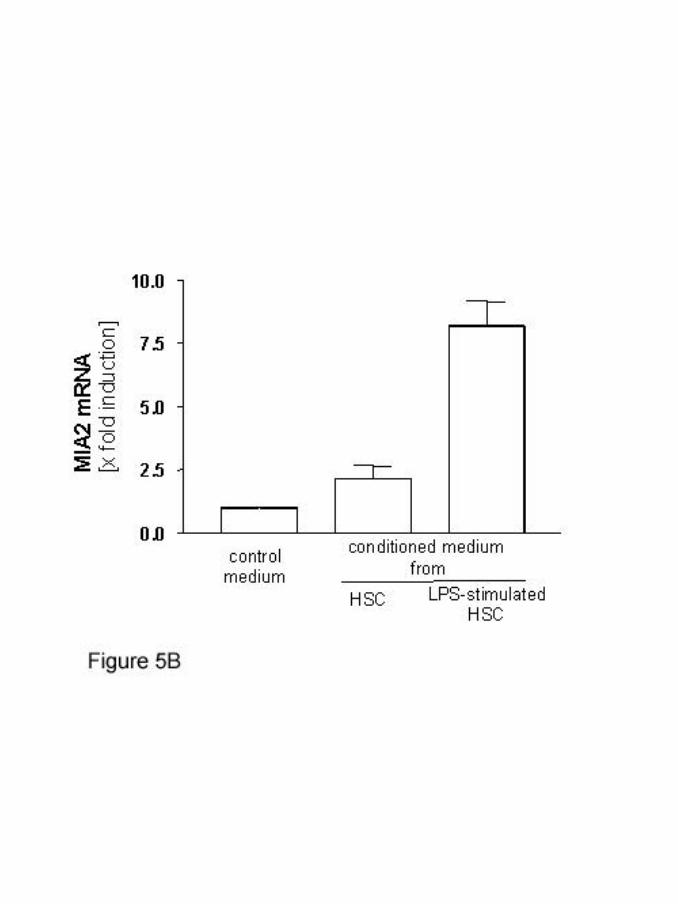
Therefore, we investigated the effect of serum-free medium conditioned by activated
human HSC. MIA2 expression in HepG2 cells was strongly stimulated by cell culture
supernatant of activated HSC pretreated with endotoxin and weakly, but still
significantly, by the supernatant from unstimulated HSC. Quantitative RT-PCR results
showed an 8.5-fold increase (2.2-fold, respectively) (figure 5B). Similarly as in
cytokine experiments, maximum of MIA2-mRNA expression was seen after 16h,
starting at 6h after stimulation with conditioned medium (data not shown).
Hepatic IL-6 and TGF-β levels are known to be elevated in chronic liver diseases. It is
known that transdifferentiation of HSC into myofibroblastic cells is occurring in
chronic liver diseases, leading to proliferation of the cells, to migration into the sites of
liver damage, and increased expression of profibrotic and proinflammatory genes,
including TGFβ and IL-6. Therefore, we analyzed the expression of MIA2 mRNA in
liver tissue of patients with chronic hepatitis C infection and various stages of fibrosis
by guest on February 17, 2018http://w
ww
.jbc.org/D
ownloaded from
13
and grading of intrahepatic inflammation. Liver tissue without histological signs of
fibrosis or inflammation from human donors without liver disease served as control.
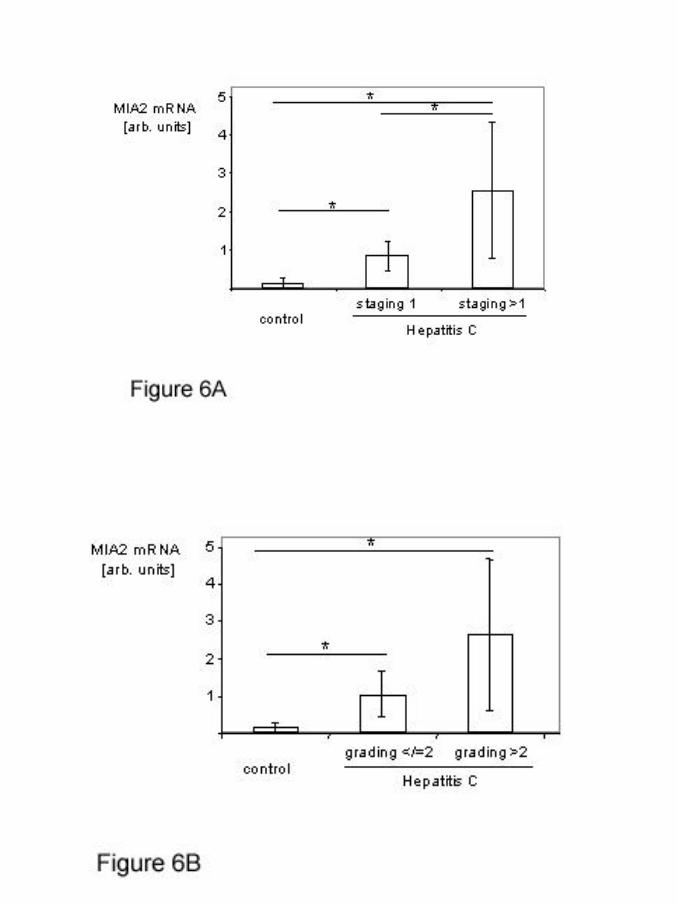
Intrahepatic MIA2 mRNA expression was found to be significantly elevated in
hepatitis C patients compared to controls (0.14±0.13 vs. 1.62±1.46, respectively;
p=0.043) (figure 6). Furthermore, hepatitis C patients with only mild, periportal
fibrosis (staging 1; n=6) had significantly lower intrahepatic MIA2 mRNA expression
than patients with more advanced fibrosis (staging>1; n=5) (0.85±0.38 vs. 2.55±1.78,
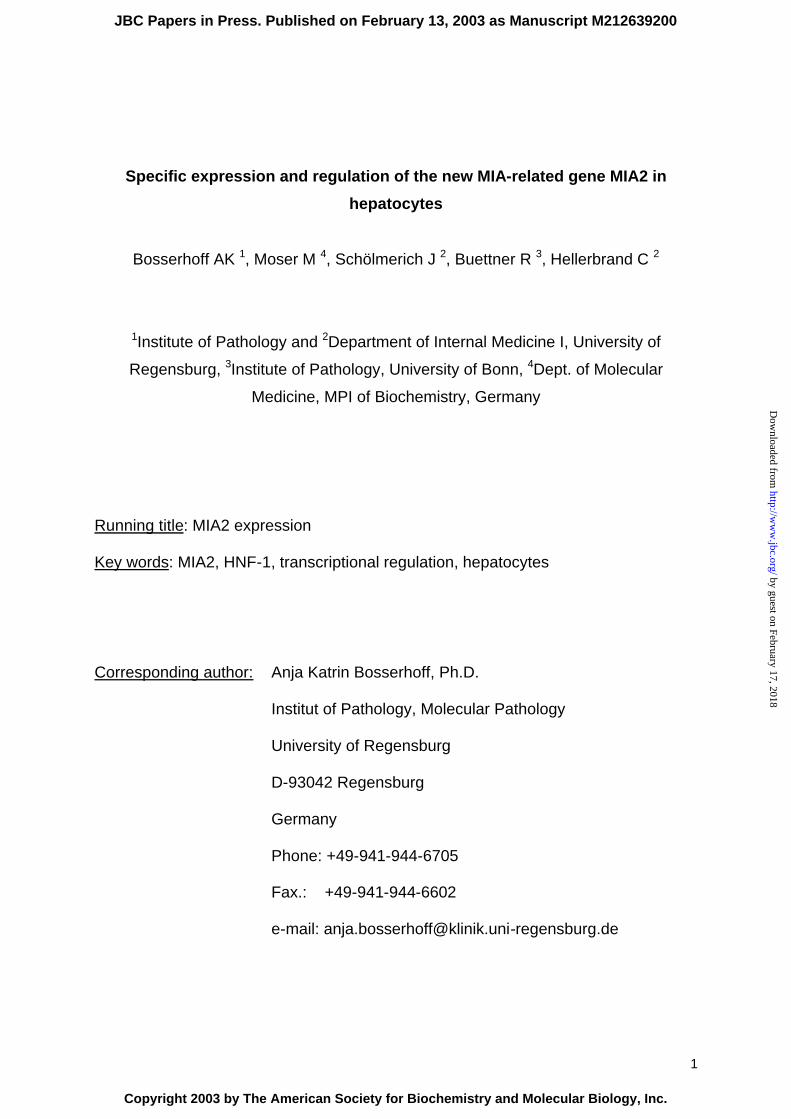
respectively; p=0.016), as summarized in figure 6A. MIA2-mRNA expression was
also lower in hepatitis C patients with little intrahepatic inflammation (grading 1 or 2),
compared to patients with severe inflammation (grading >2), however these
differences did not reach statistical significance (1.04±0.62 vs. 2.64±2.04,
respectively; p=0.027) (figure 6B).
by guest on February 17, 2018http://w
ww
.jbc.org/D
ownloaded from
14
Discussion
We identified the novel human gene MIA2 as a new member of the MIA gene family.
Further we analyzed the expression pattern and gained first insight into
transcriptional regulatory mechanisms during liver diseases.
MIA2, together with MIA, OTOR and TANGO, belongs to the novel MIA gene family
sharing important structural features, significant homology at both the nucleotide and
protein level, and similar genomic organization. MIA / OTOR and MIA2 / TANGO are
more closely related to each other than to the other MIA gene family members. Many
residues important for structural folding are conserved between the four proteins (e.g.
cystein residues, amino acids in the hydrophobic core). Therefore, it can be
speculated that all proteins belonging to the MIA gene family form an SH3 domain-
like structure which was recently identified by NMR and x-ray crystallography of MIA
(6;9). The N-terminus coding for the signal sequence is quite divergent, but analysis
by Kyte-Doolittle blots revealed conservation of the hydrophobic character which is
functionally important.
In contrast to MIA, which is exclusively expressed in cartilage but not in any other
non-neoplastic tissue, and OTOR, which shows a highly restricted expression pattern
in cochlea, eye and cartilage, the novel MIA related gene MIA2 is expressed
specifically in hepatocytes. The RT-PCR analysis was verified by in situ hybridization
to mouse embryo sections of different embryonic stages between E12.5 and E14.5
using radiolabeled cRNA probes. Consistent with the RT-PCR data, MIA2 expression
is restricted to hepatocytes also during development. Further, no mRNA expression
of MIA2 was detected in cartilage indicating that the four members of the MIA gene
family differ entirely with respect to their expression patterns.
To analyze transcriptional regulation luciferase reporter gene constructs containing
portions of the 5'-flanking region including a HNF1 binding site were transfected into
HepG2 cells, melanoma cells and primary fibroblasts. Our results clearly show the
importance of the HNF-1 binding site for the exclusive expression of MIA2 mRNA in
hepatocytes.
by guest on February 17, 2018http://w
ww
.jbc.org/D
ownloaded from

15
HNF-1 is a transcription factor that is expressed in liver, digestive tract, pancreas,
and kidney (21) and is involved in the regulation of a large number of hepatic genes
including albumin, fibrinogen, or a1-antitrypsin. It has been previously reported that
liver injury, chronic liver disease or conditions associated with liver damage as
elevated endotoxin levels lead to a downregulation of HNF-1 activity (22-24). It is
further interesting to note that several genes that contain a functional HNF-1 binding
sequence are downregulated during host response to infection or inflammation (25-
27). However, hepatic MIA2 mRNA was found to be increased in patients with
chronic hepatitis C infection. Furthermore, MIA2 transcription was even further
elevated in liver tissue with severe fibrosis or inflammation. Our findings indicate that
HNF-1 expression is required for basal expression but may be less important for
enhanced transcriptional regulation in liver diseases.
Here, in accordance with STAT3 and smad consensus binding sites in the MIA2
promoter, IL-6 and TGF-β were identified as activators of MIA2 transcription, whereas
other cytokines did not lead to enhancement of MIA2 expression.
The cytokine IL-6 is required for liver regeneration and repair and upregulates
transcriptionally a vast array of genes during liver regeneration and repair (28-30). IL-
6 induces DNA-binding of STAT transcription factors on regulatory elements of target
genes. Although MIA2 is expressed constitutively in hepatocytes, its transcription was
significantly increased during IL-6 stimulation.
Transforming growth factor-beta (TGF-β) has pleiotropic functions including
fibrinogenic action leading to transdifferentiation of HSC and negative regulation of
proliferation and induction of apoptosis (31).
Interestingly, we found a synergistic effect of IL-6 and TGF-β stimulation on MIA
expression in HepG2 cells. The cross-talk between IL-6 and TGF-β signaling
pathways in a human hepatoma cell line was elucidated in a recent study (32),
demonstrating that IL-6-induced activation of STAT3 activity and STAT3-mediated
gene expression was augmented by TGF-β. These activities were due to physical
interactions between STAT3 and Smad- and MAD-related protein-3, bridged by p300.
As the consensus binding sites for STAT3 and smad are in direct proximity in the
MIA2 promoter we speculate that a similar mechanism for induction of MIA2
expression may be involved.
by guest on February 17, 2018http://w
ww
.jbc.org/D
ownloaded from
16
Our results indicate that different classes of transcription factors, tissue specific
(HNF-1) and growth or stress induced (STAT3 and smad) may interact during acute
phase reaction or as an adaptive response to liver injury to amplify expression of the
MIA2 gene, as demonstrated for other genes such as insulin-like growth factor
binding protein 1 (IGFBP-1) (33).
STAT and smad pathways are known to be involved in pathogenesis of liver fibrosis
and inflammation and elevated systemic and intrahepatic levels of IL-6 and TGF-β
were found in acute and chronic liver diseases (30;31). The activation process of
HSC, causing transdifferentiation of the physiologically quiescent cells to an activated
myofibroblast like cell type, is one of the key events of hepatic fibrosis. In healthy liver
or acute liver damage, Kupffer cells, the resident hepatic macrophages, are the main
modulators of inflammation, secreting mainly TNF or IL-1. However, already early
during liver disease activation of HSC occurs, leading to their participation in the
regulation of the hepatic inflammatory response (31). Both cytokines, IL-6 and TGF-β
are expressed by activated, but not quiescent, hepatic stellate cells (HSC).
Consequently, we found strong induction of MIA2 expression in HepG2 cells
incubated with conditioned medium of activated HSC, particularly when HSC had
been challenged with endotoxin. These results strongly suggest that activated HSC
may also in vivo participate at least in part in the regulation of intrahepatic MIA2
expression. It is tempting to speculate, that MIA2 expression may correlate with the
activation process of these cells, allowing the use of MIA2 as a marker for fibrosis.
Furthermore, transcriptional regulation and mRNA expression data indicating that
MIA2 is an abundantly expressed gene, render MIA2 to be a relevant acute phase
protein.
In summary, our data identify MIA2 as a potential novel acute phase protein,
secreted specifically from hepatocytes. Transcriptional regulation by IL-6, TGF-β and
conditioned medium from activated HSC, and increased expression in fibrotic or
inflamed liver tissue indicates that MIA2 may play a role in the pathophysiology of
liver diseases and may serve as marker of liver damage. Here it is tempting to
speculate that in analogy to MIA, MIA-2 regulates attachment to extracellular matrix
molecules in liver similar to MIA in cartilage. Further experiments need to address the
by guest on February 17, 2018http://w
ww
.jbc.org/D
ownloaded from
17
question of whether MIA2 interacts with the same peptide epitopes as MIA and exerts
the same functions in regulation of cell attachment.
by guest on February 17, 2018http://w
ww
.jbc.org/D
ownloaded from
18
Acknowledgements
We are indebted to Jacqueline Schlegel, Astrid Hamm, Sandra Dahmen, Janine
Muyers, Nicole Krott and Claudia Abschlag for technical assistance, to Wolfgang
Thasler for providing human hepatocytes and human liver tissue, to Matthias Froh for
providing Kupffer cells, and to Gerd Kullak-Ublick for providing the HNF1 construct.
This work was supported by grants from the DFG to A.B. and C.H. .
by guest on February 17, 2018http://w
ww
.jbc.org/D
ownloaded from
19
References
1. Bogdahn, U., Apfel, R., Hahn, M., Gerlach, M., Behl, C., Hoppe, J., and Martin,
R. (1989) Cancer Res. 49, 5358-5363
2. Koehler, M. R., Bosserhoff, A., von Beust, G., Bauer, A., Blesch, A., Buettner,
R., Schlegel, J., Bogdahn, U., and Schmid, M. (1996) Genomics 35, 265-267
3. Dietz, U. H. and Sandell, L. J. (1996) J.Biol.Chem. 271, 3311-3316
4. Bosserhoff, A. K., Kondo, S., Moser, M., Dietz, U. H., Copeland, N. G., Gilbert,
D. J., Jenkins, N. A., Buettner, R., and Sandell, L. J. (1997) Dev.Dyn. 208, 516-
525
5. Blesch, A., Bosserhoff, A. K., Apfel, R., Behl, C., Hessdoerfer, B., Schmitt, A.,
Jachimczak, P., Lottspeich, F., Buettner, R., and Bogdahn, U. (1994) Cancer
Res. 54, 5695-5701
6. Stoll, R., Renner, C., Zweckstetter, M., Bruggert, M., Ambrosius, D., Palme, S.,
Engh, R. A., Golob, M., Breibach, I., Buettner, R., Voelter, W., Holak, T. A., and
Bosserhoff, A. K. (2001) EMBO J. 20, 340-349
7. Guba, M., Bosserhoff, A. K., Steinbauer, M., Abels, C., Anthuber, M., Buettner,
R., and Jauch, K. W. (2000) Br.J.Cancer 83, 1216-1222
8. Bosserhoff, A. K., Echtenacher, B., Hein, R., and Buettner, R. (2001) Melanoma
Res. 11, 417-421
9. Lougheed, J. C., Holton, J. M., Alber, T., Bazan, J. F., and Handel, T. M. (2001)
Proc.Natl.Acad.Sci.U.S.A 98, 5515-5520
10. Rendtorff, N. D., Frodin, M., Attie-Bitach, T., Vekemans, M., and Tommerup, N.
(2001) Genomics 71, 40-52
11. Robertson, N. G., Heller, S., Lin, J. S., Resendes, B. L., Weremowicz, S., Denis,
C. S., Bell, A. M., Hudspeth, A. J., and Morton, C. C. (2000) Genomics 66, 242-
248
by guest on February 17, 2018http://w
ww
.jbc.org/D
ownloaded from
20
12. Cohen-Salmon, M., Frenz, D., Liu, W., Verpy, E., Voegeling, S., and Petit, C.
(2000) J.Biol.Chem. 275, 40036-40041
13. Jacob, K., Wach, F., Holzapfel, U., Hein, R., Lengyel, E., Buettner, R., and
Bosserhoff, A. K. (1998) Melanoma Res. 8, 211-219
14. Jacob, K., Bosserhoff, A. K., Wach, F., Knuchel, R., Klein, E. C., Hein, R., and
Buettner, R. (1995) Int.J.Cancer 60, 668-675
15. Schlott, T., Thasler, W., Gorzel, C., Pahernike, S., Brinck, U., Eiffert, H., and
Droese, M. (2002) Anticancer Res. 22, 1545-1551
16. Wheeler, M. D., Yamashina, S., Froh, M., Rusyn, I., and Thurman, R. G. (2001)
J.Leukoc.Biol. 69, 622-630
17. Hellerbrand, Wang, S. C., Tsukamoto, H., Brenner, D. A., and Rippe, R. A.
(1996) Hepatology 24, 670-676
18. Wach, F., Bosserhoff, A., Kurzidym, U., Nowok, K., Landthaler, M., and Hein, R.
(1998) Skin Pharmacol.Appl.Skin Physiol 11, 43-51
19. Desmet, V. J., Gerber, M., Hoofnagle, J. H., Manns, M., and Scheuer, P. J.
(1994) Hepatology 19, 1513-1520
20. Bosserhoff, A. K., Hein, R., Bogdahn, U., and Buettner, R. (1996) J.Biol.Chem.
271, 490-495
21. Cereghini, S. (1996) FASEB J. 10, 267-282
22. Ninomiya, T., Hayashi, Y., Saijoh, K., Ohta, K., Yoon, S., Nakabayashi, H.,
Tamaoki, T., Kasuga, M., and Itoh, H. (1996) J.Hepatol. 25, 445-453
23. Trauner, M., Arrese, M., Lee, H., Boyer, J. L., and Karpen, S. J. (1998)
J.Clin.Invest 101, 2092-2100
24. Burke, P. A., Luo, M., Zhu, J., Yaffe, M. B., and Forse, R. A. (1996) Surgery
120, 374-380
25. Gabay, C. and Kushner, I. (1999) N.Engl.J.Med. 340, 448-454
by guest on February 17, 2018http://w
ww
.jbc.org/D
ownloaded from
21
26. Navasa, M., Gordon, D. A., Hariharan, N., Jamil, H., Shigenaga, J. K., Moser,
A., Fiers, W., Pollock, A., Grunfeld, C., and Feingold, K. R. (1998) J.Lipid Res.
39, 1220-1230
27. Memon, R. A., Bass, N. M., Moser, A. H., Fuller, J., Appel, R., Grunfeld, C., and
Feingold, K. R. (1999) Biochim.Biophys.Acta 1440, 118-126
28. Cressman, D. E., Greenbaum, L. E., DeAngelis, R. A., Ciliberto, G., Furth, E. E.,
Poli, V., and Taub, R. (1996) Science 274, 1379-1383
29. Kovalovich, K., DeAngelis, R. A., Li, W., Furth, E. E., Ciliberto, G., and Taub, R.
(2000) Hepatology 31, 149-159
30. Streetz, K. L., Wustefeld, T., Klein, C., Manns, M. P., and Trautwein, C. (2001)
Cell Mol.Biol.(Noisy.-le-grand) 47, 661-673
31. Gressner, A. M., Weiskirchen, R., Breitkopf, K., and Dooley, S. (2002) Front
Biosci. 7, d793-d807
32. Yamamoto, T., Matsuda, T., Muraguchi, A., Miyazono, K., and Kawabata, M.
(2001) FEBS Lett. 492, 247-253
33. Leu, J. I., Crissey, M. A., Leu, J. P., Ciliberto, G., and Taub, R. (2001) Mol.Cell
Biol. 21, 414-424
by guest on February 17, 2018http://w
ww
.jbc.org/D
ownloaded from
22
Figure legends
Figure 1: Comparison of human MIA, OTOR, MIA2 and TANGO cDNA
sequences and MIA2 protein sequence.
(A) Homology between the MIA gene family members on cDNA level
shown as a phylogenetic tree. The tree was constructed using the
program DNAman based on the alignment of the complete cDNA
sequence.
(B) Sequence of MIA2 protein in comparison to MIA. Conserved cystein
residues are labeled with a box. Residues marked with a star (*) are
important for the hydrophobic core of the SH3 domain. The
hydrophobic signal peptide is indicated by italics.
Figure 2: In situ hybridization of mouse embryos.
Embryo sections shown in A (E12.5) and B (E14.5) were hybridized
with a MIA2 antisense RNA-probe. Only results of antisense riboprobe
hybridization are shown, as sense controls were entirely negative. Dark
field illumination reveals very strong white hybridization signals in liver.
Figure 3: Analysis of MIA2 expression by RT-PCR
(A) RT-PCR specific for MIA2 revealed strong expression in primary
human hepatocytes (ph Hepatocytes) of two different donors (I and
II). B- (U266) or T- lymphocytes (Jurkat), quiescent (Q-HSC) and
activated hepatic stellate cells (A-HSC) were MIA2 negative.
Stimulation of HSC cells with TNF did not induce MIA2 expression.
(B) RT-PCR analysis for MIA2 expression in a panel of different human
tumor cells showed strong expression in HepG2 cells but not in
melanoma (Mel Ho, HTZ19d, Mel Juso, Mel Ju, SK Mel 28, SK Mel
3, Mel Im, Mel Wei, Mel Ei) or colon carcinoma cell lines (CaCo-2,
HCT116, SW48, LoVo, SW480, HT29). Further human primary
melanocytes (NHEM) were tested and revealed to be negative.
by guest on February 17, 2018http://w
ww
.jbc.org/D
ownloaded from
23
Figure 4: Regulation of MIA2 promoter activity
(A) Sequence of the 5’ flanking region of the MIA2 gene. Consensus
binding sites for GATA-1 and –2, CREB, AP1, C/EBP, STAT3,
smad, CRE-BP and HNF-1 are underlined and printed in boldface.
Further a TATA box is located 29bp upstream of the transcription
initiation site at –120bp. The transcribed sequence is underlined, the
ATG translation start codon is marked in italics.
(B) 707bp of the MIA2 promoter were cloned into pGL3-basic and
conferred significant luciferase activity in HepG2 cells but not in
melanoma cells (Mel Im) and primary fibroblasts. In all cell types the
promoter activity was induced by co-transfecting an HNF1
expression plasmid. Mutation of the HNF1 site in the MIA2 promoter
(707mut) led to loss of promoter activity in HepG2 cells. Further,
deletion of the promoter to 218bp without the HNF1 binding site,
also inactivated entirely promoter activity in HepG2 cells and the
construct was not activated by coexpression of HNF1.
(C) Gel shift assays with the HNF1 site of the MIA2 promoter and
HepG2 nuclear extracts. Binding was competed specifically by an
HNF1 consensus binding site (HNF1_cons) and by the HNF1 site
present in the MIA2 promoter (HNF1_MIA2) but not by an oligo with
a mutated HNF1 binding site (HNF1_mut).
(D) Supershift experiment with an anti-HNF1 antibody. The antibody
supershifted an HNF1 bandshift in HepG2 nuclear extract but not in
Mel Im extract.
Figure 5: Regulation of MIA2 expression by cytokines
(A) Real-time RT-PCR measurements of MIA2 mRNA expression after
stimulation with TNF a, LPS, PMA, ethanol, IL-1, TGF-ß1, IL-6 and
the combination of both TGF-ß1 and IL-6. (**: p<0.01)
(B) Conditioned medium of activated hepatic stellate cells cultured in
the absence or presence of endotoxin was used to stimulate HepG2
cells, revealing a strong induction of MIA2 mRNA expression as
measured by real-time RT-PCR.
by guest on February 17, 2018http://w
ww
.jbc.org/D
ownloaded from
24
Figure 6: Hepatic MIA2 mRNA expression in patients with chronic hepatitis
C infection
MIA2 mRNA levels were measured by quantitative RT-PCR in liver
biopsies of patients with chronic hepatitis C infection and control
samples of patients without histological signs of liver damage or known
liver disease.
(A) Compares Hepatitis C patients with mild periportal fibrosis (staging
1) and severe fibrosis or cirrhosis (staging >1) and controls. (*:
p<0.05)
(B) Compares Hepatitis C patients with only mild inflammation (grading
1 or 2) and more severe inflammation (grading >2) and controls. (*:
p<0.05)
by guest on February 17, 2018http://w
ww
.jbc.org/D
ownloaded from
25
Tables
Tissue MIA MIA2
human murine human murine
Lung - - - -
Liver - - ++ ++
Kidney - - - -
Colon - - - -
Skin - - n.d. -
Bone - - - -
Cartilage ++ ++ - -
Uterus - - - -
Fat - - n.d. -
Heart - - - -
Brain - - - -
Spleen - - - -
Thymus - - - -
Muscle - - - -
Testis - - + +
Cochlea - - n.d. n.d.
Trachea ++ n.d. - n.d.
Prostate - n.d. - n.d.
Small intestine - - - n.d.
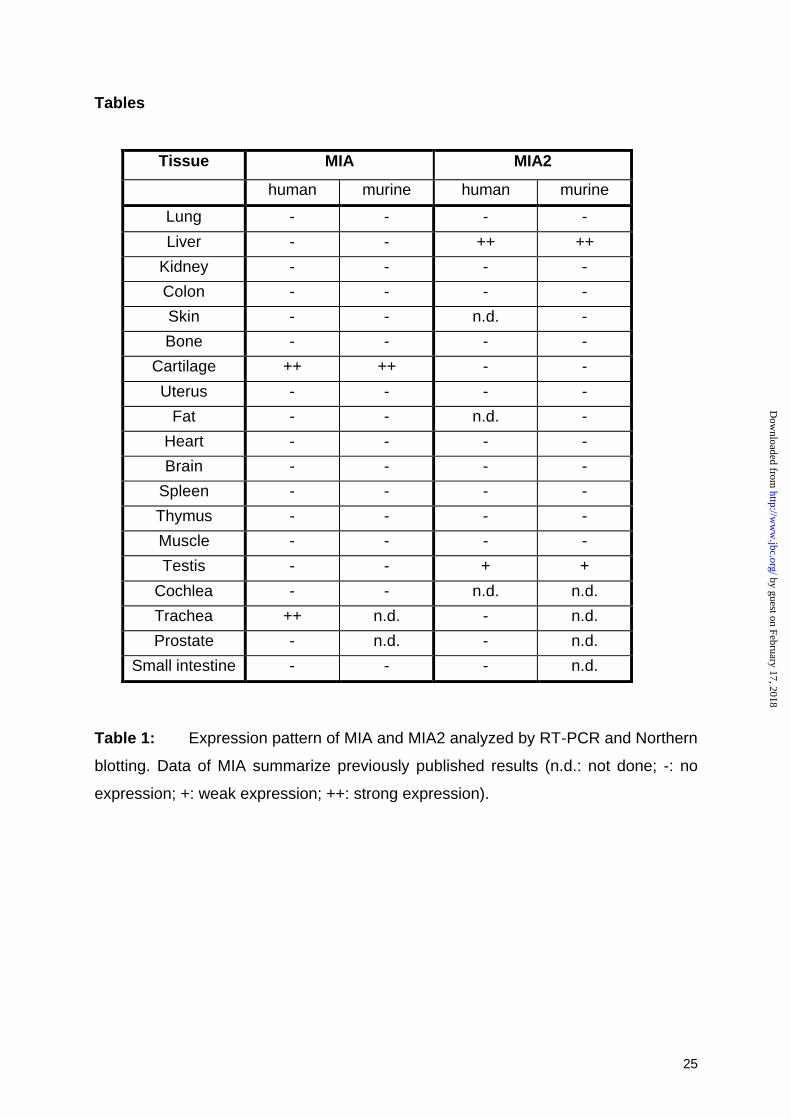
Table 1: Expression pattern of MIA and MIA2 analyzed by RT-PCR and Northern
blotting. Data of MIA summarize previously published results (n.d.: not done; -: no
expression; +: weak expression; ++: strong expression).
by guest on February 17, 2018http://w
ww
.jbc.org/D
ownloaded from
Claus HellerbrandAnja K. Bosserhoff, Markus Moser, Juergen Schoelmerich, Reinhard Buettner and
hepatocytesSpecific expression and regulation of the new MIA-related gene MIA2 in
published online February 13, 2003J. Biol. Chem.
10.1074/jbc.M212639200Access the most updated version of this article at doi:
Alerts:
When a correction for this article is posted•
When this article is cited•
to choose from all of JBC's e-mail alertsClick here
by guest on February 17, 2018http://w
ww
.jbc.org/D
ownloaded from