Embed Size (px)
Citation preview
01/10/11 Bar Graphs, Histograms, and Misleading Graphs
Today’s Plan:-Warm-Up & Correct Homework-Bar Graphs and Histograms-Misleading Graphs
Learning Target: I will read and create a bar graphs and histograms. I will describe misleading graphs.
Warm Up
1. How many students say oranges are their favorite?
2. What is the least popular fruit?
3. How many students answered the survey?
40
kiwi
90
Use the graph for problems 1-3
01/10/11 Bar Graphs, Histograms, and Misleading Graphs
Today’s Plan:-Warm-Up & Correct Homework-Bar Graphs and Histograms-Misleading Graphs
Learning Target: I will read and create a bar graphs and histograms. I will describe misleading graphs.
Correct Homework
Page16 #2, 4,5,6,9,11
01/10/11 Bar Graphs, Histograms, and Misleading Graphs
Today’s Plan:-Warm-Up & Correct Homework-Bar Graphs and Histograms-Misleading Graphs
Learning Target: I will read and create a bar graphs and histograms. I will describe misleading graphs.
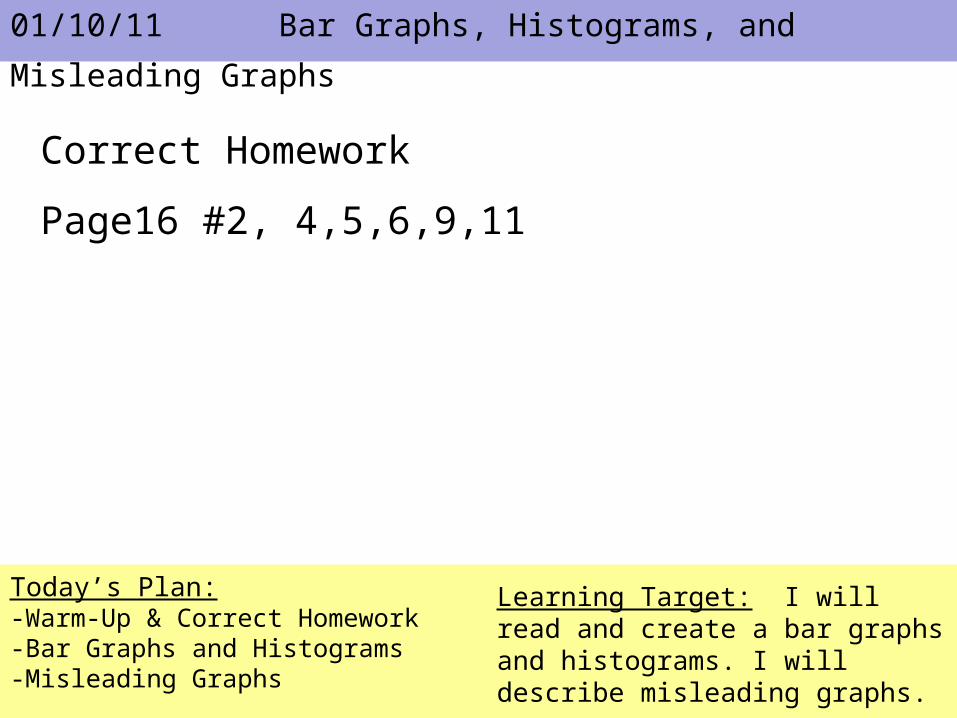
How are bar graphs and histograms different?N
umbe
r of
Stu
dent
s
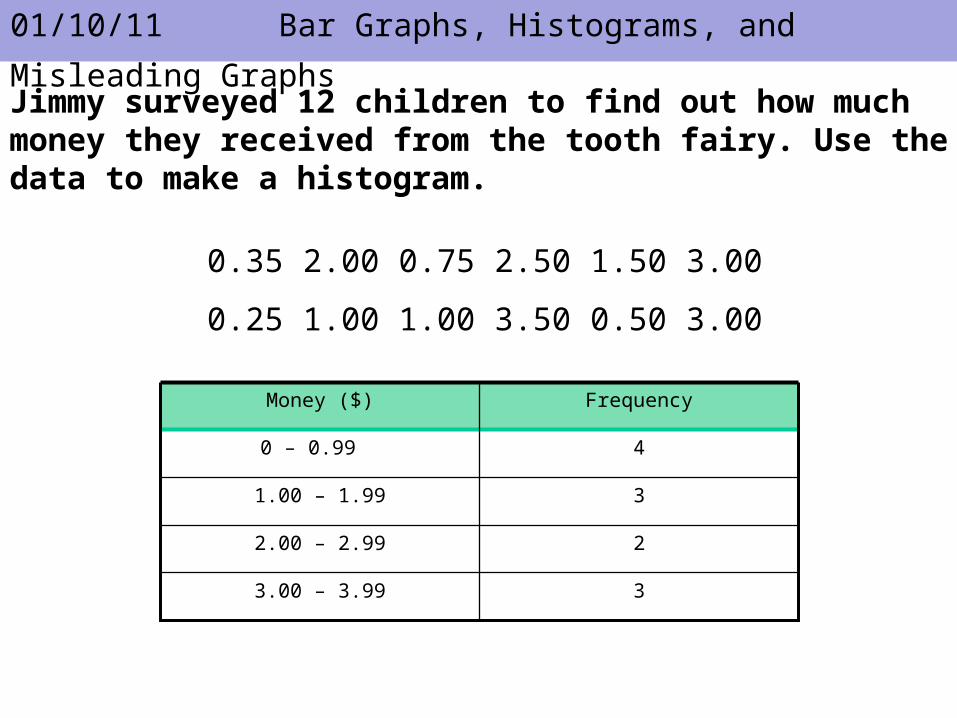
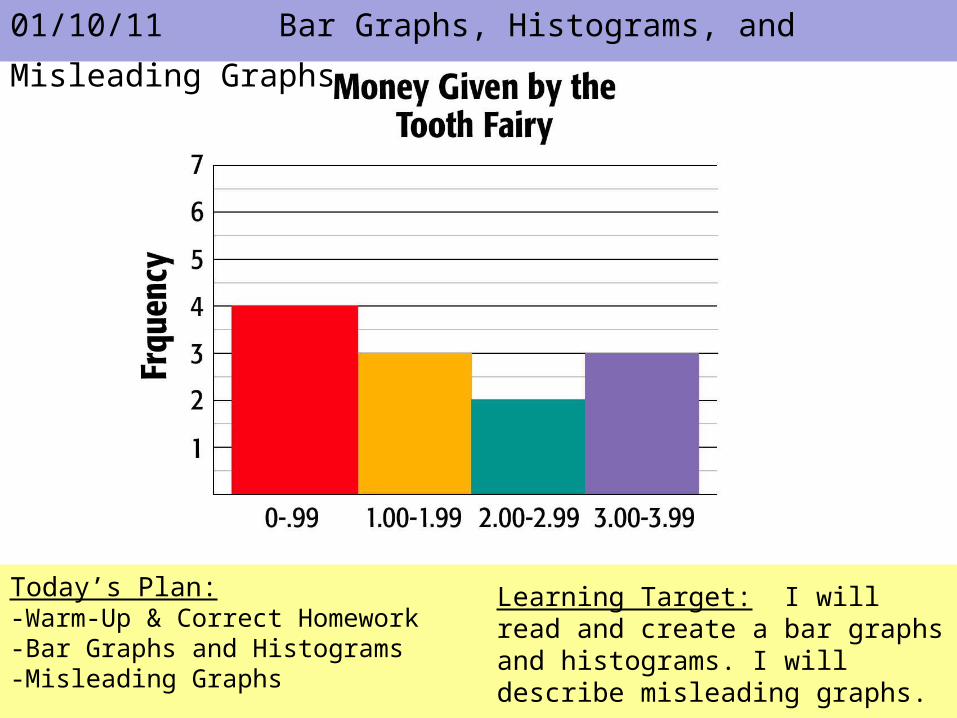
Jimmy surveyed 12 children to find out how much money they received from the tooth fairy. Use the data to make a histogram.
0.35 2.00 0.75 2.50 1.50 3.00
0.25 1.00 1.00 3.50 0.50 3.00
33.00 – 3.99
22.00 – 2.99
31.00 – 1.99
40 – 0.99
FrequencyMoney ($)
01/10/11 Bar Graphs, Histograms, and Misleading Graphs
01/10/11 Bar Graphs, Histograms, and Misleading Graphs
Today’s Plan:-Warm-Up & Correct Homework-Bar Graphs and Histograms-Misleading Graphs
Learning Target: I will read and create a bar graphs and histograms. I will describe misleading graphs.
01/10/11 Bar Graphs, Histograms, and Misleading Graphs
Today’s Plan:-Warm-Up & Correct Homework-Bar Graphs and Histograms-Misleading Graphs
Learning Target: I will read and create a bar graphs and histograms. I will describe misleading graphs.
Bar Graph and Histogram Worksheet (2 sides)
Use a ruler or straight edge
Color or shade your graph bars
01/10/11 Bar Graphs, Histograms, and Misleading Graphs
Today’s Plan:-Warm-Up & Correct Homework-Bar Graphs and Histograms-Misleading Graphs
Learning Target: I will read and create a bar graphs and histograms. I will describe misleading graphs.
Misleading Graphs & Statistics
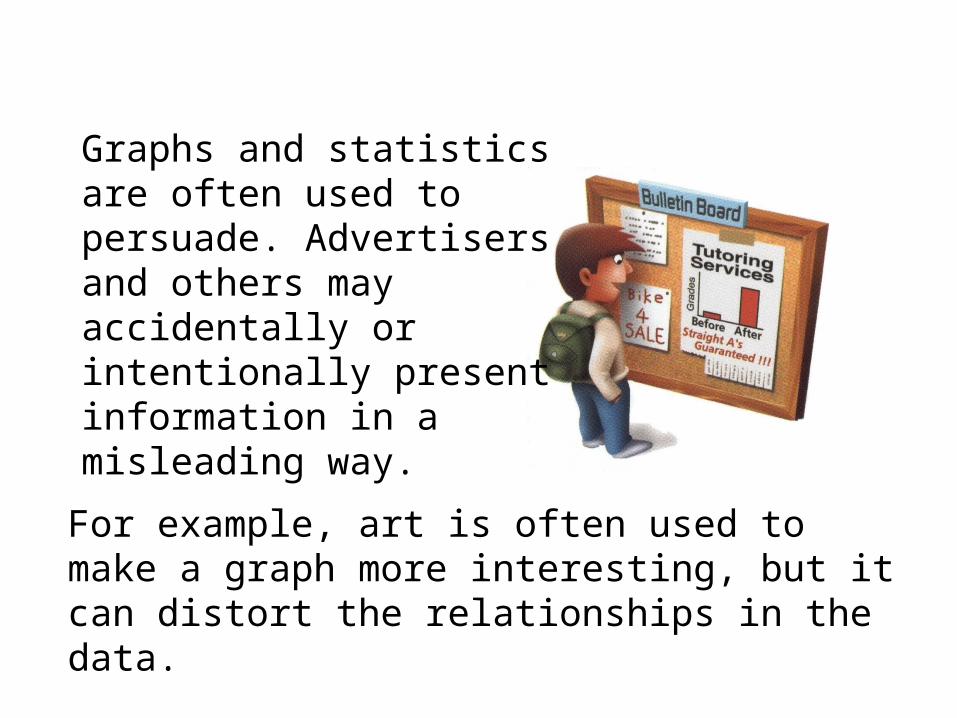
For example, art is often used to make a graph more interesting, but it can distort the relationships in the data.
Graphs and statistics are often used to persuade. Advertisers and others may accidentally or intentionally present information in a misleading way.

Additional Example 1A: Identifying Misleading Graphs
Explain why each graph is misleading.
A. The graph suggests that the stock will continue to increase through 2020, but there’s no way to foresee the future.
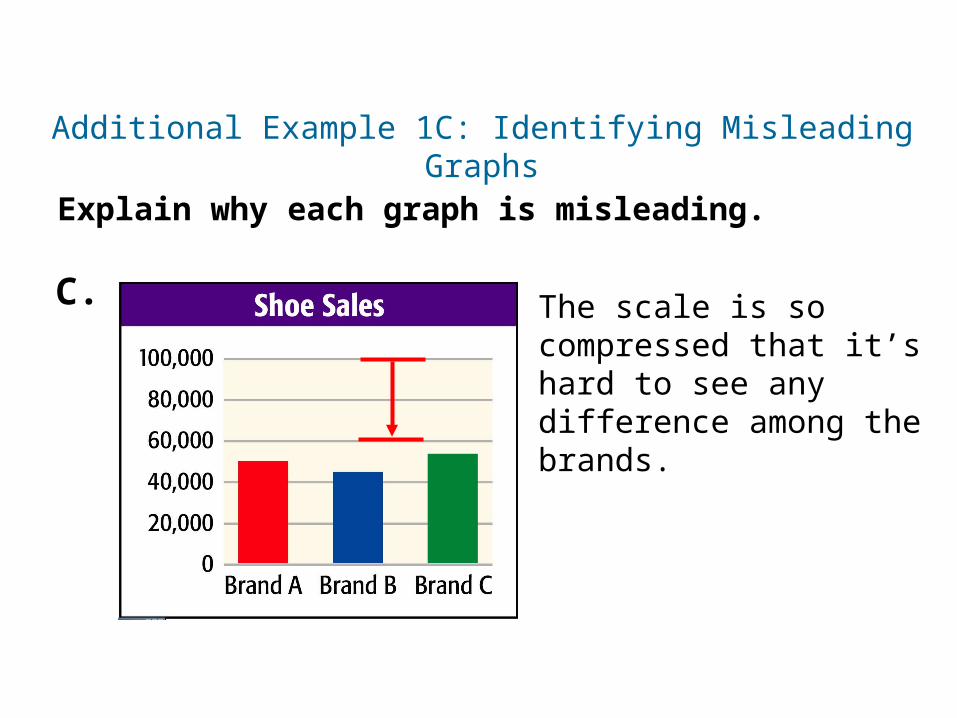
Additional Example 1C: Identifying Misleading Graphs
Explain why each graph is misleading.
The scale is so compressed that it’s hard to see any difference among the brands.
C.
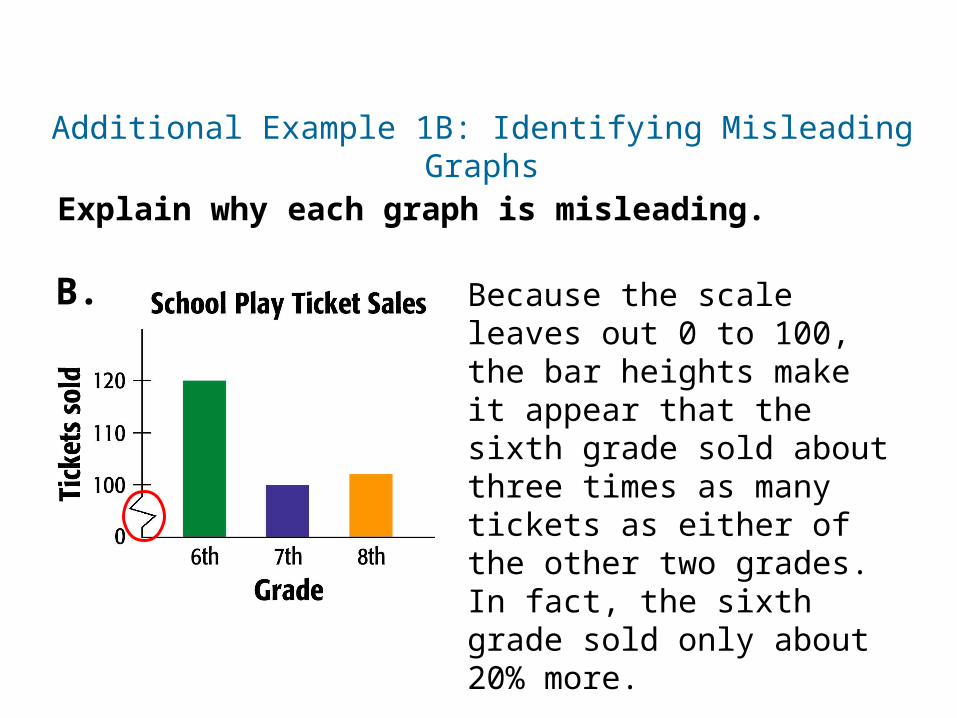
Additional Example 1B: Identifying Misleading Graphs
Explain why each graph is misleading.
Because the scale leaves out 0 to 100, the bar heights make it appear that the sixth grade sold about three times as many tickets as either of the other two grades. In fact, the sixth grade sold only about 20% more.
B.
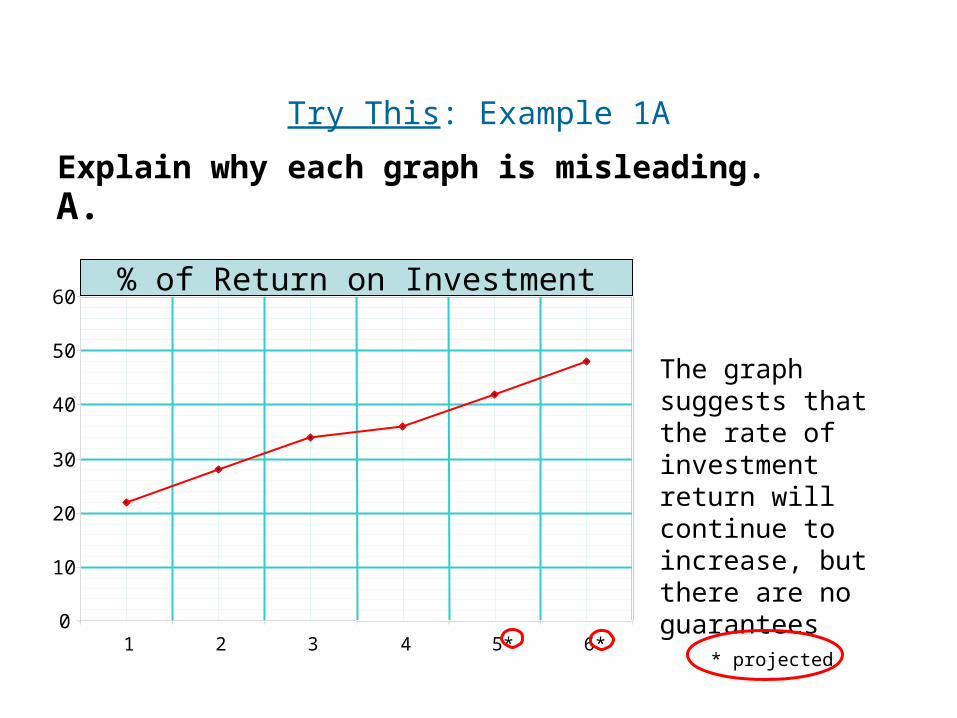
Try This: Example 1A
Explain why each graph is misleading.A.
0
10
20
30
40
50
60
1 2 3 4 5* 6** projected
% of Return on Investment
The graph suggests that the rate of investment return will continue to increase, but there are no guarantees
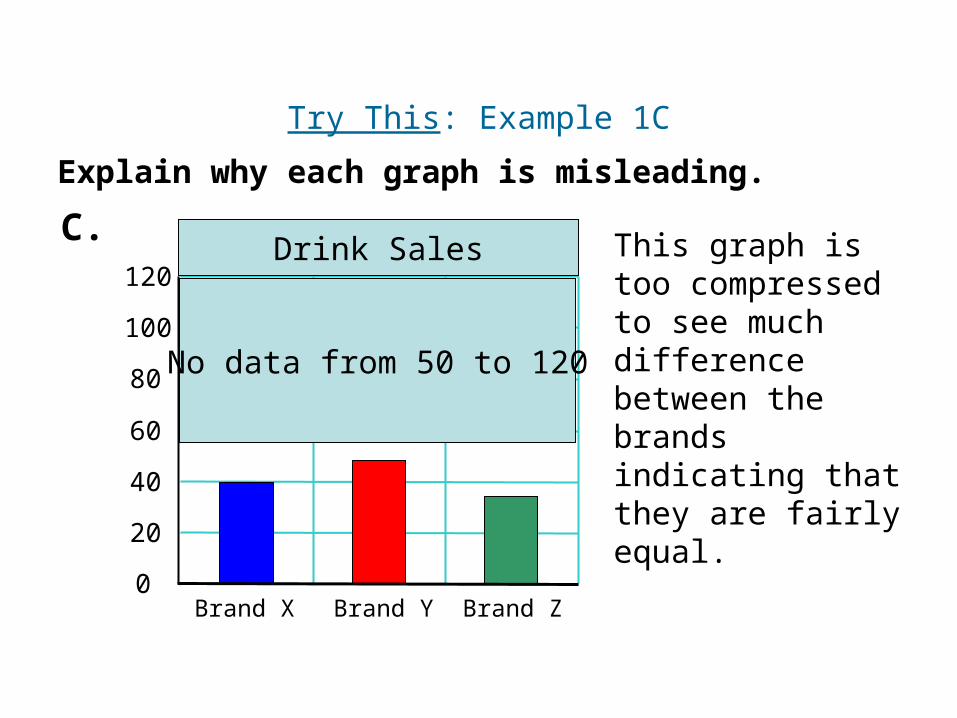
Try This: Example 1C
Explain why each graph is misleading.
C.
0
20
40
60
80
100
120
Brand X Brand Y Brand Z
Drink Sales This graph is too compressed to see much difference between the brands indicating that they are fairly equal.
No data from 50 to 120
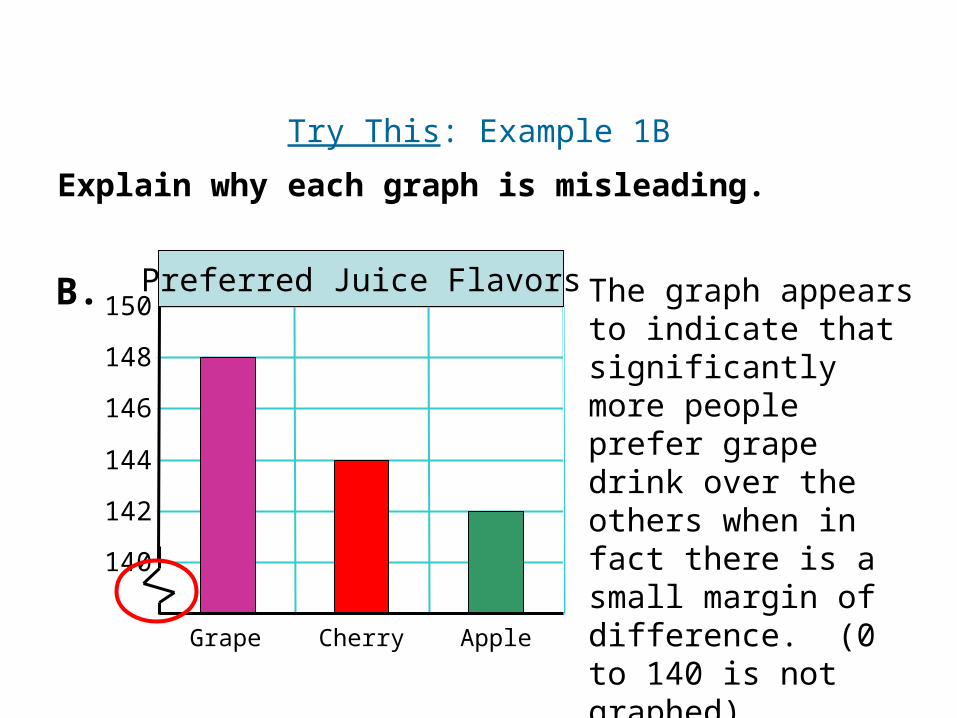
Try This: Example 1B
Explain why each graph is misleading.
B.
140
142
144
146
148
150Preferred Juice Flavors
Grape Cherry Apple
The graph appears to indicate that significantly more people prefer grape drink over the others when in fact there is a small margin of difference. (0 to 140 is not graphed)
Additional Example 2: Identifying Misleading Graphs
Explain why each statistic is misleading.
A. Sam scored 43 goals for his soccer team during the season, and Jacob scored only 2.
Although Jacob scored only 2 goals, he may have played most of his time on defense.
B. Four out of five dentists surveyed preferred UltraClean toothpaste.
This statement does not give the sample size or state what UltraClean toothpaste was compared with.
Additional Example 2 Continued
Explain why each statistic is misleading.
C. Shopping at Save-a-Lot can save you up to $100 a month!
The words save up to $100 mean that the maximum you can save is $100, but there is no guarantee that you will save that amount.
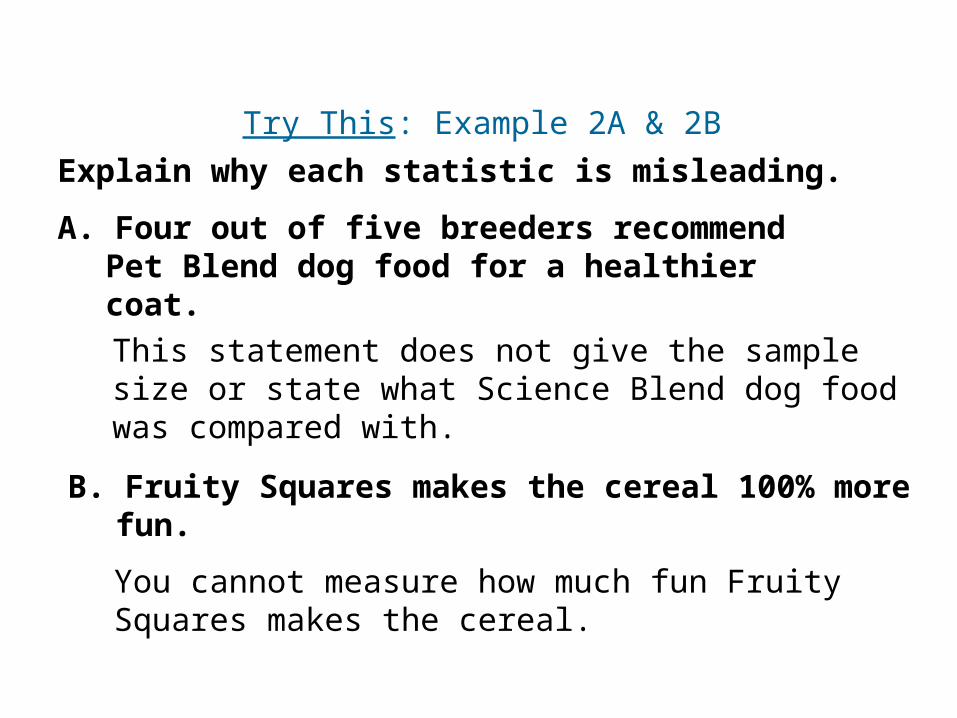
Explain why each statistic is misleading.
Try This: Example 2A & 2B
A. Four out of five breeders recommend Pet Blend dog food for a healthier coat.
This statement does not give the sample size or state what Science Blend dog food was compared with.
B. Fruity Squares makes the cereal 100% more fun.
You cannot measure how much fun Fruity Squares makes the cereal.
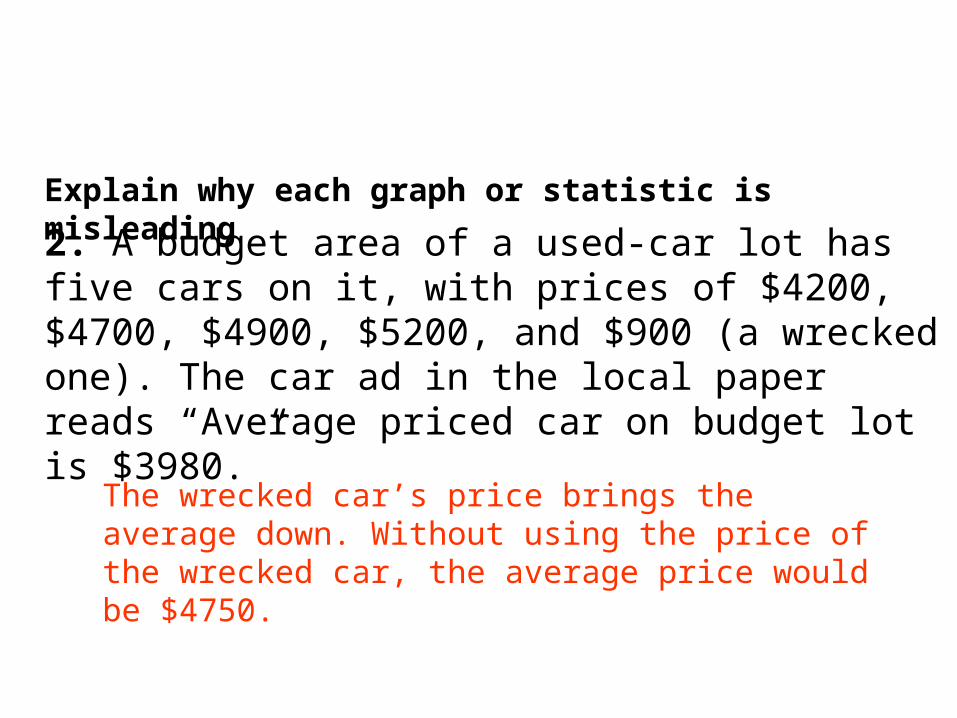
2. A budget area of a used-car lot has five cars on it, with prices of $4200, $4700, $4900, $5200, and $900 (a wrecked one). The car ad in the local paper reads “Average priced car on budget lot is $3980.”
The wrecked car’s price brings the average down. Without using the price of the wrecked car, the average price would be $4750.
Explain why each graph or statistic is misleading
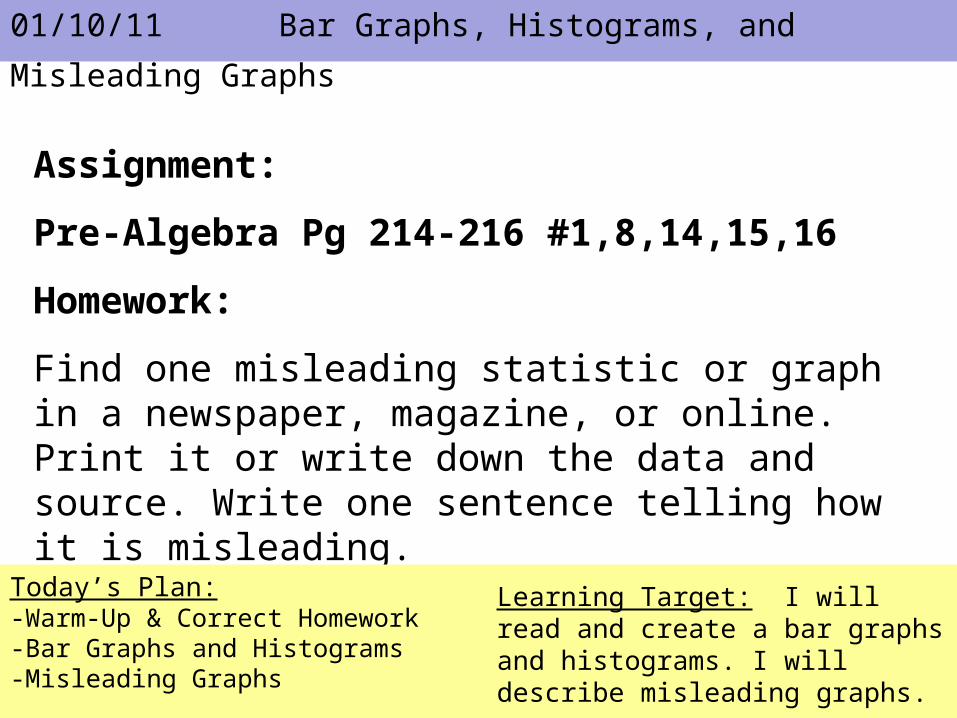
Assignment:
Pre-Algebra Pg 214-216 #1,8,14,15,16
Homework:
Find one misleading statistic or graph in a newspaper, magazine, or online. Print it or write down the data and source. Write one sentence telling how it is misleading.
01/10/11 Bar Graphs, Histograms, and Misleading Graphs
Today’s Plan:-Warm-Up & Correct Homework-Bar Graphs and Histograms-Misleading Graphs
Learning Target: I will read and create a bar graphs and histograms. I will describe misleading graphs.