Embed Size (px)
Citation preview
China’s Energy— Challenges and Strategy
Prof. Ni WeidouProf. Ni WeidouTsinghua University
Chairman of Steering Committee of
Tsinghua-BP Clean Energy Research and Education Centre
Member of Chinese Academy of Engineering
Chairman of Science and Technology Commission of Ministry of Education
If today’s trend of utilization of fossil fuel will continue (BAU technology), we are running out of atmosphere faster than we’re running out of fossil fuels.
Terrorism doesn’t threaten the viability of the heart of our high technology life-style, but energy really does.
Five challenges China is facingFive challenges China is facing
•• Enormous energy demandEnormous energy demand
•• Shortage of liquid fuelsShortage of liquid fuels
•• Severe environmental pollutionSevere environmental pollution
•• Greenhouse gas emissionsGreenhouse gas emissions
•• Rural energy supplyRural energy supply
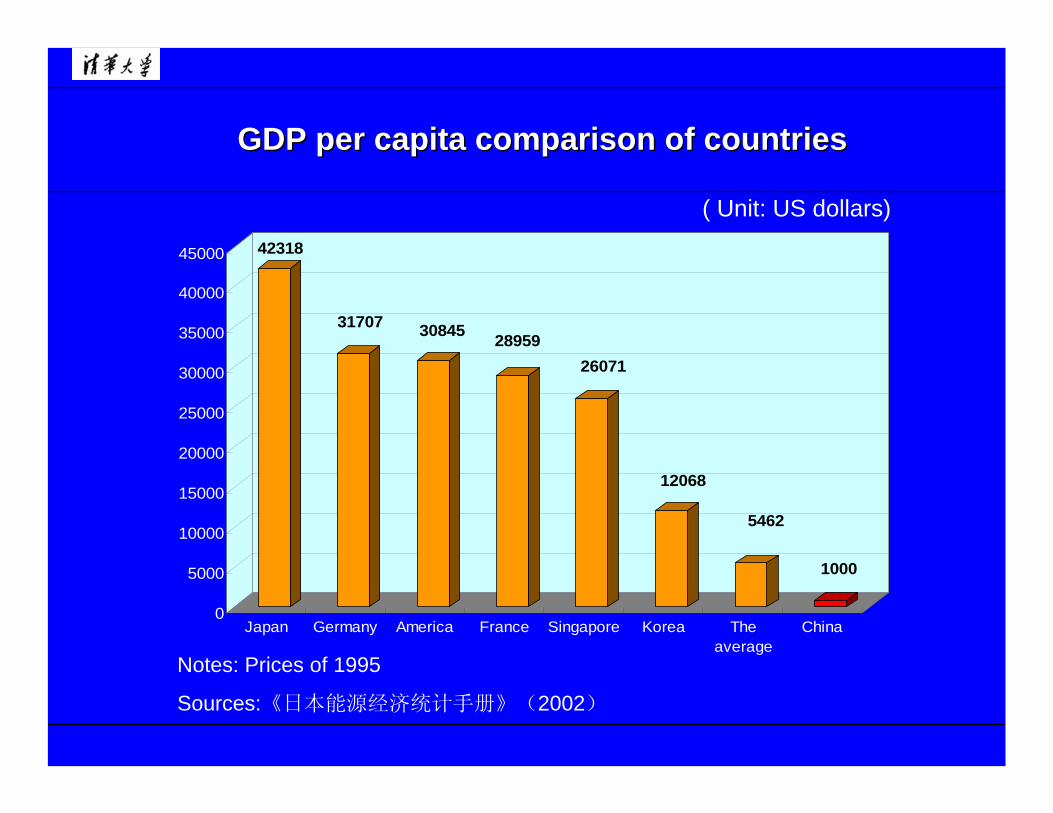
GDP per capita comparison of countriesGDP per capita comparison of countries
42318
31707 30845 2895926071
12068
5462
1000
0
5000
10000
15000
20000
25000
30000
35000
40000
45000
Japan Germany America France Singapore Korea Theaverage
China
Notes: Prices of 1995
Sources:《日本能源经济统计手册》(2002)
( Unit: US dollars)
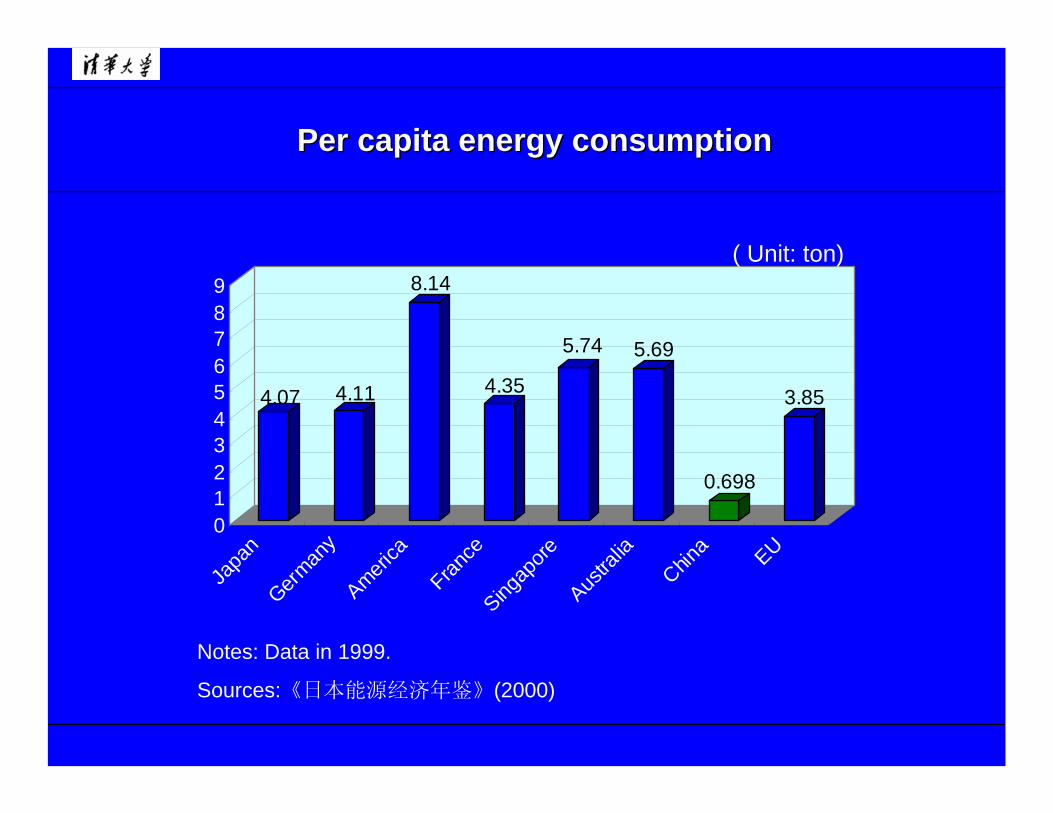
Per capita energy consumptionPer capita energy consumption
4.07 4.11
8.14
4.35
5.74 5.69
0.698
3.85
0123456789
Japa
nGerm
any
America
France
Singap
oreAus
tralia
China EU
Notes: Data in 1999.
Sources:《日本能源经济年鉴》(2000)
( Unit: ton)
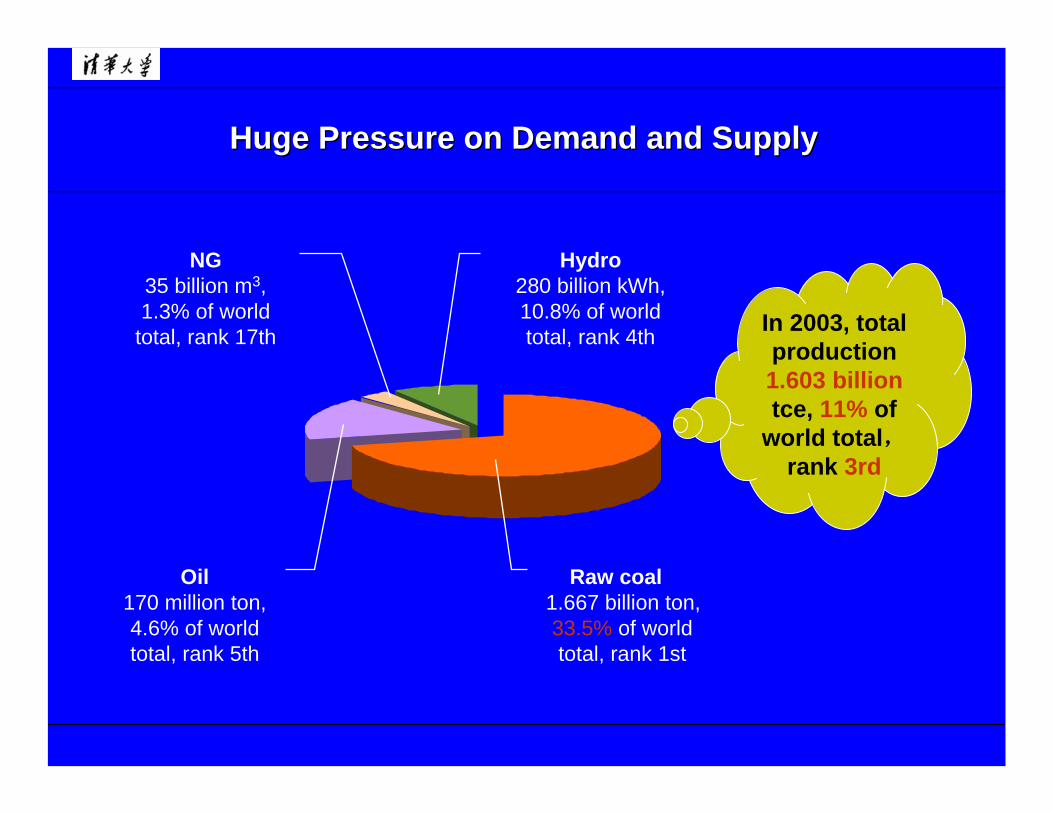
Huge Pressure on Demand and SupplyHuge Pressure on Demand and Supply
In 2003, total production 1.603 billion tce, 11% of
world total,rank 3rd
Hydro280 billion kWh, 10.8% of world total, rank 4th
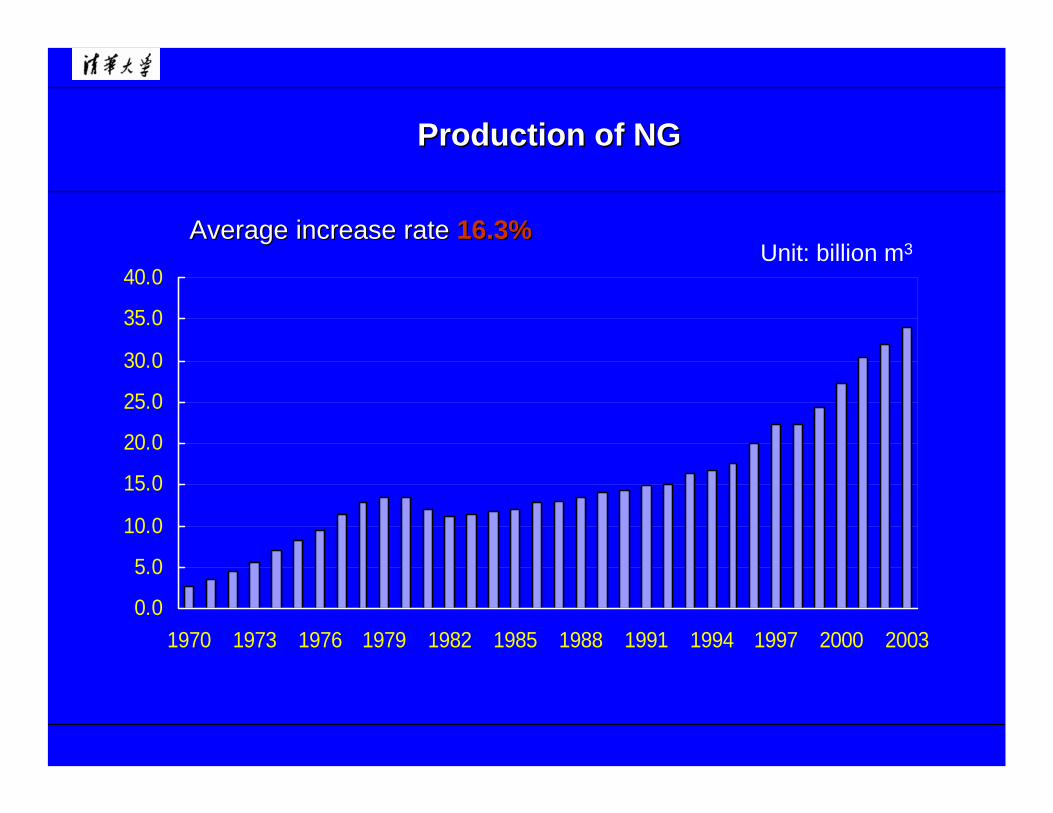
NG35 billion m3, 1.3% of world
total, rank 17th
Raw coal1.667 billion ton, 33.5% of world total, rank 1st
Oil170 million ton, 4.6% of world total, rank 5th
(Units: 108 ton)
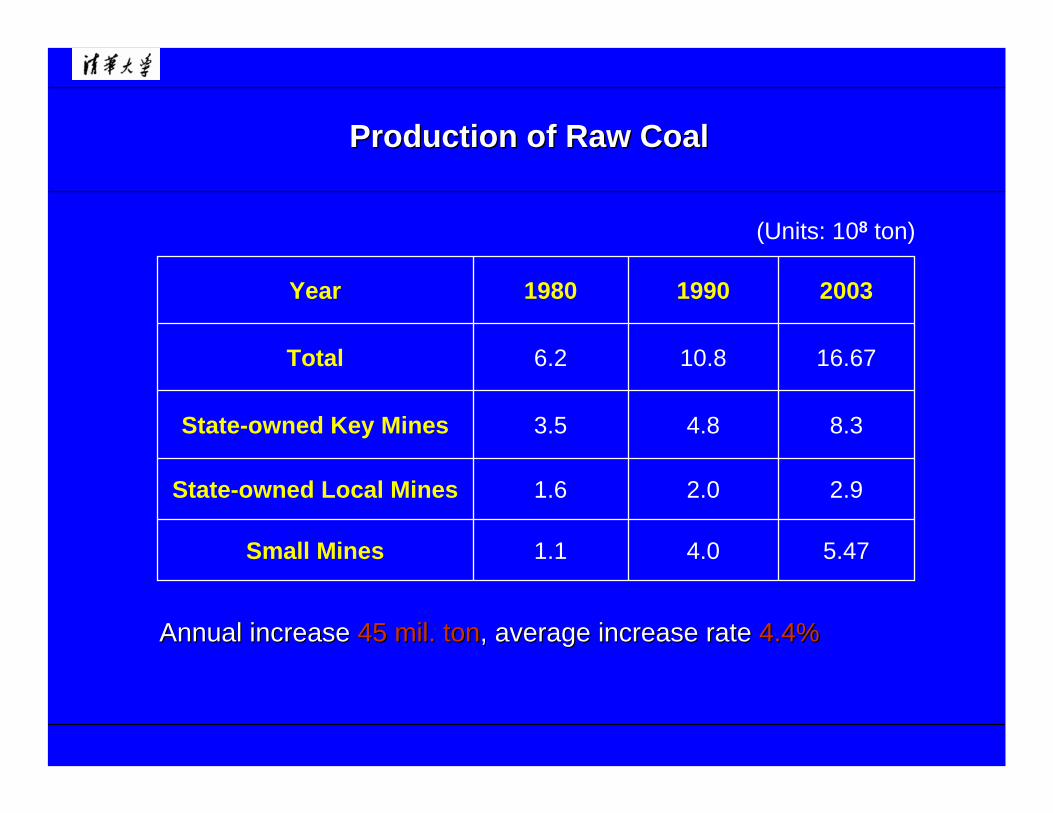
Production of Raw CoalProduction of Raw Coal
Annual increase Annual increase 45 mil. ton45 mil. ton, average increase rate , average increase rate 4.4%4.4%
5.47
2.9
8.3
16.67
2003
4.01.1Small Mines
2.01.6State-owned Local Mines
4.83.5State-owned Key Mines
10.86.2Total
19901980Year
0
2000
4000
6000
8000
10000
12000
14000
16000
18000
1949
1952
1955
1958
1961
1964
1967
1970
1973
1976
1979
1982
1985
1988
1991
1994
1997
2000
2003
Unit: 104 t
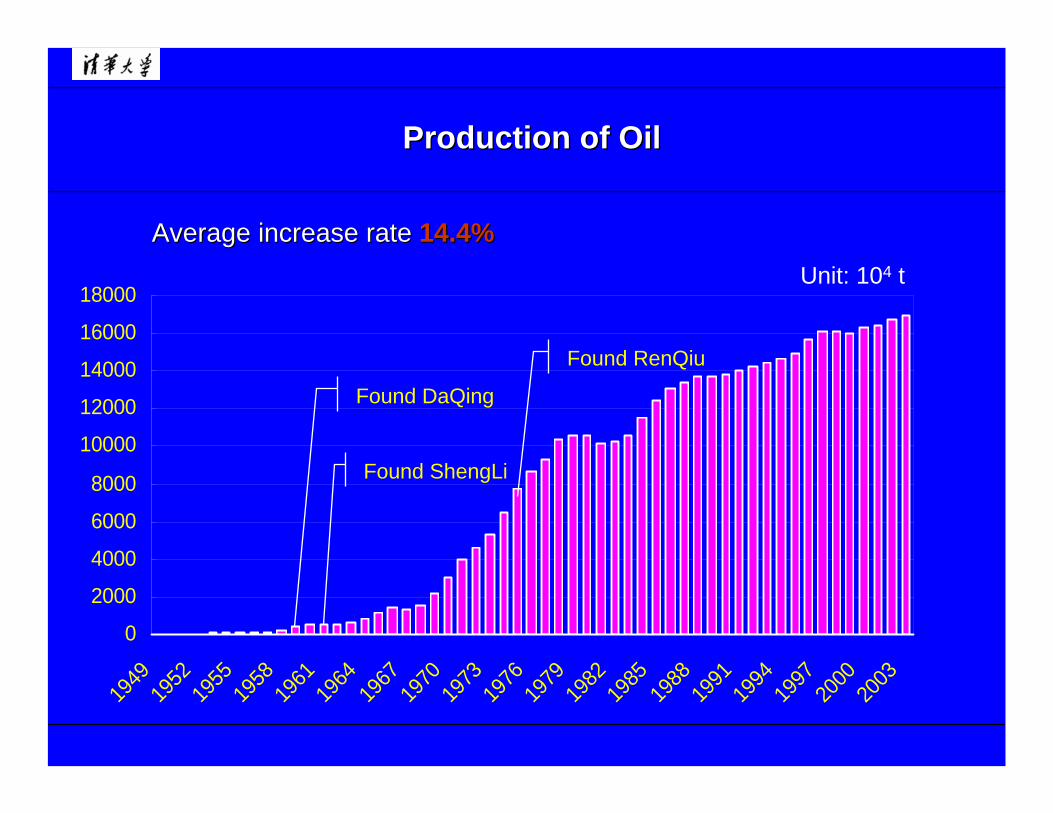
Production of OilProduction of Oil
Average increase rateAverage increase rate 14.4%14.4%
Found DaQing
Found ShengLi
Found RenQiu
0.0
5.0
10.0
15.0
20.0
25.0
30.0
35.0
40.0
1970 1973 1976 1979 1982 1985 1988 1991 1994 1997 2000 2003
Unit: billion m3
Production of NGProduction of NG
Average increase rateAverage increase rate 16.3%16.3%
0
0.5
1
1.5
2
2.5
3
3.5
4
1952 1955 1958 1961 1964 1967 1970 1973 1976 1979 1982 1985 1988 1991 1994 1997 2000 2003
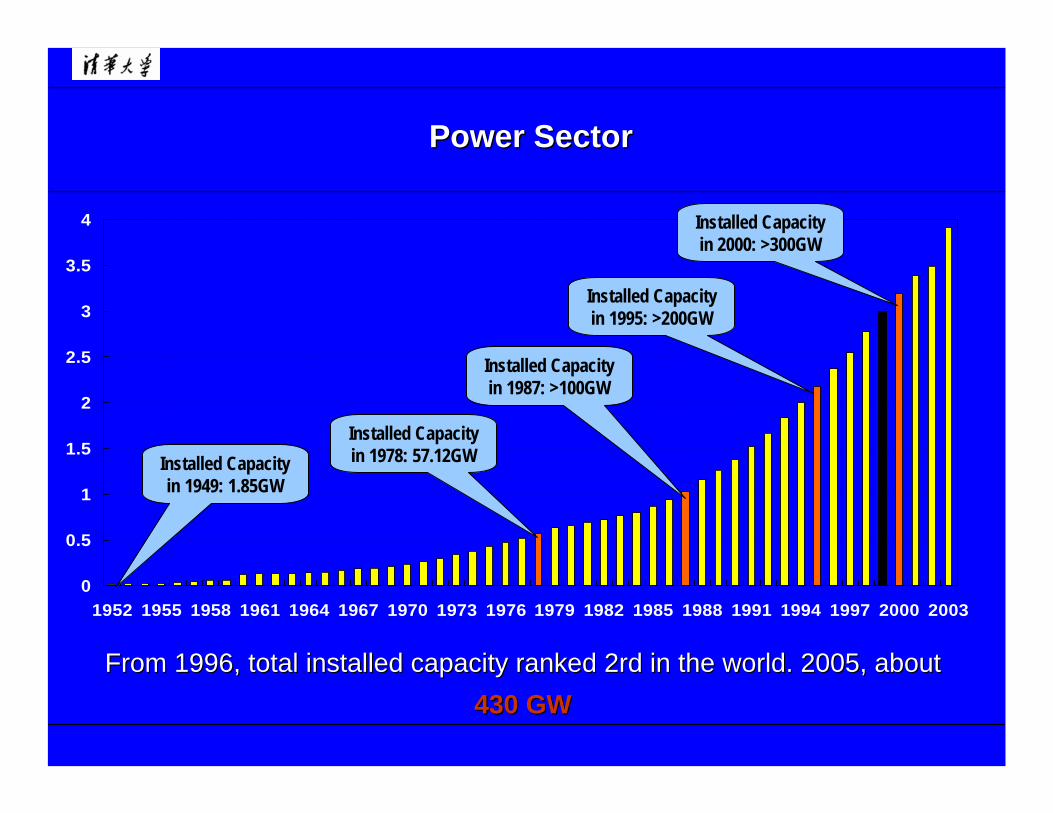
Installed Capacity in 1949: 1.85GW
From 1996, total installed capacity ranked 2rd in the world. 200From 1996, total installed capacity ranked 2rd in the world. 2005, about5, about430 GW430 GW
Power SectorPower Sector
Installed Capacity in 1978: 57.12GW
Installed Capacity in 1987: >100GW
Installed Capacity in 1995: >200GW
Installed Capacity in 2000: >300GW
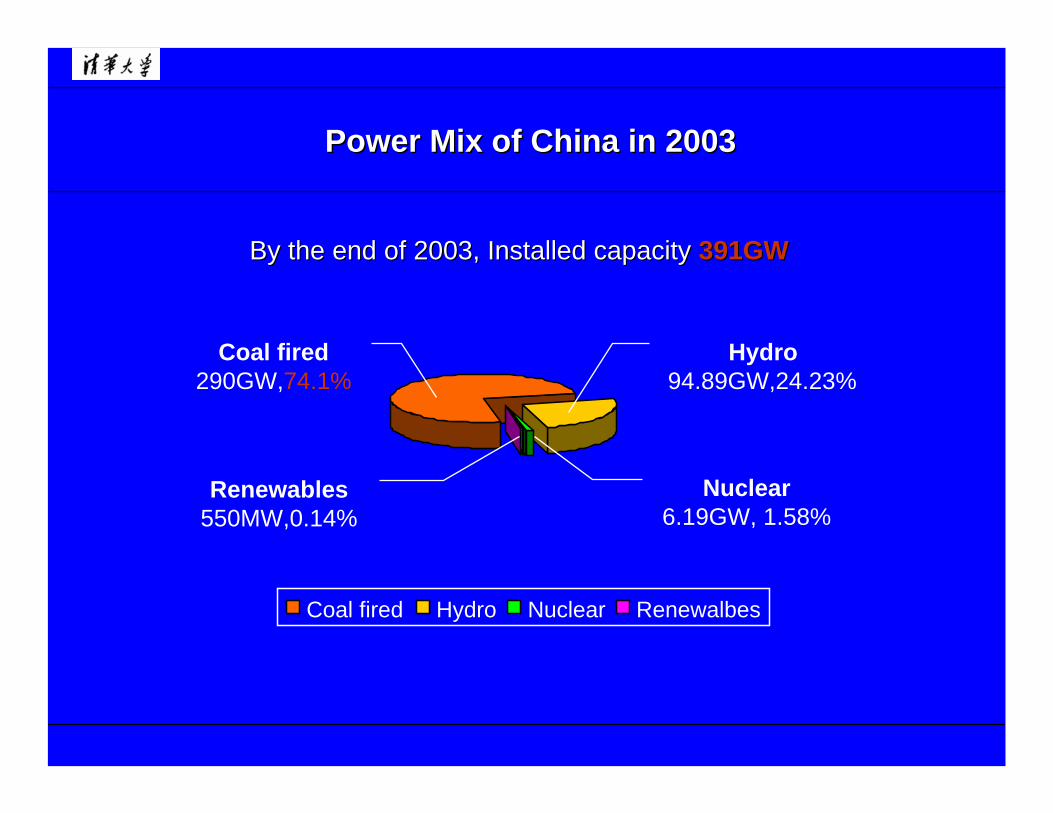
By the end of 2003, Installed capacityBy the end of 2003, Installed capacity 391GW391GW
Coal fired Hydro Nuclear Renewalbes
Coal fired290GW,74.1%
Hydro94.89GW,24.23%
Renewables550MW,0.14%
Nuclear6.19GW, 1.58%
Power Mix of China in 2003Power Mix of China in 2003
From 2000, shortage of energy supply becomes more and From 2000, shortage of energy supply becomes more and more severe. Though the domestic average energy more severe. Though the domestic average energy production increase rate production increase rate –– 14.35%, and oil import increase 14.35%, and oil import increase rate rate –– 11.7%, the supply of energy is still the big problem11.7%, the supply of energy is still the big problem
The supply of energy is the big problemThe supply of energy is the big problem
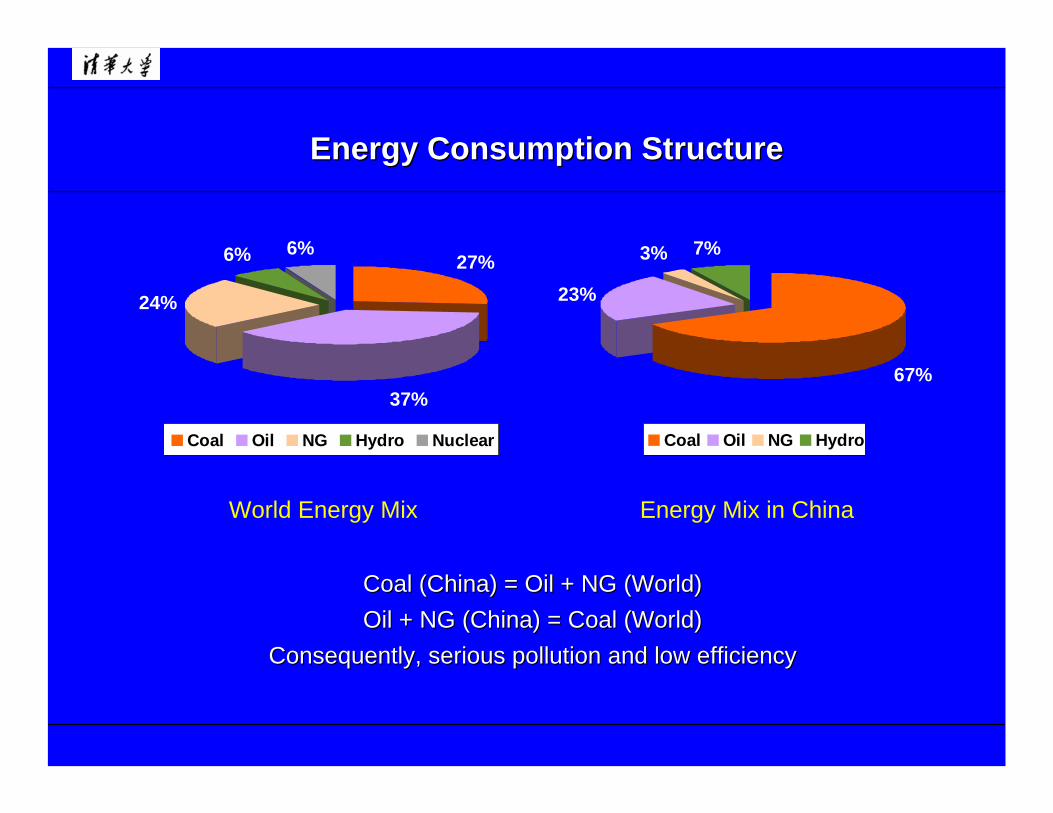
Coal (China) = Oil + NG (World)Coal (China) = Oil + NG (World)Oil + NG (China) = Coal (World)Oil + NG (China) = Coal (World)
Consequently, serious pollution and low efficiencyConsequently, serious pollution and low efficiency
World Energy Mix Energy Mix in China
67%
23%
3% 7%
Coal Oil NG Hydro
27%
37%
24%
6% 6%
Coal Oil NG Hydro Nuclear
Energy Consumption StructureEnergy Consumption Structure
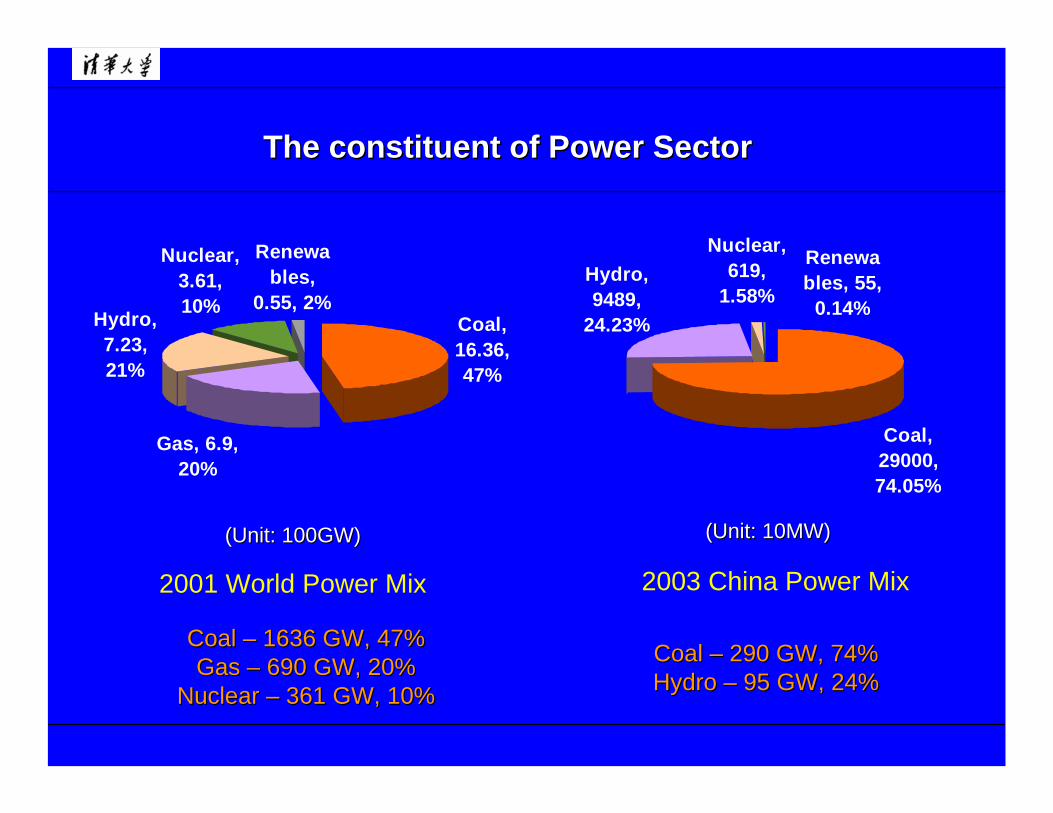
Coal, 16.36, 47%
Gas, 6.9, 20%
Hydro, 7.23, 21%
Nuclear, 3.61, 10%
Renewables,
0.55, 2%
The constituent of Power SectorThe constituent of Power Sector
Hydro,9489,
24.23%
Coal,29000,74.05%
Renewables, 55,
0.14%
Nuclear,619,
1.58%
2001 World Power Mix 2003 China Power Mix
(Unit: 100GW)(Unit: 100GW) (Unit: 10MW)(Unit: 10MW)
Coal Coal –– 1636 GW, 47%1636 GW, 47%Gas Gas –– 690 GW, 20%690 GW, 20%
Nuclear Nuclear –– 361 GW, 10%361 GW, 10%
Coal Coal –– 290 GW, 74%290 GW, 74%Hydro Hydro –– 95 GW, 24%95 GW, 24%
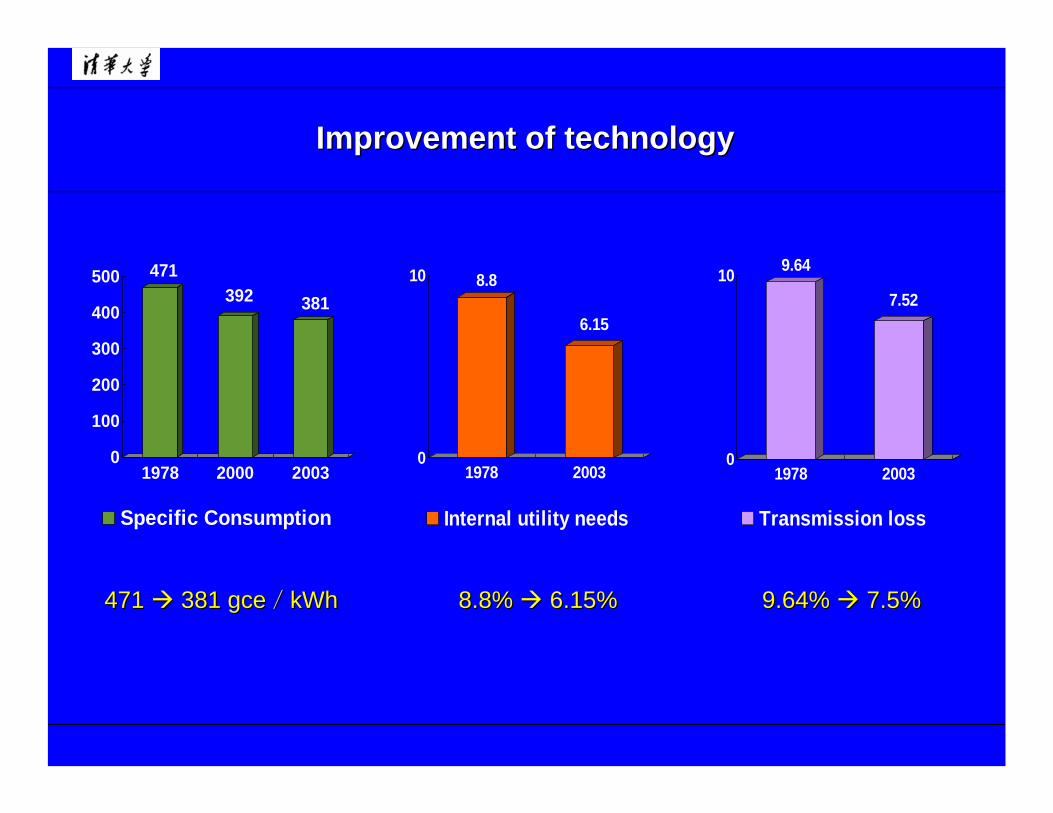
471392 381
0
100
200
300
400
500
1978 2000 2003
Specific Consumption
Improvement of technologyImprovement of technology
471 471 381 381 gcegce//kWhkWh 8.8% 8.8% 6.15%6.15% 9.64% 9.64% 7.5%7.5%
8.8
6.15
0
10
1978 2003
Internal utility needs
9.64
7.52
0
10
1978 2003
Transmission loss
The main problems China is facingThe main problems China is facing
Constraints of domestic resources (reserves)Constraints of domestic resources (reserves)
Huge investment (up to 2020, about 1000 billion $)Huge investment (up to 2020, about 1000 billion $)
Energy securityEnergy security
Low efficiencyLow efficiency
Severe environment impactSevere environment impact
Constraints of Domestic Resources (Reserves)Constraints of Domestic Resources (Reserves)
Though the resource is abundant, but at present resource Though the resource is abundant, but at present resource
suitable for exploitation only aboutsuitable for exploitation only about 100 billion ton100 billion ton
CoalCoal
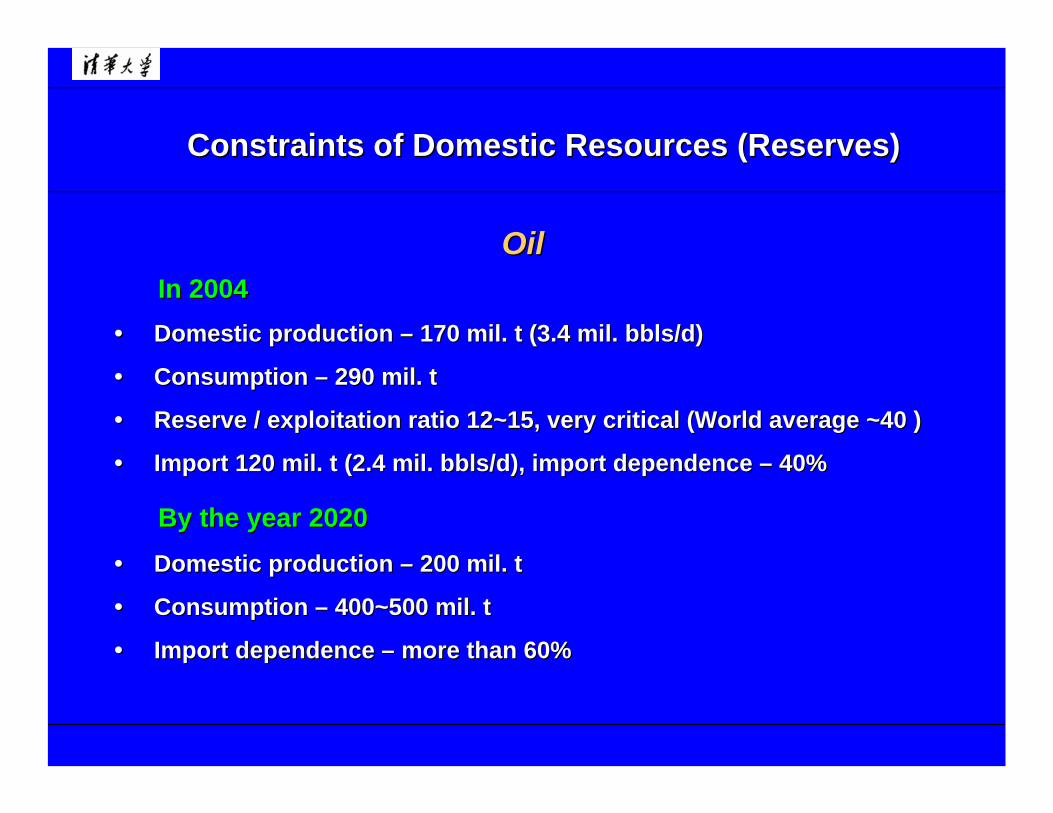
Constraints of Domestic Resources (Reserves)Constraints of Domestic Resources (Reserves)
OilOilIn 2004In 2004
•• Domestic production Domestic production –– 170 mil. t (3.4 mil. bbls/d)170 mil. t (3.4 mil. bbls/d)
•• Consumption Consumption –– 290 mil. t290 mil. t
•• Reserve / exploitation ratio 12~15, very critical (World averageReserve / exploitation ratio 12~15, very critical (World average ~40 )~40 )
•• Import 120 mil. t (2.4 mil. bbls/d), import dependence Import 120 mil. t (2.4 mil. bbls/d), import dependence –– 40%40%
By the year 2020By the year 2020
•• Domestic production Domestic production –– 200 mil. t200 mil. t
•• Consumption Consumption –– 400~500 mil. t400~500 mil. t
•• Import dependence Import dependence –– more than 60%more than 60%
Constraints of Domestic Resources (Reserves)Constraints of Domestic Resources (Reserves)
Hydro PowerHydro Power
•• Resource Resource –– rank 1st in the world, ~500GWrank 1st in the world, ~500GW
•• Location Location –– mainly in remote westmainly in remote west--south areas, far from load centerssouth areas, far from load centers
•• Ecological uncertaintyEcological uncertainty
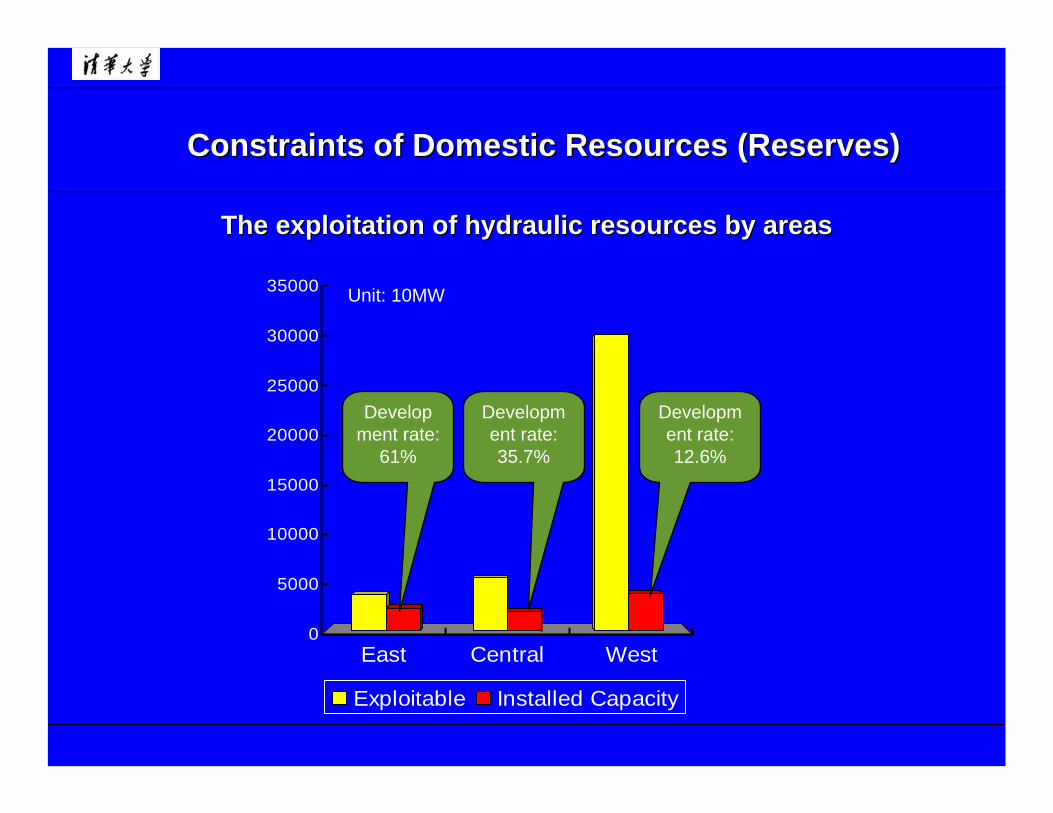
Constraints of Domestic Resources (Reserves)Constraints of Domestic Resources (Reserves)
The exploitation of hydraulic resources by areasThe exploitation of hydraulic resources by areas
East Central West0
5000
10000
15000
20000
25000
30000
35000
Exploitable Installed Capacity
Development rate:
61%
Development rate: 35.7%
Development rate: 12.6%
Unit: 10MW
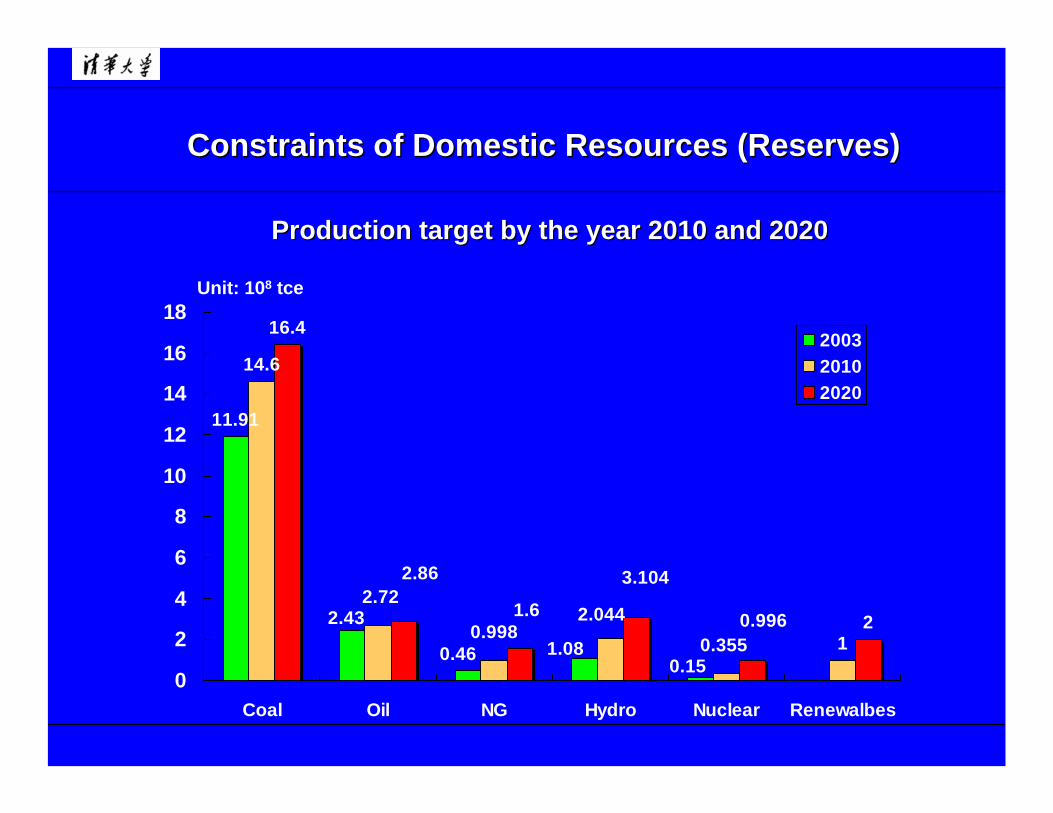
11.91
14.6
1
16.4
2
0.151.080.46
2.430.355
2.0440.998
2.720.996
3.104
1.6
2.86
0
2
4
6
8
10
12
14
16
18
Coal Oil NG Hydro Nuclear Renewalbes
200320102020
Unit: 108 tce
Constraints of Domestic Resources (Reserves)Constraints of Domestic Resources (Reserves)
Production target by the year 2010 and 2020Production target by the year 2010 and 2020
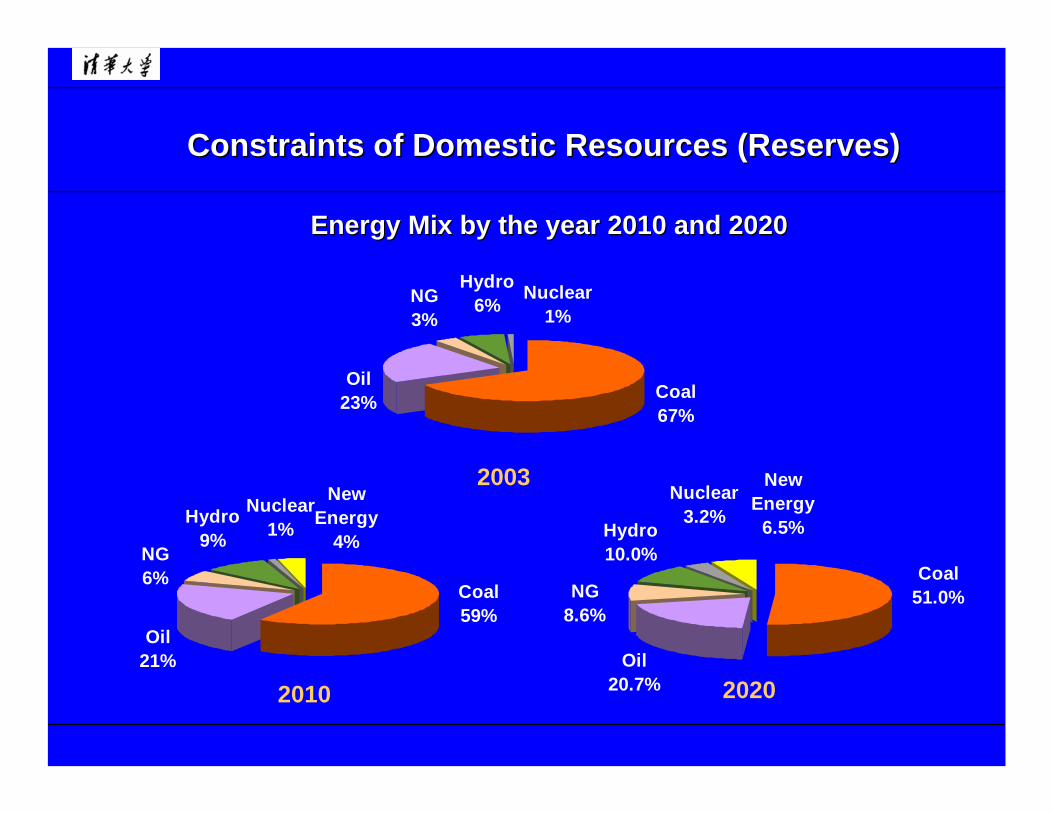
Constraints of Domestic Resources (Reserves)Constraints of Domestic Resources (Reserves)
Energy Mix by the year 2010 and 2020Energy Mix by the year 2010 and 2020
Oil23% Coal
67%
Nuclear1%
Hydro6%NG
3%
2003New
Energy4%
Oil21%
Coal59%
Nuclear1%
Hydro9%
NG6%
2010
NewEnergy
6.5%
Oil20.7%
Coal51.0%
Nuclear3.2%
Hydro10.0%
NG8.6%
2020
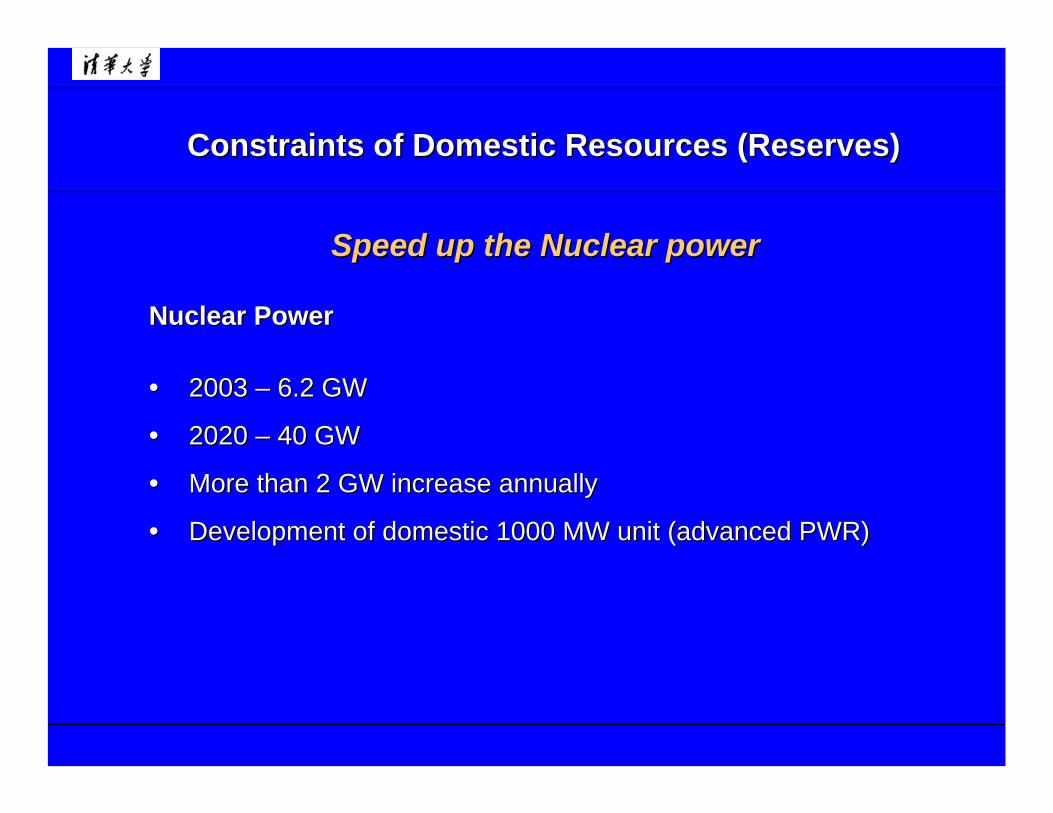
Constraints of Domestic Resources (Reserves)Constraints of Domestic Resources (Reserves)
Speed up the Nuclear powerSpeed up the Nuclear power
Nuclear PowerNuclear Power
•• 2003 2003 –– 6.2 GW6.2 GW
•• 2020 2020 –– 40 GW40 GW
•• More than 2 GW increase annuallyMore than 2 GW increase annually
•• Development of domestic 1000 MW unit (advanced PWR)Development of domestic 1000 MW unit (advanced PWR)
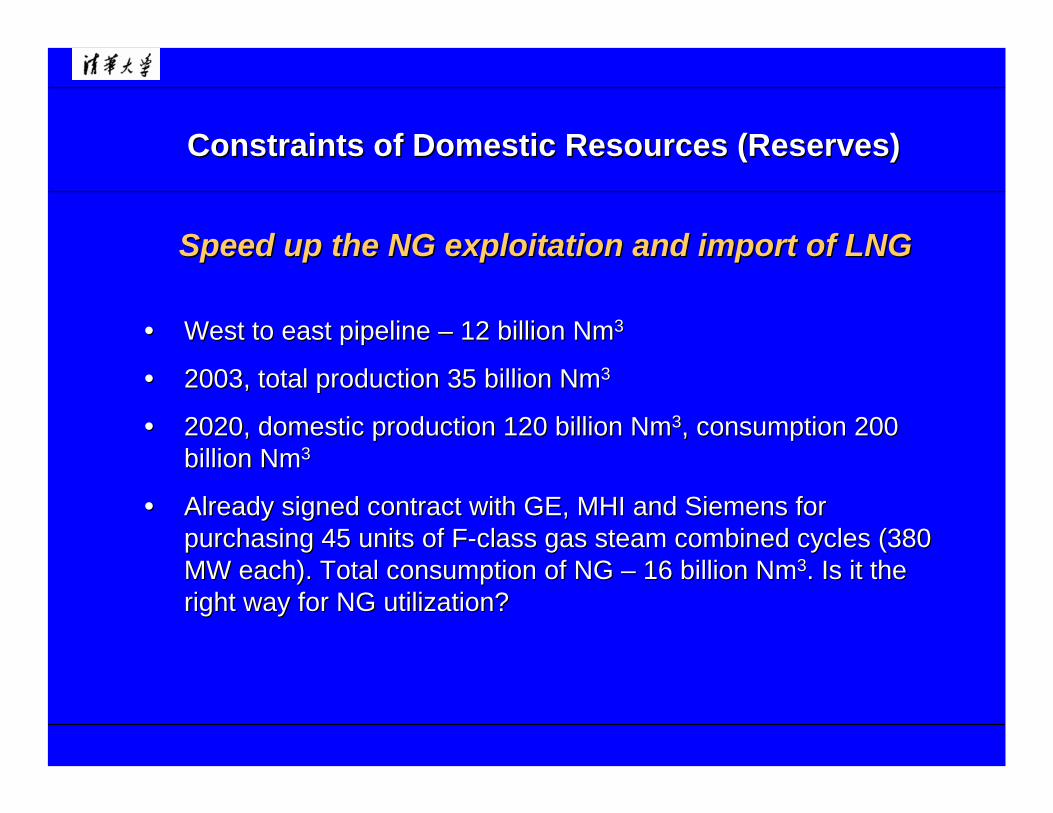
Constraints of Domestic Resources (Reserves)Constraints of Domestic Resources (Reserves)
Speed up the NG exploitation and import of LNGSpeed up the NG exploitation and import of LNG
•• West to east pipeline West to east pipeline –– 12 billion Nm12 billion Nm33
•• 2003, total production 35 billion Nm2003, total production 35 billion Nm33
•• 2020, domestic production 120 billion Nm2020, domestic production 120 billion Nm33, consumption 200 , consumption 200 billion Nmbillion Nm33
•• Already signed contract with GE, MHI and Siemens for Already signed contract with GE, MHI and Siemens for purchasing 45 units of Fpurchasing 45 units of F--class gas steam combined cycles (380 class gas steam combined cycles (380 MW each). Total consumption of NG MW each). Total consumption of NG –– 16 billion Nm16 billion Nm33. Is it the . Is it the right way for NG utilization?right way for NG utilization?
Constraints of Domestic Resources (Reserves)Constraints of Domestic Resources (Reserves)
•• China is abundant in renewable energy China is abundant in renewable energy –– wind, solar and wind, solar and biomassbiomass……
•• Wind energy, in shore Wind energy, in shore –– 254 GW, off254 GW, off--shore shore –– 700 GW700 GW
•• Biomass Biomass –– 500~600 mil. tce (but highly scattered)500~600 mil. tce (but highly scattered)
Renewable energyRenewable energy
Constraints of Domestic Resources (Reserves)Constraints of Domestic Resources (Reserves)
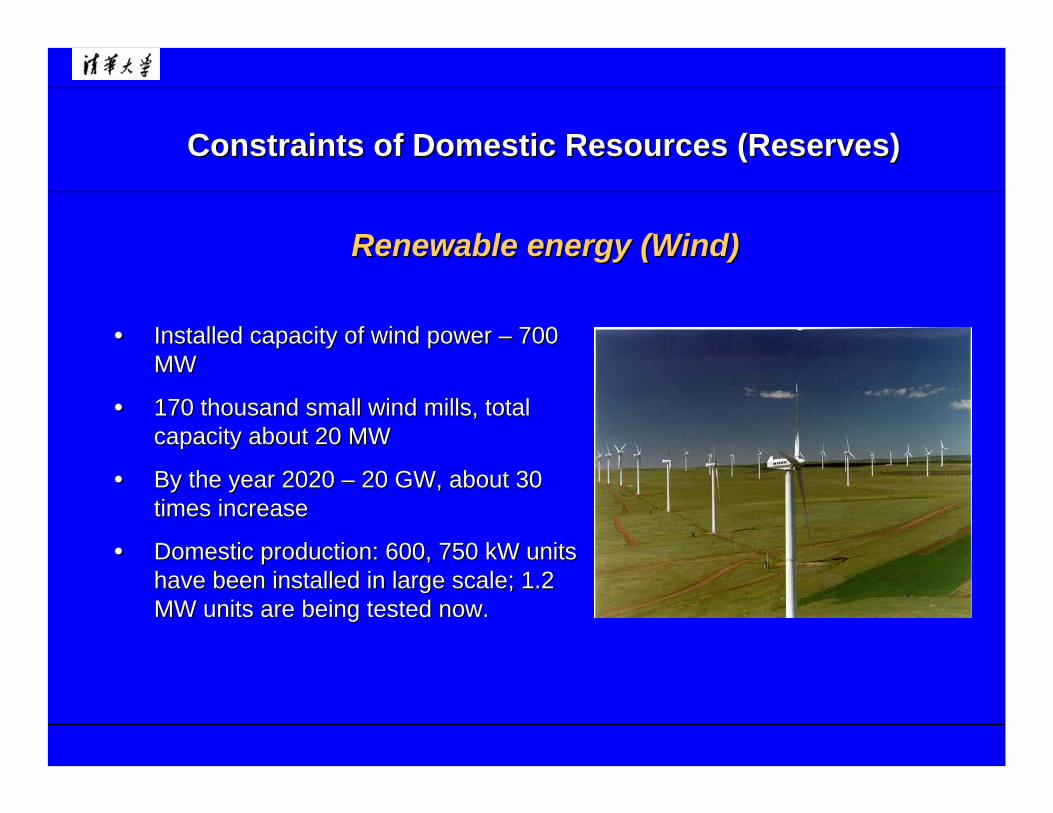
•• Installed capacity of wind power Installed capacity of wind power –– 700 700 MWMW
•• 170 thousand small wind mills, total 170 thousand small wind mills, total capacity about 20 MWcapacity about 20 MW
•• By the year 2020 By the year 2020 –– 20 GW, about 30 20 GW, about 30 times increasetimes increase
•• Domestic production: 600, 750 kW units Domestic production: 600, 750 kW units have been installed in large scale; 1.2 have been installed in large scale; 1.2 MW units are being tested now.MW units are being tested now.
Renewable energy (Wind)Renewable energy (Wind)
Constraints of Domestic Resources (Reserves)Constraints of Domestic Resources (Reserves)
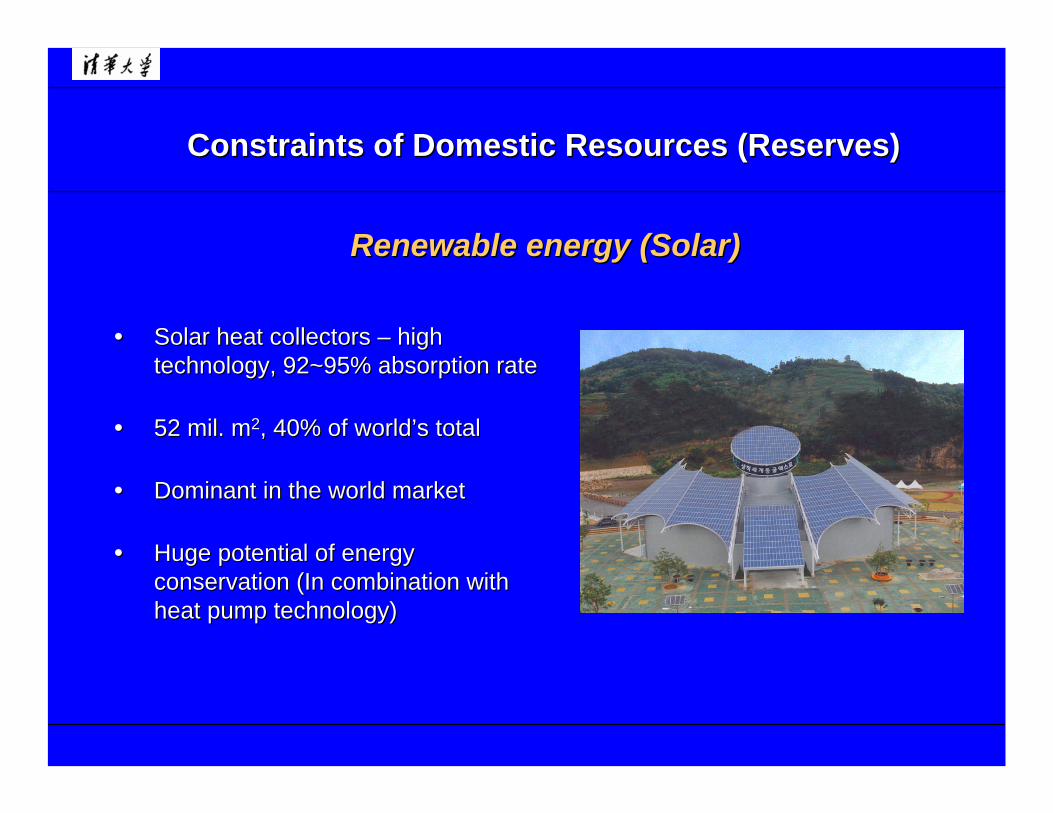
•• Solar heat collectors Solar heat collectors –– high high technology, 92~95% absorption ratetechnology, 92~95% absorption rate
•• 52 mil. m52 mil. m22, 40% of world, 40% of world’’s totals total
•• Dominant in the world marketDominant in the world market
•• Huge potential of energy Huge potential of energy conservation (In combination with conservation (In combination with heat pump technology)heat pump technology)
Renewable energy (Solar)Renewable energy (Solar)
Constraints of Domestic Resources (Reserves)Constraints of Domestic Resources (Reserves)
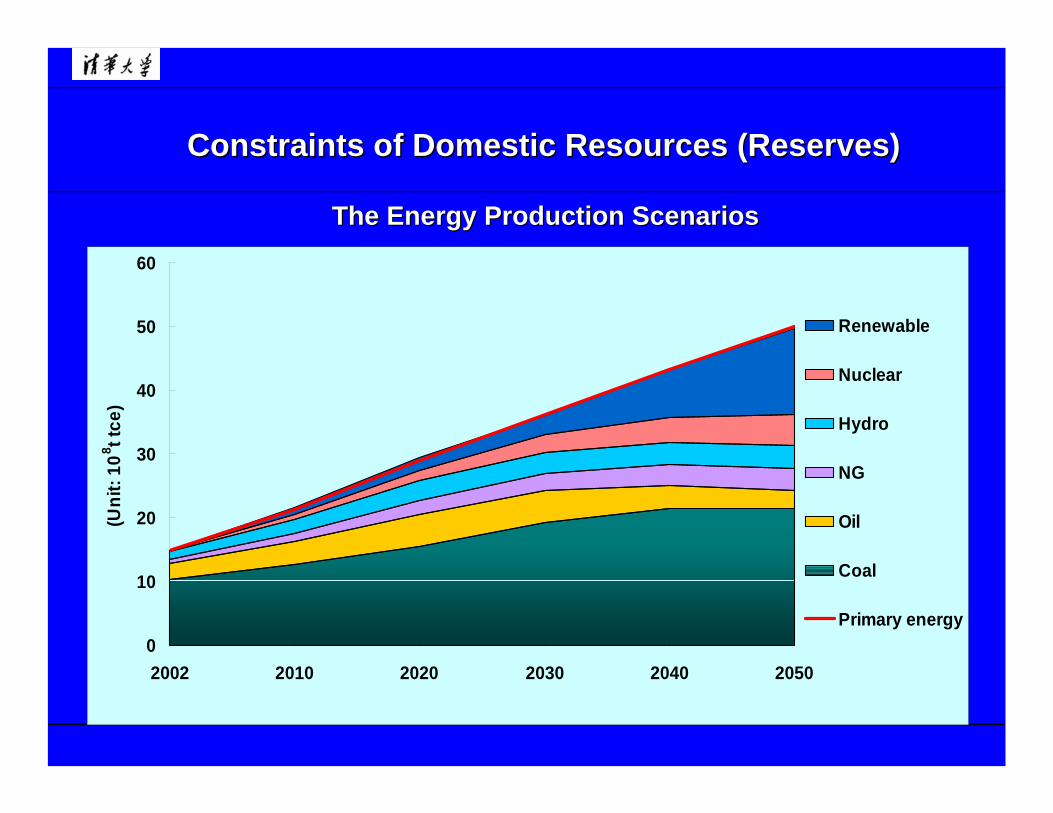
0
10
20
30
40
50
60
2002 2010 2020 2030 2040 2050
(Uni
t: 10
8 t tce
)
Renewable
Nuclear
Hydro
NG
Oil
Coal
Primary energy
The Energy Production ScenariosThe Energy Production Scenarios
Energy securityEnergy security
The per capita energy reserves of China are much lower, The per capita energy reserves of China are much lower, especially for the oil and natural gasespecially for the oil and natural gas
Oil will reach the peak production around 200Mt in 2020, after Oil will reach the peak production around 200Mt in 2020, after then the production will decreasethen the production will decrease
60% oil and natural gas in 2020 will depend on import60% oil and natural gas in 2020 will depend on import
1000Mt coal production new capacity will be set1000Mt coal production new capacity will be set--up before up before 2020, it is a very tough task (reserves, capital investment, 2020, it is a very tough task (reserves, capital investment, ecologyecology……))
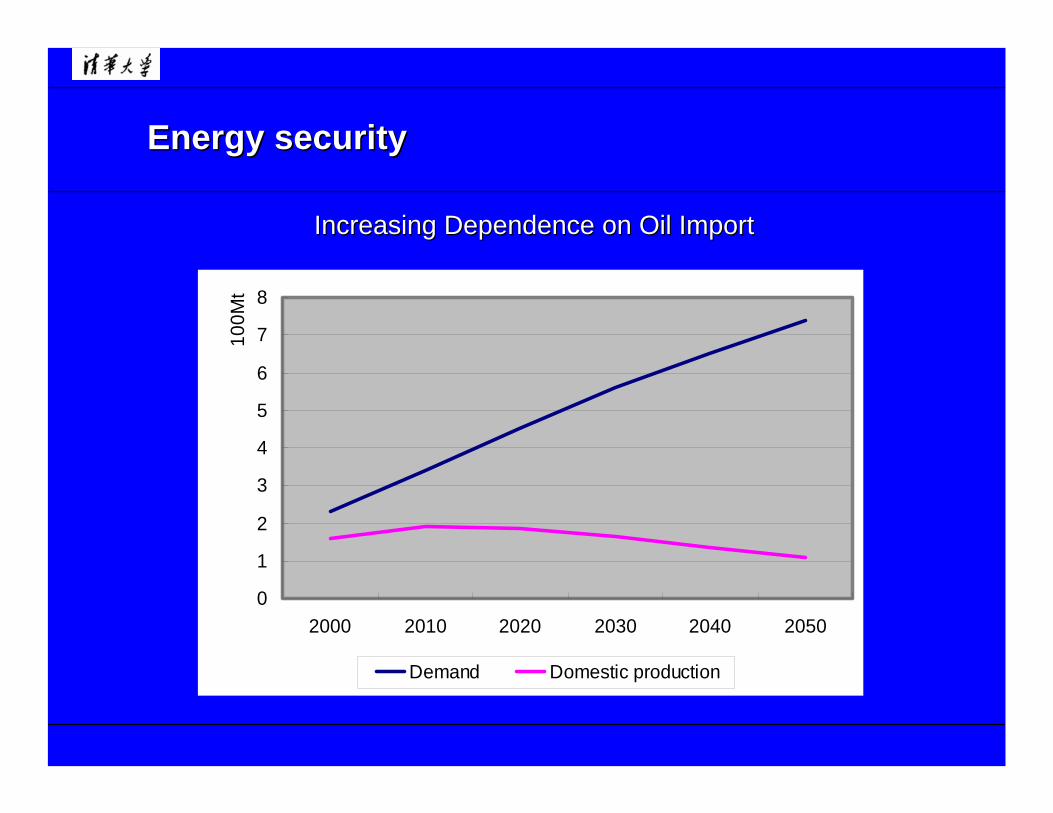
0
1
2
3
4
5
6
7
8
2000 2010 2020 2030 2040 2050
100M
t
Demand Domestic production
Energy securityEnergy security
Increasing Dependence on Oil ImportIncreasing Dependence on Oil Import
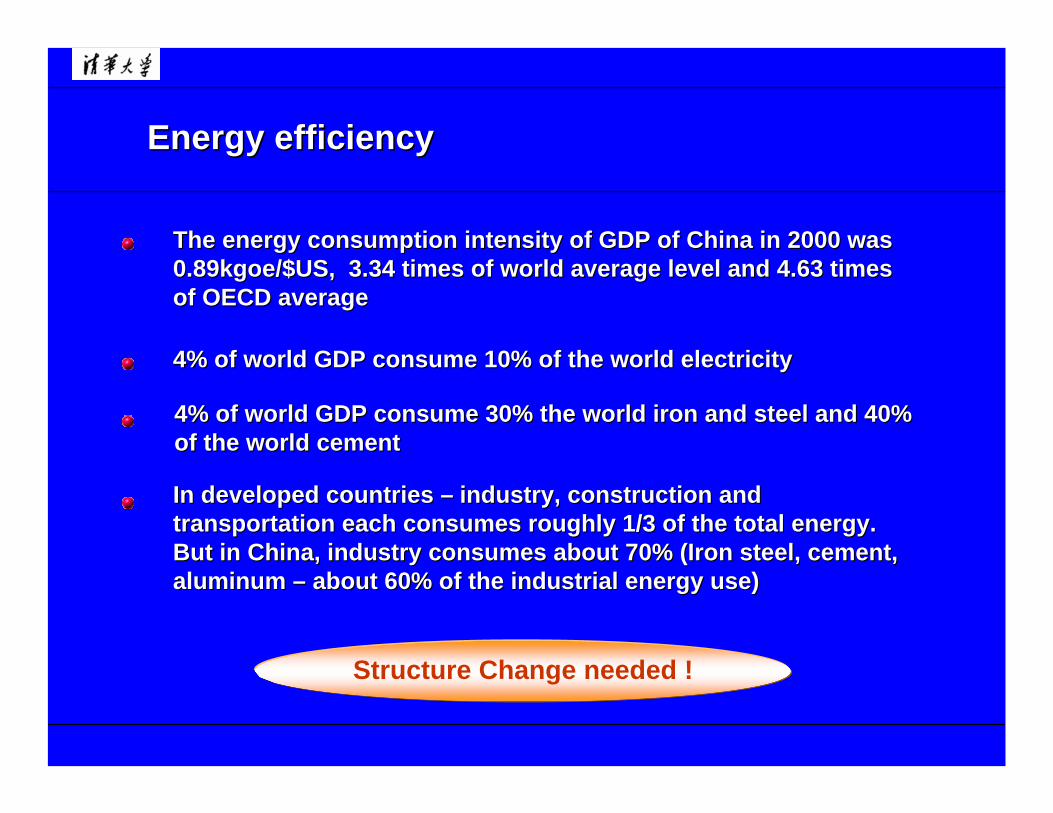
Energy efficiencyEnergy efficiency
The energy consumption intensity of GDP of China in 2000 was The energy consumption intensity of GDP of China in 2000 was 0.89kgoe/$US, 3.34 times of world average level and 4.63 times 0.89kgoe/$US, 3.34 times of world average level and 4.63 times of OECD averageof OECD average
4% of world GDP consume 10% of the world electricity4% of world GDP consume 10% of the world electricity
4% of world GDP consume 30% the world iron and steel and 40% 4% of world GDP consume 30% the world iron and steel and 40% of the world cementof the world cement
In developed countries In developed countries –– industry, construction and industry, construction and transportation each consumes roughly 1/3 of the total energy. transportation each consumes roughly 1/3 of the total energy. But in China, industry consumes about 70% (Iron steel, cement, But in China, industry consumes about 70% (Iron steel, cement, aluminum aluminum –– about 60% of the industrial energy use)about 60% of the industrial energy use)
Structure Change needed !
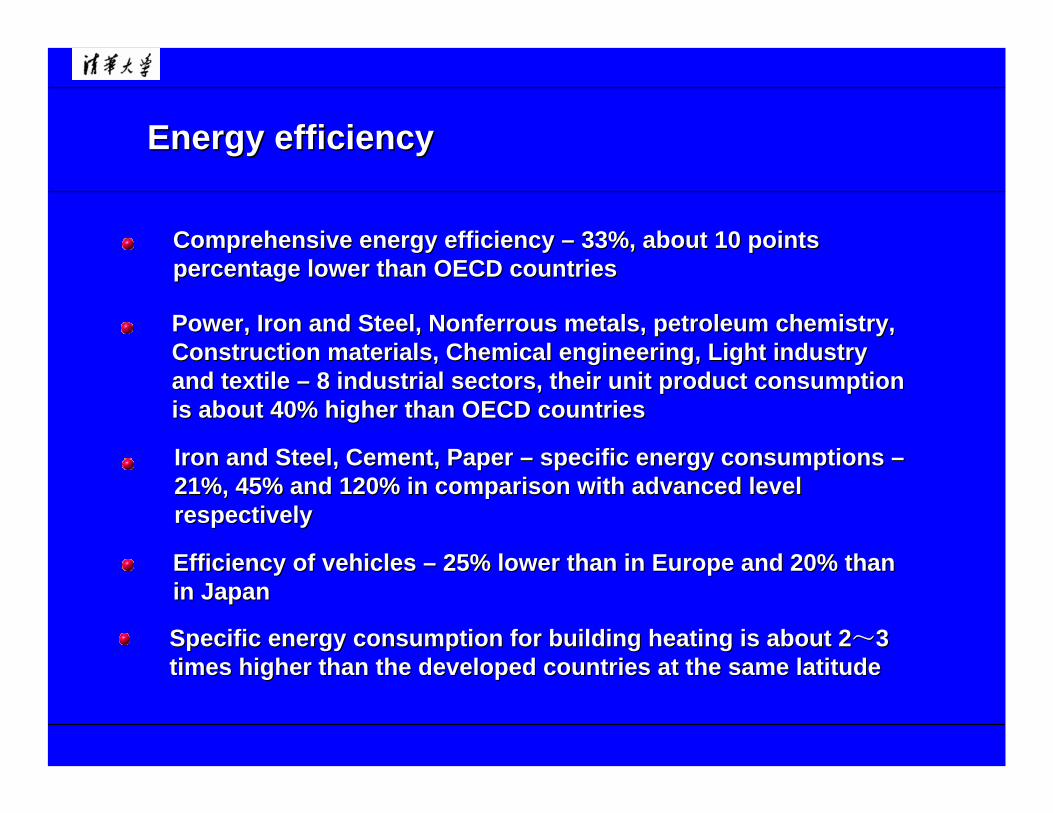
Energy efficiencyEnergy efficiency
Comprehensive energy efficiency Comprehensive energy efficiency –– 33%, about 10 points 33%, about 10 points percentage lower than OECD countriespercentage lower than OECD countries
Power, Iron and Steel, Nonferrous metals, petroleum chemistry, Power, Iron and Steel, Nonferrous metals, petroleum chemistry, Construction materials, Chemical engineering, Light industry Construction materials, Chemical engineering, Light industry and textile and textile –– 8 industrial sectors, their unit product consumption 8 industrial sectors, their unit product consumption is about 40% higher than OECD countriesis about 40% higher than OECD countries
Iron and Steel, Cement, Paper Iron and Steel, Cement, Paper –– specific energy consumptions specific energy consumptions ––21%, 45% and 120% in comparison with advanced level 21%, 45% and 120% in comparison with advanced level respectively respectively
Efficiency of vehicles Efficiency of vehicles –– 25% lower than in Europe and 20% than 25% lower than in Europe and 20% than in Japanin Japan
Specific energy consumption for building heating is about 2Specific energy consumption for building heating is about 2~~3 3 times higher than the developed countries at the same latitudetimes higher than the developed countries at the same latitude
Enormous potential of energy conservation and Enormous potential of energy conservation and efficiency improvement efficiency improvement
Energy efficiencyEnergy efficiency
In this concern, not only technology, more important is the In this concern, not only technology, more important is the institutional issues institutional issues –– government policy and regulations, government policy and regulations, taxation, financial incentive of the parties (sectors)taxation, financial incentive of the parties (sectors)
Severe PollutionSevere Pollution
In 2020 the SOIn 2020 the SO22 and NOand NOxx pollutant could be 40Mt and 35Mt pollutant could be 40Mt and 35Mt and exceed 16Mt and 19Mt of the pollutant limits respectively, and exceed 16Mt and 19Mt of the pollutant limits respectively, if no additional control measures will be takenif no additional control measures will be taken
About 40% of the territory of China is suffering acid rainAbout 40% of the territory of China is suffering acid rain
China is the second largest COChina is the second largest CO22 emission country, it will emission country, it will increase in the futureincrease in the future
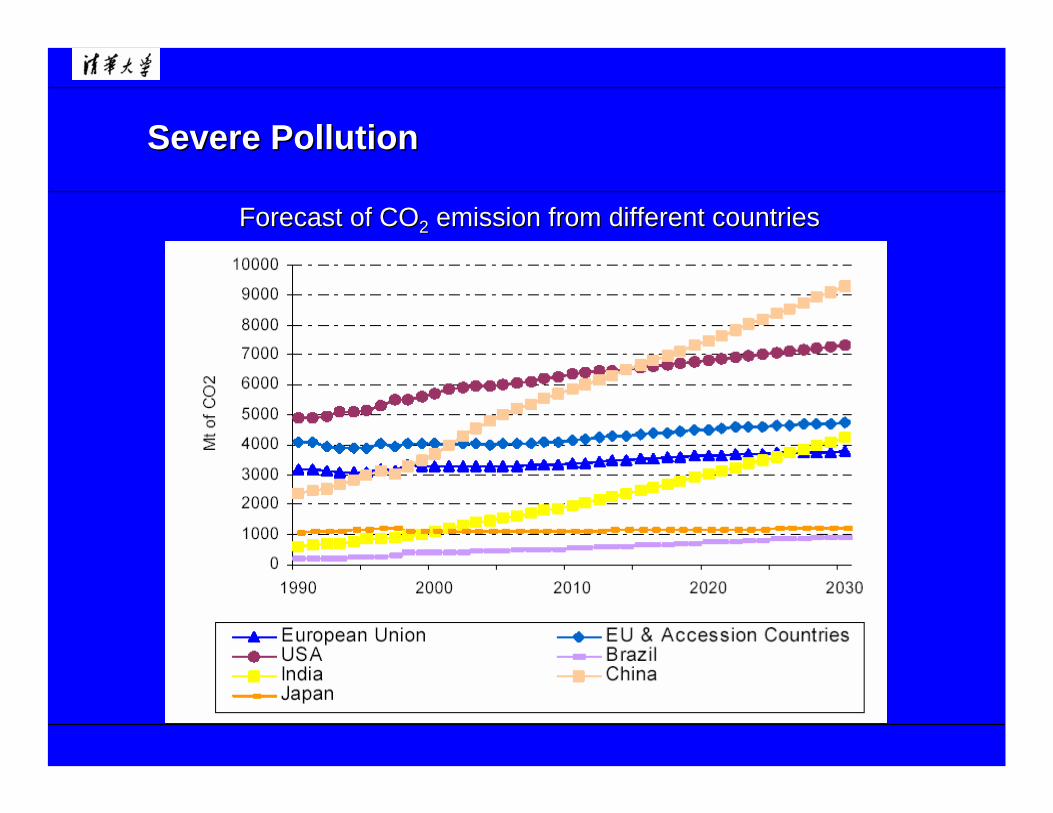
Forecast of COForecast of CO22 emission from different countriesemission from different countries
Severe PollutionSevere Pollution
•• According to the projection of energy demand and supply, According to the projection of energy demand and supply, coal will still play the dominant role (50%~60% in 2050)coal will still play the dominant role (50%~60% in 2050)
•• Coal utilization will contribute about 70%~75% of COCoal utilization will contribute about 70%~75% of CO22 in in China (at present 76.8%), and SOChina (at present 76.8%), and SO22, NO, NOxx, PM, PM55, Hg as well, Hg as well
•• Coal mainly will be used for power generation in future (up Coal mainly will be used for power generation in future (up to 80%, at present about 45~50%), It means coal fired to 80%, at present about 45~50%), It means coal fired power plants will contribute 60% or more COpower plants will contribute 60% or more CO22 of totalof total
General ConclusionsGeneral Conclusions
•• Large scale mitigation of shortage of liquid fuel could be Large scale mitigation of shortage of liquid fuel could be realized only by coalrealized only by coal--derived alternatives (Fderived alternatives (F--T synthetic fuel, T synthetic fuel, Methanol, DME), Biodiesel and ethanol from corn and Methanol, DME), Biodiesel and ethanol from corn and cellulose could only solve small part of the shortage problemcellulose could only solve small part of the shortage problem
•• Capture COCapture CO22 from flue gas of power plants is investment from flue gas of power plants is investment intensive and with unaffordable large (per unit COintensive and with unaffordable large (per unit CO22) energy ) energy consumptionconsumption
•• ““Hydrogen EconomyHydrogen Economy”” with renewable derived hydrogen is with renewable derived hydrogen is still a long way to go (20~30 years)still a long way to go (20~30 years)
General ConclusionsGeneral Conclusions
What is the way out ?What is the way out ?
•• Sustainable utilization of coal or modernized coal utilization Sustainable utilization of coal or modernized coal utilization beyond direct combustionbeyond direct combustion
•• Coproduction of Power, liquid fuel, chemicals, heat and gas Coproduction of Power, liquid fuel, chemicals, heat and gas via coal (or petrol coke) gasification and oncevia coal (or petrol coke) gasification and once--through through chemical reactors. chemical reactors.
That is:That is: POLYGENERATIONPOLYGENERATION
Except to speed up the development of nuclear and renewable energy
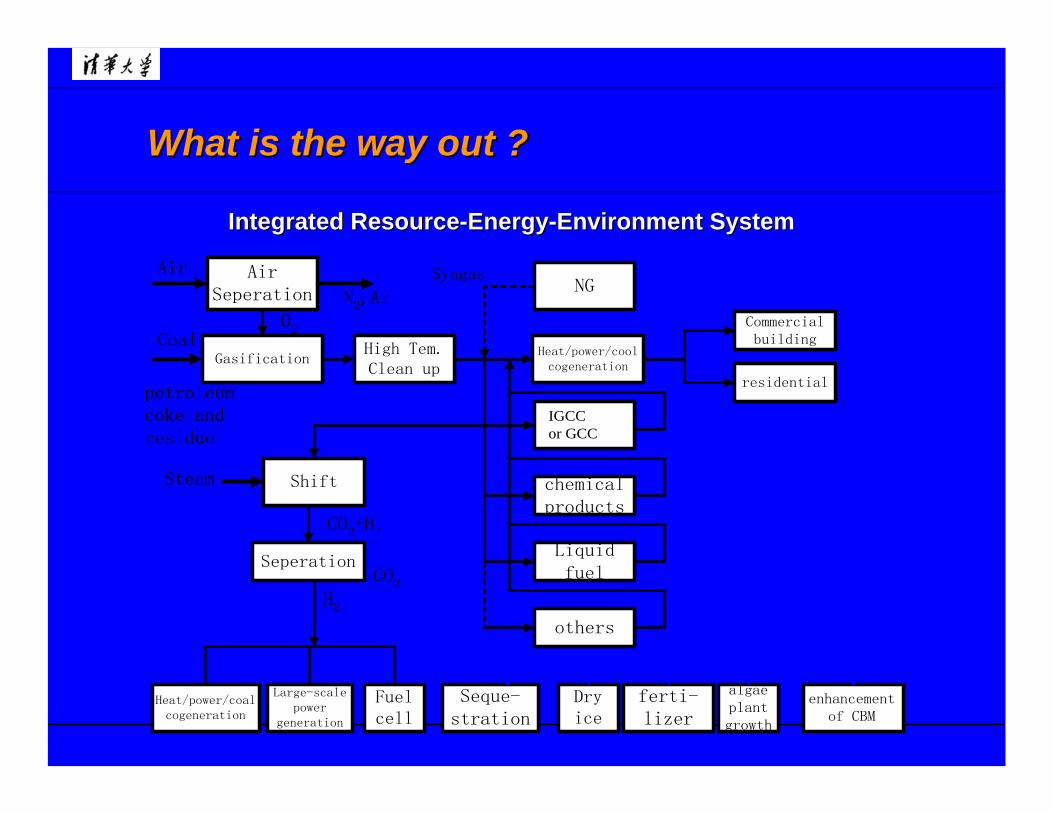
Integrated ResourceIntegrated Resource--EnergyEnergy--Environment SystemEnvironment System
AirSeperation
GasificationHigh Tem.Clean up
Air
Coal
petroleumcoke andresidue
O2
N2,ArNG
Heat/power/coolcogeneration
IGCC or GCC
chemicalproducts
Liquidfuel
others
Syngas
ShiftSteam
Seperation
Heat/power/coalcogeneration
Fuelcell
Large-scalepower
generation
Seque-stration
Dryice
ferti-lizer
algaeplantgrowth
CO2+H2
CO2
H2
Commercialbuilding
residential
enhancementof CBM
What is the way out ?What is the way out ?
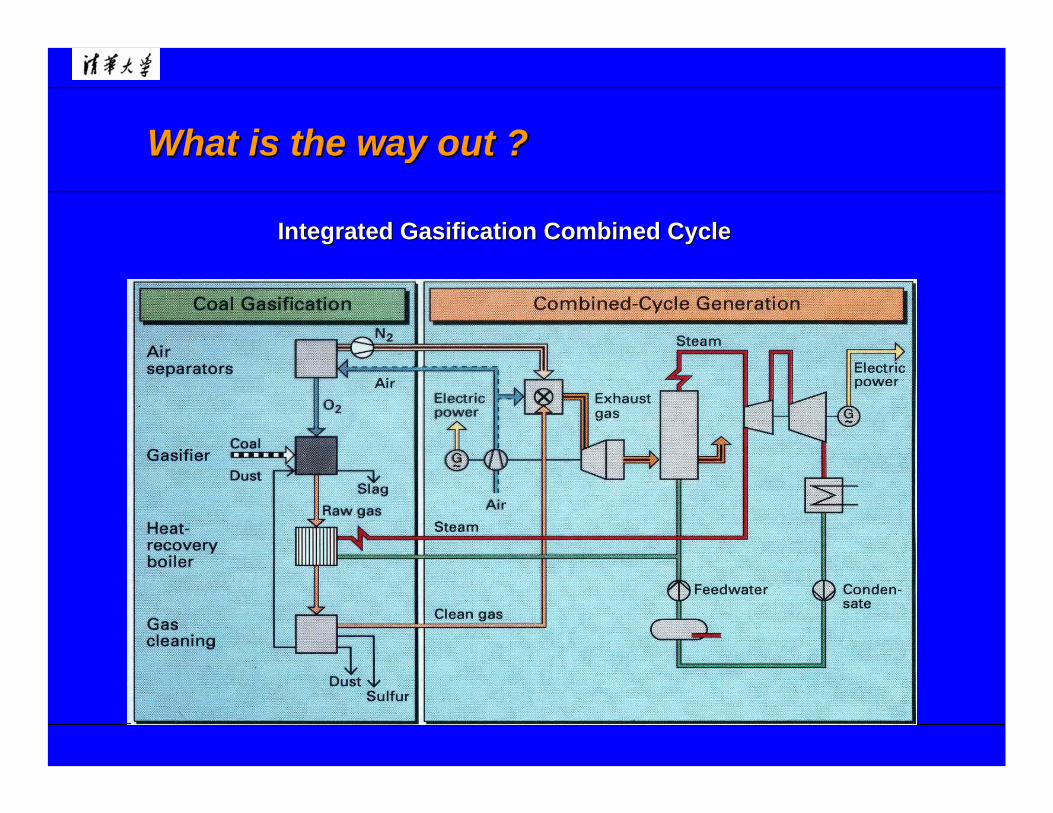
Integrated Gasification Combined CycleIntegrated Gasification Combined Cycle
What is the way out ?What is the way out ?
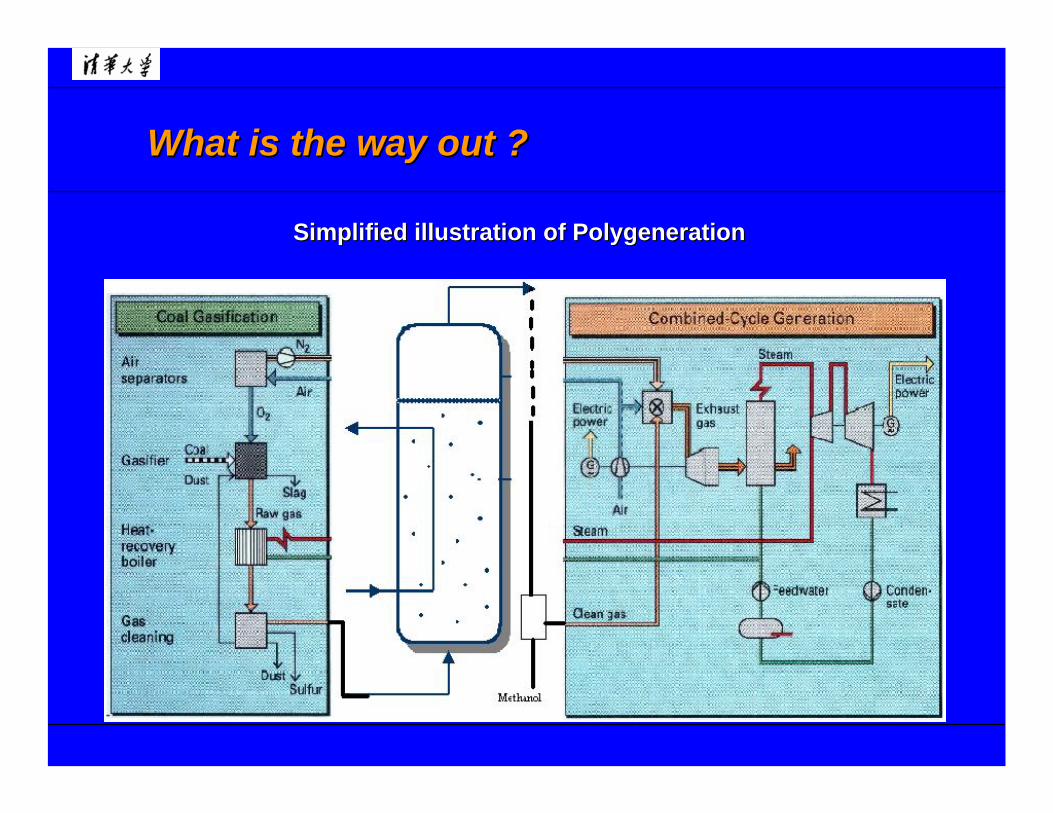
Simplified illustration of PolygenerationSimplified illustration of Polygeneration
What is the way out ?What is the way out ?
•• Polygeneration is the Polygeneration is the sustainablesustainable, , technically consistenttechnically consistent, , technologically realistictechnologically realistic, , economically beneficialeconomically beneficial, and , and ecologically friendlyecologically friendly way for COway for CO22 mitigation, capture, and mitigation, capture, and further sequestration. It is really the most important strategy further sequestration. It is really the most important strategy in China, even in the worldin China, even in the world
What is the way out ?What is the way out ?
•• PolygenerationPolygeneration
–– It doesnIt doesn’’t need specific technology breakthroughs, t need specific technology breakthroughs, consistent to the existing technologiesconsistent to the existing technologies
–– Concentrated COConcentrated CO22 could be easily captured along with could be easily captured along with the natural technological processes, that is, the natural technological processes, that is, polygeneration has the polygeneration has the naturenature easy for COeasy for CO22 capturecapture
–– This is the strategic way for COThis is the strategic way for CO22 mitigation in Chinamitigation in China
What is the way out ?What is the way out ?
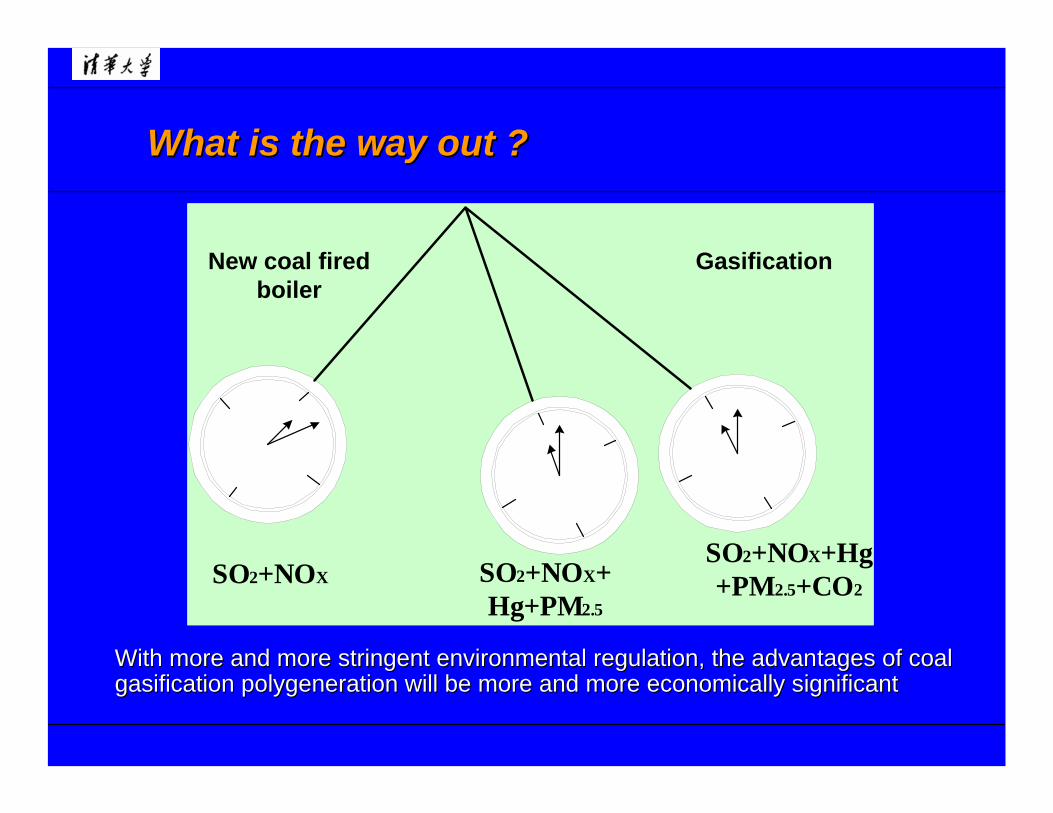
With more and more stringent environmental regulation, the advanWith more and more stringent environmental regulation, the advantages of coal tages of coal gasification polygeneration will be more and more economically sgasification polygeneration will be more and more economically significantignificant
SO2+NOX SO2+NOX+Hg+PM2.5
SO2+NOX+Hg+PM2.5+CO2
New coal fired boiler
Gasification
What is the way out ?What is the way out ?
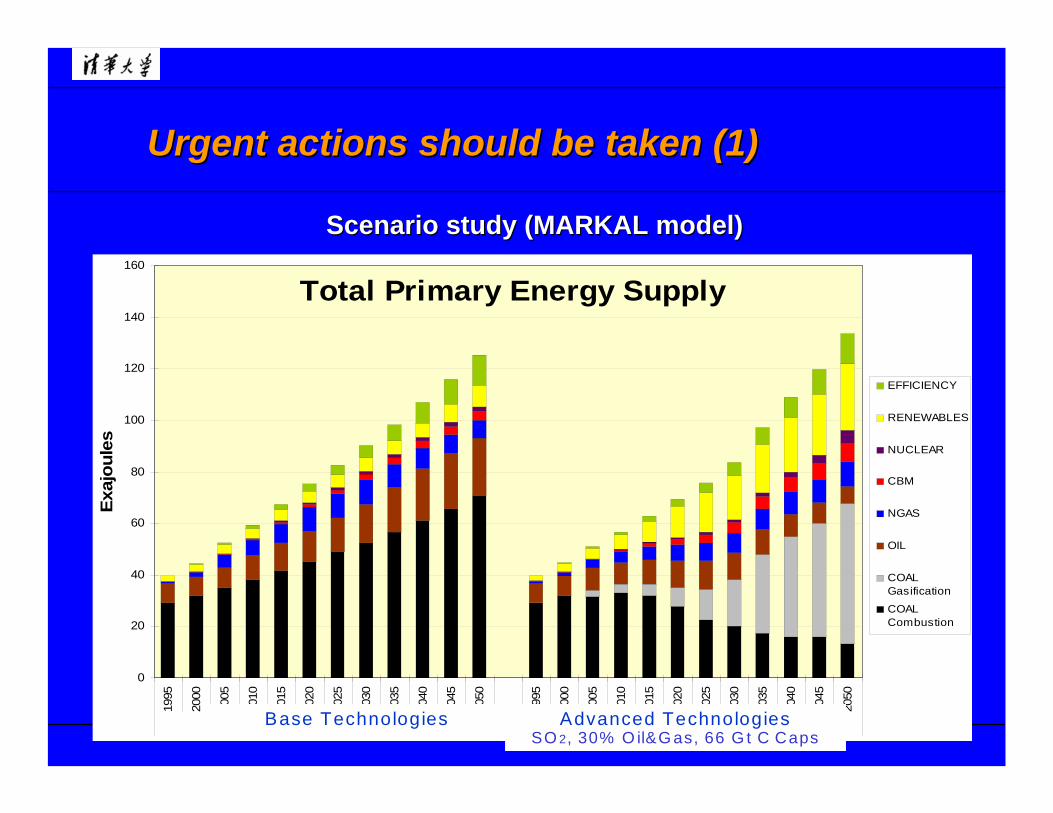
Total Primary Energy Supply
0
20
40
60
80
100
120
140
160
1995
2000
2005
2010
2015
2020
2025
2030
2035
2040
2045
2050
1995
2000
2005
2010
2015
2020
2025
2030
2035
2040
2045
2050
BASE CASE Updated model Updated AdvTech with All Caps and Low Nuclear
Exaj
oule
s
EFFICIENCY
RENEWABLES
NUCLEAR
CBM
NGAS
OIL
COALGasification
COALCombustion
Base Technologies Advanced TechnologiesSO 2, 30% O il&G as, 66 G t C Caps
Scenario study (MARKAL model)Scenario study (MARKAL model)
Urgent actions should be taken (1)Urgent actions should be taken (1)
The effect of Advanced Technologies Scenario
•• Provides the same energy services at about the same cost as Provides the same energy services at about the same cost as the Base technologies strategy the Base technologies strategy
•• SOSO22 emissions are reduced from 23.7 Mt in 1995 to 16.2 Mt in emissions are reduced from 23.7 Mt in 1995 to 16.2 Mt in 2020 and 8.8 Mt in 2050 2020 and 8.8 Mt in 2050
•• Imports of oil and natural gas are limited to 30% of consumptionImports of oil and natural gas are limited to 30% of consumptionof oil and gas over the longof oil and gas over the long--term term
•• 66 Gt C caps66 Gt C caps
Urgent actions should be taken (2)Urgent actions should be taken (2)
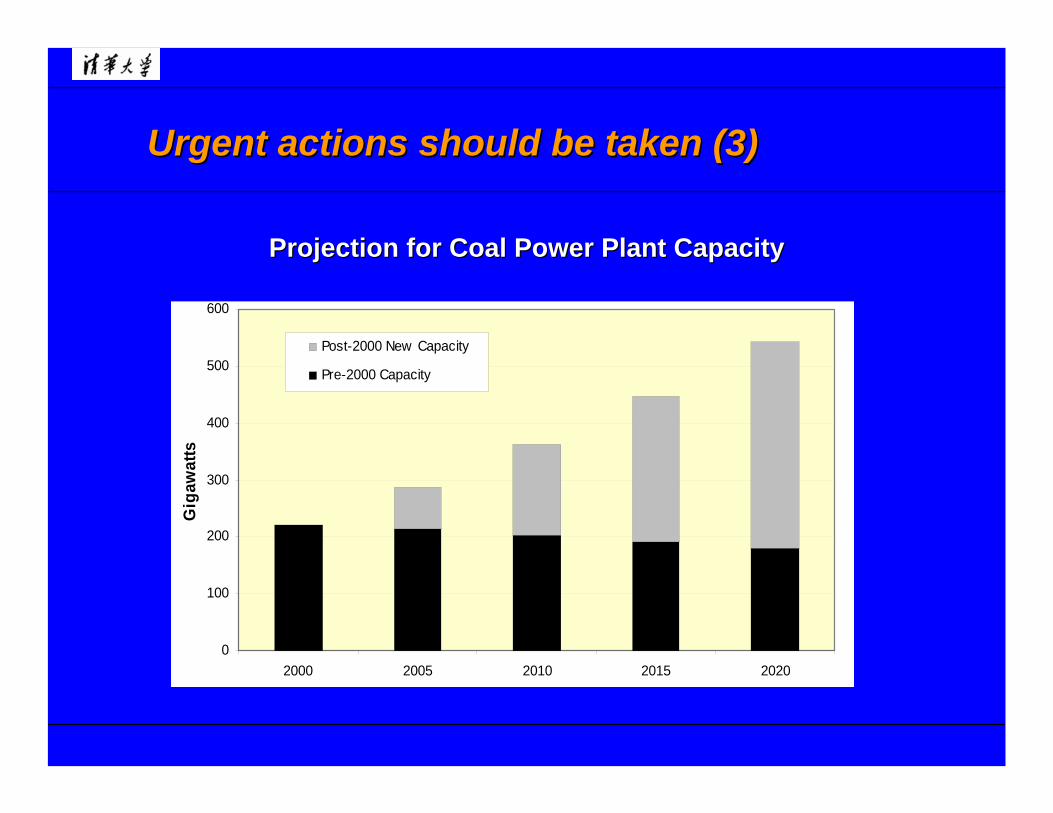
Projection for Coal Power Plant CapacityProjection for Coal Power Plant Capacity
0
100
200
300
400
500
600
2000 2005 2010 2015 2020
Gig
awat
ts
Post-2000 New Capacity
Pre-2000 Capacity
Urgent actions should be taken (3)Urgent actions should be taken (3)
Delaying the start of the transition to coal gasification based Delaying the start of the transition to coal gasification based polygeneration technology would significantly increase: polygeneration technology would significantly increase:
•• the costs to China of air pollution damagesthe costs to China of air pollution damages
•• the costs of oil importsthe costs of oil imports
•• the costs of reducing GHG emissionsthe costs of reducing GHG emissions
Urgent actions should be taken (4)Urgent actions should be taken (4)
•• China needs a integrated, but divided into long term(20~50 China needs a integrated, but divided into long term(20~50 years), intermediate term (8~15 years) and short term (3~8 years), intermediate term (8~15 years) and short term (3~8 years) energy strategyyears) energy strategy
•• Any significant change in energy system needs long period Any significant change in energy system needs long period (large inertial system with big time constant)(large inertial system with big time constant)
Step on the peel of watermelon (or banana), slipping anywhere Step on the peel of watermelon (or banana), slipping anywhere without definite direction without definite direction
When head aches When head aches –– treat only headache, when leg aches treat only headache, when leg aches ––treat only leg achetreat only leg ache
Are Are notnot the way for Chinathe way for China’’s energys energy
ConclusionsConclusions

Thank You!Thank You!