Embed Size (px)
DESCRIPTION
Â
Citation preview
ISBN 978-92-9060-330-6Natural ResourcesManagement DivisionWorking PaperNo. 2007-5
Wo
rkin
g P
aper
200
7- 5
Utilization of high-resolutionsatellite images to improve statisticsfor the sweetpotato cultivated area ofKumi district, Uganda
P. Zorogastúa, International Potato Center (CIP), Lima, PeruR. Quiroz, International Potato Center (CIP), Lima, PeruM. Potts, International Potato Center (CIP), SSA1
S. Namanda, International Potato Center (CIP), SSAV. Mares, International Potato Center (CIP), Lima, PeruL. Claessens, International Potato Center (CIP), SSA
1 Now at Catholic Relief Services (CRS), Nairobi.
iii
Table of Contents Utilization of high-resolution satellite images to improve statistics for the sweetpotato cultivated area of Kumi district, Uganda 1 INTRODUCTION 1 Agricultural statistics and remote sensing 2 Physical basis of the discrimination between crops 3 MATERIALS AND METHODS 6 Material and equipment 7 Image Processing 7 RESULTS AND DISCUSSION 9 CONCLUSIONS 13 REFERENCES 14
Preface This working paper has been written by scientists from different research divisions of the
International Potato Center (CIP). It describes a methodology based on the use of high-resolution
satellite images and spectroradiometry to gather data to construct reliable statistics on
sweetpotato cropping areas. The pilot study was conducted in a region located in eastern
Uganda, where sweetpotato is cultivated in two cropping seasons. The results suggest that the
tested method substantially improves estimation of cropping areas compared to traditional
statistics based on field surveys and censuses.
v
Acknowledgements The authors appreciate the technical support of fellow members of the NRM Division.


U T I L I Z A T I O N O F H I G H R E S O L U T I O N S A T E L L I T E I M A G E S 1
Utilization of high-resolution satellite images to improve statistics for the sweetpotato cultivated area of Kumi district, Uganda
INTRODUCTION
Crop statistics information is important for the implementation of research and development
projects. Agricultural statistics are utilized for decision making with regard to planning
development activities to benefit the populations occupying a target region. FAO (1999, 2003)
points out that in order to plan agricultural research and rural development strategies, it is
absolutely necessary to have an information system that provides reliable data on the total area
cultivated under a specific crop, the size of production units, the agroecological areas where the
crops are found, soil and climate characteristics, the socioeconomic condition of the producers
and the cropping schedule, among others.
In recent years, CIP has introduced several orange-fleshed sweetpotato clones in Africa as a
strategy to solve the severe vitamin A deficiency affecting the human population. This
introduction requires precise information on the current area of sweetpotato cultivation to assess
potential dissemination of new germplasm and its beneficiaries on both spatial and time scales.
This knowledge is necessary for estimating production, marketable volumes, per capita
consumption, required inputs and to orient research. There are reasons to believe that public
statistics on cultivated extensions in Africa do not bear much relation to the actual cultivated
area. This reasonable doubt is based on the fact that crop statistics related to small producers are
obtained through field sampling and survey techniques that have some limitations. For this
reason, CIP’s Natural Resources Management Division is developing and validating a
methodology based on spectroradiometry and the use of high-resolution remote sensing images
that provides reliable, accurate, and dynamic information for estimating cropping areas. This
methodology has been tested in Uganda where CIP has recently introduced orange-fleshed
sweetpotato clones and where sweetpotato is perceived as a replacement for cassava as one of
the principal staple crops. According to recent data, sweetpotato is the fifth most important crop
in Uganda, with respect to cultivated area, after banana, beans, corn, and millet and is third in
terms of fresh weight produced (Odongo et al., 2004). In eastern Uganda, sweetpotato is
cultivated in two cropping seasons, the first between March and June, and the second in August
through November. These cropping seasons are determined by the occurrence of precipitation

C I P • N A T U R A L R E S O U R C E S M A N A G E M E N T W O R K I N G P A P E R 2 0 0 7 - 5
2 U T I L I Z A T I O N O F H I G H R E S O L U T I O N S A T E L L I T E I M A G E S
and the availability of moisture in the soil. Most of the sweetpotato is produced by poor farmers,
in plots of less than 0.1 ha.
Agricultural statistics and remote sensing
The National Agricultural Statistics Service (NASS) of the United States Department of Agriculture
(USDA) has been involved since 1972 in applying information-gathering techniques for statistical
purposes and agricultural monitoring, having utilized LANDSAT scenes since 1976 to establish a
sampling frame as primary auxiliary variable. However, in this case the images were available only
at the end of the growing season (Hanuschak and Delince, 2004).
One of the largest projects to obtain crop statistics from images of LANDSAT satellite, agricultural
and climate data and advanced data processing, was the Large Area Crop Inventory Experiment –
LACIE, that was carried out between 1974 and 1978 by three US agencies, in order to predict in
real time the production of wheat of the Soviet Union (MacDonald and Hall, 1980).
Estimation of the extent of crop areas based on the integration of field surveys and satellite
images of high spatial resolution has been carried out operationally in the United States and
Europe since 1980 (Allen et al., 2002). However, due to limitations imposed by the spatial
resolution of satellite products, until the end of the 1990s many institutions utilized the images
only as a sampling frame. In the European Union, progress was made by the expansion of the
project Monitoring Agriculture through Remote Sensing (MARS) to more countries (Hanuschak
and Delince, 2004). An example of evolution in the utilization of remote sensing techniques for
the acquisition of data on agriculture is the case of Hungary, where changes in the economic
model brought about changes in land tenure, size of farms and number of farmers, as well as in
agricultural technology and investment. This created the need for an efficient information
system, which led to the establishment in 1980 of the Hungarian Agricultural Remote Sensing
Program – HARSP (Csornai et al., 2006), whose objective was to implement a monitoring system
for the gathering of reliable, accurate information about major crops, including the extent of
cropping areas, their growth and problems (particularly the evaluation of drought risks), as well
as to predict yields.
A key step in producing agricultural statistics is the stratification of the target region by dividing it
into sub-units (Roller and Colwell, 1986), which have less variability than the region as a whole,
allowing for more precise target crops assessment. In some cases the administrative limits of a
region are used for stratification, such as the instance described by Fang (1998) concerning the
estimation of rice yields through remote sensing data.

C I P • N A T U R A L R E S O U R C E S M A N A G E M E N T W O R K I N G P A P E R 2 0 0 7 - 5
U T I L I Z A T I O N O F H I G H R E S O L U T I O N S A T E L L I T E I M A G E S
3
In April 1986 the program SPOT Image led by France and other European countries was launched.
CNESS SPOT has put in orbit several satellites for observing terrestrial resources. Currently, the
SPOT 5 satellite is operational. The characteristics of this satellite are presented in Table 1.
Source: http://www.spotimage.fr/automne_modules_files/standard/public/p229_3a1cd2cb59b76fc75e20286a6abb7efesatSpot_E.pdf
Physical basis of the discrimination between crops
When radiant energy strikes any material an interaction occurs. Thus, the crops interact with
solar radiation. A fraction of incoming radiation is absorbed by the plant pigments
chlorophyll, carotenoids, xanthophylls and others (Figure 1), another fraction is transmitted
toward the bottom of the canopy and the soil, and a further fraction is reflected back to
space (Colwell, 1983: 2310).
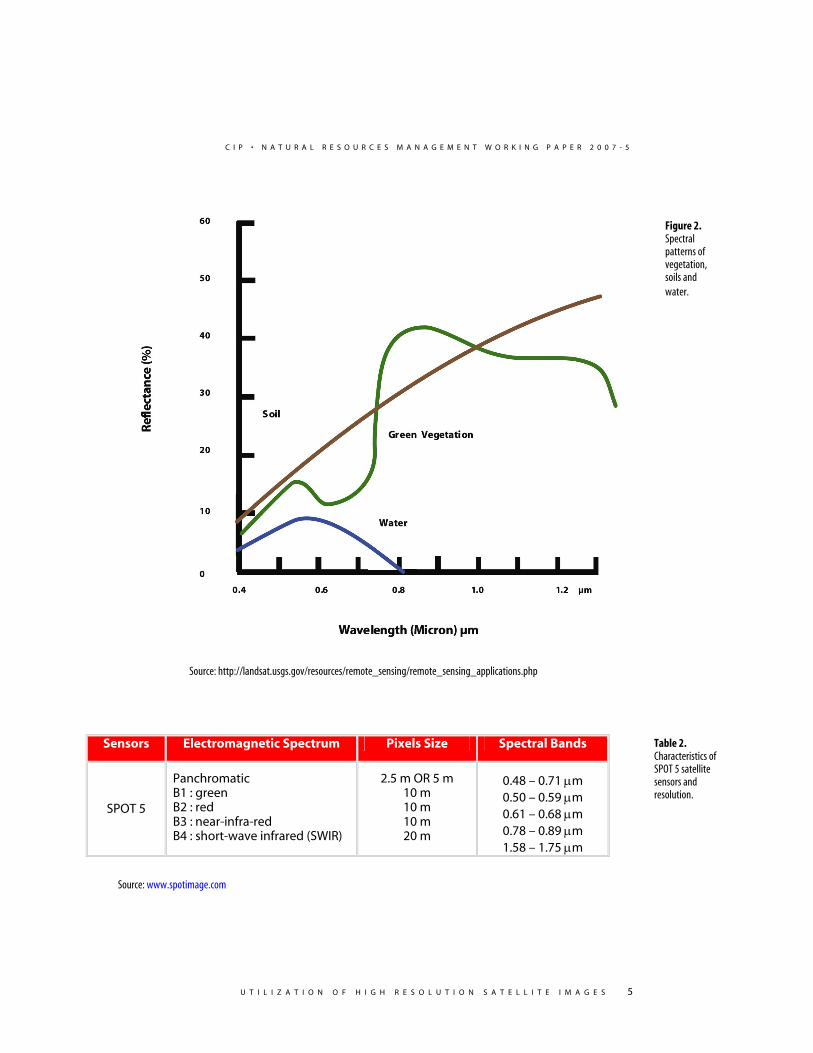
The property that is utilized to obtain information on the interaction between radiant energy and
objects on the earth’s surface is reflectance, which is the ratio of the energy reflected in a given
wavelength to the incoming energy (Lillesand and Kiefer, 1994). Vegetation, soil, and water
bodies have distinct spectral patterns of reflectance (Figure 2), which makes it possible to
differentiate them. Furthermore, different kinds of vegetation coverage have distinct spectral
Table 1. Characteristics of the products generated by the SPOT Satellite.

C I P • N A T U R A L R E S O U R C E S M A N A G E M E N T W O R K I N G P A P E R 2 0 0 7 - 5
4 U T I L I Z A T I O N O F H I G H R E S O L U T I O N S A T E L L I T E I M A G E S
patterns or spectral signatures (Jensen, 1996: 316; Richards, 1993) that are utilized to distinguish
them from other plant coverage and land uses, making it possible to quantify their respective
areas. This differentiation between plant covers is based on the radiometric differentiation of the
classes being considered (Lemoine and Kidd, 1998).
Source: http://generalhorticulture.tamu.edu/lectsupl/Physiol/physiol.html
To accommodate the diversity of plot sizes, crop species, varieties, clones and cropping systems
found in a region, satellite products with the appropriate level of spatial, spectral and time
resolution are needed. Spatial resolution is the property that makes it possible to distinguish
between two objects when they are very close. Spectral resolution, with a given number of bands
that covers not only the visible region of the electromagnetic spectrum, but also the near-
infrared, makes it possible to discriminate different spectral signatures. In turn, time resolution
permits registry of information from the same place with a given time sequence.
The spectral bands that the SPOT 5 satellite registers are presented in the Table 2
Figure 1. Spectra of
absorption ofchlorophyll and
carotenoids.
C I P • N A T U R A L R E S O U R C E S M A N A G E M E N T W O R K I N G P A P E R 2 0 0 7 - 5
U T I L I Z A T I O N O F H I G H R E S O L U T I O N S A T E L L I T E I M A G E S
5
Source: http://landsat.usgs.gov/resources/remote_sensing/remote_sensing_applications.php
Source: www.spotimage.com
Sensors Electromagnetic Spectrum Pixels Size Spectral Bands
SPOT 5
Panchromatic B1 : green B2 : red B3 : near-infra-red B4 : short-wave infrared (SWIR)
2.5 m OR 5 m 10 m 10 m 10 m 20 m
0.48 – 0.71 µm 0.50 – 0.59 µm 0.61 – 0.68 µm 0.78 – 0.89 µm 1.58 – 1.75 µm
Figure 2.Spectral patterns of vegetation, soils and water.
Table 2. Characteristics of SPOT 5 satellite sensors and resolution.
C I P • N A T U R A L R E S O U R C E S M A N A G E M E N T W O R K I N G P A P E R 2 0 0 7 - 5
6 U T I L I Z A T I O N O F H I G H R E S O L U T I O N S A T E L L I T E I M A G E S
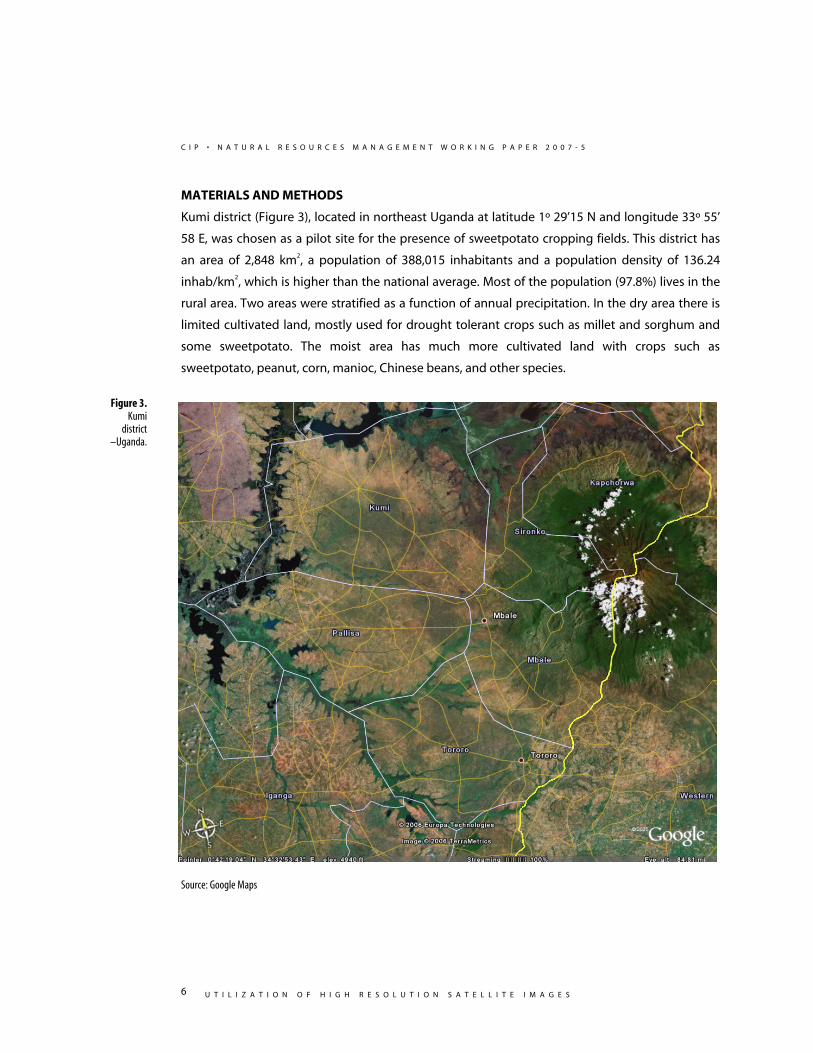
MATERIALS AND METHODS
Kumi district (Figure 3), located in northeast Uganda at latitude 1º 29’15 N and longitude 33º 55’
58 E, was chosen as a pilot site for the presence of sweetpotato cropping fields. This district has
an area of 2,848 km2, a population of 388,015 inhabitants and a population density of 136.24
inhab/km2, which is higher than the national average. Most of the population (97.8%) lives in the
rural area. Two areas were stratified as a function of annual precipitation. In the dry area there is
limited cultivated land, mostly used for drought tolerant crops such as millet and sorghum and
some sweetpotato. The moist area has much more cultivated land with crops such as
sweetpotato, peanut, corn, manioc, Chinese beans, and other species.
Source: Google Maps
Figure 3. Kumi
district–Uganda.

C I P • N A T U R A L R E S O U R C E S M A N A G E M E N T W O R K I N G P A P E R 2 0 0 7 - 5
U T I L I Z A T I O N O F H I G H R E S O L U T I O N S A T E L L I T E I M A G E S
7
Material and equipment
Cartographic material.
Multispectral (XS) and panchromatic (P) images from the SPOT satellite with a spatial
resolution of 10 and 5 meters, respectively, captured on May 6, 2006 (Figure 4) and on
October 15, 2006. The initial spatial resolution in the multispectral scene was 10 m and
the panchromatic band with a 5 m resolution was used for resampling the scene to this
resolution. Since the photogrammetric chart for the geometric correction was not
available, the requested scenes were corrected with the parameters of navigation of the
SPOT 5 satellite.
Handheld ASD FieldSpec pectroradiometer.
Magellan Platinum Global Positioning System.
Laptop Dell Inspiron 600 m.
Canon Digital Camera.
Environment for Visualizing Images (ENVI) v. 4.1 Software.
Image Processing
The methodology utilized for sweetpotato cropping area data acquisition is based on the use of
high-resolution images captured by the SPOT satellite, complemented by radiometric evaluation of
the cultivated fields. Transects from Mbale to Soroti were marked by the access roads, following the
distribution of the areas with the highest density of sweetpotato fields, where radiometric
measurements were made with a handheld ASD FieldSpec spectroradiometer. The coordinates of
the cultivated fields were recorded in order to locate them in the SPOT satellite scenes.
ENVI software was used for processing the digital satellite data. An unsupervised classification
was initially carried out, using clustering algorithms for ordering the high variability of land use
and plant coverage. A supervised classification was subsequently carried out based on the
spectral patterns recorded in the field, which was used for obtaining the spatial distribution of
the sweetpotato plots, as well as the cultivated area through the maximum likelihood classifier.
The digital process consisted of the sampling of the scene areas covered with sweetpotato,
verified in the field in May and November of 2006, which were then graphically shown in the
corresponding scene in order to carry out a supervised classification.

C I P • N A T U R A L R E S O U R C E S M A N A G E M E N T W O R K I N G P A P E R 2 0 0 7 - 5
8 U T I L I Z A T I O N O F H I G H R E S O L U T I O N S A T E L L I T E I M A G E S
Mango tree
House roof
Grass
Road
Mango tree
House roof
Grass
Road
Source: SPOT Image
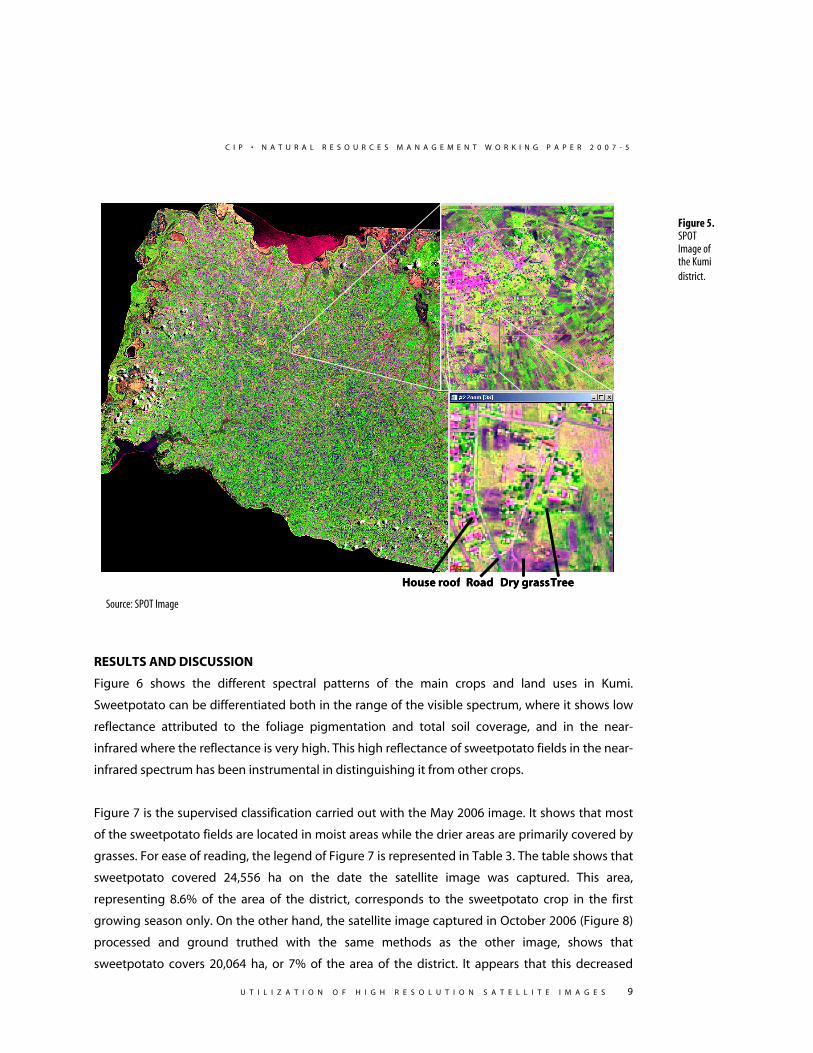
Subsequently, the geographical area of the district was delimited by means of a mask (image
bitmap), which defined the cropping areas of sweetpotato and of other crops (Figure 5). In order
to establish the percentage of success of the selected classes, the contingency matrix was
calculated. It showed that the misclassification error for sweetpotato was 6%, which is
satisfactorily low.
Figure 4. Multispectral
Spot Image of the study
area.
C I P • N A T U R A L R E S O U R C E S M A N A G E M E N T W O R K I N G P A P E R 2 0 0 7 - 5
U T I L I Z A T I O N O F H I G H R E S O L U T I O N S A T E L L I T E I M A G E S
9
Source: SPOT Image
RESULTS AND DISCUSSION
Figure 6 shows the different spectral patterns of the main crops and land uses in Kumi.
Sweetpotato can be differentiated both in the range of the visible spectrum, where it shows low
reflectance attributed to the foliage pigmentation and total soil coverage, and in the near-
infrared where the reflectance is very high. This high reflectance of sweetpotato fields in the near-
infrared spectrum has been instrumental in distinguishing it from other crops.
Figure 7 is the supervised classification carried out with the May 2006 image. It shows that most
of the sweetpotato fields are located in moist areas while the drier areas are primarily covered by
grasses. For ease of reading, the legend of Figure 7 is represented in Table 3. The table shows that
sweetpotato covered 24,556 ha on the date the satellite image was captured. This area,
representing 8.6% of the area of the district, corresponds to the sweetpotato crop in the first
growing season only. On the other hand, the satellite image captured in October 2006 (Figure 8)
processed and ground truthed with the same methods as the other image, shows that
sweetpotato covers 20,064 ha, or 7% of the area of the district. It appears that this decreased
Figure 5. SPOT Image of the Kumi district.
House roof Dry grassTreeRoadHouse roof Dry grassTreeRoad

C I P • N A T U R A L R E S O U R C E S M A N A G E M E N T W O R K I N G P A P E R 2 0 0 7 - 5
10 U T I L I Z A T I O N O F H I G H R E S O L U T I O N S A T E L L I T E I M A G E S
cropping area observed in the second season was due to abnormally delayed rains. Adding up
the sweetpotato cropping areas observed in the images from the two cropping seasons, the
yearly total for 2006 amounts to 44,620 ha. However, the more recent official data from the
Department of Statistics of Uganda (Figure 9), point out that in the whole year of 2003 the area
cultivated with sweetpotato in Kumi was 28,000 ha. Assuming that this estimation remains
approximately constant for the next years, including 2006, our remote sensing data suggests that
the official statistics record just the 63% of the sweetpotato cropping area in Kumi district. In
years with normal precipitation, the shortage of the official data would be even greater. If the
proportion holds true for other areas, the total area of sweetpotato in Uganda might well exceed
1 M ha.
Figure 6.Spectral
patterns ofthe main
crops andland uses in
Kumi.
CROPS REFLECTANCES
00.10.20.30.40.50.60.70.80.9
1
300 400 500 600 700 800 900 1000 1100 1200
Wavelength
Ref
lect
ance
Maize Bare Soil Millet Sweet potato Cassava Banana

C I P • N A T U R A L R E S O U R C E S M A N A G E M E N T W O R K I N G P A P E R 2 0 0 7 - 5
U T I L I Z A T I O N O F H I G H R E S O L U T I O N S A T E L L I T E I M A G E S
11
Source: CIP, NRM Geospatial Analysis Laboratory, based on a SPOT scene of May 6, 2006
Figure 7.Classified SPOT Image of Kumi district, May 2006.

C I P • N A T U R A L R E S O U R C E S M A N A G E M E N T W O R K I N G P A P E R 2 0 0 7 - 5
12 U T I L I Z A T I O N O F H I G H R E S O L U T I O N S A T E L L I T E I M A G E S
Source: CIP, NRM Geospatial Analysis Laboratory, based on a SPOT scene of Oct. 15, 2006
Ha % Ha %Water bodies 39310 13.8 37823 13.3Wetland 23858 8.4 22932 8.1Grassland/other crops 118324 41.5 104218 36.6Sweetpotato 24556 8.6 20064 7.0Forest/Mangoes 17710 6.2 17698 6.2Urban areas 11 0.0 11 0.0Fallow land 30840 10.8 70031 24.6Main/Secondary road .--/ 242 0.1 242 0.1Clouds 4872 1.7 0 0.0No data 25078 8.8 11782 4.1Total 284800 100.0 284800 100.0
LEGENDMay-06 Oct-06
Category
Figure 8.Classified
SPOT Image ofKumi district,
October 2006.
Table 3. Area covered by
different land use and plant cover
categories, May and October 2006.

C I P • N A T U R A L R E S O U R C E S M A N A G E M E N T W O R K I N G P A P E R 2 0 0 7 - 5
U T I L I Z A T I O N O F H I G H R E S O L U T I O N S A T E L L I T E I M A G E S
13
CONCLUSIONS
Radiometric evaluation and processing of SPOT scenes of Kumi district, Uganda, have made it
possible to determine that sweetpotato foliage has a distinct spectral pattern defined by low
reflectance in the visible range of the spectrum and high reflectance in the near-infrared range.
This spectral pattern makes it possible to identify a sweetpotato crop with a high degree of
certainty, which allows defining the cultivated area and spatial distribution of the crop with
precision through the utilization of high-resolution SPOT images. The results suggest that
traditional statistics underestimate the total annual sweetpotato cropping area in Kumi. Using
the tested method substantially improves estimation of cropping areas.
Figure 9. Sweetpotato cropping area in Kumi district according to official statistics of Uganda.
Area planted to Sweetpotato in Kumi
0 5,000
10,000 15,000
20,000 25,000 30,000
1992 1993 1994 1995 1996 1997 1998 1999 2000 2001 2002 2,003
Year
Ha.
Source: Uganda Bureau of Statistics (UBOS)
C I P • N A T U R A L R E S O U R C E S M A N A G E M E N T W O R K I N G P A P E R 2 0 0 7 - 5
14 U T I L I Z A T I O N O F H I G H R E S O L U T I O N S A T E L L I T E I M A G E S
REFERENCES
Allen, R., G. Hanuschak, and M. Craig. 2002. Future vision for the utilization of remotely sensed
data and Geographic Information Systems (GIS) in the National Agricultural Statistics Service.
From: http://www.usda.gov/nass/nassinfo/remotevision.htm
Colwell, R.N., ed. 1983. Manual of Remote Sensing. 2d Ed. 2 vols. Falls Church, Virginia: American
Society of Photogrammetry.
Csornai, G., Cs. Wirnhardt, Zs. Suba, P. Somogyi, G. Nádor, L. Martinovich, L. Tikász, A.
Kocsis, B. Tarcsai, Gy. Zelei. 2006. Remote Sensing based crop monitoring in Hungary.
From: http://www.fomi.hu/Internet/magyar/Projektek/remsensmonit.htm and abstract
at: http://www.igik.edu.pl/earsel2006/abstracts//
Fang, H. 1998. Rice crop area estimation of an administrative division in China using remote
sensing data. International Journal of Remote Sensing, Vol. 19(17): 3411–3419.
FAO. 1999. Crop Information Systems. From: http://www.fao.org/sd/EIdirect/EIre0078.htm
FAO. 2003. Remote Sensing for Decision-makers. From: http://www.fao.org/sd/EIdirect/EIre0072.htm
Hanuschak, G., and J. Delince. 2004. Utilization of data captured through remote sensing and of
geographic information systems for the livestock statistics in the United States and the European
Union. Third International Conference on Agricultural Statistics 2–4 November, 2004, Cancun,
Mexico.
Jensen, J. R. 1996. Introductory Digital Image Processing. 2d ed. Saddle River NJ: Prentice Hall.
Lemoine, G., R. Kidd. 1998. An alternative sampling technique for deriving crop area statistics
from hybrid remote sensing data. In: Proceedings: Retrieval of Bio- and Geo-Physical Parameters
from SAR Data for Land Applications Workshop. ESTEC, 21–23 October.
Lillesand, T.M., and R.W. Kiefer. 1994. Remote Sensing and Image Interpretation. 3d ed. New
York: John Wiley & Sons.
MacDonald, R. B., and F. G. Hall. 1980. Global Crop Forecasting. Science, Vol. 208 (4445):
670–679.
Odongo, B., R.O.M. Mwanga, and C. Niringiye, 2004. Promoting improved sweetpotato
varieties and processing technologies in Lira, Pallisa and Soroti Districts. Final Technical Report.
Namulonge Agricultural and Animal Production Research Institute (NAARI), Kampala, Uganda.
Richards, J.A. 1993. Remote Sensing Digital Image Analysis: An Introduction. 2d ed. N.Y.: Springer
Verlag.
Roller, N. E. G., and J. E. Colwell. 1986. Coarse-resolution satellite data for ecological surveys.
Bioscience Vol. 36(7): 468–75.

International Potato CenterApartado 1558 Lima 12, Perú • Tel 51 1 349 6017 • Fax 51 1 349 5326 • email [email protected]
CIP’s MissionThe International Potato Center (CIP) seeks to reduce poverty and achieve food security ona sustained basis in developing countries through scientific research and related activities onpotato, sweetpotato, and other root and tuber crops, and on the improved management ofnatural resources in potato and sweetpotato-based systems.
The CIP VisionThe International Potato Center (CIP) will contribute to reducing poverty and hunger; improvinghuman health; developing resilient, sustainable rural and urban livelihood systems; andimproving access to the benefits of new and appropriate knowledge and technologies. CIPwill address these challenges by convening and conducting research and supportingpartnerships on root and tuber crops and on natural resources management in mountainsystems and other less-favored areas where CIP can contribute to the achievement of healthyand sustainable human development.www.cipotato.org
CIP is supported by a group of governments, private foundations, and international andregional organizations known as the Consultative Group on International AgriculturalResearch (CGIAR).www.cgiar.org


