Embed Size (px)
Citation preview

12.1 India’s battle against rural poverty is being fought on many fronts simultaneously, with major schemes tackling one or more aspects of the challenge. Th e total budgetary allocation for all rural development programmes by the Government of India in 2009–10 was Rs 74,270 crore, which accounted for 31 per cent of the total Central Budget Plan provision. Rural development programmes cover employment programmes, such as the Mahatma Gandhi National Rural Employment Guarantee Act and the Swarnjayanti Gram Swarozgar Yojana, housing via the Indira Awaas Yojana (IAY), sanitation via the Total Sanitation Campaign (TSC), provision of drinking water via the National Rural Drinking Water Programme (described in the Chapter on Water Resources), watershed development via the Integrated Watershed Management Programme (described in the Chapter on Agriculture), road connectivity via the Pradhan Mantri Gram Sadak Yojana (described in the Chapter on Transport), electrifi cation via the Rajiv Gandhi Grameen Vidyutikaran Yojana (described in the Chapter on Energy), and social security via the National Social Assistance Programme, the Indira Gandhi National Widow Pension Scheme (IGNWPS), and the Indira Gandhi National Disability Pension Scheme (IGNDPS).
12.2 Th is chapter reviews many of these initiatives, with special reference to the progress made in the Eleventh Plan period.
12Rural Development
MAHATMA GANDHI NATIONAL RURAL EMPLOYMENT GUARANTEE ACT (MGNREGA)12.3 Th e MGNREGA has led to the largest employ-ment programme in human history and is unlike any other scheme in its scale, architecture, and thrust. Its bottom-up, people-centred, demand-driven, self-selecting, rights-based design is new and unprec-edented. MGNREGA enjoins the state to provide a guarantee of employment for 100 days every year to each rural household that demands work. It also demands of the people that they participate actively in the design and implementation of the programme. Th e programme started in February 2006 in the 200 most backward districts of India. It was extended to an additional 130 districts in the fi rst year of the Eleventh Plan (2007–08) and to the entire country in 2008–09. A brief overview of the performance of MGNREGA is given in Table 12.1.
12.4 The work undertaken through MGNREGA gives priority to activities related to water harvesting, groundwater recharge, drought-proofing, as also the problem of fl oods. Its focus on eco-restoration and sustainable livelihoods implies that its success should spur private investment by farmers on their lands. Th is would over time lead to an increase in land productivity generating a natural demand for labour, which would automatically reduce dependence on MGNREGA as a source of work. If it can strengthen Panchayati Raj, as it is meant to, MGNREGA can

252 Mid-Term Appraisal of the Eleventh Five Year Plan
have profound signifi cance for deepening democracy and governance reforms, especially in the remote hinterlands of India where the democratic fabric has come under strain in recent years.
12.5 Over the last four years, MGNREGA’s perfor-mance compares favourably with any other anti-poverty initiative that India has ever undertaken. It is estimated that in 2009–10, nearly 5 crore families would be provided around 300 crore man-days of work under the programme. Th is is more than three times the employment created by the rural employment programme in 2006–07. Till September 2009, the programme had provided nearly 600 crore man-days of work at a total expenditure of around Rs 70,000 crore.
12.6 Th e share of Scheduled Caste (SC) and Scheduled Tribe (ST) families in the work provided under MGNREGA over the previous four years ranged between 51 and 56 per cent, while 41–50 per cent of the workers were women. As many as 8.50 lakh diff erently-abled workers have so far been registered for work. Nearly 9 crore bank/post offi ce accounts of the poorest people have been opened for MGNREGA payments. Around 85 per cent of MGNREGA payments are made through this route, an unprecedented step in the direction of fi nancial inclusion.
PERFORMANCE ACROSS STATES12.7 Table 12.2 provides a comparative picture of MGNREGA’s performance across states in 2008–09,
the first year when the programme was extended across the entire country for which we have data available for the whole year. One indicator of the success of a demand-driven programme is its cover-age of those asking for work. Unfortunately states have not maintained a record of those asking for work but who did not get it. Th is makes it diffi cult to judge the quality of the guarantee element in MGNREGA, its most powerful distinguishing feature. Another indicator of success is the intensity of work provided, which refers to the number of days of work given to those who got any work. Th e national average intensity of work was 48 days. As many as 15 states fall below the national average. Only 14 per cent worker households completed 100 days of work.
12.8 It is relevant to ask whether a relatively low provision of work refl ects lack of demand or is it ineff ectiveness in being able to meet the demand. In certain states, the low number of days of work is almost certainly a refl ection of the universalization of the programme to the whole country which led to the inclusion of districts where the need and demand for MGNREGA work is low (Kerala and Punjab are examples of this). But there are many states where demand was expected to be high but which have not performed well, such as the high out-migration states of Orissa and Bihar, as also states, such as Uttarakhand and Karnataka, which appear to have not given the due attention to energizing MGNREGA. It would be possible to form a judgment on this if states start
TABLE 12.1Overview of MGNREGA Performance, 2006–10
2006–07 2007–08 2008–09 2009–10 (200 districts) (330 districts) (615 districts) (till September; 619 districts)
Households employed (crore) 2.10 3.39 4.51 3.26Man-days of employment generated (crore) 90.50 143.59 216.32 128.24Work provided per year to households who worked (days) 43.00 42.00 48.00 39.00Central release (Rs crore) 8,640.85 12,610.39 29,939.60 16,006.23Total funds available (including opening balance) (Rs crore) 12,073.55 19,305.81 37,397.06 28,664.31Budget outlay (Rs crore) 11,300.00 12,000.00 30,000.00 39,100.00Expenditure (Rs crore) 8,823.35 15,856.89 27,250.10 15,737.40Average wage per day (Rs) 65.00 75.00 84.00 88.00Total works taken up (lakh) 8.35 17.88 27.75 25.21Works completed (lakh) 3.87 8.22 12.14 6.39

Rural Development 253
maintaining data on how many of those who asked for work, failed to get it.
12.9 One way of assessing the relative performance of the diff erent states is by comparing the share of the states in man-days generated under MGNREGA with their share of rural BPL households in India. It is reasonable to assume that a state’s share of man-days of work generated nationally should be commensurate with its share of rural BPL households. Such states would fall on the 45 degree line in Figure 12.1. States which lie above the 45 degree line are doing better than expected and those below this line can be said to be underperforming. On this basis, Uttar Pradesh and Bihar emerge as the worst performers as their share
in rural BPL households is about 10 per cent higher than their share in employment generated under MGNREGA. West Bengal, Orissa, Madhya Pradesh, Gujarat, and Karnataka show a similar 5 per cent gap. On the other hand, Rajasthan and Andhra Pradesh have a much higher share in the work generated under MGNREGA than their share in national rural poverty. Th is diff erential performance refl ects diff erences in organizational and institutional capabilities, as also in attention paid to MGNREGA.
12.10 A major reason for the poor performance in states where poverty is otherwise high, could be the lack of awareness among potential MGNREGA work-ers regarding their entitlements and about the unique
TABLE 12.2State-wise MGNREGA Performance, 2008–09
S. No. State Average Days Man-Days of Expenditure Households of Work Provided Work (lakh) (Rs crore) Provided with per Households Work (lakh) who Got Work
1 Rajasthan 76 4,827 22% 6,171 23% 63 14%2 Mizoram 73 125 1% 159 1% 2 0%3 Nagaland 68 203 1% 272 1% 3 1%4 Manipur 64 237 1% 300 1% 4 1%5 Tripura 60 328 2% 452 2% 5 1%6 Madhya Pradesh 57 2,947 14% 3,551 13% 52 12%7 Chhattisgarh 55 1,244 6% 1,434 5% 23 5%8 Arunachal Pradesh 54 14 0% 15 0% 0 0%9 Uttar Pradesh 54 2,341 11% 3,582 13% 43 10%10 Sikkim 49 25 0% 44 0% 1 0%11 Andhra Pradesh 48 2,735 13% 2,964 11% 57 13%12 Jharkhand 48 750 3% 1,327 5% 16 4%13 Himachal Pradesh 46 204 1% 332 1% 4 1%14 Maharashtra 45 400 2% 338 1% 9 2%15 Haryana 43 69 0% 110 0% 2 0%16 Assam 40 749 3% 950 4% 19 4%17 Meghalaya 38 86 0% 89 0% 2 1%18 Tamil Nadu 38 1,199 6% 1,004 4% 31 7%19 Jammu & Kashmir 36 61 0% 66 0% 2 0%20 Uttarakhand 35 104 0% 136 1% 3 1%21 Orissa 35 381 2% 597 2% 11 2%22 Karnataka 32 289 1% 358 1% 9 2%23 Punjab 31 40 0% 72 0% 1 0%24 West Bengal 26 764 4% 911 3% 30 7%25 Bihar 26 991 5% 1,320 5% 38 9%26 Gujarat 25 213 1% 196 1% 9 2%27 Kerala 22 154 1% 224 1% 7 2% All-India 48 21,479 100% 26,975 100% 445 100%

254 Mid-Term Appraisal of the Eleventh Five Year Plan
architecture of the Act. Th e belief among the rural poor that they will get work only when the government decides to ‘open’ work is still prevalent in many areas. Without a dedicated cadre of social mobilizers at the gram panchayat (GP) level to make people aware of the unique demand-driven character of MGNREGA, this situation will prove hard to change.
12.11 An interesting aspect of the uneven performance across states is the coverage of women. Kerala, Tamil Nadu, and Rajasthan provided more than two-thirds of their work to women (Table 12.3). On the other hand, nine states failed to meet the stipulated one-third mark for women workers. Th e worst performers were Jammu and Kashmir (6 per cent) and Uttar Pradesh (18 per cent).
QUALITY OF WORKS12.12 A critical issue in evaluating MGNREGA relates to the quality of the work executed. Th e great hope (as refl ected in the main objectives of the Act) was that greater water security and drought and fl ood proofi ng would be realized. Th e Act requires the choice of work to be made by PRIs in order to ensure ownership by the community and also so that the work refl ects their needs and priorities. However, for the work to lead to the creation of truly productive assets it needs to be well planned with adequate technical support.
Th is demands a harmonious blending of plans made by PRIs with a broad framework provided by district and state-level agencies. While there have been a few successes in this regard, these remain oases of excellence.
12.13 Experience thus far suggests that the quality of work undertaken under MGNREGA has yet to come up to expectations both in terms of PRI involvement and also in terms of the technical soundness of design. Work priorities in many states tend to follow orders from the state or district level rather than refl ecting the needs and aspirations of the community. Th e required technical input is also inadequate. Part of the problem is the lack of supporting technical staff . During 2009–10 (up to September 2009), 25.21 lakh works had already been taken up under MGNREGA, which will increase further in the course of the year. But, there are only 21,533 engineers/technical as-sistants (TAs) in position to execute these works. Th is means that an average of 117 works per engineer/TA. Managing overwhelming numbers could be one of the reasons why a high percentage of work is left incomplete. The total number of works taken up under MGNREGA from February 2006 to September 2009 was over 79 lakh but only 31 lakh, that is, 39 per cent were completed. A demanding programme like MGNREGA requires a full-time, dedicated staff .
FIGURE 12.1: Share of States in Rural BPL Households vs Share of States in
Man-Days of Work under MGNREGA, 2008–09
AP
ASBI
CH
GU KRKE
MP
MA
OR
PU
RA
TN
UP
WB
0 5 10 15 20 25
% Rural Poor
%P
erso
nD
ays
Em
plo
ymen
tG
ener
ated
25
20
15
10
5
0

Rural Development 255
But it is observed that while programme offi cers are in place in most blocks, many of them are holding ‘additional charge’.
12.14 It is also clear that without a dedicated cadre of social mobilizers, the participation of the marginal-ized—SCs/STs, women, and the poor—will remain peripheral to decision-making in gram sabhas and gram panchayats. While the target of one Employ-ment Guarantee Assistant (EGA) has just about been achieved, what is required is at least one EGA per village, especially in blocks where there is high demand for MGNREGA work. In addition, one ‘barefoot’ social mobilizer would be needed in each village for generat-ing awareness, facilitating demand for work, thrashing out the social aspects of micro-planning, forming and mobilizing vigilance committees, and helping in social audits, grievance redressal, and confl ict resolution.
Th ere is also a case for a barefoot engineer at the village level who would work under the guidance of TAs to help out with technical surveys and readings, worksite layouts, and maintenance of technical records.
12.15 Th e best way of ensuring that adequate human resources are made available is to stipulate that a defi nite proportion of the 6 per cent now allotted for administrative costs is spent on professional support at the block level and below. Since, on average, not more than 3 per cent of the administrative costs are being utilized currently, there is ample scope to improve performance if this money were to be properly utilized. Th e states should have fl exibility in deciding how they spend this amount.
12.16 One way could be to deploy three cluster-level teams of suffi cient personnel—both technical and those involved in social mobilization—in each cluster of roughly 30 villages (each block in India covers an average of 90 villages). Such a cluster would also cor-respond broadly to the boundaries of milli-watersheds and aquifers, which must become the basis of planning work under MGNREGA. Each cluster level team would service all the GPs within its cluster. It is important to hire professionals from the open market, following established procedures for high-quality recruitment. Th e technical personnel would:
• Make bottom–up planning more effective and support development of plans for convergence that could potentially result in improvements in agricultural productivity and creation of sustain-able livelihoods on the foundation of the water infrastructure created through MGNREGA.
• Ensure that the measurement of work is more timely, thereby overcoming the major cause of delays in payment.
12.17 Th e social mobilizers would:
• help generate greater awareness among MGNREGA workers about their entitlements thus creating more demand for work and
• strengthen the process of social audits, thereby creating greater transparency and accountability in the programme.
TABLE 12.3Coverage of Women under MGNREGA, 2008–09
S. No. State Women as per cent of Persons Employed
1 Kerala 852 Tamil Nadu 803 Rajasthan 674 Andhra Pradesh 585 Tripura 516 Karnataka 507 Chhattisgarh 478 Maharashtra 469 Manipur 4610 Gujarat 4311 Madhya Pradesh 4312 Meghalaya 4113 Orissa 4014 Himachal Pradesh 3915 Sikkim 3816 Uttarakhand 3717 Mizoram 3718 Nagaland 3719 Haryana 3120 Bihar 3021 Jharkhand 2922 Assam 2723 West Bengal 2724 Arunachal Pradesh 2625 Punjab 2526 Uttar Pradesh 1827 Jammu & Kashmir 6 All-India 48

256 Mid-Term Appraisal of the Eleventh Five Year Plan
CAPACITY BUILDING FOR MGNREGA12.18 To implement these reforms it will be necessary to develop required capacities. However, we neither have enough people with requisite skill-sets available, nor do existing personnel have the necessary capaci-ties, especially at the cutting-edge level of MGNREGA implementation. For example, we need nearly 6 lakh Employment Guarantee Assistants and over 50,000 each of social mobilizers and TAs. Th is requires a national effort to build capacities of MGNREGA functionaries at the block-level and below.
12.19 To build capacities, the government could seriously consider recognizing a one-year diploma course on MGNREGA, conducted by the whole range of government and non-government training institu-tions spread across the country. At least 1 out of the 6 per cent administrative costs need to be mandatorily earmarked for capacity building. Th is is the standard practice in most large programmes (Th e Integrated Watershed Development Programme provides 5 per cent of the total project cost). MGNREGA is perhaps the only major programme that does not stipulate a precise amount to be spent on capacity building.
12.20 In addition, the National Institute of Rural Development (NIRD) and State Institute of Rural Development (SIRD), as well as Council for Ad-vancement of People’s Action and Rural Technology (CAPART), should be revamped, so that they work in
partnership with experienced civil society institutions in order to lead the national training eff ort. Major inputs are required for the programme from agencies, such as the National Rainfed Areas Authority (NRAA), especially in the rainfed dry-lands of India.
DELAYS IN PAYMENTS: USE OF IT12.21 Delays in wage payments have emerged as the most frequently heard complaint under MGNREGA. At times payments have not been made even aft er nine months and workers are rarely being paid compensa-tion for the delay. Th e major reason for the delay is that measurement of work is not being done on time. Th is is mainly due to lack of adequate technical staff at the block level. Besides, there are also bottlenecks in the fl ow of funds through the system, at times (as in Orissa) because data on the Management Information System (MIS) is not being fi lled up in time.
12.22 The MIS currently used by MGNREGA is one of the best we have ever had. More than 2 crore muster rolls and nearly 9 crore job cards have been placed online. Th ere is, however, scope for further improvement as shown by the soft ware used in Andhra Pradesh. For instance, the present MGNREGA MIS used in most states is not able to raise an alert on delays in wage payments because data are normally updated post-facto. By contrast, wage payments in Andhra Pradesh are increasingly being made within a week of completion of the previous week’s work (see Box 12.1). All states need to move in this direction.
Box 12.1Andhra Pradesh Software Allows MGNREGA Payments within a Week
Since the computer system in Andhra Pradesh is tightly integrated end-to-end, any work registered in the system is alive, status-visible, and amenable to tracking. Delays at any stage can be immediately identifi ed and corrected. Th e system keeps track of work from when the work-ID is generated and fl ags delays in the payment cycle as soon as they occur. Because the network secures all levels from the ground up to the state headquarters and data are transparently and immediately available on the website, a delay at any stage is instantly noticed by the monitoring system. By the last (sixth) day in a week’s work, the measurement sheets and muster rolls of the entire week are closed and reach the mandal (sub-block) computer centre. Th e next day, the muster data are fed into the computer. On day eight, the pay order is generated by the computer and the cheques are prepared. By day 10, these cheques are deposited into the post offi ce accounts of workers. Th e next day, cash is conveyed to the post offi ce so that on days 12 and 13, workers are able to access their wages from their accounts. All payments to labour are made only through these accounts; there are no payments in cash. Th e free availability of this information on the website also facilitates public scrutiny, thus engendering greater transparency and better social audit.
Rural Development 257
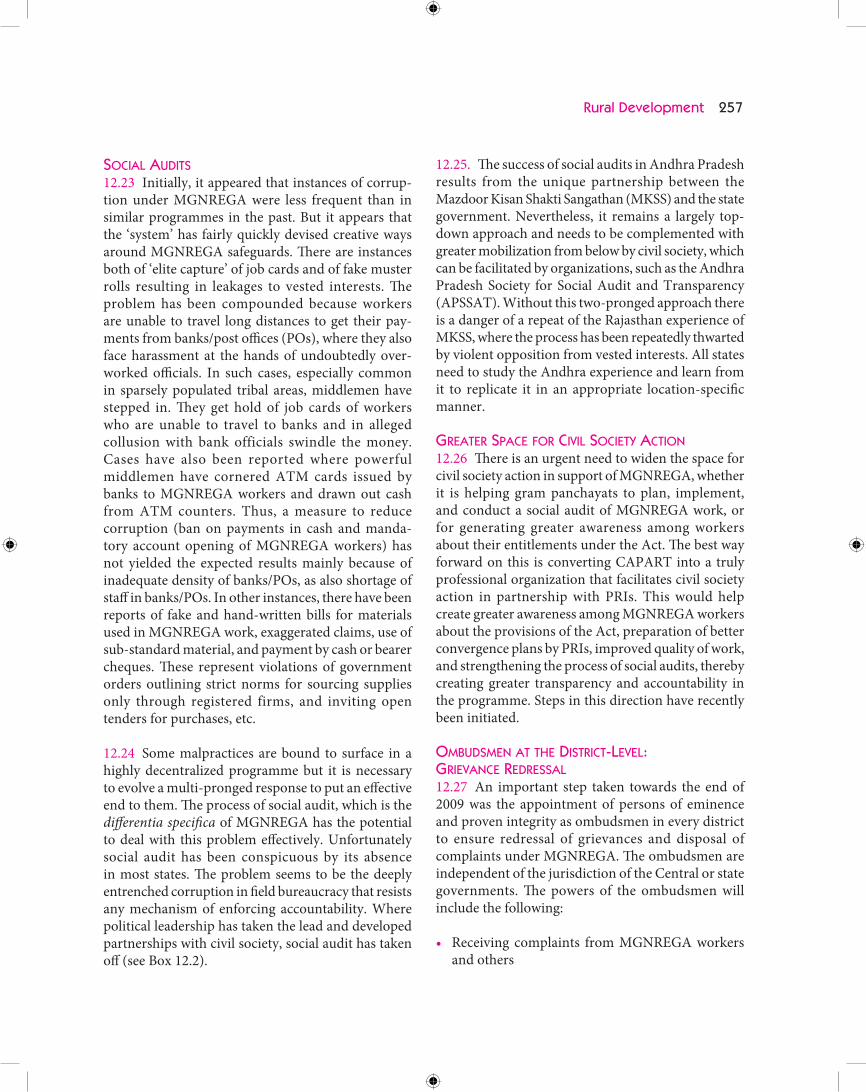
SOCIAL AUDITS12.23 Initially, it appeared that instances of corrup-tion under MGNREGA were less frequent than in similar programmes in the past. But it appears that the ‘system’ has fairly quickly devised creative ways around MGNREGA safeguards. Th ere are instances both of ‘elite capture’ of job cards and of fake muster rolls resulting in leakages to vested interests. Th e problem has been compounded because workers are unable to travel long distances to get their pay-ments from banks/post offi ces (POs), where they also face harassment at the hands of undoubtedly over-worked offi cials. In such cases, especially common in sparsely populated tribal areas, middlemen have stepped in. Th ey get hold of job cards of workers who are unable to travel to banks and in alleged collusion with bank officials swindle the money. Cases have also been reported where powerful middlemen have cornered ATM cards issued by banks to MGNREGA workers and drawn out cash from ATM counters. Thus, a measure to reduce corruption (ban on payments in cash and manda-tory account opening of MGNREGA workers) has not yielded the expected results mainly because of inadequate density of banks/POs, as also shortage of staff in banks/POs. In other instances, there have been reports of fake and hand-written bills for materials used in MGNREGA work, exaggerated claims, use of sub-standard material, and payment by cash or bearer cheques. Th ese represent violations of government orders outlining strict norms for sourcing supplies only through registered firms, and inviting open tenders for purchases, etc.
12.24 Some malpractices are bound to surface in a highly decentralized programme but it is necessary to evolve a multi-pronged response to put an eff ective end to them. Th e process of social audit, which is the diff erentia specifi ca of MGNREGA has the potential to deal with this problem eff ectively. Unfortunately social audit has been conspicuous by its absence in most states. Th e problem seems to be the deeply entrenched corruption in fi eld bureaucracy that resists any mechanism of enforcing accountability. Where political leadership has taken the lead and developed partnerships with civil society, social audit has taken off (see Box 12.2).
12.25. Th e success of social audits in Andhra Pradesh results from the unique partnership between the Mazdoor Kisan Shakti Sangathan (MKSS) and the state government. Nevertheless, it remains a largely top-down approach and needs to be complemented with greater mobilization from below by civil society, which can be facilitated by organizations, such as the Andhra Pradesh Society for Social Audit and Transparency (APSSAT). Without this two-pronged approach there is a danger of a repeat of the Rajasthan experience of MKSS, where the process has been repeatedly thwarted by violent opposition from vested interests. All states need to study the Andhra experience and learn from it to replicate it in an appropriate location-specifi c manner.
GREATER SPACE FOR CIVIL SOCIETY ACTION12.26 Th ere is an urgent need to widen the space for civil society action in support of MGNREGA, whether it is helping gram panchayats to plan, implement, and conduct a social audit of MGNREGA work, or for generating greater awareness among workers about their entitlements under the Act. Th e best way forward on this is converting CAPART into a truly professional organization that facilitates civil society action in partnership with PRIs. This would help create greater awareness among MGNREGA workers about the provisions of the Act, preparation of better convergence plans by PRIs, improved quality of work, and strengthening the process of social audits, thereby creating greater transparency and accountability in the programme. Steps in this direction have recently been initiated.
OMBUDSMEN AT THE DISTRICT-LEVEL: GRIEVANCE REDRESSAL12.27 An important step taken towards the end of 2009 was the appointment of persons of eminence and proven integrity as ombudsmen in every district to ensure redressal of grievances and disposal of complaints under MGNREGA. Th e ombudsmen are independent of the jurisdiction of the Central or state governments. Th e powers of the ombudsmen will include the following:
• Receiving complaints from MGNREGA workers and others

258 Mid-Term Appraisal of the Eleventh Five Year Plan
• Considering such complaints and facilitating their disposal in accordance with law
• Requiring the MGNREGA official complained against to provide any information or furnish certifi ed copies of any document relating to the subject matter of the complaint which is in his possession
• Issuing directions for conducting spot investiga-tion
• Lodging FIRs against erring parties• Initiating proceedings suo moto in the event of any
circumstance arising within their jurisdiction that may cause any grievance
• Engaging experts for facilitating the disposal of complaints
• Directing redressal, disciplinary, and punitive actions
SPECIAL PROBLEMS OF TRIBAL AREAS12.28 In tribal regions, degraded catchment areas needing treatment through MGNREGA tend to
fall on land, which is under the Forest Department. Th ere has been great diffi culty in working on this land and progress has been very slow. In view of growing Maoist activities in such areas, this is a matter of grave concern. Steps need to be taken to ensure that this work proceeds apace and the Forest Department provides its fullest and most expeditious cooperation in this regard. Quicker disposal of claims under the Forest Rights Act would also facilitate MGNREGA work on this land. Th is would foster greater involvement of tribal people in MGNREGA planning and implementation, more water and livelihood security, and genuine decentralization of governance in tribal areas, which would together constitute a powerful response to the challenge posed by the Maoists.
PARTNERSHIP WITH UIDAI AND THE BANKING CORRESPONDENT (BC) MODEL12.29 A partnership with the Unique Identifi cation Authority of India (UIDAI) and adopting the BC model is poised to help in tackling key problems
Box 12.2Social Audit in Andhra Pradesh: A Success Story
Social audit in Andhra Pradesh begins with the fi ling of applications for MGNREGA records under the Right to Information Act by district resource persons designated by the government. Th e rules stipulate that ‘concerned offi cials shall provide the information requested for without fail within seven days of the receipt of the application.’ In every village, teams of energetic literate youth, usually belonging to the families of MGNREGA workers themselves, are trained in social audit processes; they go from door-to-door authenticating muster rolls, check out worksites, record written statements of workers, and conduct meetings. Th e social audit process culminates in a public meeting in the mandal (sub-block) headquarters attended by people from every village, their elected representatives, the media, MGNREGA functionaries concerned, and senior government offi cers. At this meeting, village-wise social audit fi ndings are read out, the workers testify, and the offi cials concerned respond to the issues raised by giving an explanation about their actions under complaint and by specifying the nature of remedial action that they will take and in what time period. A number of corrective or disciplinary actions are taken during the meeting itself. Social audit rules specify that an ‘action taken report shall be fi led by the Programme Offi cer within a month of the social audit being conducted and the same shall be communicated to the Gram Sabha.’ In addition, there is a rigorous follow-up where social audit teams go back to their villages every 15 days aft er the mandal public meeting to ensure that the decisions taken are actually enforced. One full round of this process has now been completed in over 50,000 habitations. In several habitations, second and third rounds have also been concluded. Around 50,000 trained village youth are conducting this social audit that has already covered nearly 20 million people. Around Rs 4 crore of misappropriated funds have been recovered. On many occasions, errant offi cials have ‘voluntarily’ returned money to workers at the mandal public meeting. Th e palpable impact on rural governance of such a spectacle, which invariably continues uninterrupted for 10–12 hours, is easy to imagine. Action has been initiated against thousands of offi cials and a number of criminal cases have been instituted. Nearly 80 lakh MGNREGA records have been publicly scrutinized under RTI. Independent studies reveal that awareness about the detailed provisions of MGNREGA has risen dramatically among workers. Th e setting up of the Andhra Pradesh Society for Social Audit and Transparency (APSSAT) is a major step in the direction of institutionalizing the process of social audit in Andhra Pradesh and ensuring independence of the auditor from the implementer.

Rural Development 259
of MGNREGA. UID numbers are expected to start rolling out in 2011(see Box 12.3) Th e UID number, coupled with a biometric identifi cation, will solve the problem of fake job cards and muster rolls as both these documents will show the UID number of the worker. Th e ‘non-repudiation’ feature of UID will be a further check on leakages as the MGNREGA worker will biometrically confi rm receipt aft er the payment has been made. By the end of the Eleventh Plan period, BCs should cover every GP in India not serviced by a bank.
12.30 Th e proposed UIDAI Civil Society Outreach Programme will facilitate a robust UIDAI-MGNREGA partnership by ensuring inclusion of the most vulner-able sections living in remote areas. It will also help roll out pilots that could build adequate safeguards to take care of teething problems and concerns of civil society and legal experts about the process.
SPECIAL NEEDS OF THE DIFFERENTLY-ABLED12.31 MGNREGA promised an act that was friendly to the diff erently-abled. While 8.50 lakh diff erently-abled workers have so far been registered for MGNREGA work, only 19 per cent of them have actually got work. Madhya Pradesh is the only state which has moved decisively by issuing specifi c orders enabling people with diff erent kinds of disabilities to be employed on MGNREGA worksites on carefully specifi ed matching work. Other states need to follow the example set by Madhya Pradesh in this regard.
STATUTORY MINIMUM WAGES: NEW SCHEDULE OF RATES12.32 One of the defi ciencies in MGNREGA relates to reports of workers earning less than statutory minimum wages from various parts of the country. Th e main reason for lower than statutory wages in many states is that payments are still based on work
Box 12.3Banking Correspondents and the UID
Banking correspondents will carry a handheld computer device and a mobile phone with biometric identifi cation facilities. Each benefi ciary will have a ‘UID bank account’. Th e UID will maintain a translation table (with the National Payments Corporation of India), which will map the UID number to the UID bank account. Th is makes everyone’s bank account addressable. Th e Government of India will direct all current and future payments, which are given directly to individuals to this UID bank account, like MGNREGA payments, pensions, JSY payments, wages paid to ASHAs, and IAY payments. Th e government will also encourage state governments to use the same ‘pipe’. Th is will bring benefi ts (including MGNREGA wages) to the doorstep resulting in an unprecedented scale and quality of fi nancial inclusion. It is important here to use an open, inter-operable architecture. Th e lack of inter-operability between government programmes means that benefi ciaries have to collect diff erent payments from diff erent agencies. Benefi ciaries living at a distance are required to travel to various agencies for their money; in the process they incur opportunity costs as well as travel expenses. Lack of information about when payments have arrived gives rise to middlemen, who pass on this information to the benefi ciaries for a fee. Th e costly cash handling processes, cumbersome identity verifi cation processes, and high transaction volumes create ineffi ciencies across the system, delayed payments, and long waiting times. Th ese limitations force the poor to withdraw the entire amount due to them from the bank, to avoid recurring visits. Th e UID number will enable banking institutions to create UID-linked, no-frills bank accounts, which allow electronic transactions and which can be accessed through mobile phones. Such a UID-enabled micro-payments infrastructure addresses the existing challenges that we face in bringing fi nance to the poor. Banking institutions would be able to easily and accurately verify the identity of residents. With UID-enabled biometric authentication, such verifi cation would be possible over the phone and also online. Aligning reduced Know-Your-Customer (KYC) requirements of no-frills accounts with UID Know-Your-Resident (KYR) standards and biometric authentication ensures that anyone with a UID is eligible for a UID-enabled bank account. Th e cost of customer acquisition for banking institutions would then come down dramatically. Additionally, the UID system of biometric authentication ensures that once the UID number is integrated with the BC model, only an eligible benefi ciary and BC can transact on a given bank account. Th is simplifi es and strengthens the security of transactions. A back-end switch which enables a Rs 10 transaction for a cost of say, 10 paise would help build a high-volume, low-cost model that all stakeholders benefi t from.
260 Mid-Term Appraisal of the Eleventh Five Year Plan
done that is measured using outmoded schedules of rates (SoRs), which were appropriate for a contactor-led, machine-based system of implementation. In the absence of machines, the application of these SoRs inevitably leads to underpayment. Another problem is that existing SoRs make inadequate provisions for variations in geology and climate, discriminate against women, tend to underpay workers by lumping various activities together, and do not revise rates in line with increments in statutory minimum wages. Deploying the old SoRs also makes it impossible for implementers like gram panchayats to correctly cost the work undertaken by them. Th e result is a varying combination of malpractices—more work is shown than actually undertaken on the ground, there is poor quality of work, work is left incomplete as actual costs exceed sanctions, labour is underpaid, and bogus workers are shown as paid while machines actually do the work. Gujarat, Andhra Pradesh, Tamil Nadu, Bihar, Orissa, Karnataka, and Uttar Pradesh have undertaken fresh time and motion studies to revise their SoRs. Other states must also follow.
12.33 Th e Ministry of Rural Development (MoRD) notifi ed revision of MGNREGA wages to Rs 100 per day in December 2009 for states which were below this level. Now 27 states and UTs are paying Rs 100 or more. Th e Department of Statistics and Programme Implementation has been asked to set up an expert group to develop a separate price index for MGNREGA wages so that the real level contributed by the Central Government could be pegged at Rs 100 per day. Th e SoRs also need to be indexed to the wage level, so that each rise in infl ation-indexed wages is accompanied by an automatic adjustment in the SoRs.
MISSION MGNREGA12.34 For all these reforms to be carried out eff ectively, we need a ‘Mission MGNREGA’ within MoRD. At present, just one Joint Secretary manages this massive employment programme. Coordinating and monitor-ing the implementation of the programme by the states should remain the function of the Department of Rural Development, although evaluation, social audit, grievance redressal, IT innovations, and human resource deployment and development demand a
full-fledged mission that works independently to support the implementer. Th is would enable:
• more credible and sustained studies and evaluations of MGNREGA;
• speeding up better IT innovations resulting in real-time monitoring;
• deployment of more professional human resources as also high quality capacity building, resulting in better assets and improved, enduring outcomes;
• better social audit and grievance redressal; and• charting out a course for further MGNREGA
reforms.
12.35 Th ese ‘soft ’ elements will determine the quality of outcomes achieved through MGNREGA work and help realize the true potential of the Act.
ULTIMATE POTENTIAL OF MGNREGA12.36 The ultimate potential of MGNREGA lies in a renewed focus on improving the productivity of agriculture and convergence to engender allied sustainable livelihoods. Millions of small and marginal farmers are forced to work under MGNREGA because the productivity of their own farms is no longer enough to make ends meet. Among agricultural labour households in India, the percentage of those who own land is around 50 per cent in Rajasthan and Madhya Pradesh, 60 per cent in Orissa and Uttar Pradesh, and over 70 per cent in Chhattisgarh and Jharkhand. If we focus on tribals, the proportion shoots up to as high as 76–87 per cent in Chhattisgarh, Jharkhand, and Rajasthan. MGNREGA will become really powerful when it helps rebuild this decimated productivity of small farms and allows these people to return to full-time farming, thereby also reducing the load on MGNREGA.
12.37 Th ere are many such examples to be found under MGNREGA, although they still remain small in number. For example, the First Annual Report of the National Consortium of Civil Society Organizations on MGNREGA (2009) has reported that earthen dams on common land have recharged wells of thousands of poor farmers who earlier worked as labourers to build these dams. Th ese farmers are now busy making a series of investments to improve their own farms.

Rural Development 261
Rising incomes also improve capacity utilization and happier expectations act as incentives for more investment. Under MGNREGA, farmers have come back to the land that they had long abandoned, as increased output, in an atmosphere of renewed hope, spurs further investment. Converging MGNREGA with other programmes for rural livelihoods would carry this momentum forward in a positive upward spiral, which will broad-base the growth process via downstream multiplier-accelerator eff ects.
12.38 It has recently been notifi ed that MGNREGA work will now be permitted on the land of small and marginal farmers, provided work on land of SCs/STs has been fi rst saturated. Th is is a very positive step that would also help better achieve more days of work to more job card holders. New guidelines on convergence of MGNREGA with other government programmes have also been issued. Convergence can help realize the MGNREGA promise of sustainable livelihoods. Convergence can also facilitate even more fl exibility in choice of work to suit the specifi c conditions of states, such as Bihar, for example, where earthen work may be less appropriate in fl ood-prone districts than stone masonry structures. However, the present guidelines are too focused on a top–down inter-departmental convergence. The danger presently is that either departments will be unwilling to converge with MGNREGA because of provisions such as social audits or they will do so in a manner that violates the radical provisions of MGNREGA. Th e emphasis has to be on PRI-led convergence that does not compromise the unique architecture of MGNREGA implementation.
THE WAY FORWARD12.39 Th ere is an urgent requirement for a clear set of guidelines on the use of the 6 per cent administrative costs provided under MGNREGA. Proper utilization of this amount holds the key to infusing MGNREGA outcomes with genuine quality.
12.40 Th e most important uses to which this amount must be put are as follows:
• Deployment of cluster-level teams for each cluster of around 30 villages
• Capacity building of these personnel
• Technical support for better convergence and creation of sustainable livelihoods
• Strengthening and improving IT systems• Additional personnel for banks/POs till the BC
model comes up• Monitoring, evaluation, social audit, and grievance
redressal• Time and motion studies to revise SoRs in states
where this is yet to be done
12.41 Since states are not spending more than 3 per cent on an average on administrative costs, these reforms can easily be aff orded and put in place. Once proper use of the 6 per cent is achieved, the amount could be raised, with clear guidelines for use of the money across heads. Th ese costs could also be re-designated as ‘professional support costs’ rather than ‘administrative costs’ to send out the appropriate message.
SWARNJAYANTI GRAM SWAROZGAR YOJANA (SGSY)12.42 Th e SGSY is a self-employment programme that became operational in April 1999 aft er restructuring and combining the Integrated Rural Development Programme (IRDP) with other allied programmes. SGSY aims to bring assisted poor families above the poverty line by supporting income-generating activities through a combination of bank credit and government subsidy. An important change from the IRDP approach was the shift away from supporting individuals towards the formation of Self-Help Groups (SHGs) and organizations of the poor at the grassroots through a process of social mobilization. Community action and group dynamics are expected to transform outcomes and also make banks recog-nize the rural poor as credit-worthy and fi nancially accountable units.
12.43 Assistance under SGSY is given in the form of credit by the banks with a back-ended subsidy by the government. Emphasis is laid on the development of micro-enterprises with eff ective forward and backward linkages to ensure best returns on investment. Of the benefi ts, 50 per cent are reserved for SCs/STs, 15 per cent for minorities, and 3 per cent for diff erently-abled people. In addition, 50 per cent of the groups
262 Mid-Term Appraisal of the Eleventh Five Year Plan
formed in each block are expected to be exclusively for women who will account for at least 40 per cent of the swarozgaris.
12.44 The SHG-Bank Linkage (SBL) approach involves the formation of SHGs (mainly of women). Th ese women regularly save money, which is placed in a local (generally public sector) bank account. Many studies have shown that creation of a safe avenue for savings (on which interest is earned) is an attractive feature of SHGs, which has led to signifi cant promo-tion of savings. The SHGs have a set of bye-laws devised and agreed to by the members themselves. These include rules for monthly savings, lending procedures, periodicity and timing of meetings, and penalties for default. Meticulous accounts and records are maintained. Th e SHGs function like small banks. Th e groups lend money to their members. Aft er a certain period (six months to a year) of disciplined functioning, an SHG becomes entitled to a loan from the bank where it has an account.
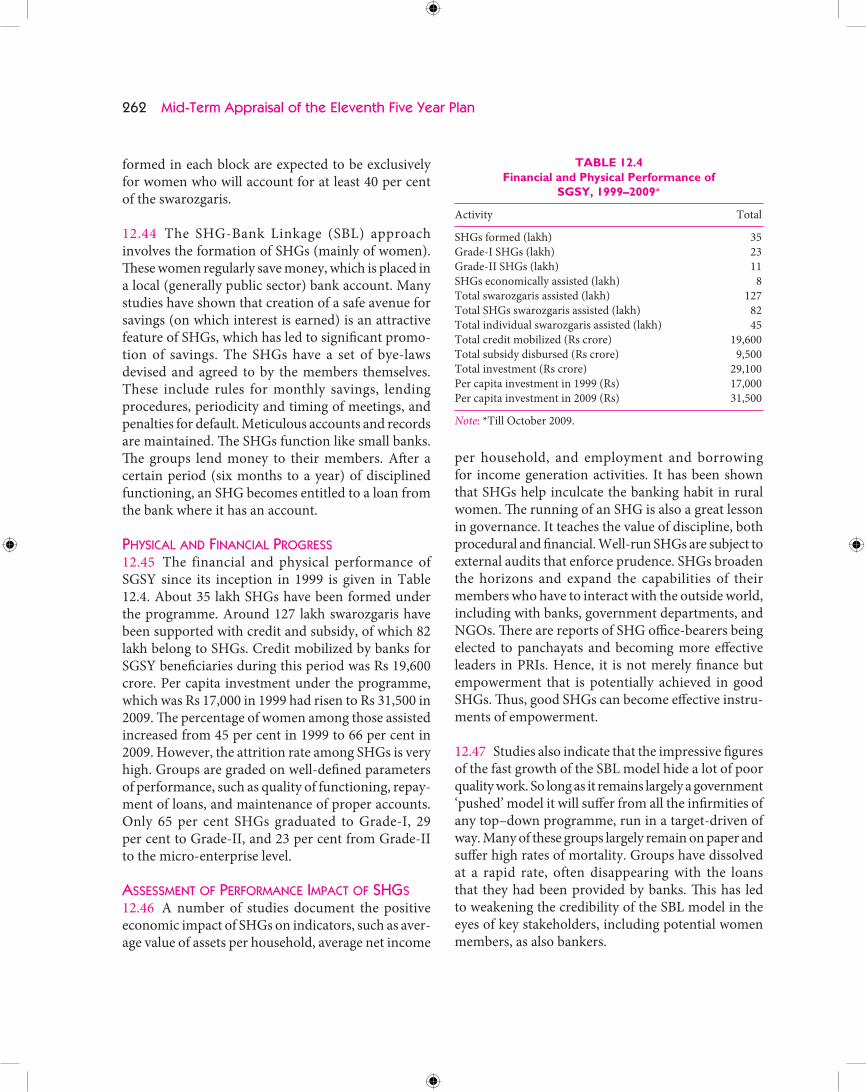
PHYSICAL AND FINANCIAL PROGRESS12.45 The financial and physical performance of SGSY since its inception in 1999 is given in Table 12.4. About 35 lakh SHGs have been formed under the programme. Around 127 lakh swarozgaris have been supported with credit and subsidy, of which 82 lakh belong to SHGs. Credit mobilized by banks for SGSY benefi ciaries during this period was Rs 19,600 crore. Per capita investment under the programme, which was Rs 17,000 in 1999 had risen to Rs 31,500 in 2009. Th e percentage of women among those assisted increased from 45 per cent in 1999 to 66 per cent in 2009. However, the attrition rate among SHGs is very high. Groups are graded on well-defi ned parameters of performance, such as quality of functioning, repay-ment of loans, and maintenance of proper accounts. Only 65 per cent SHGs graduated to Grade-I, 29 per cent to Grade-II, and 23 per cent from Grade-II to the micro-enterprise level.
ASSESSMENT OF PERFORMANCE IMPACT OF SHGS12.46 A number of studies document the positive economic impact of SHGs on indicators, such as aver-age value of assets per household, average net income
per household, and employment and borrowing for income generation activities. It has been shown that SHGs help inculcate the banking habit in rural women. Th e running of an SHG is also a great lesson in governance. It teaches the value of discipline, both procedural and fi nancial. Well-run SHGs are subject to external audits that enforce prudence. SHGs broaden the horizons and expand the capabilities of their members who have to interact with the outside world, including with banks, government departments, and NGOs. Th ere are reports of SHG offi ce-bearers being elected to panchayats and becoming more eff ective leaders in PRIs. Hence, it is not merely fi nance but empowerment that is potentially achieved in good SHGs. Th us, good SHGs can become eff ective instru-ments of empowerment.
12.47 Studies also indicate that the impressive fi gures of the fast growth of the SBL model hide a lot of poor quality work. So long as it remains largely a government ‘pushed’ model it will suff er from all the infi rmities of any top–down programme, run in a target-driven of way. Many of these groups largely remain on paper and suff er high rates of mortality. Groups have dissolved at a rapid rate, often disappearing with the loans that they had been provided by banks. Th is has led to weakening the credibility of the SBL model in the eyes of key stakeholders, including potential women members, as also bankers.
TABLE 12.4Financial and Physical Performance of
SGSY, 1999–2009*
Activity Total
SHGs formed (lakh) 35 Grade-I SHGs (lakh) 23Grade-II SHGs (lakh) 11SHGs economically assisted (lakh) 8 Total swarozgaris assisted (lakh) 127 Total SHGs swarozgaris assisted (lakh) 82 Total individual swarozgaris assisted (lakh) 45Total credit mobilized (Rs crore) 19,600 Total subsidy disbursed (Rs crore) 9,500Total investment (Rs crore) 29,100 Per capita investment in 1999 (Rs) 17,000Per capita investment in 2009 (Rs) 31,500
Note: *Till October 2009.

Rural Development 263
12.48 Th e real power of the SBL model lies in the economies of scale created by SHG Federations (comprising 150–200 SHGs each). Th is is evident, for example, in bulk purchase of inputs (seeds and fertil-izers etc.) and marketing of outputs (crops, vegetables, milk, NTFPs, etc.). They can also provide larger loans for housing and health facilities to their members by tying up with large service or loan providers. Insurance services, including life, health, livestock, and weather insurance are also available. A study of four large SHG federations (including India’s oldest one) with over 18,000 members in Andhra Pradesh and Tamil Nadu, shows that federations help make SHGs fi nancially viable by reducing transaction and promotional costs as also default rates, provide them economies of scale, create value-added services and build local human capital. It has also been shown that doing business with SHG Federations can help public sector bank branches in remote rural areas become viable entities.
12.49 Since most SHGs are women’s groups, the potential for women’s empowerment is huge and a number of studies have tried to assess the impact of micro-finance interventions on women’s em-powerment. Th ere is overwhelming evidence that women-run SHGs are the best managed with women showing much greater sense of responsibility as also a commitment to human development objectives, such as health and education of their families. However, much depends on the orientation and capacity of the agency facilitating the formation of groups. Where groups are mere conduits for the lending and recovery of money or when lending is to individuals, empower-ment impacts are the least.
12.50 SHGs do involve high transaction costs and SHG group meetings require an investment of time and money. But if we recognize that ‘governance’ and not just fi nance is a major ‘defi cit’ in rural India, then we must view this as an investment in empowerment of women and the poor, which is not too high a price for the state to bear. NABARD’s ‘promotional’ costs for SHGs, if well spent, can be an invaluable and a reasonable investment for achieving this socially desirable goal. In any case, SHGs need support only
for the initial years, aft er which they become fi nancially self-sustaining entities.
12.51 Th ere is some critique of SHGs charging high rates of interest from their members. In a way, SHGs are member-run mini-banks and what they charge is also what they earn. So the interest money earned remains with the SHGs themselves.
12.52 A major problem identifi ed by the Radhakrishna Committee on Credit Related Issues under SGSY (2009) is that most of the SHGs remain crowded in low productivity, primary sector activities. Th e success of the programme depends on raising their abilities to diversify into other high productive activities. Even in the better performing state of Andhra Pradesh, the income gain to a swarozgari from enterprise activities under SGSY was a mere Rs 1,228 per month. Th e small income gain was due to low productive, traditional activities in which they were engaged and due to low absorption of technology.
12.53 Th e Committee argues that while nearly two-thirds of the total funds were given out as subsidy (thus making the whole programme subsidy-driven), only 6 per cent of the total SGSY funds were utilized for training and capacity building during the past decade (Table 12.5). Ill-trained groups in SGSY would be a severe handicap in moving towards the Eleventh Plan goal of inclusive growth. Training is of vital importance in the management aspects of running both SHGs and their federations, as well as in improv-ing existing livelihood options and also adopting new ones.
TABLE 12.5Utilization of SGSY Funds across Heads, 1999–2009
Percentage Utilization of Funds on: Sub- Revo- Infra- Training/ Others sidy lving structure Capacity fund development building
1999–2009* 65.40 10.34 16.23 6.18 1.88
Source: Radhakrishna Committee on Credit Related Issues under SGSY (2009).Note: *Till October 2008.

264 Mid-Term Appraisal of the Eleventh Five Year Plan
12.54 As argued by the committee, it is very impor-tant to recognize ‘that prior to SHG-Bank Linkage, substantial preparatory work needs to be done for bringing the poor together through a process of social mobilization, formation of sustainable SHGs and training them to pool their individual savings into a common pool for lending it among the needy. It also includes equipping them with skills to manage corpus fund created with their own savings, interest earned from lending and revolving fund contributed by the government.’
LOW CREDIT–SUBSIDY RATIO12.55 Th e failure in the spread of the programme and the limited absorbing capacity even kept the targets of credit more or less at a constant level. Th e target for credit under SGSY increased very moderately from Rs 3,205 crore in 1999–2000 to over Rs 3,744 crore in 2007–08 at current prices (Table 12.6). the credit actually mobilized was only Rs 1,056 crore in 1999–2000 which rose to Rs 2,760 crore in 2007–08 but is still much below the target. Th e ratio of credit to subsidy was about 2 during the period and did not vary much from year to year. Th us, the credit–subsidy ratio remained much below the target ratio of 3:1. Th is is partly due to the failure to strengthen the demand side of the credit by improving the capacity of the poor
to absorb credit for income generating activities and due to supply side failures as well. Financial services did not have systems and procedures suited to the poor. On the whole, credit and related indicators show that the SBL is yet to take off from the perspective of credit facilitating the growth of micro-enterprises. It signifi es the failure of both credit delivery systems to reach the poor as well as that of public intervention to promote credit-worthy swarozgaris.
UNEVEN PERFORMANCE ACROSS STATES12.56 An interesting feature of SGSY is the very uneven distribution of SHGs across regions, with the southern states, which account for 11 per cent of the poor, having 33 per cent of the SHGs, while the northern and North-Eastern states, which account for more than 60 per cent of rural BPL population, having only about 39 per cent SHGs (Table 12.7). Th e performance of SGSY was unsatisfactory in states with high incidence of poverty, such as Assam, Madhya Pradesh, Orissa, Jharkhand, Chhattisgarh, West Bengal, and Bihar. Th e Radhakrishna Committee believes that the constraints underlying their poor performance mostly relate to the delivery system. In most of these states, functionaries of District Rural Development Agencies (DRDAs) and Block Development Officers (BDOs) did not possess adequate knowledge of the programme and
TABLE 12.6Credit Mobilization and Disbursement under SGSY, 1999–2009
(Rs crore)
Year Credit Disbursed Subsidy Disbursed Total Credit + Ratio of Credit Subsidy to Subsidy SHGs Individuals Total SHGs Individuals Total
1999–2000 187 869 1,056 125 417 542 1,598 1.92000–01 257 1,202 1,459 168 534 702 2,161 2.12001–02 318 1,011 1,329 210 456 666 1,995 2.02002–03 459 725 1,184 283 323 606 1,790 2.02003–04 708 594 1,302 444 269 713 2,015 1.8 2004–05 1,028 631 1,659 586 273 859 2,517 1.92005–06 1,275 548 1,823 671 234 905 2,728 2.02006–07 1,803 488 2,291 771 200 971 3,262 2.42007–08 2,091 670 2,761 991 298 1,289 4,049 2.12008–09 (up to 1,136 412 1,548 461 250 711 2,259 2.2October 2008)Total 9,262 7,151 16,413 4,709 3,254 7,963 24,375 2.1
Source: Radhakrishna Committee on Credit Related Issues under SGSY (2009).

Rural Development 265
also banks had little interest in it. Line departments were hardly involved in the planning, implementation, and monitoring of the programme. Consequently, very few swarozgaris could avail adequate levels of bank credit for investment. In the east and North-East, credit disbursed as a proportion of credit targeted in 2007–08 was low at about 40 per cent as against the all-India fi gure of 73 per cent. Consequently, investment per swarozgari (credit plus subsidy) was low at Rs 19,700 (Table 12.7).
12.57 In contrast to the eastern states, Andhra Pradesh, Kerala, and Tamil Nadu show successful implementation of the programme largely because of the existence of umbrella organizations at the state level. Th ese organizations promote formation of SHGs, ensure thrift , establish bank linkage, and facilitate capacity building. In addition, they federate the SHGs into eff ective self-governing organizations with a hierarchy of appropriate functions, including ensuring coordination with the line departments. Th e Kudumbasree in Kerala with active linkages with the PRI and the Andhra Pradesh model which relies on Federations of SHGs have acquired the shape of eff ec-tive organizations of the poor. Federations acting as fi nancial intermediaries, which is a high-skill activity require investments in training for enhancing their skill base. Th is also involves institutional partnerships of SHGs/federations with the bankers. Th e diff er-ences in regional and state-wise performances can also be attributed to the relative strength of banking institutions.
RESTRUCTURING SGSY: NATIONAL RURAL LIVELIHOODS MISSION12.58 Based on the lessons of the last decade of the implementation of SGSY, MoRD is currently in the process of restructuring SGSY as the National Rural Livelihoods Mission (NRLM), which is all set to be rolled out in 2010. Th e main features being proposed under NRLM are as follows:
• Implementation of the programme in a mission mode with greater emphasis on Federations of SHGs
• Flexibility to states for designing specifi c action plans for poverty alleviation through a demand-driven strategy
• Induction of professionals at various levels of the implementation machinery and facilitators-animators at the cutting-edge level of implementa-tion
• Upward revision of financial support provided under the programme
• Introduction of interest subsidy for encouraging repayments of loans and multiple doses of credit
• Greater focus on training and capacity building eff orts, including setting up of dedicated skill train-ing institutes in each district
• Improved monitoring and evaluation through social audits, baseline studies, concurrent evaluations, and comprehensive MIS
• Upscaling the special projects component of SGSY for greater focus on skilled wage employment along with self-employment eff orts
TABLE 12.7Financial and Physical Performance of SGSY Programme, Region-wise, 2007–08
(per cent of all-India)
Region Population Poor Swarozgaris Total Total Total Credit Investment per Persons Assisted Credit Subsidy + Subsidy Swarozgari (Rs)
North 11.9 6.1 6.2 9.5 6.3 8.5 39,354Central 27.3 33.8 29.8 34.6 38.5 35.8 34,518West 11.8 10.7 11.1 10.2 11.2 10.5 27,222South 19.5 11.3 21.3 23.4 16.3 21.2 26,810East 25.1 34.6 21.1 16.8 20.2 17.9 24,165North-East 4.4 2.5 9.11 5.5 7.5 6.1 19,658All-India 100.0 100.0 100.0 100.0 100.0 100.0 28,722
Source: Radhakrishna Committee on Credit Related Issues under SGSY (2009).

266 Mid-Term Appraisal of the Eleventh Five Year Plan
• Creating a platform that enables industries and their associations to better integrate micro-enterprises set up by SHGs/federations into the larger macro-economic environment in the country
• Facilitating marketing linkages so that SHG prod-ucts are able to access global markets
Indira Awaas Yojana (IAY): Performance Review12.59 The IAY is a flagship scheme of MoRD to provide houses to BPL families in rural areas. Since 1985, nearly 223 lakh houses have been constructed with an expenditure of about Rs 54,688 crore. In the Eleventh Plan, Rs 26,882 crore has been allocated for IAY. Th e year-wise physical and fi nancial progress is given in Tables 12.8 and 12.9.
TABLE 12.8Financial Performance of IAY during the
Eleventh Plan
Year TAF* Utilization Per cent (Rs crore) (Rs crore) Utilization
2007–08 6,527.17 5,464.54 83.72 2008–09 14,460.33** 8,348.34 57.73 2009–10*** 9,094.44 4,927.23 54.18
Note: * Total Available Funds (TAF) includes opening balance and Centre and state releases.** Includes Rs 3,050 crore released as economic stimulus package in February 2009. *** Till September 2009.
TABLE 12.9Physical Performance of IAY during the Eleventh Plan
Year Target Houses Per cent (lakh) Constructed Physical (lakh) Achievement2007–08 21.27 19.92 93.662008–09 21.27 21.34 100.272009–10* 40.52 10.96 27.05
Note: * Till September 2009.
NEW INITIATIVES DURING THE ELEVENTH PLAN12.60 Several new initiatives were taken during the Eleventh Plan:
• From 1 April 2008, assistance under IAY for new construction has been raised from Rs 25,000 to Rs 35,000 per unit (20 sq. m. plinth) in plain areas
and from Rs 27,500 to Rs 38,500 in hilly and diffi cult areas.
• A benefi ciary can also borrow a top-up loan of up to Rs 20,000 from any nationalized bank at a 4 per cent interest per annum under the Diff erential Rate of Interest (DRI) scheme
• NSS data indicate that around 7.70 million house-holds in rural India do not have homestead sites, without which they are unable to fulfi ll their need for shelter and avail of the benefi ts under IAY. Th e Eleventh Plan set a target of providing homestead sites to all by 2012. A proposal for providing homestead sites to rural BPL households was approved in 2009. Benefi ciaries will be selected from the Permanent IAY Waitlists as per priority in the list. Only those BPL households, which have neither land nor house site, will be eligible. In the fi rst instance, the state governments will regular-ize the land as a homestead site if it is presently occupied by a BPL household and if regularization is permissible as per the existing acts and rules. If this is not the case, the state governments will allot suitable government land as homestead site to the eligible BPL household. In case suitable government land is not available for allotment as a homestead site, private land may be purchased or acquired for this purpose. Financial assistance of Rs 10,000 per benefi ciary or actual, whichever is less, will be provided for purchase or acquisition of a homestead site of an area around 100–250 sq. m. Funding will be shared by the Centre and the states in the ratio of 50:50 while in the case of UTs, the Central Government will provide 100 per cent funds. Th e total central allocation for homestead sites for the Eleventh Plan period is Rs 1,000 crore (Rs 200 crore for 2009–10, Rs 300 crore for 2010–11, and Rs 500 crore for 2011–12). Th is amount is suffi cient to meet about 25 per cent of the total requirement. State governments are expected to meet the remaining 75 per cent of the requirement by regularizing the presently occupied land, if any, or by allotting surplus government land, to fulfi l the target set by the government for providing homestead sites to all by 2012. State governments will be incentivized through sanctioning additional houses under IAY to the extent that homestead sites are provided to landless rural BPL households.

Rural Development 267
• Proposals for providing homestead sites have been received from the seven states of Kerala, Karnataka, Bihar, Rajasthan, Sikkim, Maharashtra, and Mizoram. Funds have been released to Kerala, Karnataka, Bihar, Rajasthan, and Sikkim.
ISSUES AND RECOMMENDATIONS
QUALITY OF HOUSING12.61 Although ‘high user satisfaction’ is reported under IAY, the quality of housing remains a problem. Several examples of poor quality of construction, sagging foundation, use of temporary materials for roofing, or leaving the construction incomplete because of inadequate fi nance have been reported. Even aft er contributing their labour and borrowing from local sources, a signifi cant number of families are not able to complete their houses in all respects, and most houses remain without plastering or fl ooring. Th e steps outlined below would help improve housing quality for which a minimum set of standards needs to be adopted.
DEARTH OF TECHNICAL INPUTS12.62 One of the merits of IAY is supposedly the fact that construction of houses is left entirely at the discretion of the benefi ciaries but they might not have the resources and the technical expertise to build qual-ity houses on their own. IAY guidelines recommend that state governments and implementing agencies should facilitate access to information on innovative technologies, materials, designs, and methods, but most states do not have any mechanism to do so. Th ere is a clear need for developing and popularizing appro-priate technology through a network of institutions, which could result in low-cost, environment friendly, and disaster resistant houses as per local cultural preferences. Developing a menu of specifi c designs and technology options for each region refl ecting variations in environmental and cultural conditions would be the way to go forward.
INADEQUACY OF UNIT COST12.63 Th e poor quality of houses constructed is partly due to the low unit cost. State governments have been asking for enhancement of unit assistance to between Rs 50,000 and Rs 70,000. Th is is in line with the rec-
ommendations of Housing and Urban Development Corporation Ltd. (HUDCO), the Auroville Earth Institute, Building Material & Technology Promotion Council (BMTPC), and Central Building Research Institute (CBRI) made to the Eleventh Plan Working Group on Rural Housing.
12.64 Th e Union Budget for 2010–11 has raised the unit cost under IAY to Rs 45,000 in plain areas and Rs 48,500 in hilly areas. Additional costs could be provided by widening the ambit of the DRI scheme and increasing the amount of loan permissible to Rs 50,000 at 7 per cent interest per annum (as against Rs 20,000 per unit at 4 per cent rate of interest currently allowed under IAY). Th e real challenge is to: promote the DRI scheme by radically improving its awareness and implementation. Only 10,970 IAY benefi ciaries have so far availed of loans under the scheme during 2009–10. It needs to be promoted through women’s SHGs and dovetailed with the NRLMs to be launched shortly.
GREATER TRANSPARENCY AND SOCIAL AUDIT12.65 Th e Eleventh Plan noted irregularities in the method of selection of IAY benefi ciaries. It stated that ‘25 to 50 per cent of the benefi ciaries are not being selected through the gram sabhas. Allocation among panchayats has been infl uenced by PRIs/MLAs. Th e vocal and active segments of benefi ciaries infl uence the selection process. Th e poorest among BPL house-holds are left out and non-BPL families get selected. Besides, collection of illegal gratifi cation of selection by PRIs is a common complaint brought out by several studies.’
12.66 One method to check corruption in the selec-tion of benefi ciaries is the creation of a Permanent IAY Waitlist based on the 2002 BPL Census. Th ese waitlists should be painted on the walls of panchayat buildings. However, many states have been slow in do-ing this. Andhra Pradesh, Haryana, Kerala, Manipur, Meghalaya, Orissa, Tripura, West Bengal, Andaman and Nicobar Islands, Daman and Diu, Dadra and Nagar Haveli, and Puducherry have not yet prepared the waitlists. Uttar Pradesh, Goa, Jharkhand, Mizoram, Punjab, Sikkim, Arunachal Pradesh, and Lakshadweep have prepared the waitlists but their painting on the

268 Mid-Term Appraisal of the Eleventh Five Year Plan
walls is not yet complete. It is also necessary to have a real-time database of IAY benefi ciaries. Th is will promote transparency and strengthen the monitoring mechanism. An IAY-MIS needs to be developed to capture and maintain a database of benefi ciaries. Th e most eff ective means of ensuring transparency, as also quality of work, is social audit. Th is should be made an integral part of the programme and involve both physical and fi nancial verifi cation.
HABITAT DEVELOPMENT APPROACH12.67 IAY must ultimately metamorphose into a larger habitat development programme. Th is needs to include at least a provision of domestic water, sanita-tion, clean fuel, and electricity and calls for much deeper convergence between various departments, currently functioning in silo mode.
RURAL SANITATION12.68 Th e drive to extend sanitation services in rural areas is spearheaded by the TSC introduced in 1999, which marks a break from the past in acknowledging the need for a demand-driven approach based on behavioural change. It emphasizes the use of IEC for
awareness generation and health education. Eff orts are being made to complete the implementation of TSC projects in the countryside by 2012.
12.69 As can be seen from Figure 12.2, sanitation has grown impressively in rural India following the launch of TSC; this received a special boost aft er the Nirmal Gram Puraskars (NGPs) were announced in 2003. More than 22,000 NGPs have been awarded so far. By September 2009, rural sanitation coverage had grown to 62 per cent of the households (Box 12.4).
12.70 A target for constructing 72.9 million individual household latrines (IHHLs) was envisaged in the Eleventh Plan, of which 27.5 million (38 per cent) IHHLs had been constructed up to September 2009 (Table 12.10). The maximum incentive offered currently is Rs 2,200 per IHHL for BPL families (Rs 2,700 in hilly areas). Another goal of the Eleventh Plan is ensuring 100 per cent coverage of rural schools with toilet facilities by March 2010. At least one toilet block will be provided in each rural school. In coeducational schools, separate toilet blocks for girls
FIGURE 12.2: Rural Sanitation Coverage in India, 1980–2009
%C
ove
rage
inSa
nit
atio
n
70
60
50
40
30
20
10
0
1980
1988
1989
1990
1991
1993
1994
1996
1997
2000
2001
2002
2003
2004
2005
2006
2007
2008
2009
1980–1990
International drinking
water and sanitation
decade
1986–1999
Central Rural Sanitation
1999
Launch of Total Sanitation Campaign
62
57
45
38
31
272322.421.9
1817
6
141110
3
11
41
2003
Nirmal Gram Puraskar
% Sanitation coverage

Rural Development 269
will be constructed. Th is coverage increased from 30 per cent on 1 April 2007 to 76 per cent by September 2009 (Table 12.11).
TABLE 12.10Physical and Financial Progress of Rural Sanitation
in Eleventh Plan Period
Year IHHLs Expenditure Constructed (Rs crore) (million)
2007–08 11.5 1,0602008–09 11.2 1,2002009–10 (till September 2009) 4.8 531Total Eleventh Plan 27.5 2,791
AREAS OF CONCERN12.71 While these achievements are impressive, there remain signifi cant areas of concern. Th e NGPs have undoubtedly spurred competition among PRIs to hasten toilet construction but there are also reports which indicate an undermining of TSC’s demand-
driven approach. UNICEF and TARU conducted a study in 2008 of 162 NGP gram panchayats in six states (Andhra Pradesh, Chhattisgarh, Maharashtra, Tamil Nadu, Uttar Pradesh, and West Bengal), 37 of which had won NGPs in 2004–05 and 125 in 2005–06. Th eir survey, covering 7,100 households, found that only 4 per cent of the GPs were genuinely open def-ecation free. In 32 per cent of the GPs, more than 40 per cent of the people were not using the toilets built for them under TSC and were defecating in the open (Table 12.12).
12.72 Th e ASHWAS survey conducted by Arghyam in 17,200 households of 172 GPs across 28 districts of Karnataka came to similar conclusions. Nearly two-third of the NGP villages that they surveyed had more than 20 per cent open defecation; 20 per cent NGP villages had more than 50 per cent open defecation. Poor quality of construction and absence of behavioural change were the main reasons for the slip-back. In an ironic twist, the institution of
Box 12.4Community-Led Total Sanitation (CLTS) in Haryana: A Success Story
In March 2006, Haryana shift ed its implementation strategy from a conventional top–down, construction-based approach to the active involvement of village communities through PRIs, women’s groups, anganwadi workers, SHGs, facilitators, motivators, and school children focusing on Behavior Change Communication. Th e emphasis was on capacity building for all stakeholders at the state, district and village levels and behavioural change through innovative CLTS approaches. A cadre of district-level champions (swacchta sainiks) was built up. IEC activities included joint exposure visits to model sanitation project sites, celebration of swacchta week (cleanliness week) in coordination with departments like health, women and child development, education, agriculture and animal husbandry, swacchta yatras (cleanliness rallies) involving school children, and advocacy through print and electronic media. Rural sanitary marts for supply of sanitation facilities in the state are managed by PRIs. Th is innovative approach is refl ected in the phenomenal and rapid increase in sanitation coverage from a mere 29 per cent in 2001 to over 95 per cent today; 990 gram panchayats and one block have been awarded the Nirmal Gram Puraskar. In the CLTS approach, through a process of participatory facilitation, community members analyse their own sanitation status, including the extent of open defecation and the spread of fecal-oral contamination that adversely aff ects each one of them. Here ‘Walk of Shame’ is used as a powerful trigger. Going through the defecation area, walking among the feces and talking about the issues related to open defecation can have a lasting impact on people. Th is develops a sense of shame about the situation and oft en an immediate desire to change their sanitation status. Once people are convinced about the need for sanitation, they construct latrines on their own, and more importantly, use them regularly due to a strong sense of ownership. A community-driven approach does not require high subsidies, but it does need greater understanding of the individual and collective ‘triggers’ or factors that motivate people to change their perceptions about the need for safe sanitation. Th e CLTS campaign is driven by the following principles: facilitating communities’ own analysis; motivating communities to take independent decisions and action; not top-down standard designs but bottom-up innovations; and not just hardware support but supporting people and processes.

270 Mid-Term Appraisal of the Eleventh Five Year Plan
TABLE 12.11Sanitation Coverage across States, 2009
State Per cent Per cent of Per cent of Per cent of Per cent of Per cent of BPL HHS APL HHS APL + BPL Sanitary Schools Balwadis Covered Covered HHS Covered Complexes Built Covered Covered
Andhra Pradesh 61.65 57.35 60.11 100.00 86.32 35.86Arunachal Pradesh 20.32 14.67 19.55 10.06 87.40 66.61Assam 21.33 8.38 16.88 1.90 50.51 20.73Bihar 24.86 10.05 18.26 24.01 54.15 14.44Chhattisgarh 45.24 34.97 39.71 23.46 91.75 75.22D&N Haveli 1.49 0.00 1.49 8.33 0.00 0.00Goa 90.50 63.98 74.47 0.00 61.01 10.60Gujarat 76.96 84.72 80.81 100.00 100.00 94.36Haryana 96.00 97.46 97.01 77.38 97.69 84.72Himachal Pradesh 78.80 89.10 86.47 13.52 35.88 27.45Jammu & Kashmir 38.56 6.78 21.41 49.39 48.04 7.02Jharkhand 41.82 8.98 29.47 8.81 76.85 27.55Karnataka 41.93 37.78 39.65 42.30 99.37 98.83Kerala 98.19 100.00 100.00 72.84 93.92 65.44Madhya Pradesh 50.15 53.78 52.12 39.18 88.17 100.00Maharashtra 56.26 55.57 55.82 42.26 92.05 96.15Manipur 5.29 12.57 7.18 27.20 37.13 13.24Meghalaya 18.45 48.43 25.85 20.00 22.99 12.03Mizoram 97.50 95.50 97.06 61.43 100.00 100.00Nagaland 28.10 5.87 24.61 66.93 41.99 38.77Orissa 43.17 15.30 33.01 3.06 84.44 69.70Puducherry 12.17 0.00 12.17 0.00 0.00 100.00Punjab 17.96 70.43 42.42 15.33 93.14 23.70Rajasthan 27.77 36.68 34.18 22.99 73.46 41.13Sikkim 100.00 100.00 100.00 100.00 100.00 100.00Tamil Nadu 77.28 64.22 70.89 100.00 93.06 94.17Tripura 95.22 94.30 95.02 71.68 86.96 76.31Uttar Pradesh 62.96 44.72 52.03 98.38 89.85 72.57Uttarakhand 46.52 40.00 43.25 11.28 57.63 18.43West Bengal 89.42 48.10 70.85 47.37 45.65 28.59
TABLE 12.12NGP Villages with Proportion of People Going for Open Defecation, 6 States, 2008
None <20% 20–40% 40–60% 60–80% >80% Total
Andhra Pradesh 5 4 1 10Chhattisgarh 4 5 1 10Maharashtra 6 36 4 6 7 1 60Tamil Nadu 11 6 9 5 2 33Uttar Pradesh 1 7 6 1 15West Bengal 11 18 3 2 34Total 6 64 39 29 20 4 162Per cent of Total 4% 40% 24% 18% 12% 2% 100%
Source: UNICEF-TARU Primary Study (2008).

Rural Development 271
NGPs may have turned the clock back once again to a target-driven approach. Similar feedback from across the country has recently forced the Department of Drinking Water Supply (DDWS) to make the criteria for selection for NGP much more stringent. One simple condition that could make a big diff erence is giving the NGP only if one year of continuous use of toilets by all households in the GP is conclusively verifi ed.
12.73 Th e NGP example merely illustrates the larger problem plaguing TSC. It is apparent that a rush to meet targets has compromised the quality and sustain-ability of achievements. Th is requires deeper refl ection on the process that must guide TSC (Table 12.13).
SOFT INPUTS OF PREPARATORY PHASE CRITICAL12.74 Th e powerful element of TSC is the emphasis on IEC activities to bring about behavioural change and a real demand for improved sanitation, for which it earmarks 15 per cent of the total cost. Th e unfortunate part appears to be that though enough resources have been made available for these activities, their execu-tion has not been eff ective at the cutting-edge level of implementation. A survey in 40 GPs in 20 blocks across 10 districts in Bihar, Chhattisgarh, Haryana, Karnataka, and Tripura, conducted by Water Aid in 2008 argues that TSC is becoming increasingly state-led and target-driven. It fi nds that ‘IEC activities have been implemented without any conscious eff ort to create required awareness at the community level. Th ese activities were undertaken in a routine admin-istrative fashion as more of a fund utilisation exercise, not organically linked to awareness creation and demand generation processes’ (Indira Khurana and Romit Sen 2008: Feeling the Pulse: A Study of Total Sanitation Campaign in Five States). Top–down IEC strategies of posters and brochures with no individual contact have proven to be ineff ective: gaps in IEC have also led to lack of awareness about technology options and related engineering aspects, hardware maintenance issues, and hand washing and hygiene awareness, both at the school and community levels. IEC involves a specialized set of activities that demand professionalism of a kind rather diff erent from what line department personnel are normally trained for. Social mobilization for changing attitudes is not a
one-off activity. It is a complex process that takes time in the initial stages (see Box 12.5). Th ere is a point of infl ection aft er which the process takes off and is led by the people themselves thereaft er. But this happens only aft er a critical mass of qualitative eff ort is put in. IEC cannot be a one-time aff air with a rigid design. Th ere is a need to be fl exible with space for cross-learning and mid-course correction.
NEED FOR CLEAR TIME PHASING12.75 A great deal of eff ort is required to sustain the gains of the adoption phase to ensure that slip-backs do not occur. Just as has been recognized in the new guidelines for the Integrated Watershed Management Programme, perhaps the time has come to develop a phased approach for the implementation of TSC. Such a phased approach would make it possible to achieve universalization with quality, based on a process truly driven by demand from a community that is committed to improved sanitation, being fully informed about its benefi ts and, therefore, willing to take ownership of the campaign.
BROADER MENU OF TECHNOLOGIES REQUIRED12.76 One of the limitations of TSC is the narrow range of technology options offered in a country with such immensely diverse geographic, hydrologic, climatic, and socio-economic conditions (high water table, fl ood prone, rocky ground, desert/water scarce areas, and extreme low temperatures). Th is has led to many problems, including non-acceptance by local communities, water pollution, especially in shallow water table regions, and waste of public funds. Th ere is a need to broaden the range of models permissible under TSC. UNICEF has supported development of cost-eff ective models of low cost superstructures using hollow bricks, tin sheets, bamboo, coconut leaves, palm leaves, and waste wood. Th ese need to be more widely propagated through partnerships with civil society.
MORE IMAGINATIVE FUNDING OPTIONS12.77 It is obvious from Table 12.14 that quality sanitation is not possible within the kind of funding that has so far been provided or encouraged for TSC. Th e maximum incentive off ered currently is Rs 2,200 per IHHL for BPL families (Rs 2,700 in hilly areas).

Phas
e I: P
re-p
lann
ing
(0–6
mon
ths)
Soci
al m
obili
zatio
n—en
try
poin
t ac
tiviti
es, v
illag
e mee
tings
Soft w
are a
ctiv
ities
—IE
C, ex
posu
re v
isits,
hy
gien
e edu
catio
n, id
entif
ying
trai
ning
ne
eds (
need
s and
reso
urce
s),
scho
ol
sani
tatio
n, m
enstr
ual h
ygie
ne
Insti
tutio
nal p
roce
ss—
gram
sabh
a, in
tera
ctio
n w
ith p
anch
ayat
, vill
age
insti
tutio
ns, S
HG
s, se
t up
com
mun
ity
mon
itorin
g sy
stem
s/so
cial
pre
ssur
es/
trig
gers
to en
sure
usa
gePr
ogra
mm
e are
a ide
ntifi
catio
n—ba
sed
on d
eman
d/se
cond
ary
rese
arch
Base
line s
tudi
es/n
eeds
asse
ssm
ent—
soci
o-ec
onom
ic as
pect
s, to
ilets,
so
lid/li
quid
was
te m
anag
emen
t, sc
hool
sa
nita
tion,
vul
nera
ble a
nd sp
ecia
lly
able
d, m
enstr
ual h
ygie
ne, p
regn
anci
es
Surv
ey o
f tec
hnic
al m
odel
s—to
ilets,
so
lid/li
quid
was
te m
anag
emen
t, sc
hool
sa
nita
tion,
vul
nera
ble a
nd sp
ecia
lly
able
d, m
enstr
ual h
ygie
ne, O
&M
mod
els
Surv
ey o
f fi n
anci
al m
odel
s—go
vern
men
t, do
nor,
cont
ribut
ions
, SH
G
linka
ges,
bank
sEs
timat
ing
hum
an re
sour
ces
requ
irem
ent
Plan
ning
for M
anag
emen
t Inf
orm
atio
n Sy
stem
Phas
e II:
Plan
ning
and
Prep
arat
ory
(0–1
2 m
onth
s)So
cial
mob
iliza
tion—
dem
and
crea
tion,
aw
aren
ess g
ener
atio
nSo
ft war
e act
iviti
es—
IEC,
expo
sure
vi
sits,
hygi
ene e
duca
tion,
pre
para
tion
of co
mm
unic
atio
n pl
ans a
nd tr
aini
ng
mod
ules
, tra
inin
g (s
taff ,
faci
litat
ors,
teac
hers
, mas
ons)
, sc
hool
sani
tatio
n,
men
strua
l hyg
iene
Insti
tutio
nal p
roce
ss—
stren
gthe
ning
of
insti
tutio
ns; f
orm
atio
n of
wat
san
com
mitt
ees,
area
and
distr
ict r
esou
rce
grou
ps, s
copi
ng fo
r con
verg
ence
of G
P fu
nds/
prog
ram
mes
, etc
.Pa
rtic
ipat
ory
plan
ning
—PR
A, f
ocus
ed
grou
p di
scus
sions
, vill
age m
appi
ng
indi
catin
g de
feca
tion
plac
es, w
ater
lo
ggin
g pl
aces
, sol
id w
aste
, inc
iden
ce o
f w
ater
bor
ne d
iseas
esEv
alua
te a
nd f
inal
ize
tech
nica
l pla
ns—
toile
ts, w
ater
supp
ly to
toile
ts, so
lid/li
quid
w
aste
man
agem
ent,
scho
ol s
anita
tion,
vu
lner
able
and
spec
ially
-abl
ed, m
enstr
ual
hygi
ene;
appr
oval
by
gram
sabh
a
Eval
uate
and
fi nal
ize fi
nan
cial
pla
n—es
tabl
ish li
nkag
es fo
r fun
ds, a
lloca
tions
or
cost
shar
ing
Dep
loym
ent o
f HR—
base
d on
pla
n fo
r so
ft war
e and
har
dwar
e
Esta
blish
ing
supp
ly ch
ain
linka
ges
Act
ivat
ing
Man
agem
ent I
nfor
mat
ion
Syste
m
Phas
e III
: Pro
gram
me I
mpl
emen
tatio
n(6
–36
mon
ths)
Soci
al m
obili
zatio
n—fo
r dem
and
crea
tion
and
for b
ette
r O&
MSo
ft war
e act
iviti
es—
hygi
ene e
duca
tion,
tr
aini
ng (O
&M
, disp
osal
, reu
se),
scho
ol
sani
tatio
n
Insti
tutio
nal p
roce
ss—
soci
al au
dit/
com
mun
ity m
onito
ring
of co
nstr
uctio
n,
etc.
Man
agin
g m
ater
ial fl
ow
s—ex
plor
e loc
al
man
ufac
ture
and
supp
ly
Cons
truc
tion—
toile
ts, w
ater
supp
ly to
to
ilets,
solid
/liqu
id w
aste
man
agem
ent,
scho
ol sa
nita
tion,
vul
nera
ble a
nd
spec
ially
-abl
ed, m
enstr
ual h
ygie
ne
Man
agin
g fu
nd/c
ash
fl ow
s—ac
tivat
ing
repo
rtin
g an
d di
ssem
inat
ion
syste
ms
Prep
arat
ion
of O
&M
stra
tegy
/pro
toco
l, et
c.
Prep
arin
g po
st-pr
ojec
t str
ateg
y—ex
it str
ateg
y, d
ocum
enta
tion
and
shar
ing
of le
arni
ng, p
ost-p
roje
ct in
stitu
tiona
l fu
nctio
ning
Act
ivat
ing
Man
agem
ent I
nfor
mat
ion
Syste
m
Phas
e IV
: Sus
tain
ing
the U
sage
—O
&M
an
d G
over
nanc
e (fro
m th
e 6th
mon
th)
Soci
al m
obili
zatio
n—fo
r sus
tain
ing
use
and
bette
r O&
MSo
ft war
e act
iviti
es—
hygi
ene e
duca
tion,
tr
aini
ng (O
&M
, em
ptyi
ng p
its,
disp
osal
, re
use)
, sc
hool
sani
tatio
n, m
enstr
ual
hygi
ene,
hygi
ene e
duca
tion
Insti
tutio
nal p
roce
ss—
com
mun
ity
mon
itorin
g/so
cial
pre
ssur
es/tr
igge
rs to
pr
even
t slip
page
s, en
d-lin
e sur
veys
Act
ivat
ing
the O
&M
stra
tegy
—ro
les a
nd
resp
onsib
ilitie
s, ch
arge
s, et
c.
Perio
dic a
nd re
gula
r im
pact
mon
itorin
g–
soci
o-ec
onom
ic–
heal
th–
grou
ndw
ater
– be
havi
our s
tudi
es–
end-
line s
urve
ysIm
plem
entin
g po
st-pr
ojec
t str
ateg
y
Act
ivat
ing
Man
agem
ent I
nfor
mat
ion
Syste
m
Sour
ce: A
rghy
am (2
009)
, Ste
p by
Ste
p: W
hat i
t Tak
es to
Ach
ieve S
usta
inab
le Sa
nita
tion?
Sub
miss
ion
to th
e Pla
nnin
g Co
mm
issio
n.
TA
BL
E 1
2.13
Che
cklis
t o
f Act
ivit
ies
in F
our
Pha
ses
of T
SC

Rural Development 273
Th is amount is clearly insuffi cient for even the most rudimentary sanitation. Th e way forward is to combine the incentive amount provided by the government with a loan amount on soft terms to be routed through
women’s SHGs. In order to make adoption of the menu of technologies viable, it is critical that the loan component is actively canvassed and converged with the new NRLMs. Th e third component, other
Box 12.5Case Study of Gramalaya
According to Gramalaya, an NGO working in Tiruchirapalli district of Tamil Nadu since 1987, it takes about fi ve years to ensure sustained use of toilets. Gramalaya’s strength is also its women SHGs. As the graph shows, one-third of the population generally gets convinced in the fi rst three months as a result of intense IEC activities; the next 30 per cent aft er exposure visits to successful projects, where interaction with toilet users brings about an attitudinal change. Th is happened within the fi rst year. Another year sees the next 30 per cent change aft er they see their neighbours using toilets. To convince the remaining 10 per cent is the hardest and requires multiple strategies (including pressure from the community) and goes into the third year.
3-Year Time Line—From Open Defecation to 100 per cent Use of Toilets
Note: Values as per cent population using toilets.
TABLE 12.14Possible Choice of Technology in Rural Sanitation
Description Toilet Types Single pit Twin pit Eco-sanitation Toilet with bathroom
Where suitable/ Not suitable in waterlogged, Not suitable in Suitable in water scarce Provides forunsuitable shallow water table areas waterlogged, shallow areas/where water table privacy and needs water table areas is deep; waterlogged of women during areas; hard rock/impervious menstrual periods soil regions, coastal areas Disadvantages Gets fi lled up fast; while emptying Groundwater leaching Needs intense behavioural/ pits, slippages can occur; if not properly designed cultural change; management groundwater leaching if inputs high not properly designed Hardware cost Rs 3,000–3,500 Rs 5,000–6,000 Rs 8,000–12,000 Rs 12,000*
Note: *Includes cost of twin pit and water connection.
30%
60%
90%100%
0–3 months 3–12 months 12–24 months 24–36 months

274 Mid-Term Appraisal of the Eleventh Five Year Plan
than incentives and loans, would be beneficiary contributions, which would be easy to mobilize in a demand-driven programme, once the necessary eff ort has been put into the preparatory phase.
SANITATION AND WATER SUPPLY TOGETHER12.78 It is evident that the use of toilets cannot be sustained without the provision of water supply. Many NGP villages have slipped back to open defecation because the promised water supply never materialized. Th e TSC has overlooked the water needs of sanitation. DDWS needs to ensure that the two activities under its charge are taken up conjointly in every village. Otherwise, failure is inbuilt into the eff ort.
SOLID AND LIQUID WASTE MANAGEMENT12.79 Th e TSC guidelines state that ‘PRIs are required to put in place mechanisms for garbage collection and disposal and for preventing water logging. Up to 10 per cent of the project cost can be utilized for meeting capital costs incurred under this component. Under this component activities like common compost pits, low cost drainage, soakage channels/pits, reuse of waste water, system for collection, segregation and disposal of household garbage, etc. may be taken up.’ Th is, however, has been the weakest link in the TSC chain so far. Only 15,844 GPs in the country have taken up solid and liquid waste management so far. Th ere is a serious lack of knowledge about appropriate tech-nologies, costs, and O&M procedures. A clear roster of options and activities needs to be developed and disseminated through the best training institutions in India. A large number of Master Trainer Organizations need to be developed within each state, which would in turn build capacities of functionaries and people’s representatives at the GP level.
CAPACITY BUILDING12.80 Th e key to TSC’s success lies in developing capacities for its eff ective implementation. Th is has two components: (a) altering the human resource profi le of the implementing agency to include social workers and social anthropologists/psychologists who could play a key role in social mobilization as also attitude-behaviour change, and b) training of the personnel deployed. A whole army of masons is
required to be developed and trained in setting up diff erent sustainable sanitation options. PRI members have to be trained to become change agents. Absence of requisite capacity with PRIs has impacted social mobilization processes, as well as maintenance of the infrastructure in the post-implementation phase.
12.81 The DDWS has launched the concept of Communication and Capacity Development Units (CCDUs) at the state level to promote reform initiatives in drinking water supply and sanitation. An evaluation by WaterAid shows that CCDUs are present in almost all the states but are not always very active or eff ective. Th ey have not yet emerged as resources to bank on for sanitation. Generally, capacity building has tended to be a one-off activity, without follow-up to ensure that the inputs of training are being translated into results on the ground.
12.82 Th ere is a need to set up dedicated resource centres at the block level, which will impart hands-on training to masons on various sustainable sanitation models as also PRI representatives and functionaries to undertake social mobilization programmes and to help them understand issues of O&M and sustain-ability.
12.83 If we are able to address this entire range of issues, we could look forward not only to meeting the MDGs but also creating sustainable sanitation villages across the length and breadth of India. Table 12.15 summarizes a checklist of possible parameters for judging whether a village has truly acquired that status.
NATIONAL SOCIAL ASSISTANCE PROGRAMME (NSAP)12.84 An integral element of India’s battle with poverty and distress is providing succour to senior citizens, diff erently-abled people, and others who have suff ered due to mishaps in life. Th e NSAP refers to a basket of welfare schemes that provide social assistance to a wide range of people in need. At the beginning of the Eleventh Plan, NSAP comprised of the Indira Gandhi National Old Age Pension Scheme (IGNOAPS), the Annapurna Scheme, and the National

Rural Development 275
Family Benefi t Scheme (NFBS). In February 2009, two more schemes were added under NSAP—the IGNWPS and the IGNDPS.
TABLE 12.16NSAP Physical and Financial Progress in
Eleventh Plan
Year Expenditure Reported Benefi ciaries (Rs crore) (in lakh)
2006–07 1,967.96 98.242007–08 3,116.17 128.922008–09 3,874.92 164.55
12.85 Under IGNOAPS, a central assistance of Rs 200 per benefi ciary is provided to BPL applicants over 65 years of age. Pension is to be credited wherever possible
in a post offi ce or a bank account. Th e Government of India urges state governments to make an equal con-tribution, thereby increasing the pension amount to Rs 400 per month. Th e coverage under IGNOAPS, as compared to estimated numbers is given at Annexure 12.1. Th e national coverage of eligible benefi ciaries under IGNOAPS is about 105 per cent. Only Goa has less than 40 per cent coverage. Kerala, Gujarat, and Orissa cover 40–70 per cent eligible benefi ciaries.
12.86 Th e amount of pension paid per month, includ-ing the state’s contribution is given in Annexure 12.2. At present, 18 states and UTs are providing Rs 400 or more as pension under the Old Age Pension scheme. Th ese are Delhi, Goa (Rs 1,000), Haryana, Chandigarh (Rs 700), Puducherry (Rs 600), Andaman and Nicobar Islands, Dadra and Nagar Haveli, and Maharashtra (Rs 500), Punjab (Rs 450), and Gujarat, Jharkhand, Karnataka, Rajasthan, Uttarakhand, Sikkim, Tripura, Tamil Nadu, and West Bengal (Rs 400). Another 11 states and UTs are providing pension between Rs 200 and Rs 400. Th ese are Himachal Pradesh, Jammu and Kashmir, Chhattisgarh, Nagaland, Uttar Pradesh, Lakshadweep, Madhya Pradesh, Kerala, Assam, Meghalaya, and Mizoram. Th e remaining six states and UTs are disbursing pension at the rate of Rs 200 per month only.
12.87 Many states are contributing from their own funds towards pension for old people in the age group of 60–64 years, who are not covered by IGNOAPS. Th ese include Andhra Pradesh, Chhattisgarh, Goa, Himachal Pradesh, Jharkhand, Madhya Pradesh, Orissa, and Punjab (for women), Rajasthan (above 58 years for men and above 55 years for women), Uttar Pradesh, Uttarakhand, Chandigarh, Delhi, and Puducherry.
12.88 Supplementing IGNOAPS since 2000–01 is the Annapurna scheme, which aims at providing food security to senior citizens who, though eligible, remain uncovered under IGNOAPS. Th ey receive 10 kg of food grains per month free of cost through Fair Price Shops (Table 12.17). Progressive absorption under IGNOAPS should allow this scheme to end within the Eleventh Plan.
TABLE 12.15Checklist of Parameters for a Sustainable Sanitation Village
Parameters a. No open defecation in village leading to pollution of water
sourcesb. 100 per cent coverage and usage of toiletsc. Special provision for aged, specially abled, pregnant
womend. 100 per cent school sanitation (separate toilets for girls
and boys)e. Water supply available for toilets f. No additional burden on women for fetching water for
toiletsg. Presence of a well-maintained drainage system (drain should
not be clogged; water should not stagnate; should not pollute water sources)
h. Grey water treated and reused i. Presence of solid waste management systems (like composts
etc.; solid waste not found littered in the village; not clogging drains)
j. High in hygiene behaviour (every one washes hand aft er defecation; handles drinking water with clean hands)
k. Issues of menstrual hygiene addressedl. Local capacity available for operating and maintain sanitation
systemsm. Water quality tested by the community twice a year
(indicative) and information disseminated and follow-up by confi rmative tests and follow-up action taken
n. Reduction in water borne diseases in the village validated by ASHAs; no deaths reported
Source: Arghyam (2009), Step by Step: What It Takes to Achieve Sus-tainable Sanitation? Submission to the Planning Commission.

276 Mid-Term Appraisal of the Eleventh Five Year Plan
TABLE 12.17Benefi ciaries under Annapurna
Year Benefi ciaries under Annapurna (million)
2002–03 0.782003–04 1.062004–05 0.822005–06 0.852006–07 0.872007–08 1.052008–09 1.01
12.89 NFBS provides for central assistance of Rs 10,000 in the case of death of the primary bread winner (18–64 years of age) of the family (Table 12.18). Th e coverage under NFBS, as compared to estimated numbers is given in Annexure 12.3. Overall, 97 per cent of the benefi ciaries were covered during 2008–09. States with less than 20 per cent coverage are Nagaland and NCT Delhi.
TABLE 12.18Benefi ciaries under NFBS
Year Benefi ciaries (in lakh)
2002–03 0.852003–04 2.092004–05 2.612005–06 2.762006–07 2.432007–08 3.342008–09 4.23
IGNWPS AND IGNDPS12.90 In February 2009, IGNWPS was started to provide pension of Rs 200 per month per benefi ciary to BPL widows in the age group of 40–64 years. Th e estimated number of benefi ciaries under IGNWPS is 45 lakh. States are in the process of identifying eligible benefi ciaries under the scheme. IGNDPS was also started in the same month for BPL persons with severe or multiple disabilities (in the age group of 18–64 years) at the rate of Rs 200 per month per benefi ciary. It is estimated that 15 lakh benefi ciaries will be covered under this scheme; 24.30 lakh beneficiaries have been covered so far under IGNWPS and 5.23 lakh under IGNWPS.
COMPUTERIZATION OF DATABASES12.91 In order to increase transparency and ac-countability, it has been decided to computerize the database of benefi ciaries under various NSAP schemes. NIC was entrusted with the project and the soft ware has been developed for all pension schemes. The soft ware captures all essential processes from iden-tifi cation till termination of the pension. Legacy data formats have been provided to states and they have been asked to upload this data of benefi ciaries in a time bound manner. Th e NSAP website was launched in 2009. Data of 104 lakh beneficiaries has been uploaded on the website so far.
SUGGESTIONS FOR WAY FORWARD• Pensions need to be indexed to infl ation.• States need to make their share of payments under
IGNOAPS.• As suggested in the Eleventh Plan document, NFBS
must cover deaths of any adult member of a family in a BPL household, without limiting it to the bread winner.
• As suggested in the Eleventh Plan document, national schemes for maintenance of orphans, street children, and other most vulnerable sections also need to be started.
• Rs 17,747 crore has been provided for NSAP in the Eleventh Plan out of which Rs 12,590 crore has already been released to the states in fi rst three years of the Plan period leaving Rs 5,157 crore for the remaining period of the Eleventh Plan. IGNWPS and IGNDPS were launched in February 2009. Keeping in view the number of benefi ciaries to be covered and the new schemes proposed, additional outlays would be needed for NSAP in the remaining two years of the Eleventh Plan.
• With the transfer of programme implementation to the states from 2002–03 (and hence change from a CSS to Additional Central Assistance (ACA) in budgetary terms), reporting and monitoring by the Government of India has weakened. Th ese systems need to be strengthened.
• Th e previous fund fl ow model of pension transfers directly to DRDAs may be preferable to routing through state treasuries. The latter encourages diversion of NOAPS for other purposes (Gujarat,

Rural Development 277
Jharkhand, and Orissa made no NOAPS payments in some of the early years of this decade). In Bihar, Jharkhand, West Bengal, and Manipur there are reports of delays of many months thanks to the state treasury route being adopted.
• Documentary requirements for proving eligibility and identity have proved extremely onerous for the benefi ciaries who are among the most vulnerable. It is hoped that the use of UID (once available) will ease some of these pressures.
• Many states have devised somewhat arbitrary and harsh exclusion criteria which have been applied in a mechanical manner that discriminate against some of the most vulnerable. Even having a living adult son has meant exclusion in some cases. Such practices must be stopped.
• Shift ing to payment through post offi ces or banks is a signifi cant step in ensuring transparency. But as under MGNREGA, where density of banks/POs is low or because of lack of adequate staff , people have had to suff er great hardships in the transition period. Aged and disabled people may not be able to reach the POs or banks. Th e banking correspondent model with UID biometrics could be a way out as
it would provide payments at the doorstep in a transparent manner.
COUNCIL FOR ADVANCEMENT OF PEOPLE’S ACTION AND RURAL TECHNOLOGY (CAPART) 12.92 CAPART is an autonomous body within MoRD, registered as a society under the Societies Registration Act. It is the largest single agency promoting voluntary action for rural development in India.
12.93 The Eleventh Plan saw a major initiative in 2009 for the reform of CAPART. A committee headed by Member (Rural Development), Planning Commission, is preparing a blueprint to revitalize the organization to introduce reforms in its programmes and professionalize its functioning and governing structures to build powerful partnerships with civil society to promote creative and innovative work that would also help in improving implementation of the various programmes of MoRD, such as MGNREGA. Distinguished members of the Executive Committee of CAPART have been divided into sub-groups that will come up with detailed recommendations on a comprehensive design for CAPART reform.

278 Mid-Term Appraisal of the Eleventh Five Year Plan
ANNEXURE 12.1Coverage under IGNOAPS
S. No. States/UTs Estimated No. of Benefi ciaries under No. of Benefi ciaries % Coverage IGNOAPS as per 2004–05 Poverty Estimate in 2009–10
1 2 3 4 5
1 Andhra Pradesh 6,78,294 9,19,230 135.522 Bihar 15,27,246 21,92,357 143.553 Chhattisgarh 4,31,086 5,09,842 118.274 Goa 11,592 2,687 23.185 Gujarat 4,57,296 2,11,057 46.156 Haryana 1,69,400 1,30,306 76.927 Himachal Pradesh 42,400 85,637 201.978 Jammu & Kashmir 27,162 1,29,000 474.939 Jharkhand 4,39,673 6,43,000 146.2510 Karnataka 7,65,500 8,34,405 109.0011 Kerala 3,93,000 1,76,064 44.8012 Madhya Pradesh 11,31,382 10,66,051 94.2313 Maharashtra 19,37,477 10,24,364 52.8714 Orissa 10,16,160 6,43,400 63.3215 Punjab 1,44,060 1,59,292 110.5716 Rajasthan 6,17,032 5,28,322 85.6217 Tamil Nadu 9,76,950 9,04,759 92.6118 Uttar Pradesh 26,50,568 33,00,260 124.5119 Uttaranchal 1,91,268 1,69,102 88.4120 West Bengal 10,36,659 11,91,716 114.96
NE States21 Arunachal Pradesh 6,096 14,500 237.8622 Assam 2,11,184 6,28,949 297.8223 Manipur 19,496 72,514 371.9424 Meghalaya 14,222 37,146 261.1925 Mizoram 4,735 23,747 501.5226 Nagaland 12,885 28,053 217.7227 Sikkim 4,322 18,879 436.8128 Tripura 34,945 1,36,592 390.88
UTs29 A&N Islands* 2,938 861 29.3130 Chandigarh 2,485 4,464 179.6431 D&N Haveli 1,992 911 45.7332 Daman & Diu 630 95 15.0833 Delhi 86,289 1,21,974 141.3634 Lakshadweep 480 36 7.5035 Puducherry 14,112 20,757 147.09 Total 1,50,61,016 1,59,30,329 105.77

Rural Development 279
ANNEXURE 12.2Amount of Pension Paid per Month
S. No. Name of State/UTs Amount of Pension Contribution of State Mode of Provided as Central Govt. per Pensioner Disbursement Assistance per Month under IGNOAPS
1 Andhra Pradesh Rs 200.00 Nil Bank/Cash2 Bihar Rs 200.00 Nil Post Offi ce A/c3 Chhattisgarh Rs 200.00 Rs 100.00 Bank/Cash4 Goa Rs 200.00 Rs 800.00 Post Offi ce5 Gujarat Rs 200.00 Rs 200.00 MO6 Haryana Rs 200.00 Rs 500.00 Cash7 Himachal Pradesh Rs 200.00 Rs 130.00 MO/Bank/PO8 Jammu & Kashmir Rs 200.00 Rs 125.00 Bank9 Jharkhand Rs 200.00 Rs 200.00 Bank/PO/Cash10 Karnataka Rs 200.00 Rs 200.00 Bank/MO11 Kerala Rs 200.00 Rs 50.00 MO12 Madhya Pradesh Rs 200.00 Rs 75.00 Bank/PO/MO13 Maharashtra Rs 200.00 Rs 300.00 Bank/PO14 Orissa Rs 200.00 Nil Cash15 Punjab Rs 200.00 Rs 250.00 Bank/Cash16 Rajasthan Rs 200.00 Rs 200.00 MO/Cash17 Tamil Nadu Rs 200.00 Rs 200.00 MO18 Uttar Pradesh Rs 200.00 Rs 100.00 Bank19 Uttaranchal Rs 200.00 Rs 200.00 Bank/PO/MO20 West Bengal Rs 200.00 Rs 200.00 Bank/PO/MO/Cash
NE States21 Arunachal Pradesh Rs 200.00 Nil Cash22 Assam Rs 200.00 Rs 50.00 Bank/Cash23 Manipur Rs 200.00 Nil Cash24 Meghalaya Rs 200.00 Rs 50.00 Bank/Cash/PO25 Mizoram Rs 200.00 Rs 50.00 Bank/Cash26 Nagaland Rs 200.00 Rs 100.00 MO27 Sikkim Rs 200.00 Rs 200.00 Cash28 Tripura Rs 200.00 Rs 200.00 Bank/Cash
UTs29 A&N Islands Rs 200.00 Rs 300.00 PO30 Chandigarh Rs 200.00 Rs 300.00 Bank31 D&N Haveli Rs 200.00 Rs 300.00 PO32 Daman & Diu Rs 200.00 Nil Bank33 Delhi Rs 200.00 Rs 800.00 Bank/PO34 Lakshadweep Rs 200.00 Rs 100.00 Cash35 Puducherry Rs 200.00 Rs 400.00 Bank/Cash/PO

280 Mid-Term Appraisal of the Eleventh Five Year Plan
ANNEXURE 12.3 National Family Benefi t Scheme (NFBS)
S. No. States/UTs Mortality Figures Poverty Estimates of Estimated No. of No. of % of for Age Group Planning Commission Number of Benefi ciaries Benefi ciaries Coverage 20–64 Years as 2004–05 based on Benefi ciaries Covered Covered 2008–09 per Projected Uniform Recall under NFBS during during (7/5%) Population as on for Period (URP) 2007–08 2008–09 1.3.2006 and Consumption SRS 2003 (in percentage)
1 2 3 4 5 6 7 8
1 Andhra Pradesh 2,22,039 15.8 17,541 17,261 15,067 862 Bihar 2,01,373 41.4 41,684 27,476 22,421 543 Chhattisgarh# 1,00,469.6 40.9 20,546 9,782 10,343 504 Goa*# 6,760 13.8 466 257 282 615 Gujarat 1,50,976 16.8 12,682 7,128 7,554 606 Haryana 54,408 14 3,809 2,250 4,481 1187 Himachal Pradesh 17,078 10 854 2,000 2,000 2348 Jammu & Kashmir# 42,885 5.4 1,158 6,123 2,689 2329 Jharkhand# 10,4170 40.3 20,990 4,378 19,810 9410 Karnataka 1,66,378 25 20,797 21,246 19,054 9211 Kerala 75,309 15 5,648 27,611 26,360 46712 Madhya Pradesh 1,96,703 38.3 37,669 40,000 44,924 11913 Maharashtra 2,71,356 30.7 41,653 19,488 47,484 11414 Orissa 13,0,914 46.4 30,372 30,453 33,384 11015 Punjab 63,612 8.4 2,672 1,290 2,411 9016 Rajasthan 1,37,287 22.1 15,170 703 017 Tamil Nadu 2,12,970 22.5 23,959 6,877 17,913 7518 Uttar Pradesh 5,36,369 32.8 87,964 41,705 87,118 9919 Uttarakhand 36,782 39.6 7,283 5,124 7020 West Bengal 2,05,624 24.7 25,395 48,132 35,261 13921 Arunachal Pradesh$# 3,569 17.6 314 347 100 3222 Assam 1,05,278 19.7 10,370 7,514 5,894 5723 Manipur$# 7,785 17.3 673 5,419 1,670 24824 Meghalaya$# 7,078 18.5 655 1,144 981 15025 Mizoram$# 3,078 12.6 194 614 31626 Nagaland$# 6,478 19 615 110 110 1827 Sikkim$# 1,862 20.1 187 401 100 5328 Tripura$# 11,255 18.9 1,064 4,164 8,438 79329 A&N Islands*# 1,664 22.6 188 4 230 Chandigarh*# 4,279 7.1 152 300 396 26131 D&N Haveli*# 976 33.2 162 82 032 Daman & Diu*# 766 10.5 40 033 NCT Delhi# 40,779 14.7 2,997 400 400 1334 Lakshadweep*# 261 16 21 12 20 9535 Puducherry*# 4,654 22.4 521 0 Total 31,33,223 4,36,465 3,34,053 4,22,407 97
Notes: * Total projected population of age group 20–64 years as on 1.3.2006 with respect to Goa and UTs (except NCT Delhi) is 2,652,000, which is divided among them in proportionate to their population in age group 20–64 years as per Census 2006. $ Total projected population of age group 20–64 years as on 1.3.2006 in respect to NE states (except Assam) is 69,67,000, which is divided among them in proportionate to age group 20–64 as per Census 2004. # Age-specifi c death rates in respect of these states/UTs are not available in SRS 2003. Th erefore, the projected Crude Death Rate for 2006–10 with respect to these states has been taken into account. Crude Death Rate with respect to Goa and UTs (except NCT Delhi) are not available, therefore the All-India Crude Death Rate has been taken into account for them.