Embed Size (px)
Citation preview
Energy & Power Industry UpdateApril 2011
Member FINRA/SIPC
April 2011
Energy & Power Industry UpdateApril 2011
What We’ve Been Reading
page 1
• After a March filled with global sources of unrest, “black swans” are starting to look white. The
continued unrest in the Middle East combined with the earthquake, tsunami, and subsequent nuclear
disaster in Japan have added to a long list of exogenous events beginning with last spring’s Deepwater
Horizon accident and followed by the European debt crisis (also re-emerging, but overshadowed at the
moment). Outside of the issues facing the EU, energy and power has played a central role in each of
these events. As per usual for these types of events, we have found The Wall Street Journal and The
New York Times to be the best sources of up-to-the-minute information on both the crisis in Japan and
the unfolding situation in the Middle East.
• Much like Deepwater Horizon last year, the situation at the Fukushima nuclear plant continues to play
out slowly, and while it is clearly an industry-changing event, the long-term implications remain highly
uncertain. A flood of commentary is available on the topic, and we thought we’d provide a summary of
some of the more interesting pieces we’ve read. The Economist concedes Fukushima will slow the
growth of nuclear power, but wonders if it will derail it. The Oil & Gas Journal thinks the answer to that
question, in the U.S. at least, is yes. In Greentech Media, Amory Lovins, widely considered among the
world’s leading authorities on energy, thinks that’s a good thing. Jeff Eerkens (also in GTM) borrows
from his book, The Nuclear Imperative, to stress the counterpoint that nuclear power remains a necessity.
Stewart Brand reaches the same conclusion in Foreign Policy. Finally, NRG Energy CEO David Crane
and Duke Energy’s CEO Jim Rogers sound off with their views in GigaOM and Bloomberg
Businessweek, respectively.
• But enough about nuclear. Oil prices topped $100 per barrel for the first time since 2008 last month with
few signs of abatement. Prior to the recent highs, The Economist kicked off the month with “The 2011
Oil Shock,” which examined the potential implications for the global economy. Foreign Policy more
recently took a look at the issue from a U.S. perspective. Its title, “America Over a Barrel,” gives a good
sense for its thesis. For those looking for some longer form reading on the oil topic, Bloomberg
Businessweek provided a nice summary of “The Oil Book Economy” in February.
• The rise in oil prices and re-evaluation of nuclear power have both contributed to renewed calls for the
U.S. to formulate an energy policy. Last week, President Obama outlined his energy policy, which The
Economist quickly dubbed “Recycled.” His outline does call for the implementation of several key
elements of the “Pickens Plan,” particularly surrounding natural gas-powered vehicles. This combined
with the potential re-allocation of America’s future power generation mix post-Fukushima, already
shifting away from coal, point to a much larger potential role for natural gas in the future. The
Bipartisan Policy Center, founded in 2007 by former Senate Majority Leaders Howard Baker, Tom
Daschle, Bob Dole, and George Mitchell, released a report last week that highlights the importance of
natural gas to the country’s energy future. Read the report here.
• Arnold Schwarzenegger, in “Energy Ideas Democrats and Republicans Agree On,” sounded off in The
Atlantic with a call for Americans to embrace clean technologies, such as solar. “Let’s face it,” says the
former California governor / Terminator, “asking whether large solar power plants are appropriate in the
Mojave desert is like wondering whether subways make sense in New York City.” Read it here.
• Finally, M&A activity in the smart grid and energy management sectors continues to be one of the most
active arenas within cleantech. GigaOM highlights this trend, particularly the convergence of smart
grids with smart buildings, highlighting recent acquisitions such as Alstom’s acquisition of UISOL
(HW&Co. advised UISOL on its sale to Alstom). Read the article here.
Energy & Power Industry UpdateApril 2011
LTM EBITDA Multiples1
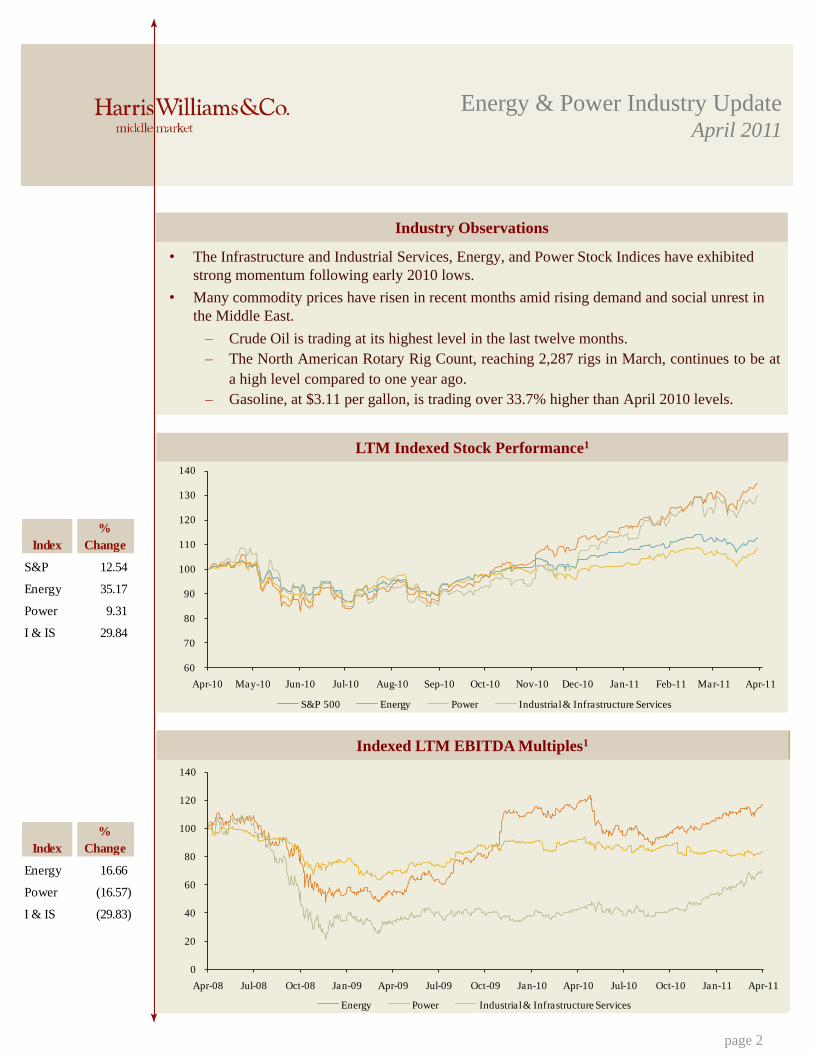
Industry Observations
LTM Indexed Stock Performance1
Indexed LTM EBITDA Multiples1
• The Infrastructure and Industrial Services, Energy, and Power Stock Indices have exhibited
strong momentum following early 2010 lows.
• Many commodity prices have risen in recent months amid rising demand and social unrest in
the Middle East.
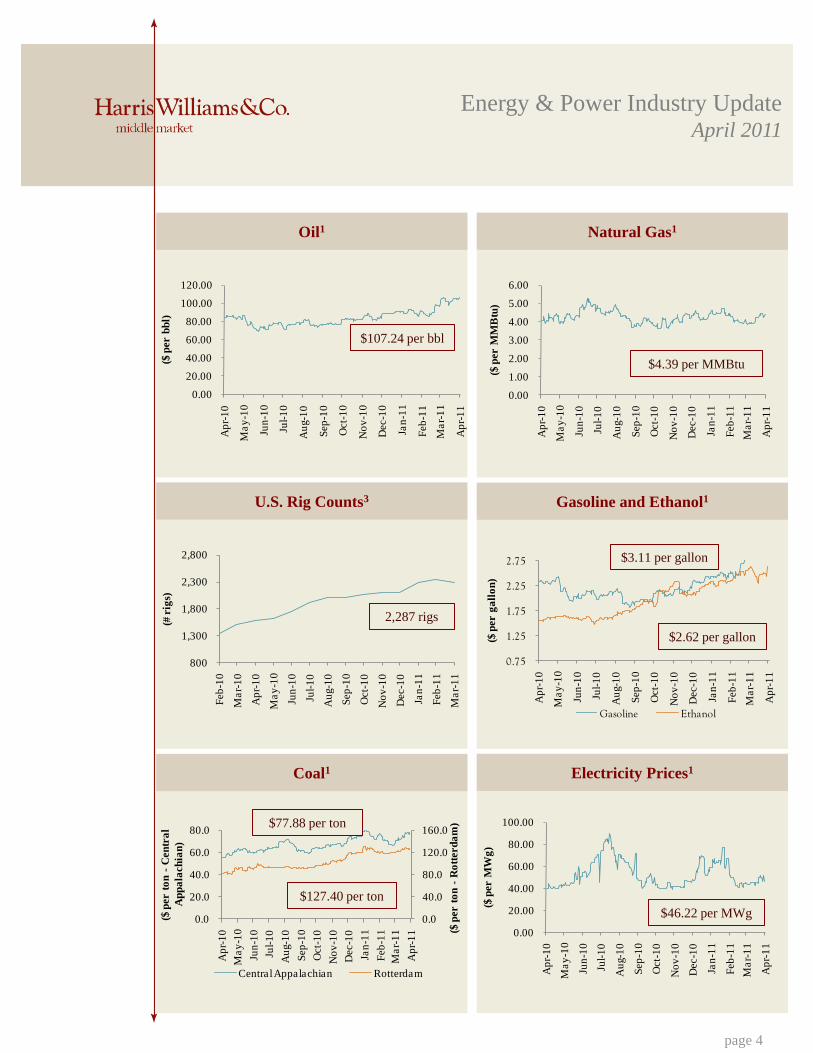
– Crude Oil is trading at its highest level in the last twelve months.
– The North American Rotary Rig Count, reaching 2,287 rigs in March, continues to be at
a high level compared to one year ago.
– Gasoline, at $3.11 per gallon, is trading over 33.7% higher than April 2010 levels.
60
70
80
90
100
110
120
130
140
Apr-10 May-10 Jun-10 Jul-10 Aug-10 Sep-10 Oct-10 Nov-10 Dec-10 Jan-11 Feb-11 Mar-11 Apr-11
S&P 500 Energy Power Industrial & Infrastructure Services
0
20
40
60
80
100
120
140
Apr-08 Jul-08 Oct-08 Jan-09 Apr-09 Jul-09 Oct-09 Jan-10 Apr-10 Jul-10 Oct-10 Jan-11 Apr-11
Energy Power Industrial & Infrastructure Services
page 2
Index
%
Change
S&P 12.54
Energy 35.17
Power 9.31
I & IS 29.84
Index
%
Change
Energy 16.66
Power (16.57)
I & IS (29.83)
Energy & Power Industry UpdateApril 2011
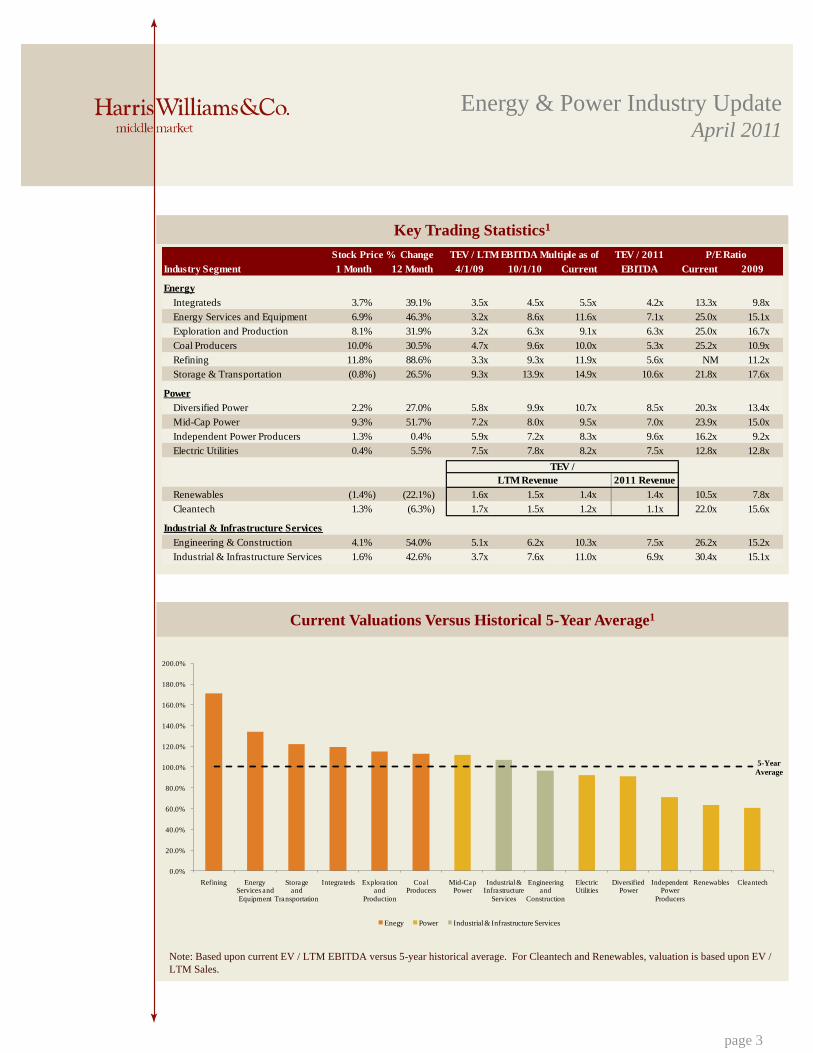
Key Trading Statistics1
Current Valuations Versus Historical 5-Year Average1
Note: Based upon current EV / LTM EBITDA versus 5-year historical average. For Cleantech and Renewables, valuation is based upon EV /
LTM Sales.
5-Year
Average
0.0%
20.0%
40.0%
60.0%
80.0%
100.0%
120.0%
140.0%
160.0%
180.0%
200.0%
Refining Energy Services and
Equipment
Storage and
Transportation
Integrateds Exploration and
Production
Coal Producers
Mid-Cap Power
Industrial & Infrastructure
Services
Engineering and
Construction
Electric Utilities
Diversified Power
Independent Power
Producers
Renewables Cleantech
page 3
0.0%
20.0%
40.0%
60.0%
80.0%
100.0%
120.0%
140.0%
160.0%
180.0%
200.0%
Enegy Power Industrial & Infrastructure Services
Enegy Power Industrial & Infrastructure Services
Stock Price % Change TEV / 2011 P/E Ratio
Industry Segment 1 Month 12 Month 4/1/09 10/1/10 Current EBITDA Current 2009
Energy
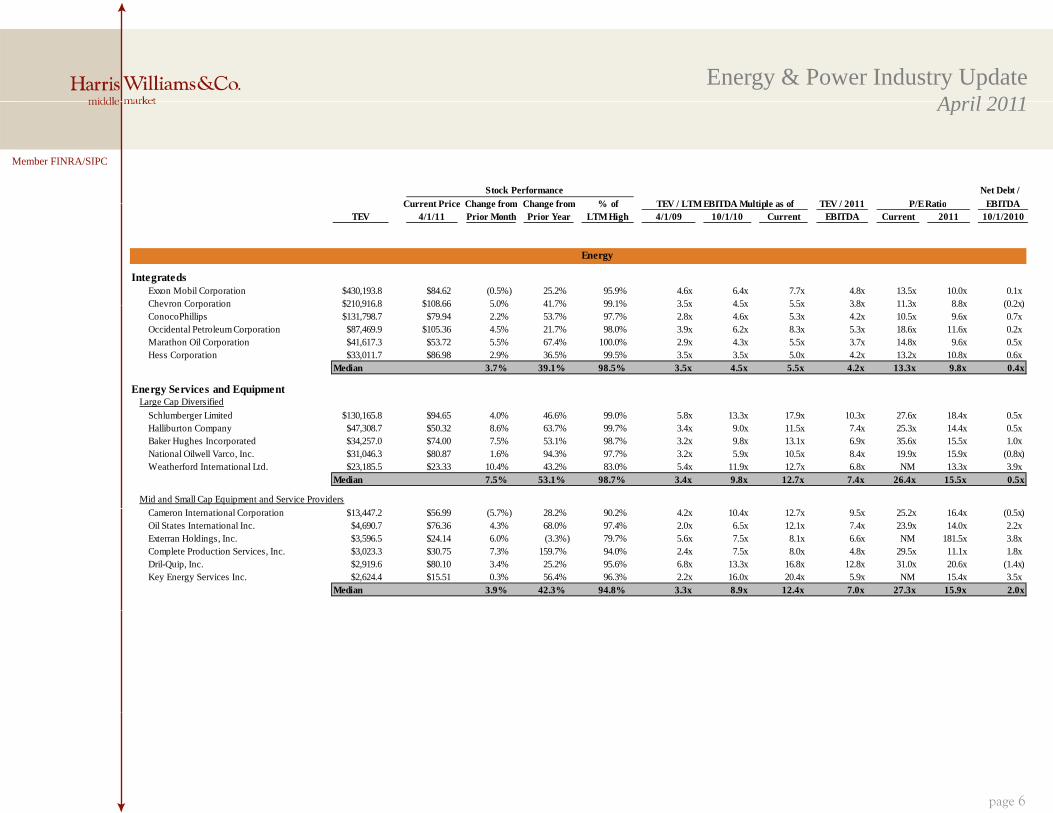
Integrateds 3.7% 39.1% 3.5x 4.5x 5.5x 4.2x 13.3x 9.8x
Energy Services and Equipment 6.9% 46.3% 3.2x 8.6x 11.6x 7.1x 25.0x 15.1x
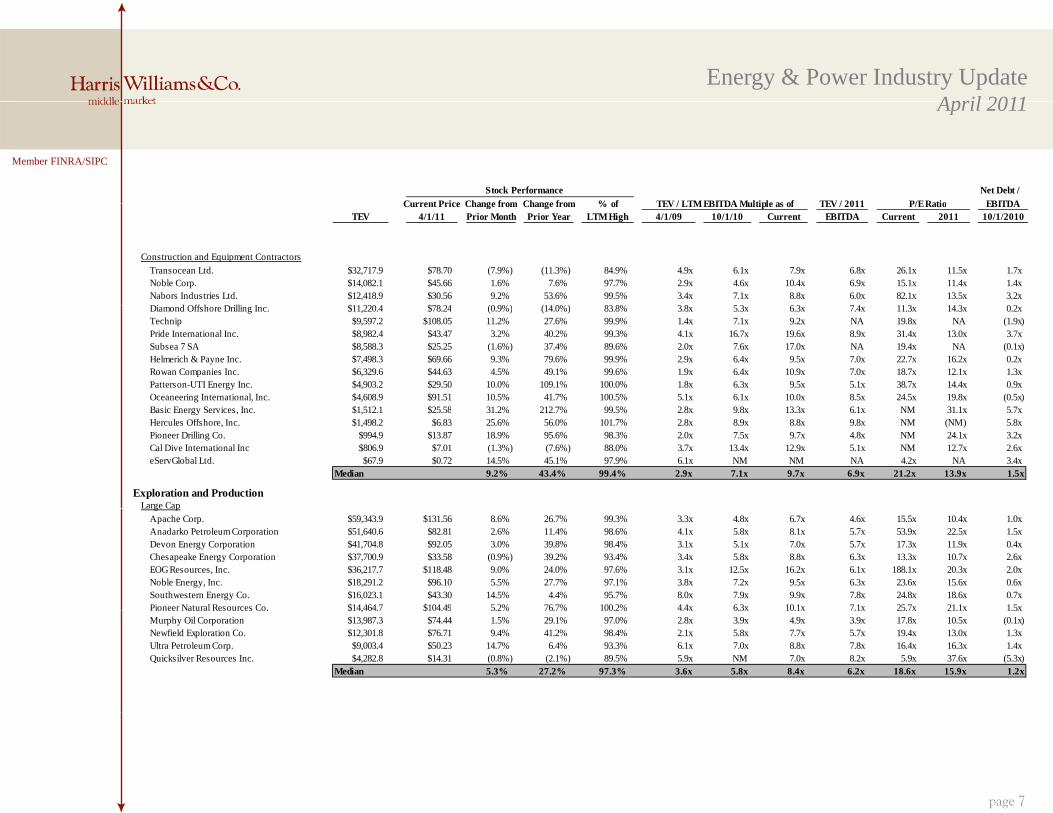
Exploration and Production 8.1% 31.9% 3.2x 6.3x 9.1x 6.3x 25.0x 16.7x
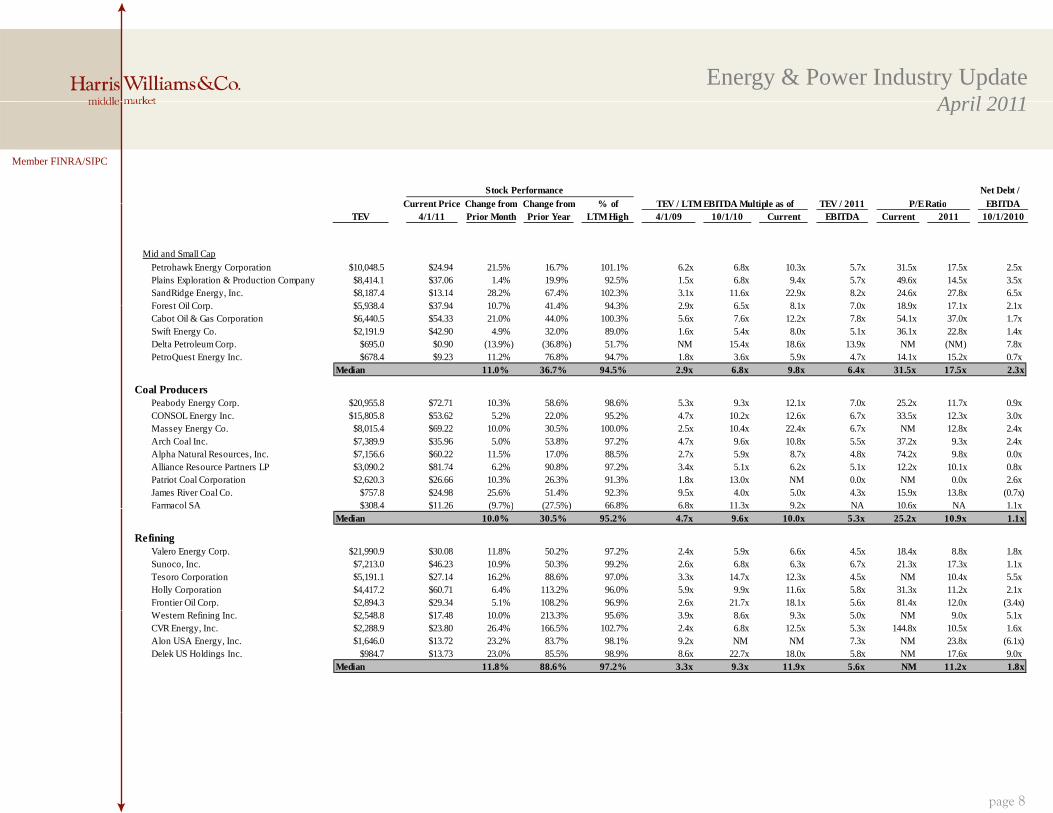
Coal Producers 10.0% 30.5% 4.7x 9.6x 10.0x 5.3x 25.2x 10.9x
Refining 11.8% 88.6% 3.3x 9.3x 11.9x 5.6x NM 11.2x
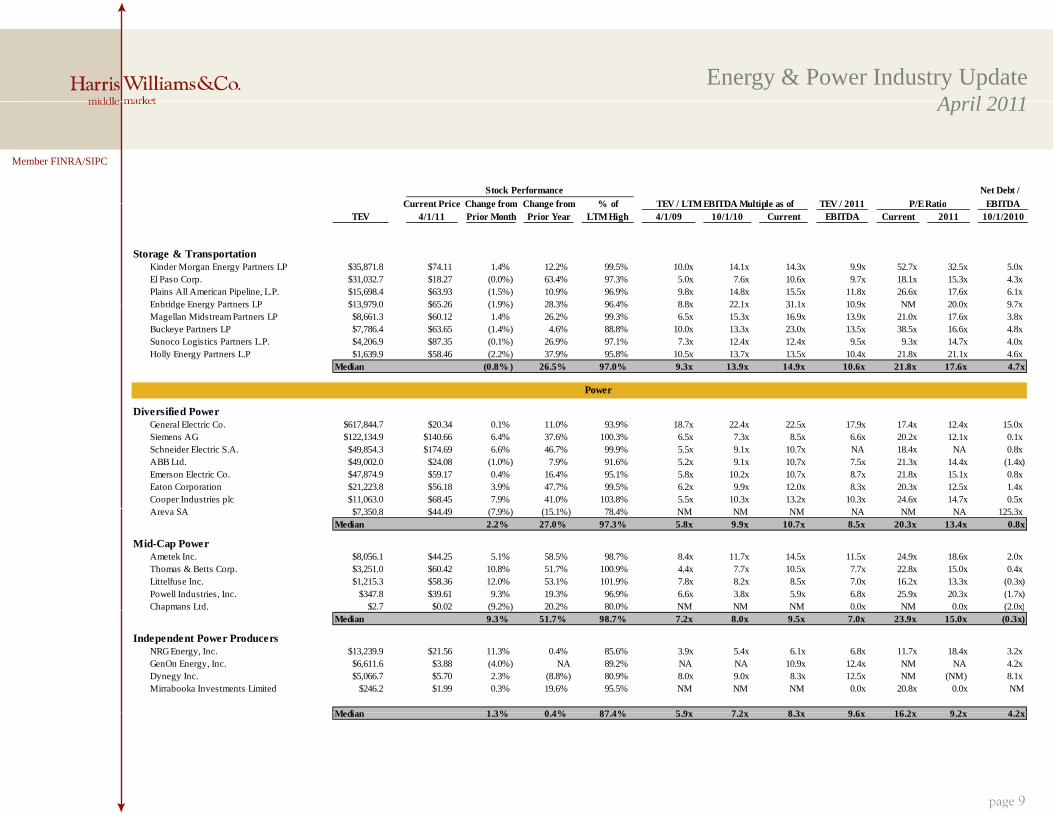
Storage & Transportation (0.8%) 26.5% 9.3x 13.9x 14.9x 10.6x 21.8x 17.6x
Power
Diversified Power 2.2% 27.0% 5.8x 9.9x 10.7x 8.5x 20.3x 13.4x
Mid-Cap Power 9.3% 51.7% 7.2x 8.0x 9.5x 7.0x 23.9x 15.0x
Independent Power Producers 1.3% 0.4% 5.9x 7.2x 8.3x 9.6x 16.2x 9.2x
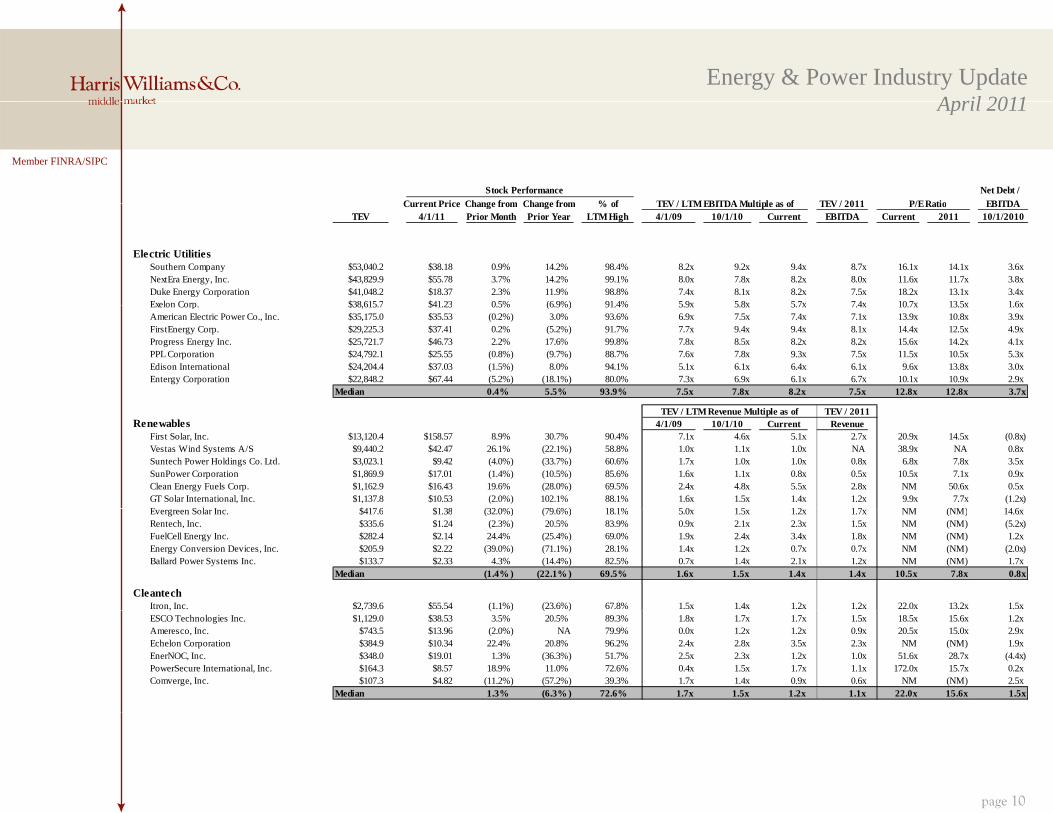
Electric Utilities 0.4% 5.5% 7.5x 7.8x 8.2x 7.5x 12.8x 12.8x
Renewables (1.4%) (22.1%) 1.6x 1.5x 1.4x 1.4x 10.5x 7.8x
Cleantech 1.3% (6.3%) 1.7x 1.5x 1.2x 1.1x 22.0x 15.6x
Industrial & Infrastructure Services
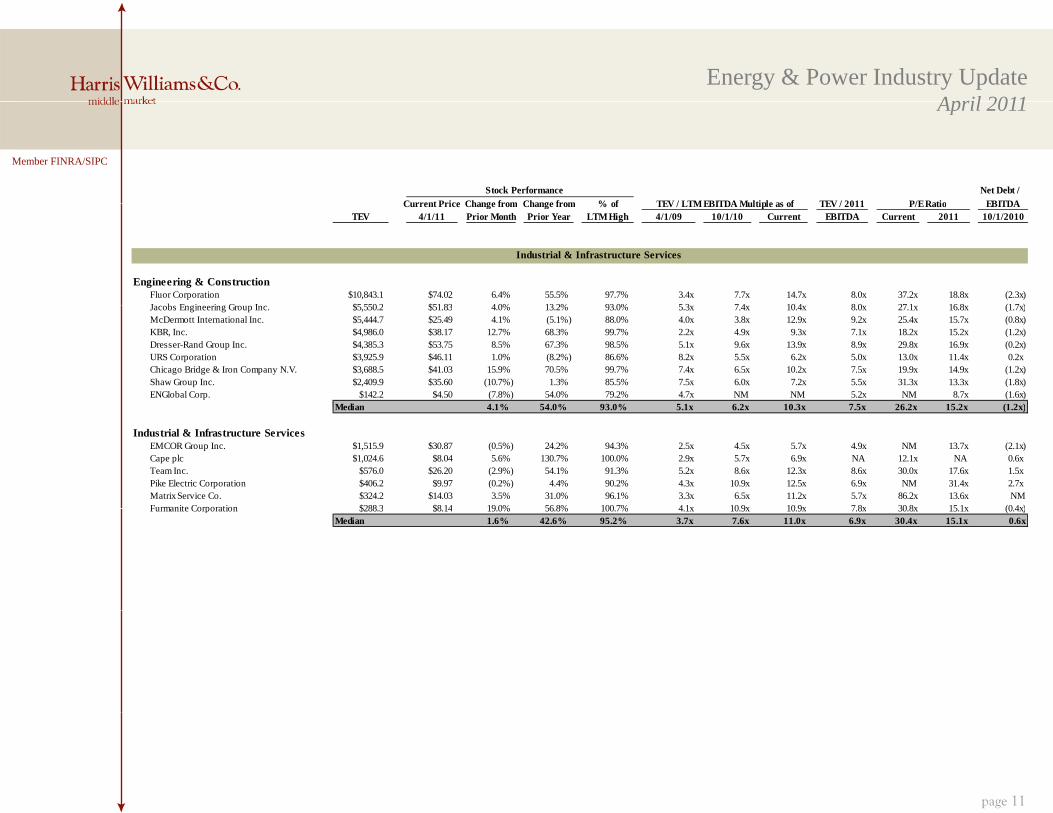
Engineering & Construction 4.1% 54.0% 5.1x 6.2x 10.3x 7.5x 26.2x 15.2x
Industrial & Infrastructure Services 1.6% 42.6% 3.7x 7.6x 11.0x 6.9x 30.4x 15.1x
2011 Revenue
TEV /
TEV / LTM EBITDA Multiple as of
LTM Revenue
Energy & Power Industry UpdateApril 2011
Gasoline and Ethanol1
Oil1 Natural Gas1
U.S. Rig Counts3
Electricity Prices1Coal1
0.00
20.00
40.00
60.00
80.00
100.00
120.00
Ap
r-1
0
Ma
y-1
0
Jun
-10
Jul-
10
Au
g-1
0
Sep
-10
Oct-
10
No
v-1
0
Dec-1
0
Jan
-11
Feb
-11
Ma
r-1
1
Ap
r-1
1
($ p
er b
bl)
0.00
1.00
2.00
3.00
4.00
5.00
6.00
Ap
r-1
0
Ma
y-1
0
Jun
-10
Jul-
10
Au
g-1
0
Sep
-10
Oct-
10
No
v-1
0
Dec-1
0
Jan
-11
Feb
-11
Ma
r-1
1
Ap
r-1
1
($ p
er M
MB
tu)
0.75
1.25
1.75
2.25
2.75
Ap
r-1
0
Ma
y-1
0
Jun
-10
Jul-
10
Au
g-1
0
Sep
-10
Oct-
10
No
v-1
0
Dec-1
0
Jan
-11
Feb
-11
Ma
r-1
1
Ap
r-1
1
($ p
er g
all
on
)
Gasoline Ethanol
800
1,300
1,800
2,300
2,800
Feb
-10
Ma
r-1
0
Ap
r-1
0
Ma
y-1
0
Jun
-10
Jul-
10
Au
g-1
0
Sep
-10
Oct-
10
No
v-1
0
Dec-1
0
Jan
-11
Feb
-11
Ma
r-1
1
(# r
igs)
0.0
40.0
80.0
120.0
160.0
0.0
20.0
40.0
60.0
80.0
Ap
r-1
0
Ma
y-1
0
Jun
-10
Jul-
10
Au
g-1
0
Sep
-10
Oct-
10
No
v-1
0
Dec-1
0
Jan
-11
Feb
-11
Ma
r-1
1
Ap
r-1
1 ($ p
er t
on
-R
ott
erd
am
)
($ p
er t
on
-C
en
tra
l
Ap
pa
lach
ian
)
Central Appalachian Rotterdam
0.00
20.00
40.00
60.00
80.00
100.00
Ap
r-1
0
Ma
y-1
0
Jun
-10
Jul-
10
Au
g-1
0
Sep
-10
Oct-
10
No
v-1
0
Dec-1
0
Jan
-11
Feb
-11
Ma
r-1
1
Ap
r-1
1
($ p
er M
Wg
)
$107.24 per bbl
$46.22 per MWg
page 4
$4.39 per MMBtu
$2.62 per gallon
$3.11 per gallon
$77.88 per ton
$127.40 per ton
2,287 rigs
Energy & Power Industry UpdateApril 2011
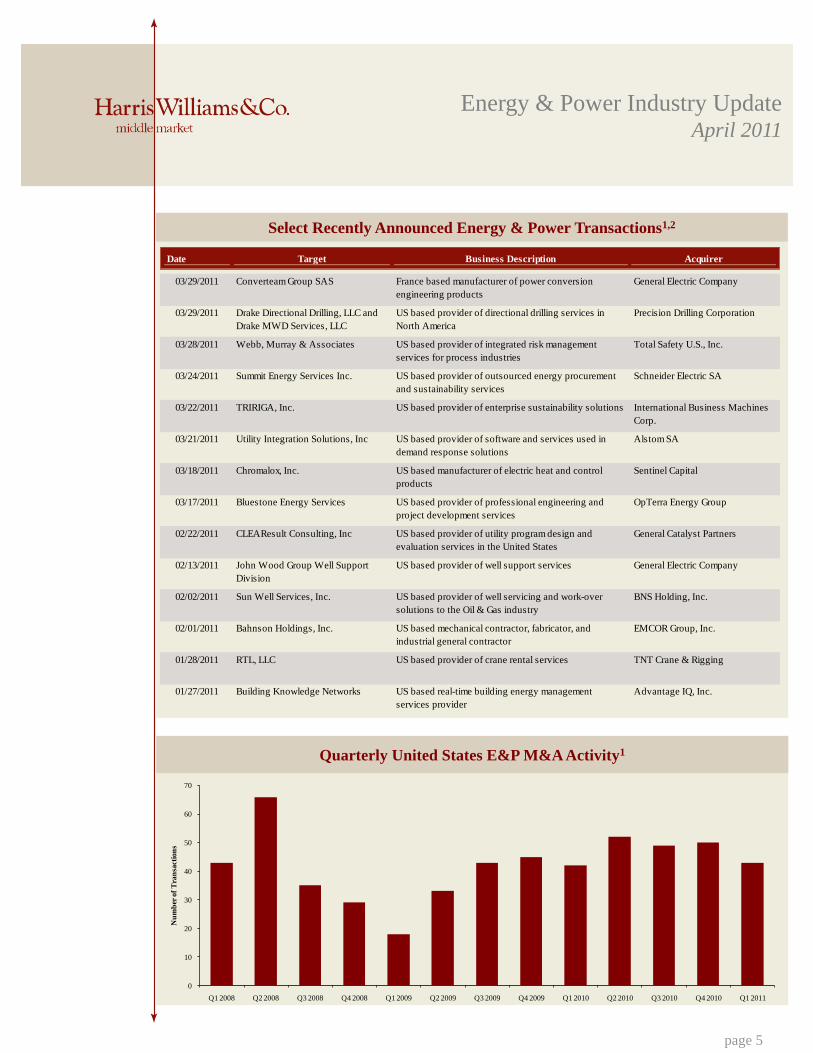
Quarterly United States E&P M&A Activity1
Select Recently Announced Energy & Power Transactions1,2
page 5
0
10
20
30
40
50
60
70
Q1 2008 Q2 2008 Q3 2008 Q4 2008 Q1 2009 Q2 2009 Q3 2009 Q4 2009 Q1 2010 Q2 2010 Q3 2010 Q4 2010 Q1 2011
Nu
mb
er o
f T
ran
sact
ion
s
Date Target Business Description Acquirer
03/29/2011 Converteam Group SAS France based manufacturer of power conversion
engineering products
General Electric Company
03/29/2011 Drake Directional Drilling, LLC and
Drake MWD Services, LLC
US based provider of directional drilling services in
North America
Precision Drilling Corporation
03/28/2011 Webb, Murray & Associates US based provider of integrated risk management
services for process industries
Total Safety U.S., Inc.
03/24/2011 Summit Energy Services Inc. US based provider of outsourced energy procurement
and sustainability services
Schneider Electric SA
03/22/2011 TRIRIGA, Inc. US based provider of enterprise sustainability solutions International Business Machines
Corp.
03/21/2011 Utility Integration Solutions, Inc US based provider of software and services used in
demand response solutions
Alstom SA
03/18/2011 Chromalox, Inc. US based manufacturer of electric heat and control
products
Sentinel Capital
03/17/2011 Bluestone Energy Services US based provider of professional engineering and
project development services
OpTerra Energy Group
02/22/2011 CLEAResult Consulting, Inc US based provider of utility program design and
evaluation services in the United States
General Catalyst Partners
02/13/2011 John Wood Group Well Support
Division
US based provider of well support services General Electric Company
02/02/2011 Sun Well Services, Inc. US based provider of well servicing and work-over
solutions to the Oil & Gas industry
BNS Holding, Inc.
02/01/2011 Bahnson Holdings, Inc. US based mechanical contractor, fabricator, and
industrial general contractor
EMCOR Group, Inc.
01/28/2011 RTL, LLC US based provider of crane rental services TNT Crane & Rigging
01/27/2011 Building Knowledge Networks US based real-time building energy management
services provider
Advantage IQ, Inc.
Energy & Power Industry UpdateApril 2011
Member FINRA/SIPC
April 2011
Stock Performance Net Debt / Current Price Change from Change from % of TEV / 2011 P/ERatio EBITDATEV / LTM EBITDA Multiple as of
Energy
IntegratedsExxon Mobil Corporation $430,193.8 $84.62 (0.5%) 25.2% 95.9% 4.6x 6.4x 7.7x 4.8x 13.5x 10.0x 0.1xChevron Corporation $210 916 8 $108 66 5 0% 41 7% 99 1% 3 5x 4 5x 5 5x 3 8x 11 3x 8 8x (0 2x)
Current Price Change from Change from % of TEV / 2011 P/E Ratio EBITDATEV 4/1/11 Prior Month Prior Year LTM High 4/1/09 10/1/10 Current EBITDA Current 2011 10/1/2010
TEV / LTM EBITDA Multiple as of
Chevron Corporation $210,916.8 $108.66 5.0% 41.7% 99.1% 3.5x 4.5x 5.5x 3.8x 11.3x 8.8x (0.2x)ConocoPhillips $131,798.7 $79.94 2.2% 53.7% 97.7% 2.8x 4.6x 5.3x 4.2x 10.5x 9.6x 0.7xOccidental Petroleum Corporation $87,469.9 $105.36 4.5% 21.7% 98.0% 3.9x 6.2x 8.3x 5.3x 18.6x 11.6x 0.2xMarathon Oil Corporation $41,617.3 $53.72 5.5% 67.4% 100.0% 2.9x 4.3x 5.5x 3.7x 14.8x 9.6x 0.5xHess Corporation $33,011.7 $86.98 2.9% 36.5% 99.5% 3.5x 3.5x 5.0x 4.2x 13.2x 10.8x 0.6x
Median 3.7% 39.1% 98.5% 3.5x 4.5x 5.5x 4.2x 13.3x 9.8x 0.4x
Energy Services and EquipmentLarge Cap Diversifiedg p
Schlumberger Limited $130,165.8 $94.65 4.0% 46.6% 99.0% 5.8x 13.3x 17.9x 10.3x 27.6x 18.4x 0.5xHalliburton Company $47,308.7 $50.32 8.6% 63.7% 99.7% 3.4x 9.0x 11.5x 7.4x 25.3x 14.4x 0.5xBaker Hughes Incorporated $34,257.0 $74.00 7.5% 53.1% 98.7% 3.2x 9.8x 13.1x 6.9x 35.6x 15.5x 1.0xNational Oilwell Varco, Inc. $31,046.3 $80.87 1.6% 94.3% 97.7% 3.2x 5.9x 10.5x 8.4x 19.9x 15.9x (0.8x)Weatherford International Ltd. $23,185.5 $23.33 10.4% 43.2% 83.0% 5.4x 11.9x 12.7x 6.8x NM 13.3x 3.9x
Median 7.5% 53.1% 98.7% 3.4x 9.8x 12.7x 7.4x 26.4x 15.5x 0.5x
Mid and Small Cap Equipment and Service ProvidersCameron International Corporation $13,447.2 $56.99 (5.7%) 28.2% 90.2% 4.2x 10.4x 12.7x 9.5x 25.2x 16.4x (0.5x)Oil States International Inc. $4,690.7 $76.36 4.3% 68.0% 97.4% 2.0x 6.5x 12.1x 7.4x 23.9x 14.0x 2.2xExterran Holdings, Inc. $3,596.5 $24.14 6.0% (3.3%) 79.7% 5.6x 7.5x 8.1x 6.6x NM 181.5x 3.8xComplete Production Services, Inc. $3,023.3 $30.75 7.3% 159.7% 94.0% 2.4x 7.5x 8.0x 4.8x 29.5x 11.1x 1.8xDril-Quip, Inc. $2,919.6 $80.10 3.4% 25.2% 95.6% 6.8x 13.3x 16.8x 12.8x 31.0x 20.6x (1.4x)Key Energy Services Inc. $2,624.4 $15.51 0.3% 56.4% 96.3% 2.2x 16.0x 20.4x 5.9x NM 15.4x 3.5x
Median 3.9% 42.3% 94.8% 3.3x 8.9x 12.4x 7.0x 27.3x 15.9x 2.0x
page 6
Energy & Power Industry UpdateApril 2011
Member FINRA/SIPC
April 2011
Stock Performance Net Debt / Current Price Change from Change from % of TEV / 2011 P/ERatio EBITDATEV / LTM EBITDA Multiple as of
Construction and Equipment ContractorsTransocean Ltd. $32,717.9 $78.70 (7.9%) (11.3%) 84.9% 4.9x 6.1x 7.9x 6.8x 26.1x 11.5x 1.7xNoble Corp. $14,082.1 $45.66 1.6% 7.6% 97.7% 2.9x 4.6x 10.4x 6.9x 15.1x 11.4x 1.4xNabors Industries Ltd. $12,418.9 $30.56 9.2% 53.6% 99.5% 3.4x 7.1x 8.8x 6.0x 82.1x 13.5x 3.2xDi d Off h D illi I $11 220 4 $78 24 (0 9%) (14 0%) 83 8% 3 8 5 3 6 3 7 4 11 3 14 3 0 2
Current Price Change from Change from % of TEV / 2011 P/E Ratio EBITDATEV 4/1/11 Prior Month Prior Year LTM High 4/1/09 10/1/10 Current EBITDA Current 2011 10/1/2010
TEV / LTM EBITDA Multiple as of
Diamond Offshore Drilling Inc. $11,220.4 $78.24 (0.9%) (14.0%) 83.8% 3.8x 5.3x 6.3x 7.4x 11.3x 14.3x 0.2xTechnip $9,597.2 $108.05 11.2% 27.6% 99.9% 1.4x 7.1x 9.2x NA 19.8x NA (1.9x)Pride International Inc. $8,982.4 $43.47 3.2% 40.2% 99.3% 4.1x 16.7x 19.6x 8.9x 31.4x 13.0x 3.7xSubsea 7 SA $8,588.3 $25.25 (1.6%) 37.4% 89.6% 2.0x 7.6x 17.0x NA 19.4x NA (0.1x)Helmerich & Payne Inc. $7,498.3 $69.66 9.3% 79.6% 99.9% 2.9x 6.4x 9.5x 7.0x 22.7x 16.2x 0.2xRowan Companies Inc. $6,329.6 $44.63 4.5% 49.1% 99.6% 1.9x 6.4x 10.9x 7.0x 18.7x 12.1x 1.3xPatterson-UTI Energy Inc. $4,903.2 $29.50 10.0% 109.1% 100.0% 1.8x 6.3x 9.5x 5.1x 38.7x 14.4x 0.9xOceaneering International, Inc. $4,608.9 $91.51 10.5% 41.7% 100.5% 5.1x 6.1x 10.0x 8.5x 24.5x 19.8x (0.5x)B i E S i I $1 512 1 $25 58 31 2% 212 7% 99 5% 2 8 9 8 13 3 6 1 NM 31 1 5 7Basic Energy Services, Inc. $1,512.1 $25.58 31.2% 212.7% 99.5% 2.8x 9.8x 13.3x 6.1x NM 31.1x 5.7xHercules Offshore, Inc. $1,498.2 $6.83 25.6% 56.0% 101.7% 2.8x 8.9x 8.8x 9.8x NM (NM) 5.8xPioneer Drilling Co. $994.9 $13.87 18.9% 95.6% 98.3% 2.0x 7.5x 9.7x 4.8x NM 24.1x 3.2xCal Dive International Inc $806.9 $7.01 (1.3%) (7.6%) 88.0% 3.7x 13.4x 12.9x 5.1x NM 12.7x 2.6xeServGlobal Ltd. $67.9 $0.72 14.5% 45.1% 97.9% 6.1x NM NM NA 4.2x NA 3.4x
Median 9.2% 43.4% 99.4% 2.9x 7.1x 9.7x 6.9x 21.2x 13.9x 1.5x
Exploration and ProductionLarge Capg p
Apache Corp. $59,343.9 $131.56 8.6% 26.7% 99.3% 3.3x 4.8x 6.7x 4.6x 15.5x 10.4x 1.0xAnadarko Petroleum Corporation $51,640.6 $82.81 2.6% 11.4% 98.6% 4.1x 5.8x 8.1x 5.7x 53.9x 22.5x 1.5xDevon Energy Corporation $41,704.8 $92.05 3.0% 39.8% 98.4% 3.1x 5.1x 7.0x 5.7x 17.3x 11.9x 0.4xChesapeake Energy Corporation $37,700.9 $33.58 (0.9%) 39.2% 93.4% 3.4x 5.8x 8.8x 6.3x 13.3x 10.7x 2.6xEOG Resources, Inc. $36,217.7 $118.48 9.0% 24.0% 97.6% 3.1x 12.5x 16.2x 6.1x 188.1x 20.3x 2.0xNoble Energy, Inc. $18,291.2 $96.10 5.5% 27.7% 97.1% 3.8x 7.2x 9.5x 6.3x 23.6x 15.6x 0.6xSouthwestern Energy Co. $16,023.1 $43.30 14.5% 4.4% 95.7% 8.0x 7.9x 9.9x 7.8x 24.8x 18.6x 0.7xPioneer Natural Resources Co. $14,464.7 $104.49 5.2% 76.7% 100.2% 4.4x 6.3x 10.1x 7.1x 25.7x 21.1x 1.5xPioneer Natural Resources Co. $14,464.7 $104.49 5.2% 76.7% 100.2% 4.4x 6.3x 10.1x 7.1x 25.7x 21.1x 1.5xMurphy Oil Corporation $13,987.3 $74.44 1.5% 29.1% 97.0% 2.8x 3.9x 4.9x 3.9x 17.8x 10.5x (0.1x)Newfield Exploration Co. $12,301.8 $76.71 9.4% 41.2% 98.4% 2.1x 5.8x 7.7x 5.7x 19.4x 13.0x 1.3xUltra Petroleum Corp. $9,003.4 $50.23 14.7% 6.4% 93.3% 6.1x 7.0x 8.8x 7.8x 16.4x 16.3x 1.4xQuicksilver Resources Inc. $4,282.8 $14.31 (0.8%) (2.1%) 89.5% 5.9x NM 7.0x 8.2x 5.9x 37.6x (5.3x)
Median 5.3% 27.2% 97.3% 3.6x 5.8x 8.4x 6.2x 18.6x 15.9x 1.2x
page 7
Energy & Power Industry UpdateApril 2011
Member FINRA/SIPC
April 2011
Stock Performance Net Debt / Current Price Change from Change from % of TEV / 2011 P/ERatio EBITDATEV / LTM EBITDA Multiple as of
Mid and Small CapPetrohawk Energy Corporation $10,048.5 $24.94 21.5% 16.7% 101.1% 6.2x 6.8x 10.3x 5.7x 31.5x 17.5x 2.5xPlains Exploration & Production Company $8,414.1 $37.06 1.4% 19.9% 92.5% 1.5x 6.8x 9.4x 5.7x 49.6x 14.5x 3.5xSandRidge Energy, Inc. $8,187.4 $13.14 28.2% 67.4% 102.3% 3.1x 11.6x 22.9x 8.2x 24.6x 27.8x 6.5xForest Oil Corp $5 938 4 $37 94 10 7% 41 4% 94 3% 2 9x 6 5x 8 1x 7 0x 18 9x 17 1x 2 1x
Current Price Change from Change from % of TEV / 2011 P/E Ratio EBITDATEV 4/1/11 Prior Month Prior Year LTM High 4/1/09 10/1/10 Current EBITDA Current 2011 10/1/2010
TEV / LTM EBITDA Multiple as of
Forest Oil Corp. $5,938.4 $37.94 10.7% 41.4% 94.3% 2.9x 6.5x 8.1x 7.0x 18.9x 17.1x 2.1xCabot Oil & Gas Corporation $6,440.5 $54.33 21.0% 44.0% 100.3% 5.6x 7.6x 12.2x 7.8x 54.1x 37.0x 1.7xSwift Energy Co. $2,191.9 $42.90 4.9% 32.0% 89.0% 1.6x 5.4x 8.0x 5.1x 36.1x 22.8x 1.4xDelta Petroleum Corp. $695.0 $0.90 (13.9%) (36.8%) 51.7% NM 15.4x 18.6x 13.9x NM (NM) 7.8xPetroQuest Energy Inc. $678.4 $9.23 11.2% 76.8% 94.7% 1.8x 3.6x 5.9x 4.7x 14.1x 15.2x 0.7x
Median 11.0% 36.7% 94.5% 2.9x 6.8x 9.8x 6.4x 31.5x 17.5x 2.3x
Coal ProducersPeabody Energy Corp. $20,955.8 $72.71 10.3% 58.6% 98.6% 5.3x 9.3x 12.1x 7.0x 25.2x 11.7x 0.9xy gy p ,CONSOL Energy Inc. $15,805.8 $53.62 5.2% 22.0% 95.2% 4.7x 10.2x 12.6x 6.7x 33.5x 12.3x 3.0xMassey Energy Co. $8,015.4 $69.22 10.0% 30.5% 100.0% 2.5x 10.4x 22.4x 6.7x NM 12.8x 2.4xArch Coal Inc. $7,389.9 $35.96 5.0% 53.8% 97.2% 4.7x 9.6x 10.8x 5.5x 37.2x 9.3x 2.4xAlpha Natural Resources, Inc. $7,156.6 $60.22 11.5% 17.0% 88.5% 2.7x 5.9x 8.7x 4.8x 74.2x 9.8x 0.0xAlliance Resource Partners LP $3,090.2 $81.74 6.2% 90.8% 97.2% 3.4x 5.1x 6.2x 5.1x 12.2x 10.1x 0.8xPatriot Coal Corporation $2,620.3 $26.66 10.3% 26.3% 91.3% 1.8x 13.0x NM 0.0x NM 0.0x 2.6xJames River Coal Co. $757.8 $24.98 25.6% 51.4% 92.3% 9.5x 4.0x 5.0x 4.3x 15.9x 13.8x (0.7x)Farmacol SA $308.4 $11.26 (9.7%) (27.5%) 66.8% 6.8x 11.3x 9.2x NA 10.6x NA 1.1x$ $ ( %) ( %) %
Median 10.0% 30.5% 95.2% 4.7x 9.6x 10.0x 5.3x 25.2x 10.9x 1.1x
RefiningValero Energy Corp. $21,990.9 $30.08 11.8% 50.2% 97.2% 2.4x 5.9x 6.6x 4.5x 18.4x 8.8x 1.8xSunoco, Inc. $7,213.0 $46.23 10.9% 50.3% 99.2% 2.6x 6.8x 6.3x 6.7x 21.3x 17.3x 1.1xTesoro Corporation $5,191.1 $27.14 16.2% 88.6% 97.0% 3.3x 14.7x 12.3x 4.5x NM 10.4x 5.5xHolly Corporation $4,417.2 $60.71 6.4% 113.2% 96.0% 5.9x 9.9x 11.6x 5.8x 31.3x 11.2x 2.1xFrontier Oil Corp. $2,894.3 $29.34 5.1% 108.2% 96.9% 2.6x 21.7x 18.1x 5.6x 81.4x 12.0x (3.4x)Western Refining Inc. $2,548.8 $17.48 10.0% 213.3% 95.6% 3.9x 8.6x 9.3x 5.0x NM 9.0x 5.1xCVR Energy, Inc. $2,288.9 $23.80 26.4% 166.5% 102.7% 2.4x 6.8x 12.5x 5.3x 144.8x 10.5x 1.6xAlon USA Energy, Inc. $1,646.0 $13.72 23.2% 83.7% 98.1% 9.2x NM NM 7.3x NM 23.8x (6.1x)Delek US Holdings Inc. $984.7 $13.73 23.0% 85.5% 98.9% 8.6x 22.7x 18.0x 5.8x NM 17.6x 9.0x
Median 11.8% 88.6% 97.2% 3.3x 9.3x 11.9x 5.6x NM 11.2x 1.8x
page 8
Energy & Power Industry UpdateApril 2011
Member FINRA/SIPC
April 2011
Stock Performance Net Debt / Current Price Change from Change from % of TEV / 2011 P/ERatio EBITDATEV / LTM EBITDA Multiple as ofCurrent Price Change from Change from % of TEV / 2011 P/E Ratio EBITDA
TEV 4/1/11 Prior Month Prior Year LTM High 4/1/09 10/1/10 Current EBITDA Current 2011 10/1/2010TEV / LTM EBITDA Multiple as of
Storage & TransportationKinder Morgan Energy Partners LP $35,871.8 $74.11 1.4% 12.2% 99.5% 10.0x 14.1x 14.3x 9.9x 52.7x 32.5x 5.0xEl Paso Corp. $31,032.7 $18.27 (0.0%) 63.4% 97.3% 5.0x 7.6x 10.6x 9.7x 18.1x 15.3x 4.3xPlains All American Pipeline, L.P. $15,698.4 $63.93 (1.5%) 10.9% 96.9% 9.8x 14.8x 15.5x 11.8x 26.6x 17.6x 6.1xEnbridge Energy Partners LP $13 979 0 $65 26 (1 9%) 28 3% 96 4% 8 8x 22 1x 31 1x 10 9x NM 20 0x 9 7xEnbridge Energy Partners LP $13,979.0 $65.26 (1.9%) 28.3% 96.4% 8.8x 22.1x 31.1x 10.9x NM 20.0x 9.7xMagellan Midstream Partners LP $8,661.3 $60.12 1.4% 26.2% 99.3% 6.5x 15.3x 16.9x 13.9x 21.0x 17.6x 3.8xBuckeye Partners LP $7,786.4 $63.65 (1.4%) 4.6% 88.8% 10.0x 13.3x 23.0x 13.5x 38.5x 16.6x 4.8xSunoco Logistics Partners L.P. $4,206.9 $87.35 (0.1%) 26.9% 97.1% 7.3x 12.4x 12.4x 9.5x 9.3x 14.7x 4.0xHolly Energy Partners L.P $1,639.9 $58.46 (2.2%) 37.9% 95.8% 10.5x 13.7x 13.5x 10.4x 21.8x 21.1x 4.6x
Median (0.8% ) 26.5% 97.0% 9.3x 13.9x 14.9x 10.6x 21.8x 17.6x 4.7x
Power
Diversified PowerGeneral Electric Co. $617,844.7 $20.34 0.1% 11.0% 93.9% 18.7x 22.4x 22.5x 17.9x 17.4x 12.4x 15.0xSiemens AG $122,134.9 $140.66 6.4% 37.6% 100.3% 6.5x 7.3x 8.5x 6.6x 20.2x 12.1x 0.1xSchneider Electric S.A. $49,854.3 $174.69 6.6% 46.7% 99.9% 5.5x 9.1x 10.7x NA 18.4x NA 0.8xABB Ltd. $49,002.0 $24.08 (1.0%) 7.9% 91.6% 5.2x 9.1x 10.7x 7.5x 21.3x 14.4x (1.4x)Emerson Electric Co. $47,874.9 $59.17 0.4% 16.4% 95.1% 5.8x 10.2x 10.7x 8.7x 21.8x 15.1x 0.8xEaton Corporation $21,223.8 $56.18 3.9% 47.7% 99.5% 6.2x 9.9x 12.0x 8.3x 20.3x 12.5x 1.4xCooper Industries plc $11,063.0 $68.45 7.9% 41.0% 103.8% 5.5x 10.3x 13.2x 10.3x 24.6x 14.7x 0.5xA SA $7 350 8 $44 49 (7 9%) (15 1%) 78 4% NM NM NM NA NM NA 125 3Areva SA $7,350.8 $44.49 (7.9%) (15.1%) 78.4% NM NM NM NA NM NA 125.3x
Median 2.2% 27.0% 97.3% 5.8x 9.9x 10.7x 8.5x 20.3x 13.4x 0.8x
Mid-Cap PowerAmetek Inc. $8,056.1 $44.25 5.1% 58.5% 98.7% 8.4x 11.7x 14.5x 11.5x 24.9x 18.6x 2.0xThomas & Betts Corp. $3,251.0 $60.42 10.8% 51.7% 100.9% 4.4x 7.7x 10.5x 7.7x 22.8x 15.0x 0.4xLittelfuse Inc. $1,215.3 $58.36 12.0% 53.1% 101.9% 7.8x 8.2x 8.5x 7.0x 16.2x 13.3x (0.3x)Powell Industries, Inc. $347.8 $39.61 9.3% 19.3% 96.9% 6.6x 3.8x 5.9x 6.8x 25.9x 20.3x (1.7x)Chapmans Ltd. $2.7 $0.02 (9.2%) 20.2% 80.0% NM NM NM 0.0x NM 0.0x (2.0x)p ( ) ( )
Median 9.3% 51.7% 98.7% 7.2x 8.0x 9.5x 7.0x 23.9x 15.0x (0.3x)
Independent Power ProducersNRG Energy, Inc. $13,239.9 $21.56 11.3% 0.4% 85.6% 3.9x 5.4x 6.1x 6.8x 11.7x 18.4x 3.2xGenOn Energy, Inc. $6,611.6 $3.88 (4.0%) NA 89.2% NA NA 10.9x 12.4x NM NA 4.2xDynegy Inc. $5,066.7 $5.70 2.3% (8.8%) 80.9% 8.0x 9.0x 8.3x 12.5x NM (NM) 8.1xMirrabooka Investments Limited $246.2 $1.99 0.3% 19.6% 95.5% NM NM NM 0.0x 20.8x 0.0x NM
M di 1 3% 0 4% 87 4% 5 9 7 2 8 3 9 6 16 2 9 2 4 2
page 9
Median 1.3% 0.4% 87.4% 5.9x 7.2x 8.3x 9.6x 16.2x 9.2x 4.2x
Energy & Power Industry UpdateApril 2011
Member FINRA/SIPC
April 2011
Stock Performance Net Debt / Current Price Change from Change from % of TEV / 2011 P/ERatio EBITDATEV / LTM EBITDA Multiple as ofCurrent Price Change from Change from % of TEV / 2011 P/E Ratio EBITDA
TEV 4/1/11 Prior Month Prior Year LTM High 4/1/09 10/1/10 Current EBITDA Current 2011 10/1/2010TEV / LTM EBITDA Multiple as of
Electric UtilitiesSouthern Company $53,040.2 $38.18 0.9% 14.2% 98.4% 8.2x 9.2x 9.4x 8.7x 16.1x 14.1x 3.6xNextEra Energy, Inc. $43,829.9 $55.78 3.7% 14.2% 99.1% 8.0x 7.8x 8.2x 8.0x 11.6x 11.7x 3.8xDuke Energy Corporation $41,048.2 $18.37 2.3% 11.9% 98.8% 7.4x 8.1x 8.2x 7.5x 18.2x 13.1x 3.4xExelon Corp $38 615 7 $41 23 0 5% (6 9%) 91 4% 5 9x 5 8x 5 7x 7 4x 10 7x 13 5x 1 6xExelon Corp. $38,615.7 $41.23 0.5% (6.9%) 91.4% 5.9x 5.8x 5.7x 7.4x 10.7x 13.5x 1.6xAmerican Electric Power Co., Inc. $35,175.0 $35.53 (0.2%) 3.0% 93.6% 6.9x 7.5x 7.4x 7.1x 13.9x 10.8x 3.9xFirstEnergy Corp. $29,225.3 $37.41 0.2% (5.2%) 91.7% 7.7x 9.4x 9.4x 8.1x 14.4x 12.5x 4.9xProgress Energy Inc. $25,721.7 $46.73 2.2% 17.6% 99.8% 7.8x 8.5x 8.2x 8.2x 15.6x 14.2x 4.1xPPL Corporation $24,792.1 $25.55 (0.8%) (9.7%) 88.7% 7.6x 7.8x 9.3x 7.5x 11.5x 10.5x 5.3xEdison International $24,204.4 $37.03 (1.5%) 8.0% 94.1% 5.1x 6.1x 6.4x 6.1x 9.6x 13.8x 3.0xEntergy Corporation $22,848.2 $67.44 (5.2%) (18.1%) 80.0% 7.3x 6.9x 6.1x 6.7x 10.1x 10.9x 2.9x
Median 0.4% 5.5% 93.9% 7.5x 7.8x 8.2x 7.5x 12.8x 12.8x 3.7x
Renewables 4/1/09 10/1/10 CurrentFirst Solar, Inc. $13,120.4 $158.57 8.9% 30.7% 90.4% 7.1x 4.6x 5.1x 2.7x 20.9x 14.5x (0.8x)Vestas Wind Systems A/S $9,440.2 $42.47 26.1% (22.1%) 58.8% 1.0x 1.1x 1.0x NA 38.9x NA 0.8xSuntech Power Holdings Co. Ltd. $3,023.1 $9.42 (4.0%) (33.7%) 60.6% 1.7x 1.0x 1.0x 0.8x 6.8x 7.8x 3.5xSunPower Corporation $1,869.9 $17.01 (1.4%) (10.5%) 85.6% 1.6x 1.1x 0.8x 0.5x 10.5x 7.1x 0.9xClean Energy Fuels Corp. $1,162.9 $16.43 19.6% (28.0%) 69.5% 2.4x 4.8x 5.5x 2.8x NM 50.6x 0.5xGT Solar International, Inc. $1,137.8 $10.53 (2.0%) 102.1% 88.1% 1.6x 1.5x 1.4x 1.2x 9.9x 7.7x (1.2x)E S l I $417 6 $1 38 (32 0%) (79 6%) 18 1% 5 0 1 5 1 2 1 7 NM (NM) 14 6
RevenueTEV / LTM Revenue Multiple as of TEV / 2011
Evergreen Solar Inc. $417.6 $1.38 (32.0%) (79.6%) 18.1% 5.0x 1.5x 1.2x 1.7x NM (NM) 14.6xRentech, Inc. $335.6 $1.24 (2.3%) 20.5% 83.9% 0.9x 2.1x 2.3x 1.5x NM (NM) (5.2x)FuelCell Energy Inc. $282.4 $2.14 24.4% (25.4%) 69.0% 1.9x 2.4x 3.4x 1.8x NM (NM) 1.2xEnergy Conversion Devices, Inc. $205.9 $2.22 (39.0%) (71.1%) 28.1% 1.4x 1.2x 0.7x 0.7x NM (NM) (2.0x)Ballard Power Systems Inc. $133.7 $2.33 4.3% (14.4%) 82.5% 0.7x 1.4x 2.1x 1.2x NM (NM) 1.7x
Median (1.4% ) (22.1% ) 69.5% 1.6x 1.5x 1.4x 1.4x 10.5x 7.8x 0.8x
CleantechItron, Inc. $2,739.6 $55.54 (1.1%) (23.6%) 67.8% 1.5x 1.4x 1.2x 1.2x 22.0x 13.2x 1.5x, , ( ) ( )ESCO Technologies Inc. $1,129.0 $38.53 3.5% 20.5% 89.3% 1.8x 1.7x 1.7x 1.5x 18.5x 15.6x 1.2xAmeresco, Inc. $743.5 $13.96 (2.0%) NA 79.9% 0.0x 1.2x 1.2x 0.9x 20.5x 15.0x 2.9xEchelon Corporation $384.9 $10.34 22.4% 20.8% 96.2% 2.4x 2.8x 3.5x 2.3x NM (NM) 1.9xEnerNOC, Inc. $348.0 $19.01 1.3% (36.3%) 51.7% 2.5x 2.3x 1.2x 1.0x 51.6x 28.7x (4.4x)PowerSecure International, Inc. $164.3 $8.57 18.9% 11.0% 72.6% 0.4x 1.5x 1.7x 1.1x 172.0x 15.7x 0.2xComverge, Inc. $107.3 $4.82 (11.2%) (57.2%) 39.3% 1.7x 1.4x 0.9x 0.6x NM (NM) 2.5x
Median 1.3% (6.3% ) 72.6% 1.7x 1.5x 1.2x 1.1x 22.0x 15.6x 1.5x
page 10
Energy & Power Industry UpdateApril 2011
Member FINRA/SIPC
April 2011
Stock Performance Net Debt / Current Price Change from Change from % of TEV / 2011 P/ERatio EBITDATEV / LTM EBITDA Multiple as ofCurrent Price Change from Change from % of TEV / 2011 P/E Ratio EBITDA
TEV 4/1/11 Prior Month Prior Year LTM High 4/1/09 10/1/10 Current EBITDA Current 2011 10/1/2010TEV / LTM EBITDA Multiple as of
Industrial & Infrastructure Services
Engineering & ConstructionFluor Corporation $10,843.1 $74.02 6.4% 55.5% 97.7% 3.4x 7.7x 14.7x 8.0x 37.2x 18.8x (2.3x)J b E i i G I $5 550 2 $51 83 4 0% 13 2% 93 0% 5 3 7 4 10 4 8 0 27 1 16 8 (1 7 )Jacobs Engineering Group Inc. $5,550.2 $51.83 4.0% 13.2% 93.0% 5.3x 7.4x 10.4x 8.0x 27.1x 16.8x (1.7x)McDermott International Inc. $5,444.7 $25.49 4.1% (5.1%) 88.0% 4.0x 3.8x 12.9x 9.2x 25.4x 15.7x (0.8x)KBR, Inc. $4,986.0 $38.17 12.7% 68.3% 99.7% 2.2x 4.9x 9.3x 7.1x 18.2x 15.2x (1.2x)Dresser-Rand Group Inc. $4,385.3 $53.75 8.5% 67.3% 98.5% 5.1x 9.6x 13.9x 8.9x 29.8x 16.9x (0.2x)URS Corporation $3,925.9 $46.11 1.0% (8.2%) 86.6% 8.2x 5.5x 6.2x 5.0x 13.0x 11.4x 0.2xChicago Bridge & Iron Company N.V. $3,688.5 $41.03 15.9% 70.5% 99.7% 7.4x 6.5x 10.2x 7.5x 19.9x 14.9x (1.2x)Shaw Group Inc. $2,409.9 $35.60 (10.7%) 1.3% 85.5% 7.5x 6.0x 7.2x 5.5x 31.3x 13.3x (1.8x)ENGlobal Corp. $142.2 $4.50 (7.8%) 54.0% 79.2% 4.7x NM NM 5.2x NM 8.7x (1.6x)
Median 4 1% 54 0% 93 0% 5 1x 6 2x 10 3x 7 5x 26 2x 15 2x (1 2x)Median 4.1% 54.0% 93.0% 5.1x 6.2x 10.3x 7.5x 26.2x 15.2x (1.2x)
Industrial & Infrastructure ServicesEMCOR Group Inc. $1,515.9 $30.87 (0.5%) 24.2% 94.3% 2.5x 4.5x 5.7x 4.9x NM 13.7x (2.1x)Cape plc $1,024.6 $8.04 5.6% 130.7% 100.0% 2.9x 5.7x 6.9x NA 12.1x NA 0.6xTeam Inc. $576.0 $26.20 (2.9%) 54.1% 91.3% 5.2x 8.6x 12.3x 8.6x 30.0x 17.6x 1.5xPike Electric Corporation $406.2 $9.97 (0.2%) 4.4% 90.2% 4.3x 10.9x 12.5x 6.9x NM 31.4x 2.7xMatrix Service Co. $324.2 $14.03 3.5% 31.0% 96.1% 3.3x 6.5x 11.2x 5.7x 86.2x 13.6x NMFurmanite Corporation $288 3 $8 14 19 0% 56 8% 100 7% 4 1x 10 9x 10 9x 7 8x 30 8x 15 1x (0 4x)Furmanite Corporation $288.3 $8.14 19.0% 56.8% 100.7% 4.1x 10.9x 10.9x 7.8x 30.8x 15.1x (0.4x)
Median 1.6% 42.6% 95.2% 3.7x 7.6x 11.0x 6.9x 30.4x 15.1x 0.6x
page 11
Energy & Power Industry UpdateApril 2011
page 12
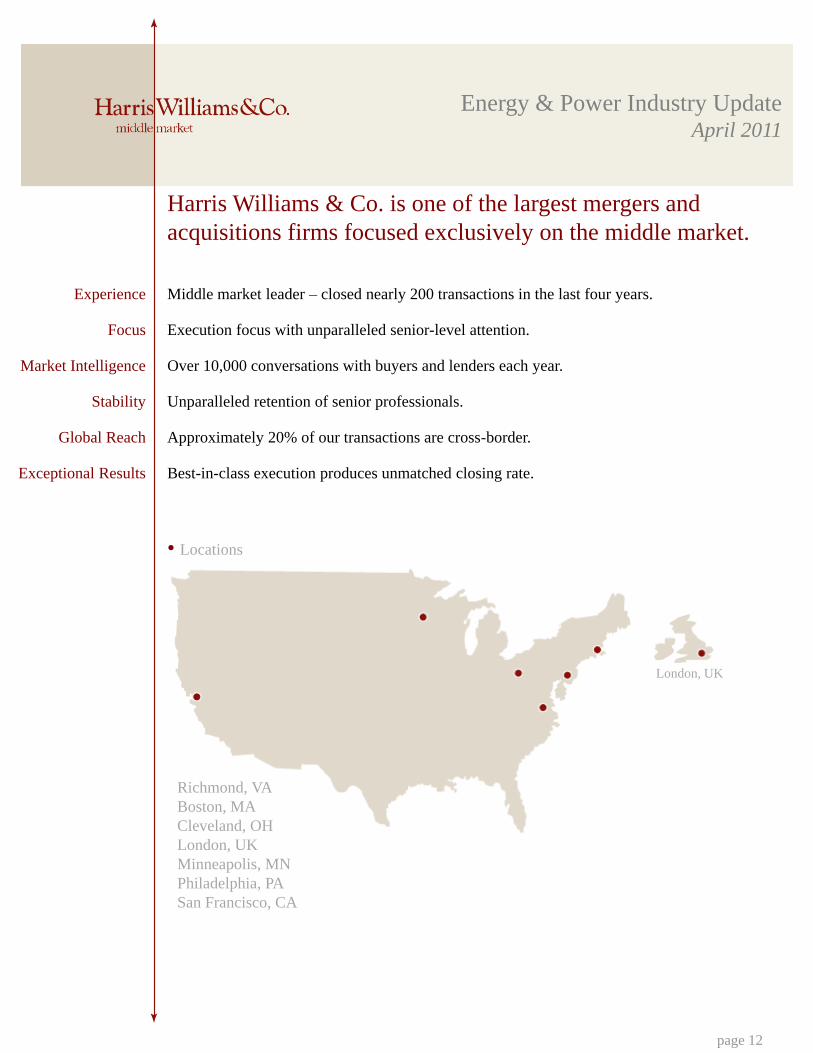
Harris Williams & Co. is one of the largest mergers and
acquisitions firms focused exclusively on the middle market.
Experience
Focus
Market Intelligence
Stability
Global Reach
Exceptional Results
Middle market leader – closed nearly 200 transactions in the last four years.
Execution focus with unparalleled senior-level attention.
Over 10,000 conversations with buyers and lenders each year.
Unparalleled retention of senior professionals.
Approximately 20% of our transactions are cross-border.
Best-in-class execution produces unmatched closing rate.
• Locations
London, UK
Richmond, VA
Boston, MA
Cleveland, OH
London, UK
Minneapolis, MN
Philadelphia, PA
San Francisco, CA
Energy & Power Industry UpdateApril 2011
page 13
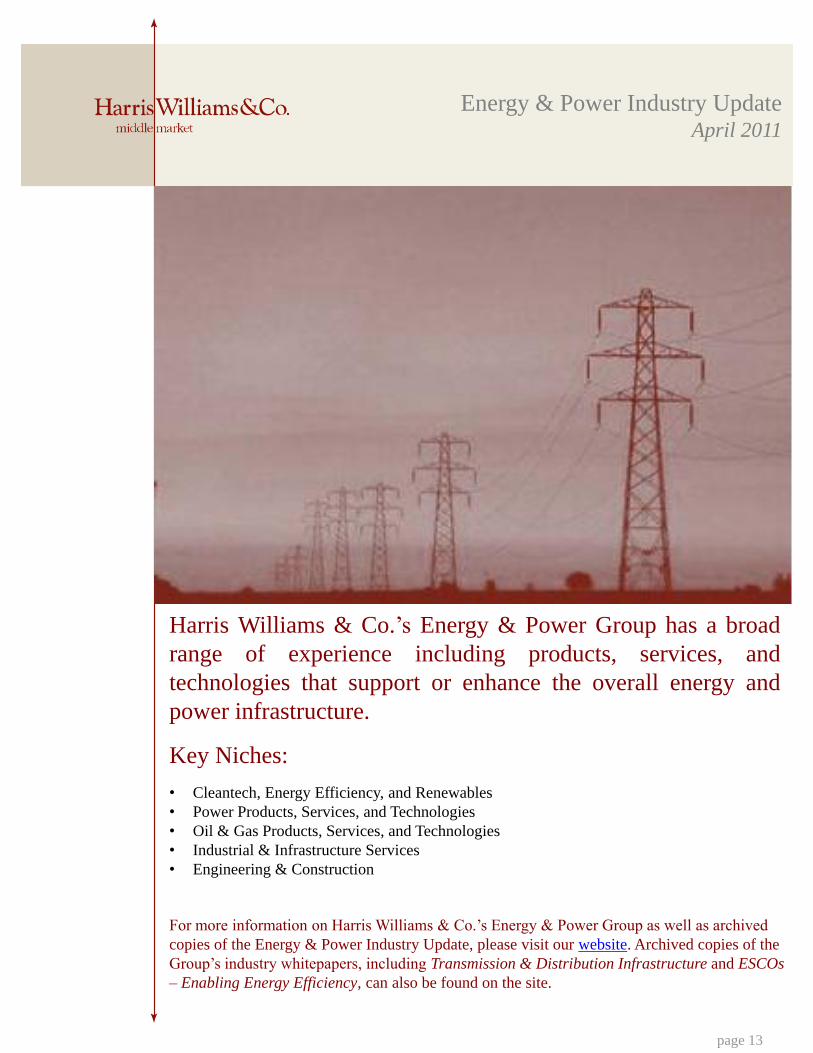
Harris Williams & Co.’s Energy & Power Group has a broad
range of experience including products, services, and
technologies that support or enhance the overall energy and
power infrastructure.
Key Niches:
• Cleantech, Energy Efficiency, and Renewables
• Power Products, Services, and Technologies
• Oil & Gas Products, Services, and Technologies
• Industrial & Infrastructure Services
• Engineering & Construction
For more information on Harris Williams & Co.’s Energy & Power Group as well as archived
copies of the Energy & Power Industry Update, please visit our website. Archived copies of the
Group’s industry whitepapers, including Transmission & Distribution Infrastructure and ESCOs
– Enabling Energy Efficiency, can also be found on the site.
Energy & Power Industry UpdateApril 2011
page 14
Mr. Armstrong co-leads the Energy & Power Group and was Harris Williams & Co.’s second employee, joining the
firm in 1993. In 1999, Mr. Armstrong founded the San Francisco office and has over 19 years of transactional
experience focused in middle market mergers and acquisitions assignments. Having directed over 125 mergers and
acquisitions transactions during his career, Mr. Armstrong has worked across industries including energy and power,
consumer products, building products, business services, distribution, retailing, specialty chemicals, and technology.
As Co-Head of the Energy & Power Group, Mr. Armstrong specializes on the Power segment. Prior to joining Harris
Williams & Co., Mr. Armstrong was with Wheat First Butcher Singer (now Wells Fargo). He earned a B.S. with a
concentration in Finance from the University of Virginia's McIntire School of Commerce and is also a Chartered
Financial Analyst. Mr. Armstrong was past president and director of the San Francisco Chapter of ACG and is
currently a director of the Greater Richmond YMCA.
Mr. Spitzer founded and co-leads the Energy & Power Group at Harris Williams & Co. Over his investment banking
career, Mr. Spitzer has advised clients on a variety of merger and acquisition and strategic advisory assignments, as
well as corporate financings. Mr. Spitzer has advised a diverse range of manufacturing and service businesses in the
energy and power industries. Key niche focus areas have included demand response solutions, power quality
equipment, infrastructure and industrial services, and oilfield products and services. Prior to focusing on energy and
power companies, Mr. Spitzer developed experience in numerous industries including industrial manufacturing,
chemicals, automotive, aerospace and defense, business services, and consumer products. Prior to joining Harris
Williams & Co., Mr. Spitzer worked in the General Industrial Group at Banc of America Securities, LLC and in the
Investment Banking Group at Goldman Sachs & Co. Mr. Spitzer earned an M.B.A. with Honors from Columbia
Business School, where he served as the Caplan Fellow. Mr. Spitzer earned a B.A. in Economics from the University
of Virginia.
Mr. Lucas re-joined Harris Williams & Co. following the completion of an M.B.A. from The Wharton School at the
University of Pennsylvania. Prior to business school, Mr. Lucas served as an Associate with Harris Williams & Co.,
working on mergers and acquisitions transactions in a broad range of industries, including general industrial,
consumer products, plastics, and waste equipment/services. Before re-joining Harris Williams & Co., Mr. Lucas
worked as an Associate with Graham Partners, a private equity group in Philadelphia. Previous experience also
includes work as an Investment Banking Analyst with JP Morgan. Mr. Lucas earned a B.S. in Commerce, with a
concentration in Finance from The McIntire School of Commerce at the University of Virginia.
Prior to joining Harris Williams & Co., Mr. White worked as an Associate in the Equity Capital Markets Group at
SunTrust Robinson Humphrey. Previous experience also includes work in the Capital Finance Group at Wachovia
Securities (now Wells Fargo) where he focused on acquisition financing, growth capital, and workout situations. Mr.
White earned an M.B.A. from the Goizueta Business School at Emory University and a B.S. in Business
Administration from the University of North Carolina at Chapel Hill.
Tiff B. Armstrong
Managing [email protected]
(804) 648-0072
Andrew G. Spitzer
Managing [email protected]
(804) 915-0174
Brian S. Lucas
(804) 932-1323
Matthew G. White
Vice [email protected]
(804) 915-0131
Prior to joining Harris Williams & Co., Mr. Semple worked as a Global Banking Associate at Deutsche Bank. Within
energy and power, Mr. Semple has advised a diverse range of businesses, including providers of energy efficiency
and clean technology products and services, oilfield products and services, transmission distribution products and
services, and power generation equipment. He earned an M.B.A. from the Darden School of Business at the
University of Virginia and a B.A. from Trinity College in Hartford, Connecticut.
Luke R. Semple
Vice [email protected]
(804) 648-1158
Energy & Power Industry UpdateApril 2011April 2011
Sources:
1. Capital IQ.2. MergerMarket.3 B k H h
1001 Haxall Point9th FloorRichmond, VA 23219P: (804) 648-0072F: (804) 648-0073
h i illi 3. Baker Hughes.
Harris Williams & Co. (www.harriswilliams.com), a member of The PNC Financial Services Group, Inc.(NYSE:PNC), is the premier middle market advisor with a two-decade legacy of sell side excellence servingclients worldwide. The firm is focused exclusively on the middle market providing sell side and acquisitionadvisory, restructuring advisory, board advisory, private placements and capital markets advisory services.
Investment banking services are provided by Harris Williams LLC, a registered broker-dealer and member ofFINRA and SIPC and Harris Williams & Co Ltd an Appointed Representative of Sturgeon Ventures LLP which
www.harriswilliams.com
575 Market Street31st FloorSan Francisco, CA 94105Phone: (415) 288-4260Fax: (415) 288-4269
FINRA and SIPC, and Harris Williams & Co. Ltd, an Appointed Representative of Sturgeon Ventures LLP, whichis Authorised and Regulated by the Financial Services Authority. Harris Williams & Co. is a trade name underwhich Harris Williams LLC and Harris Williams & Co. Ltd conduct business in the U.S. and Europe, respectively.
THIS REPORT MAY CONTAIN REFERENCES TO REGISTERED TRADEMARKS, SERVICE MARKSAND COPYRIGHTS OWNED BY THIRD-PARTY INFORMATION PROVIDERS. NONE OF THETHIRD-PARTY INFORMATION PROVIDERS IS ENDORSING THE OFFERING OF, AND SHALLNOT IN ANY WAY BE DEEMED AN ISSUER OR UNDERWRITER OF, THE SECURITIES,FINANCIAL INSTRUMENTS OR OTHER INVESTMENTS DISCUSSED IN THIS REPORT, AND
Two International Place24th FloorBoston, MA 02110Phone: (617) 482-7501Fax: (617) 482-7503
,SHALL NOT HAVE ANY LIABILITY OR RESPONSIBILITY FOR ANY STATEMENTS MADE IN THEREPORT OR FOR ANY FINANCIAL STATEMENTS, FINANCIAL PROJECTIONS OR OTHERFINANCIAL INFORMATION CONTAINED OR ATTACHED AS AN EXHIBIT TO THE REPORT. FORMORE INFORMATION ABOUT THE MATERIALS PROVIDED BY SUCH THIRD PARTIES, PLEASECONTACT US AT 804-648-0072.
The information and views contained in this report were prepared by Harris Williams & Co. (“Harris Williams”).It is not a research report, as such term is defined by applicable law and regulations, and is provided for
63 Brook StreetLondon, W1K 4HSPhone: +44 20 7518 8900Fax: +44 20 7526 2187
222 South Ninth StreetS it 3350 informational purposes only. It is not to be construed as an offer to buy or sell or a solicitation of an offer to buy or
sell any financial instruments or to participate in any particular trading strategy. The information contained hereinis believed by Harris Williams to be reliable but Harris Williams makes no representation as to the accuracy orcompleteness of such information. Harris Williams and/or its affiliates may be market makers or specialists in, actas advisers or lenders to, have positions in and effect transactions in securities of companies mentioned herein andalso may provide, may have provided, or may seek to provide investment banking services for those companies. Inaddition, Harris Williams and/or its affiliates or their respective officers, directors and employees may hold longor short positions in the securities, options thereon or other related financial products of companies discussedh i O i i ti t d j ti i thi t tit t H i Willi ’ j d t d bj t t
1900 East 9th Street20th FloorCleveland, OH 44114
Suite 3350Minneapolis, MN 55402Phone: (612) 359-2700Fax: (612) 359-2701
herein. Opinions, estimates and projections in this report constitute Harris Williams judgment and are subject tochange without notice. The financial instruments discussed in this report may not be suitable for all investors, andinvestors must make their own investment decisions using their own independent advisors as they believenecessary and based upon their specific financial situations and investment objectives. Also, past performance isnot necessarily indicative of future results. No part of this material may be copied or duplicated in any form or byany means, or redistributed, without Harris Williams’ prior written consent.
Copyright © 2011 Harris Williams & Co., all rights reserved.
Cleveland, OH 44114Phone: (216) 689-2400Fax: (216) 689-2401
1600 Market Street21st FloorPhiladelphia, PA 19103Phone: (267) 675-5900F (267) 675 5901Fax: (267) 675-5901
page 15
© 2011. Investment banking services are provided by Harris Williams LLC, a registered broker-dealer and member of FINRA and SIPC, and Harris Williams & Co. Ltd, an Appointed Representative of Sturgeon Ventures LLP, which is authorised and regulated by the FSA. Harris Williams & Co. is a trade name under which Harris Williams LLC and Harris Williams & Co. Ltd conduct business in the U.S. and Europe, respectively.