Embed Size (px)
Citation preview

MPRAMunich Personal RePEc Archive
Social protection to the informal sector:the role of minimum wage and incometransfer policies
Fernando Groisman and Santiago Boffi and Analıa Calero
and Marıa Soledad Cuba and Julia Liniado and Marıa
Eugenia Sconfienza and Albano Vergara Parra
PEP - Partnership for Economic Policy
August 2015
Online at https://mpra.ub.uni-muenchen.de/72822/MPRA Paper No. 72822, posted 5 August 2016 04:39 UTC

i
own Universite Laval
!
Social protection to the informal sector:the role of minimum wage and income transfer policies
working paper 2015-05
August 2015
Project leader:Fernando Groisman
Collaboration team:Santiago BoffiAnalía Calero
María Soledad CubaJulia Liniado
María Eugenia SconfienzaAlbano Vergara Parra
1
Social Protection for the Informal Sector: The Role of Minimum Wage and Income Transfer Policies
Abstract1
The objective of this study is to examine the impact that changes in minimum
wage and the main income transfer programs have had on the economic
participation of the population and the informal sector in Argentina. The
magnitude and importance that both policies have had in the Argentine case
makes it possible carry out an in-depth analysis of these topics. In effect,
minimum wage was periodically modified between 2002 and 2014 to be
among the highest in the Latin American region while the mentioned income
transfer program – called the Universal Child Allowance – has benefited some
40 percent of children residing in the country since its implementation.
The obtained evidence suggests that modifications to minimum wage did not
produce adverse effects on employment or have a substantial impact on the
probabilities of entering the informal sector. Regarding the income transfers, it
was possible to confirm that it did not encourage adults in beneficiary
households to become economically inactive.
JEL: J2, J4, J6
Keywords: Informality, Social Protection, and Minimum Wage
Acknowledgements
This research work was carried out with financial and scientific support from the
Partnership for Economic Policy (PEP) (www.pep-net.org) with funding from the
Department for International Development (DFID) of the United Kingdom (or UK Aid),
and the Government of Canada through the International Development Research
Center (IDRC).
1 We are grateful for the comments from mentors assigned by PEP that greatly contributed to the current
version. Any error or omission is the exclusive responsibility of the author. Collaborating Team: Santiago Boffi,
Analía Calero, María Soledad Cubas, Julia Liniado, María Eugenia Sconfienza, Albano Vergara Parra.

2
Table of content
I. Introduction p.3
II. Revision of the Literature p.4
III. Data and Methodology p.6
IV. Results p.10
V. Conclusions and Policy Implications p.13
Bibliography p.15

3
1 Introduction
This study focuses on an analysis of the minimum wage policy and the main
income transfer program – called the Universal Child Allowance (UCA)2– in
Argentina.
It will provide evidence about the impact these measures had on the labour
market with a focus on the informal sector. It sought to determine – on the one
hand – whether modifications in minimum wage reduced demand for
employment and/or encouraged informality in the labour sector. On the other
hand, it examined the influence of UCA as determining factors that leads the
adult population in beneficiary households to leave or enter the work force.
Similarly, the study assessed whether the transfers constitute an incentive for
labour informality.
In recent years, the use of minimum wage and income transfer programs has
intensified in several countries in Latin America and the Caribbean. Argentina
is a paradigmatic case as it brings together both phenomena.
The minimum wage was repeatedly modified between 2002 and 2014 – on 24
occasions. Its nominal amount increased 10-fold between 2003 and 2014 while
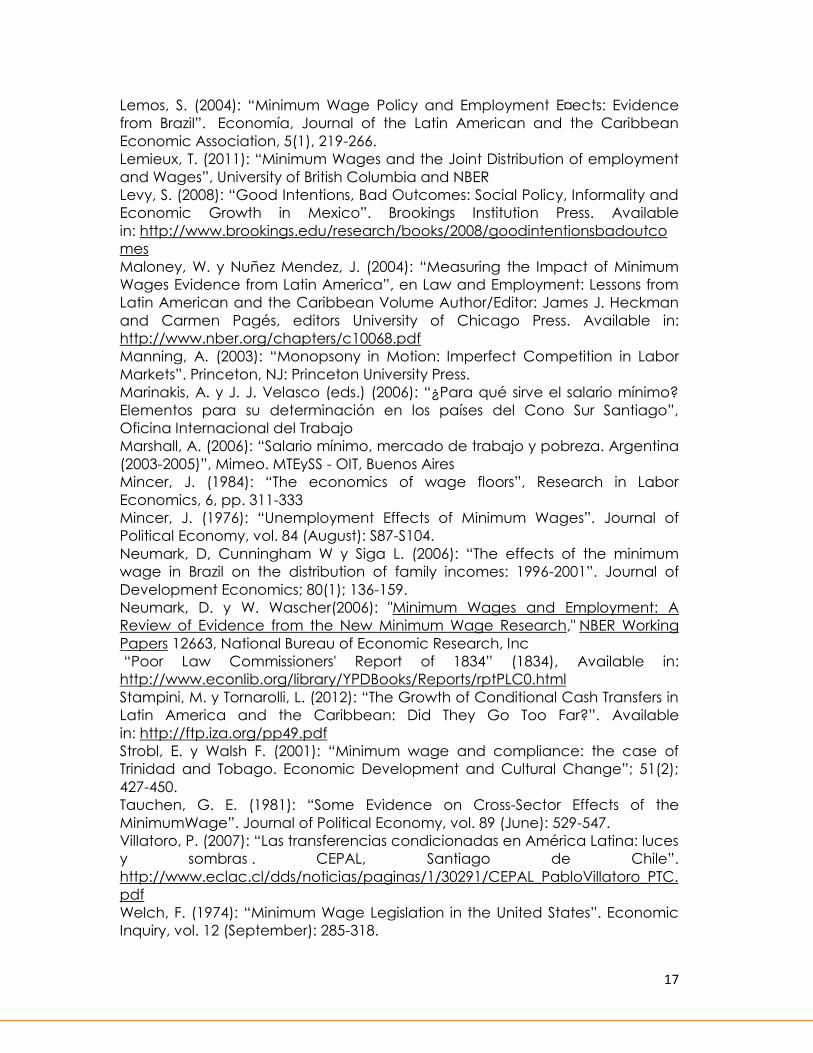
its purchasing power practically tripled (see Chart 1). For its part, the UCA in
place since 2009 currently benefits around 40 percent of children.
Both measures are core aspects of income policy in Argentina and given their
extension and coverage, contribute to the configuration of the new social
protection system that appears to be emerging in Argentina. Together with
their growing role in the agenda of Latin American public policies, both
initiatives are surrounded by elevated controversy.
The high level of informality that characterizes Latin American labour markets
adds to the debate. The high proportion of people who have jobs that are not
formal – which is to say they are not declared or registered in official social
security records – raise further questions about the impact that establishing a
legal minimum wage can have on that labour market segment. Therefore, it is
important to investigate whether increases in minimum wage – which by
definition only impact workers in formal jobs in the economy – cause any
slippage in the salaries of informal workers. It is also important to investigate
2 In Argentina the Universal Child Allowance for Social Protection (hereafter Universal Child Allowance or
UCA) was created through Decree 1.602/09 toward the end of 2009. The decree modified the Family
Allowance Law (Law 24.714), expanding its benefits to include children whose parents are unemployed or
who work in the informal sector with salaries that are below minimum, vital and mobile wage. The UCA is a
monthly cash benefit that is paid to parents, tutors, guardians or blood relatives up to the third degree, for
each child under 18 who is their responsibility, up to a maximum of five children. There is no age limit when
the child is disabled.

4
whether changes in this labour mechanism lead to transitions between both
segments of workers: from the formal to the informal sector and vice versa.
Similarly, the possible contractionary impact of social policies on labour supply
has been a recurring concern in specialized literature. It has been suggested
that income transfer programs encourage beneficiaries to moderate or even
stop their search for work. A narrowing – or closure – of the income gap
between inactivity/unemployment/informality and having a job is a central
part of our research.
2 Revision of the Literature
2.1 Regarding Minimum Wage
Classic labour market models suggest that establishing a wage floor above the
equilibrium wage – understood as that which clears any excess labour supply –
will lead to a reduction in the volume of employment.
Part of the empirical research carried out in the 1980s, for the most part based
on the U.S. economy, provided evidence that supports this vision (Gallasch,
1975; Gardner, 1981 y Brown et al., 1982). The reigning consensus at the time
was largely based on the thought of Brown et al. (1982) who concluded that
the reduction in employment among young people would be between 1
percent and 3 percent as a result of a 10 percent increase in minimum wage
in the United States.
Throughout the 1990s, a growing body of work questions this mainstream view,
demonstrating that the impact could be null – or in any case negative but with
little economic significance. (Lawrence, Katz y Krueger, 1992; Card y Krueger,
1995; Dickens, Machin and Manning, 1999).
During the current century the debate has grown more intense based on
research that offers finds contradictory results and is not lacking
methodological controversy (Neumark y Wascher, 2006; Dube, Lester y Reich,
2010; Allegretto, Dube y Reich, 2011 and Lemieux, 2011)3.
The debate has intensified in economies with segmented labour markets. In
effect, if we accept that there are different segments of workers, the
imposition of a specific level in the minimum wage could impact them in
3 The theoretic operating models of alternative labour market models to the competitive model that justify
the absence of contractionary effects on employment are monopsonistic. In these markets the equilibrium
wage is lower than the value of the marginal productivity of labour. As a result, an increase in minimum
wage does not necessarily lead to a reduction in employment. Under this hypothesis, the impact of
increases in minimum wage are indeterminate (Manning 2003). From a slightly different perspective, the
theory of efficient salaries admits that salary increases can increase productivity and therefore, they also do
not lead to a reduction in employment (Akerlof and Yellen, 1990).

5
different manners.4 The analysis of the impact of minimum wage on
segmented labour markets recognizes Welch (1974); Gramlich (1976) and
Mincer (1976 and 1984) as offering the most relevant contributions.
Recently there has been a renewed stream of research that has concentrated
on the situation of countries in the Latin America region where the level of
informality is very high. Comparative studies have been done between
countries (Cunningham, 2007; Marinakis y Velasco, 2006; Maloney y Nuñez
Méndez, 2004) and of course research centered on national cases has also
proliferated: Brazil (Boeri et al, 2011; Lemos, 2009 y 2004; Neumark et al., 2006;
Carneiro y Corseuil, 2001; Fajnzylber, 2001); Peru (Céspedes, 2006); México
(Bosch y Manacorda, 2010; Cunningham y Siga, 2006 –y Brazil–); Chile (Infante
et al., 2003); Colombia (Arango y Pachón, 2004), Costa Rica (Gindling y Terrell,
2007); Honduras (Gindling y Terrell, 2009 y 2010); Trinidad and Tobago (Strobl y
Walsh, 2001) y Nicaragua (Alaniz et al, 2011). For the Argentinian case we can
mention Marshall (2006) and Khamis (2008).
In international literature, the impact of minimum wage on the salary structure
has also been profoundly analysed. On this front, there is a certain level of
agreement in recognizing that the salary distribution tends to compress when
there are increases in minimum wage (DiNardo et al, 1996; Autor et al, 2010)
although some studies emphasize that increases in the lowest remunerations
are greater in the informal sector than in the informal. (Lemos, 2009; Boeri et al,
2011).
2.2 Regarding conditional income transfers
Social protection systems based on non-contributory schemes to ensure basic
protection for vulnerable populations have grown substantially in the Latin
America region in recent years (Barrientos and Hulme, 2009). In 2001 these
plans reached 38 million beneficiaries, but by 2010 this number had grown to
129 million (Stampini and Tornarolli, 2012). Generally, they are associated with
conditions related to education, health and nutrition, usually aimed at children
in the household in a bid to stop the inter-generational transmission of poverty.
(Villatoro, 2007).5
The multiplication of these programs has recently opened a broad debate
about the possible impact on the labour market that dates back many years.
4 Hall (1982) detected that minimum wage increased a labour rotation among job positions; Tauchen (1981)
and Welch (1974) discovered that it led to the migration of workers from sectors covered by minimum wage
to others that are not covered. Cotterman (1981), Fleisher (1981), Hammermesh (1981) demonstrated that it
reduces employment in low salary sectors and Beranek (1982) indicated that it created an incentive to
contract illegal immigrants. 5 The most important programs in the Latin America region, regarding the number of beneficiaries are:
Brasil (Bolsa Familia), México (Oportunidades) y Argentina (Asignación Universal por Hijo).
Similar programs with slightly less coverage can be found in several countries in the region: “Avancemos”
(Costa Rica); “Familias en Acción” (Colombia); “Chile Solidario” (Chile); “Programa de Asignación Familiar”
(Honduras); “Red de Protección Social” (Nicaragua); “Red de Oportunidades” (Panamá) y “Programa
Juntos” (Perú), among others.

6
In effect, the classical perspective saw them as policies that encourage
inactivity6 while more heterodox visions sustain that they could lead to an
increase in the economic participation in certain population groups.
Moreover, some would argue that programs that seek to equalize the rights of
informal workers with formal workers – in terms of the access the second group
has to certain levels of social protection – generate incentives for labour
informality (Levy, 2008).
3 Data and Methodology
3.1 Characteristics of the data source
The data used in the study comes from the Permanent Household Survey – EPH
– which is carried out by the National Institute of Statistics and Census – INDEC.
Argentina does not have panel surveys but the information coming from EPH
makes it possible to obtain data of this nature. The survey does not directly
investigate changes in the variables over time but it is possible to construct
longitudinal data.
The EPH micro databases were used for the period that goes from 2004 to
2013.
When examining minimum wage changes, we turned to the creation of
annual panels corresponding to the second quarters for the biennia in the
period.7 Using the second quarters makes it possible to reasonably capture the
modifications in the value of the minimum legal salary and facilitates an
estimate of its impact on the labour status of individuals (see Chart 1). As a
result, it is possible to observe the location of salaried workers regarding legal
minimum wage prior to its modification and one year later, which is to say
when the change in the value of minimum wage had taken place. –8. We
then added the annual rotation groups in a single data base – pooled data
sample. In the regression models we controlled the membership in each
annual panel through the inclusion of a dummy variable.
When exploring the effects of the income transfers, we used data from the
panel of micro databases corresponding to the third and fourth quarters of
2009 and 2010. The selection of these quarters is based on the moment when
6 A report written in England in 1834 about the so called “poor laws” is an eloquent example. In this, returning
to the ideas of Malthus in his 1798 Essay on Population, it was maintained that social assistance is an
incentive to not work. 7 The data to be used corresponds to the total number of urban centres covered by the survey. 8 The use of logistic models to estimate the impact of the variables of interest on changes in the labour status
could be biased if there was a dependency on the initial situation. Due to the elevated level of informality
and the high mobility between formality and informality in the Argentine case, this aspect was not
problematic. In any case, the models were controlled using the CMP package from Stata module to
implement conditional –recursive– mixed process estimator) that allows the inclusion of endogenous binary
variables within a multinomial regression.

7
the income transfer program that is being analysed was implemented. The
UCA took effect in late 2009 and therefore it is possible to identify beneficiary
households in 2010, after the program came into effect in 2009 and trace
them back a year when the UCA was still not in effect. Similar to the case of
involving minimum wage, the rotation groups were added to a single
database and in the regression models, membership in each annual panel
was controlled through the inclusion of a dummy variable. The data to be
used corresponded to the total of the urban centres that the EPH covers.
3.2 Methodological Design
The methodological design used in this investigation has two parts. In the first
we turned to multinomial logistic regression models with data from the
constructed panels. Secondly we used the differences in differences focus –
diff in diff – with similar multinomial logistic models but with cross-sectioned
micro data from the same information source.9
Multinomial logistic regression: Minimum wage The analysis universe was made up of salaried workers covered by regulations
related to minimum wage in the initial period, which is to say, prior to its
modification. Unless otherwise indicated, salaried workers were selected
whose work weeks varied between 35 and 48 hours – taking into account that
minimum wage is applied to salaried workers who meet the requirement of a
legal working day.
Similar to the scope of the norms on minimum wage, people in domestic
service were excluded, as were the beneficiaries of employment plans.
Moreover, the universe was restricted to consider salaried workers who were
under the age of 60. This made it possible to concentrate attention on the
economically active population and avoid transitions toward inactivity due to
access to retirement benefits.
The dependent variable was defined as the labour status of individuals after
the modification of minimum wage. Four categories were defined.
a) To be in a formal, salaried registered job
b) To be in an informal job, salaried but not registered
c) To not be occupied – unemployed or inactive and
c) To be occupied in a non-salaried position – this final group is the
base category against which the parameters were estimated.
9 As is known, there could be a risk of attrition when panel data is used (which is to say if there was a decline
in the number of cases with the required observations and this was not random). In the databases used for
this research, the loss of registers was marginal (around 6 percent on average) and therefore did not justify
the application of adjustments to address this issue.

8
The independent variable of interest is the one that captures the impact of
perceiving remuneration that is below – or in the tranche of the legal minimum
wage.10 The analysis is centred on the monthly salary received by workers in
their main occupation, which is the relevant concept used to examine
changes in the labour status of individuals.
Through this model it was possible to evaluate if those people with salaries
below – or in the tranche – of minimum wage were more exposed to losing
their jobs, or to entering the informal sector in the case of formal salaried
workers after a variation in minimum wage.
The vector of independent variables was complete with the following: gender,
age, age squared, educational level (characterized in the three levels),
position in the household, size of the establishment, branch of activity and
region of residence. Dummy variables were also included for each of the
groups included in the data pool.
Multinomial logistic regression: Income transfer Two models were defined11: in the first withdrawal from the labour market was
tested on all those who were employed when the first interview was carried
out. As a result, the dependent variable was defined in three categories.
a) Unemployed;
b) Inactive and
c) Employed – as a base category.
In the second model, similarly, it was evaluated whether people moved from
inactivity to economic activity after receiving these income transfers. In this
case, the universe for analysis was made up of all those who were not
employed nor were seeking employment when surveyed for the first
observation. The dependent variable was defined in the following three
categories.
a) To be unemployed
b) To be employed and
10 In this document a habitual practice from the specialized literature was followed and three income
tranches were created based on the value of the minimum legal salary for each period: under, in the
tranche and above the legal minimum.
11 Given that the aim is to evaluate the impact of the perception of the AUH on the labour insertion of adults
and considering that this program is granted only to families with parents who are unemployed or in the
informal sector, it is convenient to control the possible existence of endogeneity that could bias the results.
The presumed endogeneity is due to non-observed variables that could have an impact on the condition
for which the households are beneficiaries – which is to say reasons why they have adults who are
unemployed or in the informal sector and have children. Similar to the case of minimum wage, both models
were control with the CMP Stata package (module to implement conditional – recursive – mixed process
estimator) which allowed for the inclusion of endogenous binary variables within a multinomial regression.
The obtained results confirmed the absence of endogeneity in this case as well.

9
c) To remain inactive – as a base category
The analysis group was restricted to the group of homes with children and
without members who were formally employed – which is to say salaried and
registered in social security – between the third and fourth quarter of 2009 and
2010. The vector of independent variables included the usual categories for
this type of study: age; age squared, gender, educational level, position in the
home and number of children. Moreover, controls were added for geographic
regions and rotation groups. The independent variable of interest was defined
as that which indicated if the home received subsidies or some social aid in
cash.12 A dummy variable was defined which assumed the value of 1 if the
individual resided in a home benefiting from these transfers or 0 in the opposite
case.
Differences in differences approach: Minimum wage The differences in differences approach was applied to the group of salaried
workers, in two specific moments – before and after the change in the
minimum wage. The treatment group was defined in two categories: salaried
workers with remunerations below the legal minimum and workers with salaries
in the tranche.
On the other hand, the control group was made of up workers with
remuneration above minimum wage. The method made it possible to confirm
if the probabilities of entering an informal job were greater for salaried workers
with remunerations below/in the tranche of minimum wages – compared with
those whose wages are above the minimum – once minimum wage itself was
modified.
The analysis was carried out separately for each of the biennia in the 2004 to
2013 period through logistic regressions. It was a cross sectional database for
each biennia and included the observations corresponding to the universe
indicated in the period before and after the modification of minimum wage.13
In the vector of independent variables the same were included that were
used in the multinomial models described above. The variables of interest
were:
a) Salaries under the minimum and the year following the modification
of the minimum salary.
b) Salaries in the tranche of the minimum and a year following the
modification of the minimum salary.
12 The variable used is the “Categories of Non Laboral Income: Income by subsidy or social aid (in cash) from
the government, Church, etc. (V5 M)”. A range of values was used to approximate the receptors of AUH.
See: Design of Registry and Structure of the preliminary database of Households and Individuals. INDEC. 13 The use of a cross sectioned data base for each biennia made it possible to have access to a greater
number of cases and results than if the model had been applied to dynamic data. Moreover, in computing
the double difference with independent databases the identification of the control group was more
efficient.

10
Differences in differences approach: Income transfers In this case, the differences in differences approach was applied on the group
of adult individuals belonging to homes with children where there is no
registered salaried worker – which is to say only unemployed adults or those in
the informal sector. It referred to two moments in time – the second quarter of
each biennium between 2010 and 2013. The treatment group was defined by
those adult members of beneficiary households while the control group was
made up of adult individuals in households with children who lack members
employed in formal work and declared they don’t receive income transfers.
The method made it possible to confirm whether the probabilities of enjoying a
determined labour status varied in time between beneficiary and non-
beneficiary households of UCA.
4 Results
4.1 Minimum wage
Slightly less than a third of salaried workers in Argentina – considering jointly
those workers whose remuneration is below minimum wage and those whose
income is close to this level and with work weeks that vary between 35 and 48
hours – constitute the universe that would be most exposed to changes in this
salary level (see Chart 2). Note that the proportion is slightly more than 40
percent when the impact is observed in the total number of employed.
It is possible to verify that between 2004 and 2013 this number remained
relatively stable after a significant change between 2004 and 2005. The
marked increase of the fraction of salaried workers with remunerations below
the legal minimum as of 2005 also corresponds to the notorious increase in its
value. Between 2004 and 2005, minimum wage increased from 42.8 percent to
52 percent compared with the average salary (see Chart 3).
This panorama is slightly different regarding salaried workers registered in the
social security system – formal workers – are considered separately from those
who are not – informal.
The relative stability in the structure of the recipients based on their location
regarding minimum wage suggests that nominal increases between 2005 and
2013 accompanied the variations in the remunerations of the global group of
salaried workers. One direct way of measuring if this took place is by
computing the coefficient between the minimum wage and different points in
the distribution of salaries. It is possible to confirm that, after a significant
increase in the value of minimum wage compared with average wage
between 2004 and 2005, the increase of minimum wage – versus average
remunerations – followed a more moderate tendency above 50 percent (see
Chart 3).

11
The minimum wage essentially matched the average wage of the informal
workers and more than surpassed that received by salaried workers in the first
income decile. See Chart 3.
This alludes to the fact that the Argentinian labour market is segmented and
does not operate competitively. Estimates based on Kernel density confirm
this. Through its usage, it is possible to graphically represent the location of
minimum wage in the distribution of remunerations for formal and informal
workers. See Graph 1.14 It is possible to appreciate that, for the group of
registered salaried workers, the minimum wage is located in the extreme lower
end of the distribution, leaving only a small proportion of recipients under this
threshold. For non-registered workers, minimum wage is located on the
descending right high side of the density function. Unlike what happened for
registered salaried workers, the magnitude of informal workers with salaries
below the minimum was not marginal. Globally, this evidence justifies
concluding that minimum wage does not constitute a salary floor for the
informal sector in the style of a “beacon”, although it could have exercised it
in dynamic terms as the salary gap between both segments did not increase.
Graph 1: Kernel density estimation of wages for registered and non-registered workers and the location of minimum wage (2010).15
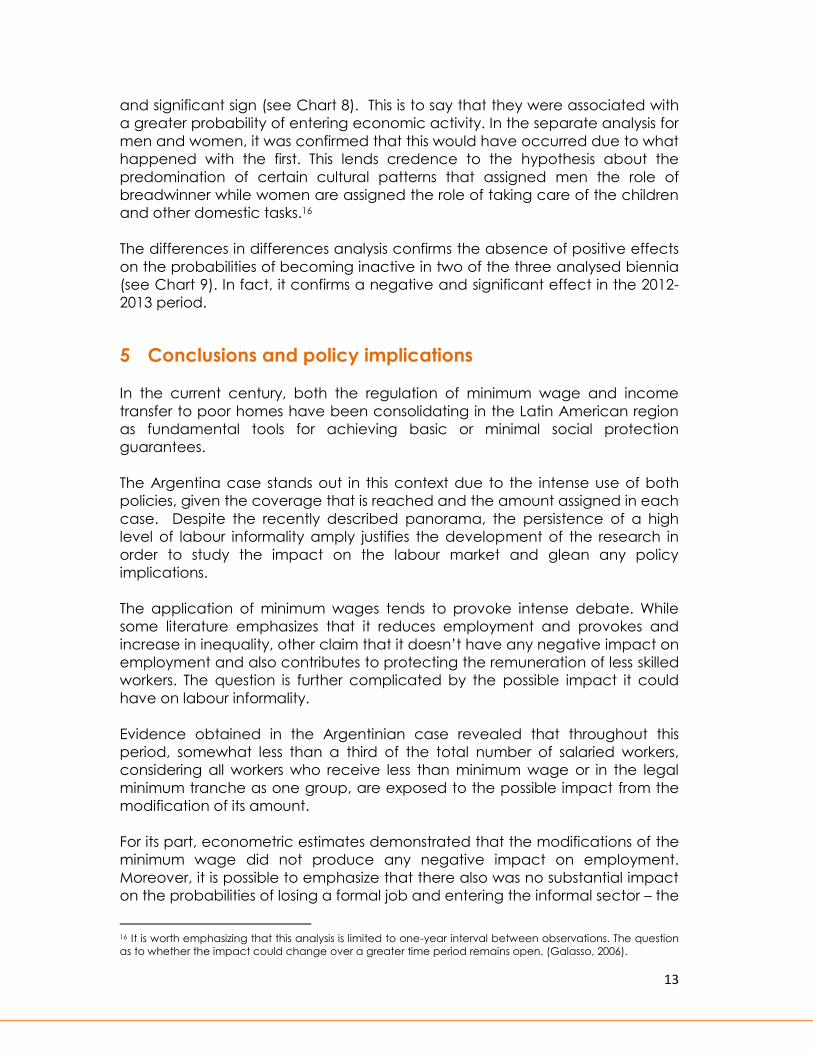
Recurring to the pool of data, it was possible to estimate the proportion of
those who maintained or changed their location in the salary tranches
regarding the legal minimum before and after its modification (see Chart 4). It
is possible to confirm that around one out of every 5 salaried workers (23.2
percent) who in the initial year received wages below the legal minimum
entered the segment of those who earned more than minimum wage in the
following year. In contrast, 6.9 percent of those who had received salaries
14 For indicative purposes we have included the 2010 Kernel distribution. The same result is obtained for all
the years in the 2004-2013 period. 15 The vertical line indicates the location of minimum wage. In all cases the data comes from EPH. Estimates
were made for the years 2004 to 2013.
0
.0001
.0002
.0003
.0004
.0005
0 2000 4000 6000 8000 10000
Formal Informal
Quarter II - 2010

12
above the minimum then moved into the group with salaries below the
minimum one-year later.
The estimated probabilities with the logistic multinomial regression models
support the absence of significant negative impacts on the loss of
employment among formal salaried workers. In effect, registered salaried
workers with remunerations at or below the minimum tranche - who are more
impacted by changes in the legal minimum - did not demonstrate greater
probabilities of losing their condition as the employed, which is to say they did
not demonstrate greater probability of entering unemployment or inactivity.
The coefficients were not significant (see Chart 6).
The panorama is slightly different when the analysis focuses on the impact
regarding access to a non-registered job. A previously stated, registered
salaried workers with an income that is below minimum wage and those with
remunerations in the minimum wage tranche represented something less than
6 percent to 8 percent respectively in 2013. They exhibited positive and
significant probabilities of entering an informal position (0.74 in the first group
and much less -0.44- in the second group.) This situational data is
complemented by the fact that those registered salaried workers with
remunerations below the minimum had less probabilities of remaining in this
condition (-0.309). This panorama suggests that minimum wage had exercised
an impact on the margin – light and with little economic significance -
regarding the labour status of workers.
Through a differences in differences analysis it is possible to reinforce the
conclusion obtained from the panel data about the limited impact that
changes in minimum wage could have on the level of informality.
4.2 Transfer of Income
The impact of the UCA on the activity-inactivity trajectory was evaluated for
those members of homes who are able to access the program. The regression
models made it possible to confirm that the UCA was not associated with a
greater probability of moving from employment to inactivity - the coefficient
was not significant (see Chart 8).
In other words, the perception of this transfer – controlled by the remainder of
the factors included in the analysis – did not lead adult workers to exit
economic activity. On the other hand, it did confirm a greater propensity to
go from employment to unemployment. The interpretation of this derivation
makes sense when we note that the jobs held by adults in these homes tend to
be characterized by very low stability. Similar results were found in the
separate analysis for men and women.
In the other direction, in the move from inactivity toward unemployment and
employment, it is possible to confirm that the monetary transfer had a positive
13
and significant sign (see Chart 8). This is to say that they were associated with
a greater probability of entering economic activity. In the separate analysis for
men and women, it was confirmed that this would have occurred due to what
happened with the first. This lends credence to the hypothesis about the
predomination of certain cultural patterns that assigned men the role of
breadwinner while women are assigned the role of taking care of the children
and other domestic tasks.16
The differences in differences analysis confirms the absence of positive effects
on the probabilities of becoming inactive in two of the three analysed biennia
(see Chart 9). In fact, it confirms a negative and significant effect in the 2012-
2013 period.
5 Conclusions and policy implications
In the current century, both the regulation of minimum wage and income
transfer to poor homes have been consolidating in the Latin American region
as fundamental tools for achieving basic or minimal social protection
guarantees.
The Argentina case stands out in this context due to the intense use of both
policies, given the coverage that is reached and the amount assigned in each
case. Despite the recently described panorama, the persistence of a high
level of labour informality amply justifies the development of the research in
order to study the impact on the labour market and glean any policy
implications.
The application of minimum wages tends to provoke intense debate. While
some literature emphasizes that it reduces employment and provokes and
increase in inequality, other claim that it doesn’t have any negative impact on
employment and also contributes to protecting the remuneration of less skilled
workers. The question is further complicated by the possible impact it could
have on labour informality.
Evidence obtained in the Argentinian case revealed that throughout this
period, somewhat less than a third of the total number of salaried workers,
considering all workers who receive less than minimum wage or in the legal
minimum tranche as one group, are exposed to the possible impact from the
modification of its amount.
For its part, econometric estimates demonstrated that the modifications of the
minimum wage did not produce any negative impact on employment.
Moreover, it is possible to emphasize that there also was no substantial impact
on the probabilities of losing a formal job and entering the informal sector – the
16 It is worth emphasizing that this analysis is limited to one-year interval between observations. The question
as to whether the impact could change over a greater time period remains open. (Galasso, 2006).

14
impact was modest and only involved a very small proportion of salaried
workers. Finally, the information obtained in this research confirmed that the
salary gap between formal and informal workers did not increase.
Regarding the income transfers, the controversy has focused on the impact
that the income transfer could have on the decisions to participate in the
labour market. The results that were obtained demonstrate that there was no
movement toward economic activity attributable to the UCA. To the contrary,
some evidence was found that it could have encouraged a move to
economic activity – from inactivity toward unemployment, of the men in the
beneficiary homes.
As a whole, this evidence manifests in favour of encouraging the continuity of
these initiatives. Moreover, due to the positive impact – although modest –
that was found regarding the economic activity in certain groups of the
population concerning UCA, it would be worth asking about the impact that
could be obtained if the application of this policy scheme were amplified.
Finally, it is important to draw attention to the existing quota of informality in
the Argentinian labour market as a distinctive element for the design of policy
recommendations.
As a result, the use of specific policies to achieved higher marks in the level of
labour formalization that mitigate the loss of wellbeing derived from the
disadvantages associated with informality emerges as corollary. This will result
in a greater effectiveness of the analysed policies – ie greater coverage of
minimum wage and greater available resources due to the reduction of
informal workers – thereby contributing to achieving growing levels of equity
and social integration.

15
Bibliography Akerlof, G. A. and Yellen; J. L. (1990) : “The Fair Wage-Effort Hypothesis and
Unemployment”. The Quarterly Journal of Economics (1990) 105 (2): 255-283.
Alaniz, E.,Gindling, T. H. y Terrell, K. (2011): “The Impact of Minimum Wages on
Wages”, Work and Poverty in Nicaragua. IZA DP No. 5702
Allegretto, S., A Dube, and M. Reich. (2011): “Do minimum wages really reduce
teen employment? Accounting for heterogeneity and selectivity in state panel
data” IndustrialRelations 50 (April):205-240.
Arango C. y Pachón A. (2004): “Minimum wages in Colombia: holding the
middle with a bite on the poor”. Mimeo. Banco de la República (Colombia),
Bogotá
Autor, D., Manning, A. and Smith, C. (2010): “The Contribution of the Minimum
Wage to U.S. Wage Inequality over Three Decades: A Reassessment”, CEP
Discussion Paper No 1025
Barrientos, A. and Hulme, D. (2009) : “Social Protection for the Poor and Poorest
in Developing Countries: Reflections on a Quiet Revolution”. Oxford
Development Studies, Vol. 37, No. 4, December 2009.
Beranek, W. (1982) : “The Illegal Alien Work Force, Demand for Unskilled Labor,
and the Minimum Wage”. Journal of Labor Research, vol. 3 (Winter): 89-99.
Boeri, T., Garibaldi, P. y Ribeiro, M. (2011): “The Lighthouse E¤ect and Beyond”.
Review of Income and Wealth, Vol. 57, pp. S54-S78.
Bosch, M. y Manacorda, M. (2010): “Minimum Wages and Earnings Inequality
in Urban Mexico”. American Economic Journal: Applied Economics, 2(4): 128–
49.
Brown, C.; Gilroy, C and Kohen, A. (1982): “The Effect of the Minimum Wage on
Employment and Unemployment”. Journal of Economic Literature, vol. 20
(June): 487-528.
Card, D. y Krueger, A. (1995): “Time-Series Minimum-Wage Studies: A Meta-
analysis The American Economic Review”, Vol. 85, No. 2, Papers and
Proceedings of the Hundredth and Seventh Annual Meeting of the American
Economic Association Washington, DC, January 6-8, 1995. (May, 1995), pp.
238-243.
Carneiro, F. G. y Corseuil, C. E. (2001): “Minimum wage effects on wages and
employment: evidence from time series and longitudinal data”. IPEA Working
Paper No. 849: Brasilia
Céspedes, N. (2006): “Efectos del salario mínimo en el mercado laboral
peruano”. Revista Estudios Económicos. Nro. 13, Lima
Cotterman, R. (1981): “The Effects of Federal Minimum Wages on the Industrial
Distribution of Teenage Employment”. In Rottenberg (1981a): 42-60.
Cunningham, W. and Siga, L. (2006): “Wage and employment effects of
minimum wages on vulnerable groups in the labour market: Brazil and
Mexico”. World Bank/LCSHS: Washington
Cunningham, W. (2007): “Minimum wages and social policy: lessons from
developing countries”. The World Bank: Washington
Dickens, R., S. Machin, and A. Manning (1999) : “The effects of minimum wages
on employment: Theory and evidence from Britain”. Journal of Labor
Economics 17 (1): 1–22.

16
DiNardo, J.; Fortin, N. M y Lemieux, T., (1996): « Labor Market Institutions and the
Distribution of Wages, 1973-1992: A Semiparametric
Approach », Econometrica, Econometric Society, vol. 64(5), pages 1001-44,
September.
Dube, A., T.W. Lester, and M. Reich. (2010): “Minimum wage effects across
state borders: Estimates using contiguous counties”. Review of Economics and
Statistics 92 (November):945-64.
Fajnzylber, P.R. (2001): “Minimum Wage Throughout the Wage Distribution:
Evidence from Brazil´s Formal and Informal Sectors”. CEDEPLAR Working Paper
N 151.
Fleisher, B. M. (1981): “Minimum Wage Regulation in Retail Trade”. Washington:
American Enterprise Institute
Galasso, M. (2006): “With their effort and one opportunity: Alleviating extreme
poverty in Chile”, Documento de Trabajo del Development Research Group,
World Bank, Washington.
Gallasch, H.F. (1975): “Minimum Wages and the Farm Labor Market” . Southern
Economic Journal, vol. 41 (January): 480-491.
Gardner, B. (1981): “What Have Minimum Wages Done in Agriculture? ” In
Rottenberg (1981a): 210-232.
Gindling, T. H. y Terrell K. (2010): “Minimum wages, globalization and poverty in
Honduras”. World Development 2010; 38(6); 908-918.
Gindling, T. H. y Terrell K. (2009): “Minimum wages and employment in various
sectors in Honduras”. Labour Economics 16(3); 291-303.
Gindling, T. H. y Terrell K. (2007): “The effects of multiple minimum wages
throughout the labour market: the case of Costa Rica”. Labour Economics 14;
485-511.
Gramlich, E. (1976): “Impact of Minimum Wages on Other Wages,
Employment, and Family Incomes”. Brookings Papers on Economic Activity
(No. 2): 409-461.
Hall, R. (1982): “The Minimum Wage and Job Turnover in Markets for Young
Workers. In The Youth Labor Market Problem: Its Nature, Causes, and
Consequences”, ed. Richard B.
Hammermesh, D. (1981): “Employment Demand, the Minimum Wage and
Labor Costs. In Minimum Wage Study Commission”, vol. 5, pp. 27-84.
INDEC (2003): “Diseño de Registro y Estructura para las bases
preliminares. Tercer trimestre 2003”, INDEC, Buenos Aires.
Infante, R.; Marinakis, A., y Velasco, J. (2003): “Minimum wage in Chile: An
example of the potencial and limitations of this policy instrument”.
Employment Paper, núm. 52. Ginebra, OIT
Khamis, M. (2008): “Does the Minimum Wage Have a Higher Impact on the
Informal than on the Formal Labor Market? Evidence from Quasi-Experiments”.
IZA DP No. 3911
Lawrence K. y Alan K. (1992): “The Effect of the Minimum Wage on the Fast
Food Industry,” Working Papers 678, Princeton University, Department of
Economics, Industrial Relations Section..
Lemos, S. (2009): “Minimum wage effects in a developing country”, Labour
Economics 16 (2009) 224–237.
17
Lemos, S. (2004): “Minimum Wage Policy and Employment E¤ects: Evidence
from Brazil”. Economía, Journal of the Latin American and the Caribbean
Economic Association, 5(1), 219-266.
Lemieux, T. (2011): “Minimum Wages and the Joint Distribution of employment
and Wages”, University of British Columbia and NBER
Levy, S. (2008): “Good Intentions, Bad Outcomes: Social Policy, Informality and
Economic Growth in Mexico”. Brookings Institution Press. Available
in: http://www.brookings.edu/research/books/2008/goodintentionsbadoutco
mes
Maloney, W. y Nuñez Mendez, J. (2004): “Measuring the Impact of Minimum
Wages Evidence from Latin America”, en Law and Employment: Lessons from
Latin American and the Caribbean Volume Author/Editor: James J. Heckman
and Carmen Pagés, editors University of Chicago Press. Available in:
http://www.nber.org/chapters/c10068.pdf
Manning, A. (2003): “Monopsony in Motion: Imperfect Competition in Labor
Markets”. Princeton, NJ: Princeton University Press.
Marinakis, A. y J. J. Velasco (eds.) (2006): “¿Para qué sirve el salario mínimo?
Elementos para su determinación en los países del Cono Sur Santiago”,
Oficina Internacional del Trabajo
Marshall, A. (2006): “Salario mínimo, mercado de trabajo y pobreza. Argentina
(2003-2005)”, Mimeo. MTEySS - OIT, Buenos Aires
Mincer, J. (1984): “The economics of wage floors”, Research in Labor
Economics, 6, pp. 311-333
Mincer, J. (1976): “Unemployment Effects of Minimum Wages”. Journal of
Political Economy, vol. 84 (August): S87-S104.
Neumark, D, Cunningham W y Siga L. (2006): “The effects of the minimum
wage in Brazil on the distribution of family incomes: 1996-2001”. Journal of
Development Economics; 80(1); 136-159.
Neumark, D. y W. Wascher(2006): "Minimum Wages and Employment: A
Review of Evidence from the New Minimum Wage Research," NBER Working
Papers 12663, National Bureau of Economic Research, Inc
“Poor Law Commissioners' Report of 1834” (1834), Available in:
http://www.econlib.org/library/YPDBooks/Reports/rptPLC0.html
Stampini, M. y Tornarolli, L. (2012): “The Growth of Conditional Cash Transfers in
Latin America and the Caribbean: Did They Go Too Far?”. Available
in: http://ftp.iza.org/pp49.pdf
Strobl, E. y Walsh F. (2001): “Minimum wage and compliance: the case of
Trinidad and Tobago. Economic Development and Cultural Change”; 51(2);
427-450.
Tauchen, G. E. (1981): “Some Evidence on Cross-Sector Effects of the
MinimumWage”. Journal of Political Economy, vol. 89 (June): 529-547.
Villatoro, P. (2007): “Las transferencias condicionadas en América Latina: luces
y sombras . CEPAL, Santiago de Chile”.
http://www.eclac.cl/dds/noticias/paginas/1/30291/CEPAL_PabloVillatoro_PTC.
Welch, F. (1974): “Minimum Wage Legislation in the United States”. Economic
Inquiry, vol. 12 (September): 285-318.

18
List of Charts
Chart 1. Modification of Minimum Wage 2003 – 2014 (In $ Argentine)
Modification of Minimum Wage 2003 - 2014
Norm In Place Since Salary by
hour
Salary by
month
Decree 388/03 December 1, 2003 1,5 300
Decree 1349/03 January 1,
2004 1,75 350
Resolution 2 of the National
Employment Council, Productivity and
Minimum, Vital and Moveable Wage
and Decree 1192/04
September 1, 2004 2,25 450
Resolution 2 of the National
Employment Council, Productivity and
Minimum, Vital and Moveable Wage
and Decree 750/05
May 1, 2005 2,55 510
June 1, 2005 2,85 570
July 1, 2005 3,15 630
Resolution 2 of the National
Employment Council, Productivity and
Minimum, Vital and Moveable Wage
(2006)
August 1, 2006 3,8 760
September 1, 2006 3,9 780
November 1, 2006 4 800
Resolution 2 of the National
Employment Council, Productivity and
Minimum, Vital and Moveable Wage
(2007)
August 1, 2007 4,5 900
October 1, 2007 4,8 960
December 1, 2007 4,9 980
Resolution 2 of the National
Employment Council, Productivity and
Minimum, Vital and Moveable Wage
(2008)
August 1, 2008 6 1200
December 1, 2008 6,2 1240
Resolution 2 of the National
Employment Council, Productivity and
Minimum, Vital and Moveable Wage
(2009)
August 1, 2009 7 1400
October 1, 2009 7,2 1440
January 1, 2010 7,5 1500
Resolution 2 of the National
Employment Council, Productivity and
Minimum, Vital and Moveable Wage
(2010)
August 1, 2010 8,7 1740
January 1, 011 9,2 1840
Resolution 2 of the National
Employment Council, Productivity and
Minimum, Vital and Moveable Wage
(2011)
August 1, 2011 11,5 2300
Resolution 2 of the National
Employment Council, Productivity and
Minimum, Vital and Moveable Wage
(2012)
September 1, 2012 13,35 2670
Feburary 1, 2013 14,38 2875
Resolution 2 of the National
Employment Council, Productivity and
Minimum, Vital and Moveable Wage
(2013)
August 1, 2013 16,5 3300
January
1, 2014 18 3600
Source: Own elaboration

19
Chart 2. Distribution of employed individuals according to their level of salary
versus the legal minimum (%)(1)
2004 2005 2006 2007 2008 2009 2010 2011 2012 2013
Total Employed
Under 28,5 38,6 37,2 37,7 33,1 35,8 35,2 33,3 36,2 32,5
In the tranche 16,4 9,1 7,4 7,2 9,7 8,5 10,8 12,7 6,8 10,1
Above 55,2 52,3 55,3 55,1 57,2 55,7 54,0 54,0 57,0 57,4
Total 100,0 100,0 100,0 100,0 100,0 100,0 100,0 100,0 100,0 100,0
Occupied 35-48hs
Under 12,7 22,7 22,5 24,1 21,8 22,7 22,7 21,5 22,4 19,1
In the tranche 14,6 10,9 7,4 8,3 9,8 9,2 12,3 13,4 7,0 10,3
Above 72,7 66,4 70,1 67,6 68,4 68,1 64,9 65,1 70,6 70,6
Total 100,0 100,0 100,0 100,0 100,0 100,0 100,0 100,0 100,0 100,0
Salaried 35-48hs
Under 10,0 19,3 20,2 21,3 20,1 20,0 19,9 19,3 19,2 14,8
In the tranche 14,7 11,1 7,1 8,2 9,7 9,9 12,6 12,1 6,9 10,3
Above 75,3 69,6 72,7 70,5 70,2 70,1 67,5 68,6 73,9 74,9
Total 100,0 100,0 100,0 100,0 100,0 100,0 100,0 100,0 100,0 100,0
Salaried 35-48hs(2)
Under 8,1 16,7 16,8 18,5 17,5 17,0 16,7 16,3 17,1 13,0
In the tranche 13,6 10,8 7,2 8,3 9,5 9,9 12,6 12,0 6,7 9,9
Above 78,3 72,6 76,0 73,2 73,0 73,1 70,7 71,7 76,2 77,1
Total 100,0 100,0 100,0 100,0 100,0 100,0 100,0 100,0 100,0 100,0
Registered Salaried 35-48hs(2)
Under 1,8 5,7 6,3 7,9 8,5 8,3 8,3 7,9 7,9 5,9
In the tranche 9,1 8,5 5,6 6,4 7,9 8,7 10,5 9,6 5,5 7,8
Above 89,1 85,8 88,2 85,6 83,6 83,0 81,2 82,5 86,6 86,2
Total 100,0 100,0 100,0 100,0 100,0 100,0 100,0 100,0 100,0 100,0
Unregistered Salaried 35-48hs(2)
Under 25,1 46,5 47,2 50,2 49,1 48,0 45,6 46,8 53,1 48,5
In the tranche 25,6 16,9 11,8 13,8 15,1 14,2 19,9 20,7 11,5 12,2
Above 49,3 36,7 41,1 36,0 35,8 37,8 34,6 32,4 35,5 39,3
Total 100,0 100,0 100,0 100,0 100,0 100,0 100,0 100,0 100,0 100,0
Self Employed
Under 30,6 43,0 37,5 42,1 36,6 42,4 43,4 36,1 39,7 40,5
In the tranche 16,3 10,7 9,9 9,2 12,0 6,6 12,5 21,9 8,5 10,2

20
Above 53,2 46,3 52,5 48,7 51,4 51,0 44,1 42,1 51,8 49,4
Total 100,0 100,0 100,0 100,0 100,0 100,0 100,0 100,0 100,0 100,0
(1) Classification by ranges taking rounding into account (2) Excludes domestic service and employment plan beneficiaries
Source: Our own elaboration based on data from the Permament Household Survey – EPH –
INDEC, Second Quarter
Chart 3. Ratio of minimum wage regarding different points of salary distribution based
on registration. Salaried (35-48hs) (%)(1)
2004 2005 2006 2007 2008 2009 2010 2011 2012 2013
Salaried
Average 42,8 52,0 54,2 55,9 53,9 58,8 58,2 54,4 56,8 55,5
Percentile 10 116,4 131,9 148,5 129,2 135,6 138,9 149,9 125,0 122,5 120,8
Percentile 25 76,4 94,9 89,3 96,8 94,9 96,1 99,9 93,7 87,5 85,3
Mid 53,8 65,0 66,1 64,6 63,3 69,4 71,4 62,5 64,5 64,4
Percentile 75 35,0 43,2 44,6 48,4 47,5 48,8 50,0 46,9 49,0 47,5
Registered Salaried
Average 38,3 46,0 47,9 49,7 48,6 53,4 52,5 49,2 51,7 50,7
Percentile 10 87,3 94,9 104,0 96,8 105,5 104,1 107,1 104,1 98,0 96,7
Percentile 25 63,6 79,0 78,1 77,5 79,1 83,3 83,3 75,0 81,6 72,5
Mid 48,2 59,3 62,4 59,6 59,3 62,5 60,0 58,6 61,2 58,0
Percentile 75 35,0 39,6 41,6 43,0 41,3 43,1 42,9 41,7 44,5 41,4
Unregistered Salaried Workers
Average 61,9 80,7 87,6 89,0 87,7 91,6 93,1 88,0 92,5 84,8
Percentile10 174,9 236,6 249,6 227,6 237,2 249,6 249,9 234,1 244,8 193,3
Percentile 25 121,2 157,8 156,1 155,0 158,2 156,2 150,0 156,1 163,2 145,0
Mid 87,3 98,9 104,1 107,5 105,5 104,1 107,1 104,1 122,4 96,6
Percentile 75 58,2 67,9 78,1 77,4 75,9 78,1 75,0 75,0 76,5 72,5
(1) Classification by ranges, taking rounding into account. It excludes domestic service and beneficiaries of
employment plans
Source: Our own elaboration based on data from the Permanent Household Survey – EPH – INDEC, Second
quarter
Chart 4: Annual transitions of salaried workers (35-48hs) according to the salary
received compared with the legal minimum. Pool from the panel data 2004-2013
(%) (1)
Location in t
Location in t-1 No longer
salaried
Under
minimum
In the
tranche of
Above
minimum Total
21
wage minimum
wage
wage
Under minimum
wage 18,1 46,7 12,0 23,2 100
In the tranche
of minimum
wage
11,3 27,5 17,8 43,5 100
Above
Minimum wage 5,9 6,9 6,3 80,9 100
Total 8,9 16,8 8,6 65,8 100
(1) Classification by ranges, taking rounding into account. It excludes domestic service and
beneficiaries of employment plans
Source: Our own elaboration based on data from the Permanent Household Survey – EPH – INDEC,
Second quarter
Chart 5. Modifications in the amount of the Universal Child Benefit ($
Argentine)
Data Amount per child /
pregnancy
Amount for child with
disability Decree
November 2009 180 720 1602/09
September 2010 220 880 1388/10
October 2011 270 1.080 1482/11
September 2012 340 1.200 1667/12
June 2013 460 1.500 614/13
Source: ANSES (National Social Security Administration)

22
Chart 6. Selected Coefficients of multinomial regressions. Dependent variable
(DV): Employment status. Panel Data Pool 2004-2013 (1)
Total salaried in t-1
Only salaried
registered in t-1
On salaried not
registered in t-1
Coef. Err. Std. Coef. Err. Std. Coef. Err. Std.
TOTAL
DV: Salaried registered in t
With a salary below
the range of the
minimum in t-1
-0,384 0,085 -0,309 0,141 -0,377 0,120
With a salary in the
range of minimum
wage in t-1
-0,290 0,094 -0,023 0,146 -0,313 0,145
DV: Unregistered salaried in t With a salary below
the range of the
minimum in t-1
0,215 0,087 0,744 0,168 0,005 0,101
With a salary in the
range of minimum
wage in t-1
-0,009 0,101 0,444 0,182 -0,231 0,123
DV: Unemployed or inactive in t With a salary below
the range of the
minimum in t-1
0,309 0,103 0,186 0,179 0,342 0,140
With a salary in the
range of minimum
wage in t-1
0,011 0,118 0,280 0,182 -0,008 0,172
N° de obs.: 22.364 N° de obs.17.174 N° de obs.5.190
Men
DV: Salaried registered in t With a salary below
the range of the
minimum in t-1
-0,398 0,102 -0,330 0,180 -0,324 0,136
With a salary in the
range of minimum
wage in t-1
-0,268 0,114 0,074 0,182 -0,208 0,166
DV: Unregistered salaried in t
With a salary below
the range of the
minimum in t-1
0,176 0,100 0,795 0,209 -0,040 0,112
With a salary in the
range of minimum
wage in t-1
0,176 0,118 0,794 0,220 -0,080 0,139
DV: Unemployed or inactive in t
With a salary below
the range of the
minimum in t-1
0,128 0,130 0,013 0,242 0,081 0,170

23
With a salary in the
range of minimum
wage in t-1
0,162 0,146 0,619 0,230 -0,013 0,207
N° de obs.: 14.893 N° de obs.: 10.917 N° de obs.: 3.976
WOMEN
DV: Salaried registered in t
With a salary below
the range of the
minimum in t-1
-0,308 0,160 -0,249 0,233 -0,493 0,270
With a salary in the
range of minimum
wage in t-1
-0,423 0,171 -0,267 0,243 -0,727 0,312
DV: Unregistered salaried in t
With a salary below
the range of the
minimum in t-1
0,280 0,176 0,654 0,292 0,031 0,237
With a salary in the
range of minimum
wage in t-1
-0,593 0,207 -0,398 0,345 -0,845 0,282
DV: Unemployed or inactive in t
With a salary below
the range of the
minimum in t-1
0,583 0,181 0,367 0,279 0,710 0,276
With a salary in the
range of minimum
wage in t-1
-0,313 0,207 -0,285 0,301 -0,278 0,329
N° de obs.: 7.471 N° de obs.: 6.257 N° de obs.: 1.214
(1) Universe: registered and not registered salaried workers in t-1. Classification by ranges rounded
ranges. It excludes domestic service and beneficiaries of employment plans in t-1.
Note: It is controlled by gender, age of the sample, educational level (categorized in three
levels) position in the household, size of the establishment, type of activity, region of residency
and for each of the waves included in the data pool.
Source: own elaboration
Chart 7. Selected coefficients from the differences in differences models in
multinomial regressions. Dependent variable (DV): conditions of registration.
Cross section data corresponding to biennia between 2014 and 2013 (1) DV: Registration in the year after the modification of minimum wage
(1 = non registered salaried y 0 = registered salaried) Coef. Err. Std.
Biennia 2004-2005
With a salary below the range of the minimum and 2005 -0,219 0,199
With a salary in the range of the minimum and 2005 0,040 0,158
N° de observations: 8.558
Biennia 2005-2006

24
With a salary below the range of the minimum and 2006 -0,216 0,151
With a salary in the range of the minimum and 2006 -0,005 0,178
N° de observations: 9.122
Biennia 2006-2007
With a salary below the range of the minimum and 2007 -0,043 0,133
With a salary in the range of the minimum and 2007 -0,185 0,174
N° de observations: 11.028
Biennia 2007-2008
With a salary below the range of the minimum and 2008 -0,058 0,121
With a salary in the range of the minimum and 2008 0,043 0,155
N° de observations: 12.809
Biennia 2008-2009
With a salary below the range of the minimum and 2009 -0,074 0,125
With a salary in the range of the minimum and 2009 -0,244 0,153
N° de observations: 12.910
Biennia 2009-2010
With a salary below the range of the minimum and 2010 0,076 0,124
With a salary in the range of the minimum and 2010 0,175 0,144
N° de observations: 12.834
Biennia 2010-2011
With a salary below the range of the minimum and 2011 0,095 0,124
With a salary in the range of the minimum and 2011 0,216 0,138
N° de observations: 13.208
Biennia 2011-2012
With a salary below the range of the minimum and 2012 0,100 0,126
With a salary in the range of the minimum and 2012 -0,055 0,163
N° de observations: 13.348
Biennia 2012-2013
With a salary below the range of the minimum and 2013 -0,343 0,131
With a salary in the range of the minimum and 2013 -0,229 0,171
N° de observations: 13.144
(1) Universe: salaried registered and non-registered workers. Classification by ranges, taking
rounding into account. It excludes domestic service and those benefiting from employment
plans. Control group: salaried workers with remunerations above the legal minimum.
Note: Data is controlled by gender, age, age squared, education level (categorized in three
levels) position in the home, size of the establishment, type of activity, region of residence and
for each of the waves included in the data pool.
Source: own elaboration

25
Chart 8. Selected coefficients of multinomial regressions. Dependent variable (DV):
Employment status. Pool of data from the 2009 -2010 panel.
Universe: Employed in 2009
DV: Unemployed DV: Inactive
Coef. Std. Error Coef. Std. Error
TOTAL
With UCA 0,563 0,159 0,146 0,097
N° de observations: 5.033
WOMEN
With UCA 0,734 0,271 0,195 0,117
N° de observations: 2.143
MEN
With UCA 0,460 0,195 -0,015 0,183
N° de observations: 2.890
Universe: Inactive in 2009
DV: Unemployed DV: Inactive
Coef. Std. Error Coef. Std. Error
TOTAL
With UCA 0,297 0,143 0,170 0,085
N° de observations: 7.204
WOMEN
With UCA 0,177 0,191 0,143 0,104
N° de observations: 4.545
MEN
With UCA 0,348 0,132 0,205 0,151
N° de observations: 2.659
Note: Data is controlled by gender, age, age squared, education level (categorized in three levels)
position in the home, size of the establishment, type of activity, region of residence and for each of the
waves included in the data pool.
Source: own elaboration

26
Chart 9.
Coefficients selected from the differences in differences models in
multinomial regressions. Dependent Variable (DV): Employment status.
Cross section data corresponding to the biennia between 2010 and 2013
(1)
DV: Unemployed DV: Inactive
Coef. Std. Error Coef. Std. Error
Biennia 2010-2011
With UCA and year 2011 -0,042 0,137 -0,106 0,100
N° of observations: 20.170
Biennia 2011-2012
With UCA and year 2012 0,586 0,140 0,738 0,106
N° of observations: 19.065
Biennia 2012-2013
With UCA and year 2013 -0,209 0,144 -0,320 0,112
N° of observations: 18.428
(1). Universe: adults age 18 to 59 belonging to homes with children where there are no
members employed in formal jobs (registered in social security). Control group: adults
from homes that do not benefit from UCA.
Note: Data controlled by gender, age, age squared, education level (categorized in
three levels) position in the home, size of the establishment, type of activity, region of
residence and for each of the waves included in the data pool.
Source: own elaboration


![Recent Trends in Climate Extreme Indices over Sri LankaVinnikov et al. [3], Groisman and Easterling [4], Karl and Knight [5], Zhang et al. [6], Groisman et al. [7] and Griffiths and](https://img.pdfslide.us/doc/110x75/608a2fb35804382e8727b0c7/recent-trends-in-climate-extreme-indices-over-sri-lanka-vinnikov-et-al-3-groisman.jpg)