Embed Size (px)
Citation preview
1
© 2011 Wellesley Information Services. All rights reserved.
Accelerate In-Memory Queries with SAP BusinessObjects Explorer, Accelerated VersionDr. Bjarne BergComerit
In This Session …
• You will learn how SAP BusinessObjects Explorer adds very fast ad-hoc search capabilities to your warehouse and the infrastructure needed to deploy it
• You will also learn how to format the output, see a step-by-step demo on how the tool works, and explore how to plan for BW-Explorer in your organization.
• You will also see the milestone plan for installing BW-Explorer and technical considerations for a successful implementation
3

4
What We’ll Cover …
• SAP BusinessObjects Explorer overview• Understanding ad hoc search• A step-by-step demo of analysis and formatting• Installing and managing SAP BusinessObjects Explorer• Planning and budgeting for SAP BusinessObjects Explorer• Wrap-up
5
Why SAP BusinessObjects Explorer?
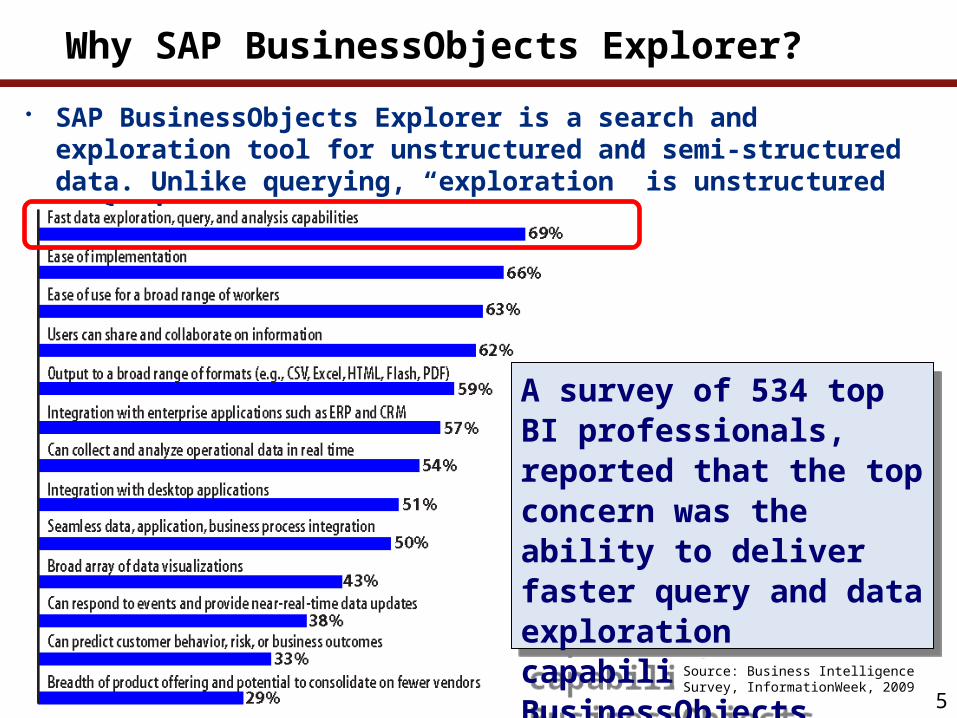
• SAP BusinessObjects Explorer is a search and exploration tool for unstructured and semi-structured data. Unlike querying, “exploration” is unstructured analysis.
A survey of 534 top BI professionals, reported that the top concern was the ability to deliver faster query and data exploration capabilities, SAP BusinessObjects Explorer addresses this need
A survey of 534 top BI professionals, reported that the top concern was the ability to deliver faster query and data exploration capabilities, SAP BusinessObjects Explorer addresses this need
Source: Business Intelligence Survey, InformationWeek, 2009
6
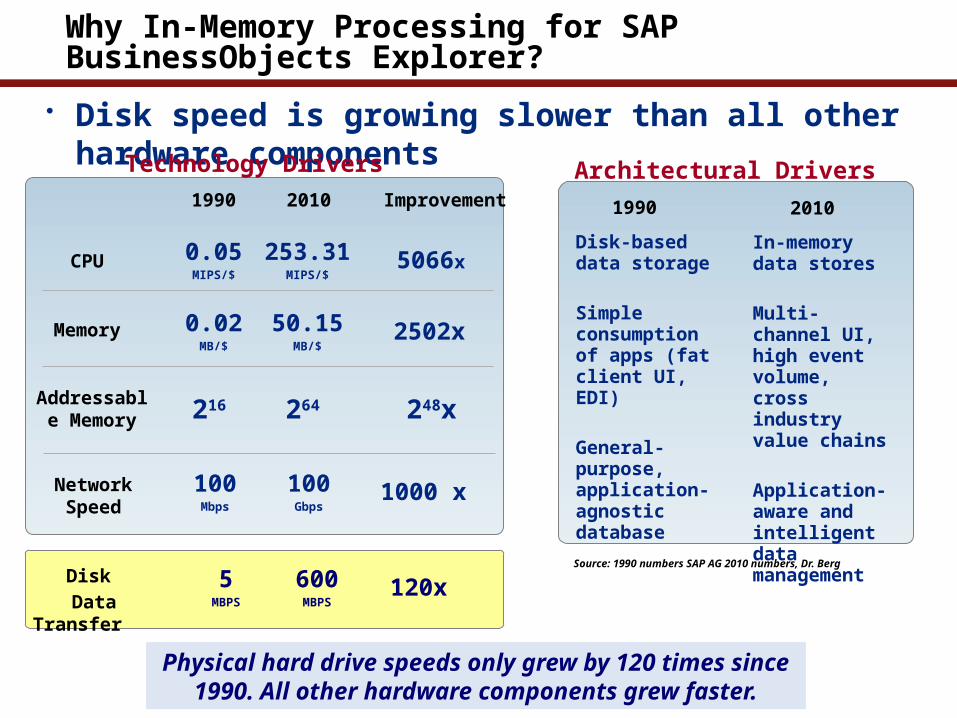
Why In-Memory Processing for SAP BusinessObjects Explorer?
• Disk speed is growing slower than all other hardware components
In-memory data stores
Multi-channel UI, high event volume, cross industry value chains
Application-aware and intelligent data management
Disk-based data storage
Simple consumption of apps (fat client UI, EDI)
General-purpose, application-agnostic database
1990 2010
Architectural Drivers Improvement20101990
216 Addressable
Memory
2502x50.15MB/$
0.02MB/$
Memory
5066x253.31MIPS/$
0.05MIPS/$
CPU
Technology Drivers
600MBPS
5MBPS
Disk
Data Transfer
120x
1000 x100Gbps
100Mbps
Network Speed
264 248x
Source: 1990 numbers SAP AG 2010 numbers, Dr. Berg
Physical hard drive speeds only grew by 120 times since 1990. All other hardware components grew faster.
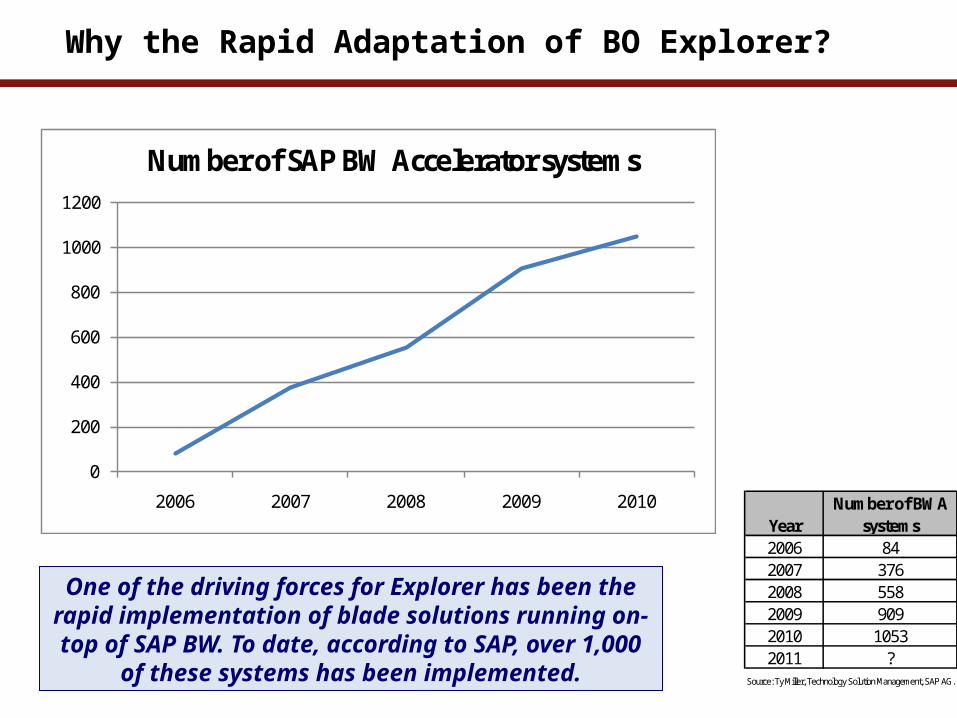
Why the Rapid Adaptation of BO Explorer?
One of the driving forces for Explorer has been the rapid implementation of blade solutions running on-
top of SAP BW. To date, according to SAP, over 1,000 of these systems has been implemented.
0
200
400
600
800
1000
1200
2006 2007 2008 2009 2010
Number of SAP BW Accelerator systems
YearNumber of BWA
systems2006 842007 3762008 5582009 9092010 10532011 ?
Source: Ty Miller, Technology Solution Management, SAP AG.
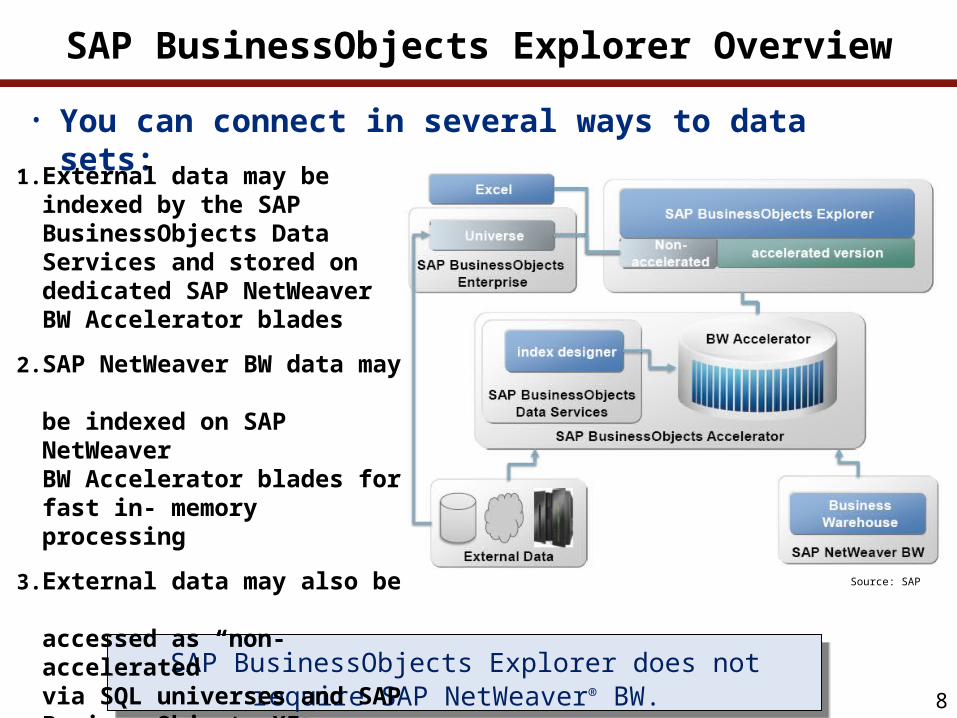
SAP BusinessObjects Explorer Overview
• You can connect in several ways to data sets:
8
Source: SAP
SAP BusinessObjects Explorer does not require SAP NetWeaver® BW. You can accelerate all data sources.
SAP BusinessObjects Explorer does not require SAP NetWeaver® BW. You can accelerate all data sources.
1. External data may be indexed by the SAP BusinessObjects Data Services and stored on dedicated SAP NetWeaver BW Accelerator blades
2. SAP NetWeaver BW data may be indexed on SAP NetWeaver BW Accelerator blades for fast in- memory processing
3. External data may also be accessed as “non-accelerated” via SQL universes and SAP BusinessObjects XI
4. Excel spreadsheets may also be accessed
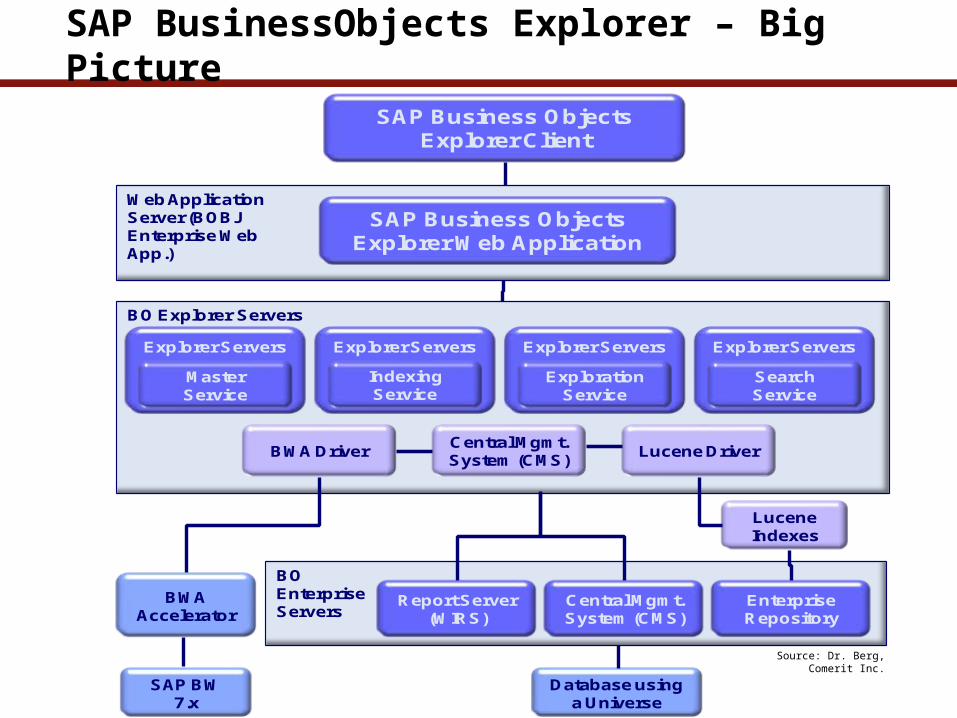
SAP BusinessObjects Explorer – Big Picture
Web Application Server (BOBJEnterprise Web App.)
BO Explorer Servers
BO Enterprise Servers
SAP Business Objects Explorer Client
SAP Business Objects Explorer Web Application
Explorer Servers Explorer Servers Explorer Servers Explorer Servers
Report Server(WIRS)
Central Mgmt. System (CMS)
Enterprise Repository
Master Service
Indexing Service
Exploration Service
Search Service
Database usinga Universe
BWAAccelerator
SAP BW7.x
BWA DriverCentral Mgmt. System (CMS)
Lucene Driver
Lucene Indexes
Source: Dr. Berg, Comerit Inc.
10
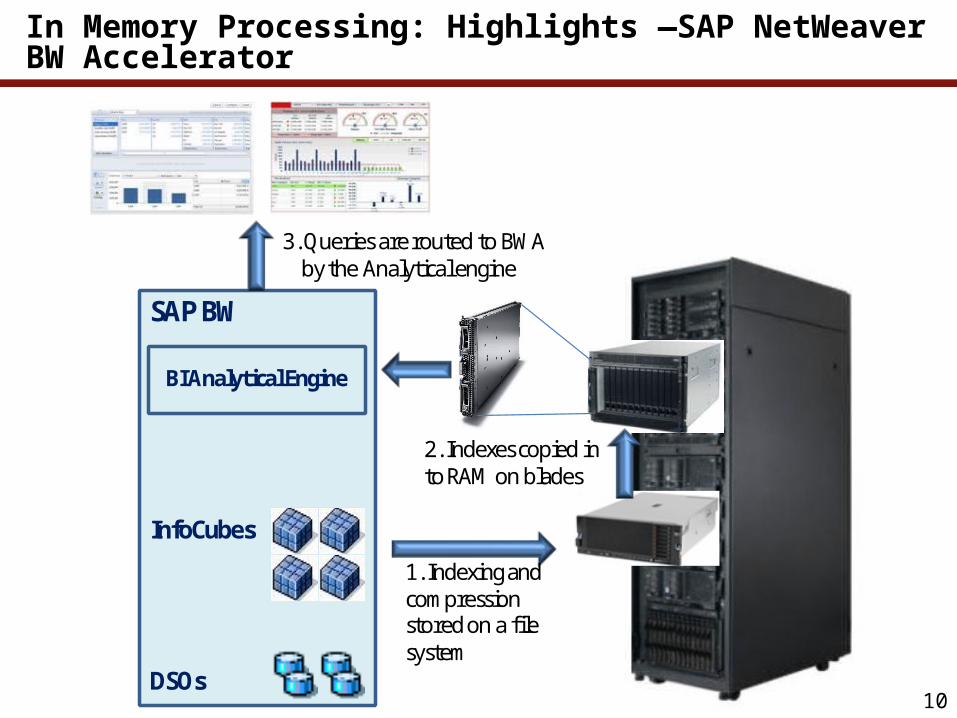
In Memory Processing: Highlights —SAP NetWeaver BW Accelerator
SAP BW
InfoCubes
DSOs
1. Indexing and compression stored on a file system
2. Indexes copied into RAM on blades
BI Analytical Engine
3. Queries are routed to BWA by the Analytical engine
11
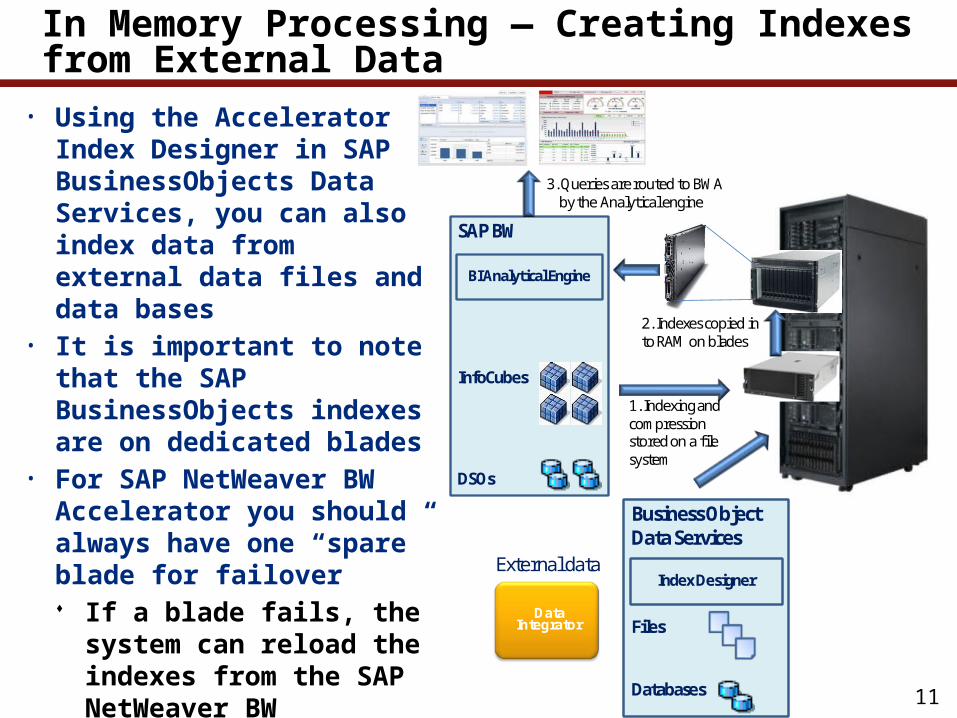
In Memory Processing — Creating Indexes from External Data
SAP BW
InfoCubes
DSOs
1. Indexing and compression stored on a file system
2. Indexes copied into RAM on blades
BI Analytical Engine
3. Queries are routed to BWA by the Analytical engine
Business Object Data Services
Files
Databases
Index DesignerExternal data
• Using the Accelerator Index Designer in SAP BusinessObjects Data Services, you can also index data from external data files and data bases
• It is important to note that the SAP BusinessObjects indexes are on dedicated blades
• For SAP NetWeaver BW Accelerator you should always have one “spare” blade for failover If a blade fails, the system can
reload the indexes from the SAP NetWeaver BW Accelerator file system (i.e., GPFS).
• For the SAP BusinessObjects Explorer blade, you can use only one blade
DataIntegrator
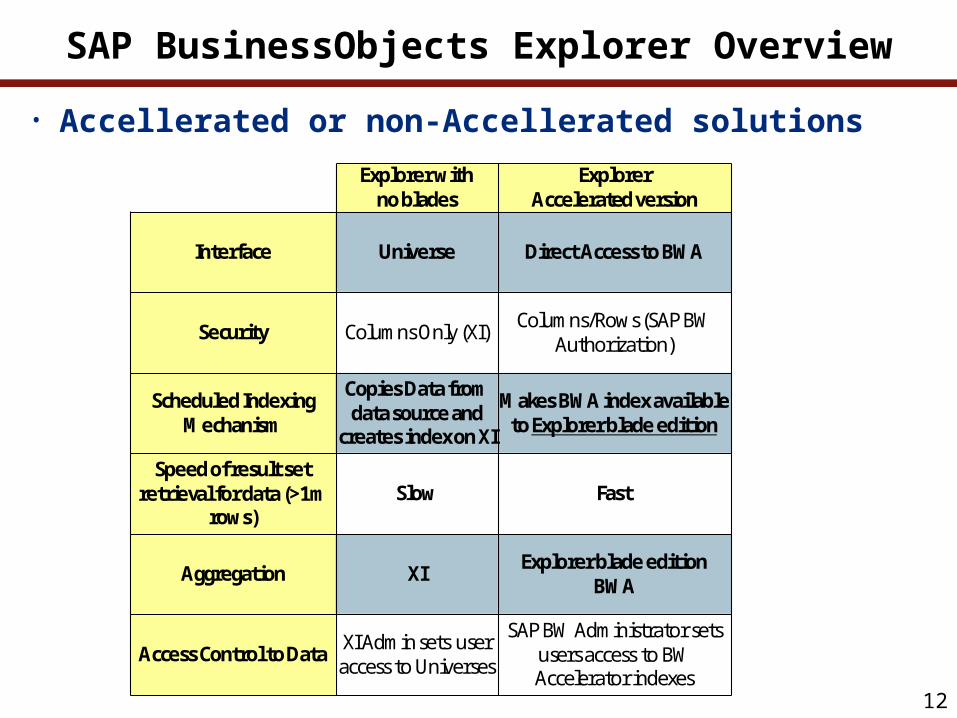
SAP BusinessObjects Explorer Overview
• Accellerated or non-Accellerated solutions
12
Explorer with no blades
Explorer Accelerated version
Interface Universe Direct Access to BWA
Security Columns Only (XI) Columns/Rows (SAP BW Authorization)
Scheduled Indexing Mechanism
Copies Data from data source and
creates index on XI
Makes BWA index available to Explorer blade edition
Speed of result set retrieval for data (>1m
rows)Slow Fast
Aggregation XI Explorer blade editionBWA
Access Control to Data XI Admin sets user access to Universes
SAP BW Administrator sets users access to BW Accelerator indexes
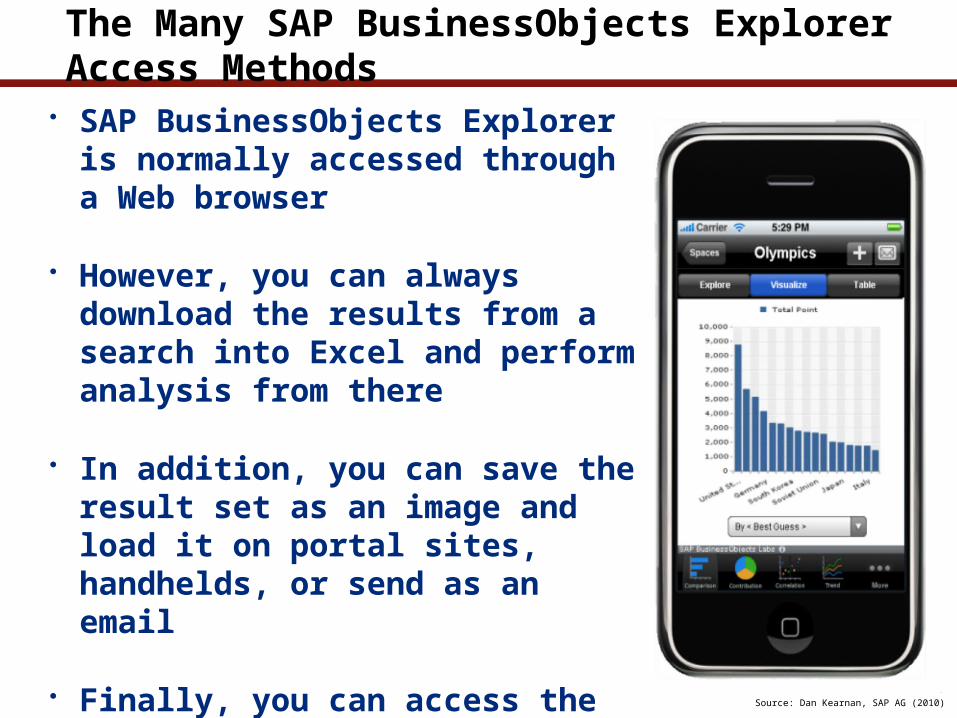
The Many SAP BusinessObjects Explorer Access Methods
• SAP BusinessObjects Explorer is normally accessed through a Web browser
• However, you can always download the results from a search into Excel and perform analysis from there
• In addition, you can save the result set as an image and load it on portal sites, handhelds, or send as an email
• Finally, you can access the SAP BusinessObjects Explorer directly from a handheld device that supports basic Web browser functions
13Source: Dan Kearnan, SAP AG (2010)
14
What We’ll Cover …
• SAP BusinessObjects Explorer overview• Understanding ad hoc search• A step-by-step demo of analysis and formatting• Installing and managing SAP BusinessObjects Explorer• Planning and budgeting for SAP BusinessObjects Explorer• Wrap-up
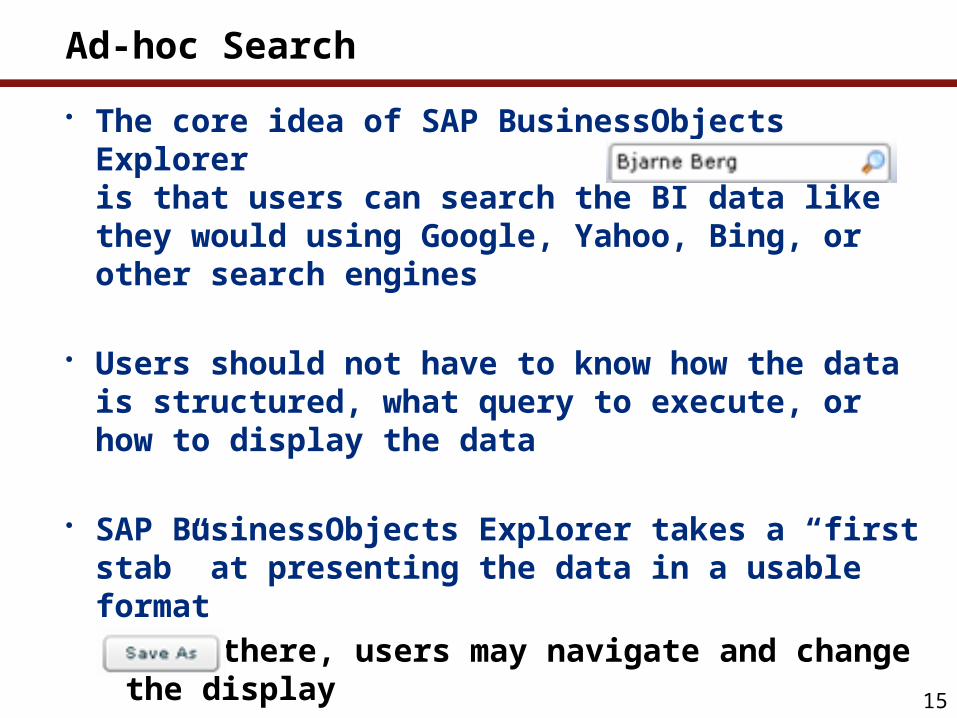
Ad-hoc Search
• The core idea of SAP BusinessObjects Explorer is that users can search the BI data like they would using Google, Yahoo, Bing, or other search engines
• Users should not have to know how the data is structured, what query to execute, or how to display the data
• SAP BusinessObjects Explorer takes a “first stab” at presenting the data in a usable format From there, users may navigate and change the display
• The users may save their settings and the display at any time
15
16
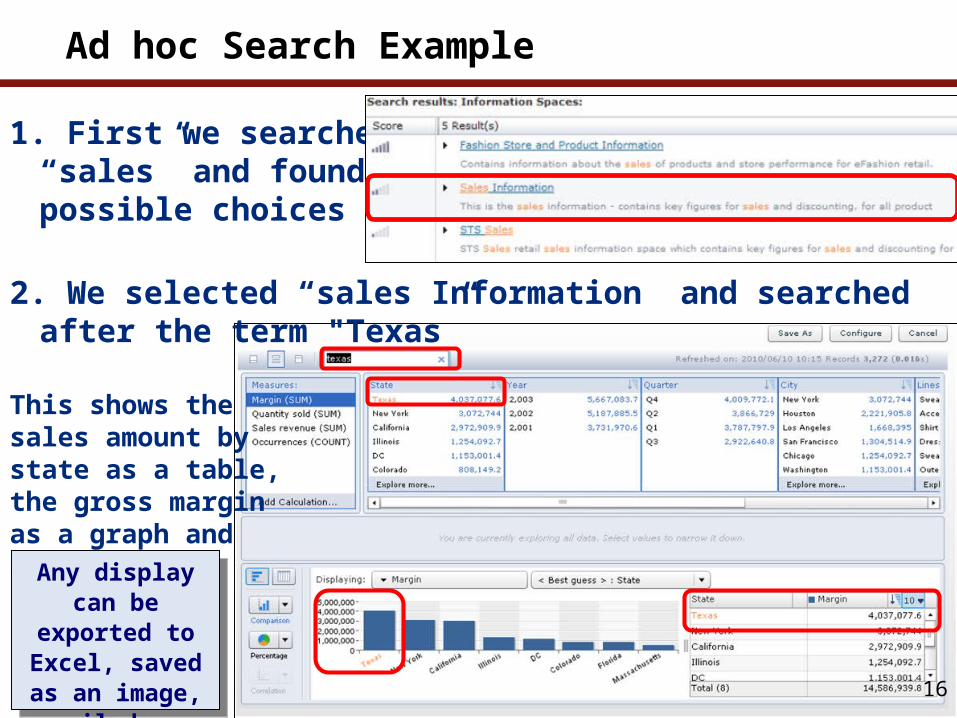
Ad hoc Search Example
1. First we searched on“sales” and found threepossible choices
2. We selected “sales Information” and searched after the term "Texas”
This shows the sales amount by state as a table, the gross margin as a graph and as a table.
Any display can be exported to Excel, saved as an image,
emailed, or bookmarked
Any display can be exported to Excel, saved as an image,
emailed, or bookmarked
17
What We’ll Cover …
• SAP BusinessObjects Explorer overview• Understanding ad hoc search• A step-by-step demo of analysis and formatting• Installing and managing SAP BusinessObjects Explorer• Planning and budgeting for SAP BusinessObjects Explorer• Wrap-up
A Step-By-Step Demo: Searching
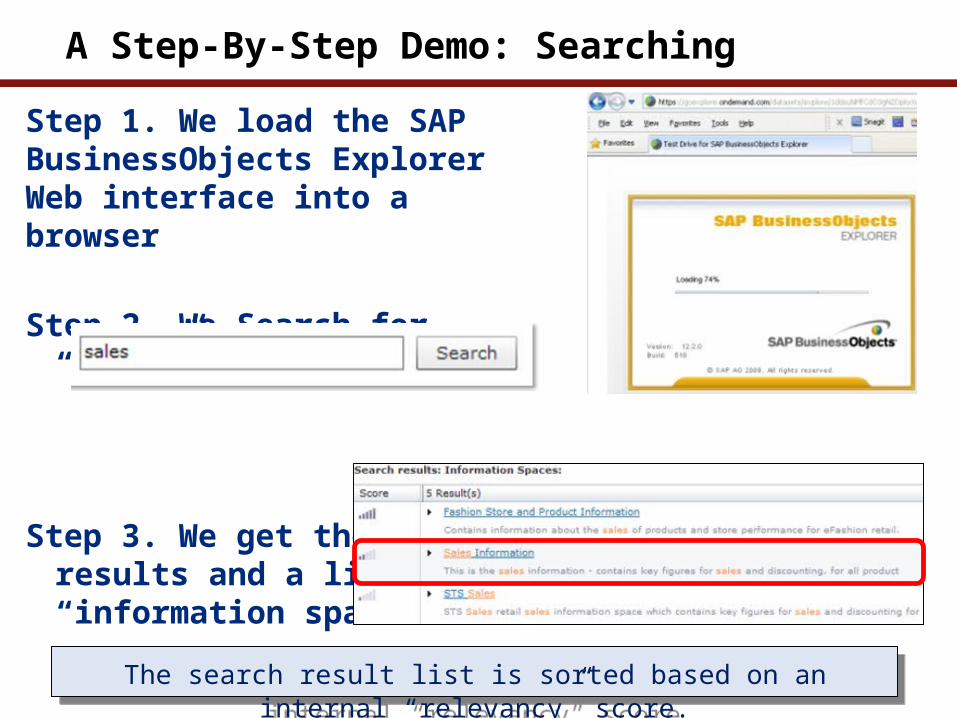
Step 1. We load the SAP BusinessObjects Explorer Web interface into a browser
Step 2. We Search for “sales”
Step 3. We get the searchresults and a list of “information spaces”
The search result list is sorted based on an internal “relevancy” score.The search result list is sorted based on an internal “relevancy” score.
A Step-by-Step Demo: The Initial View
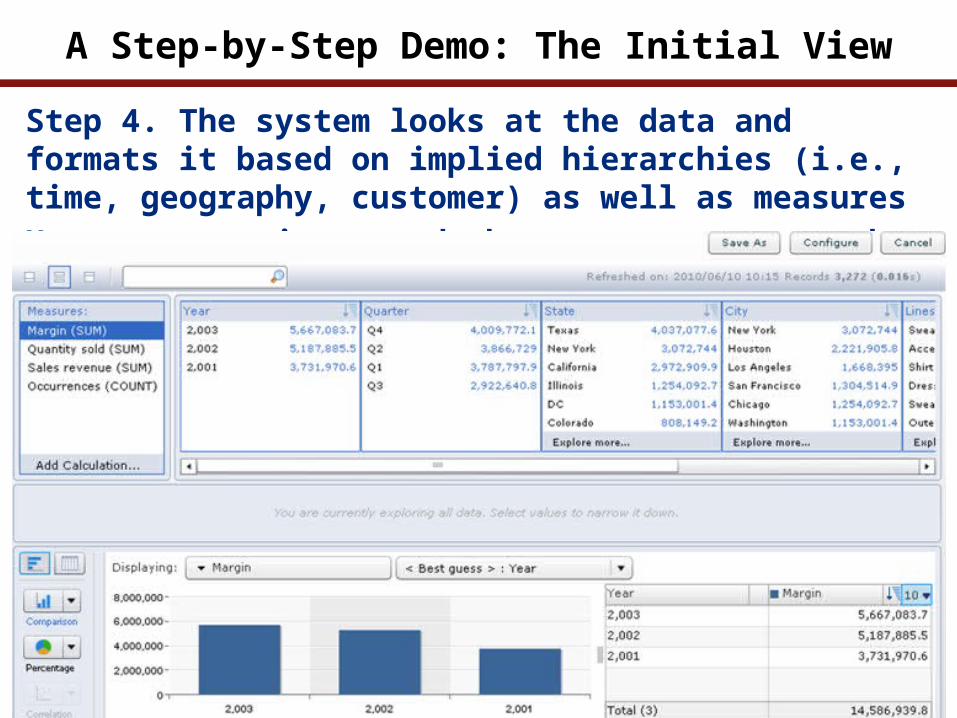
Step 4. The system looks at the data and formats it based on implied hierarchies (i.e., time, geography, customer) as well as measuresUsers may navigate and change measures, graphs, and tables.
A Step-by-Step Demo: Searching in a result set & measures
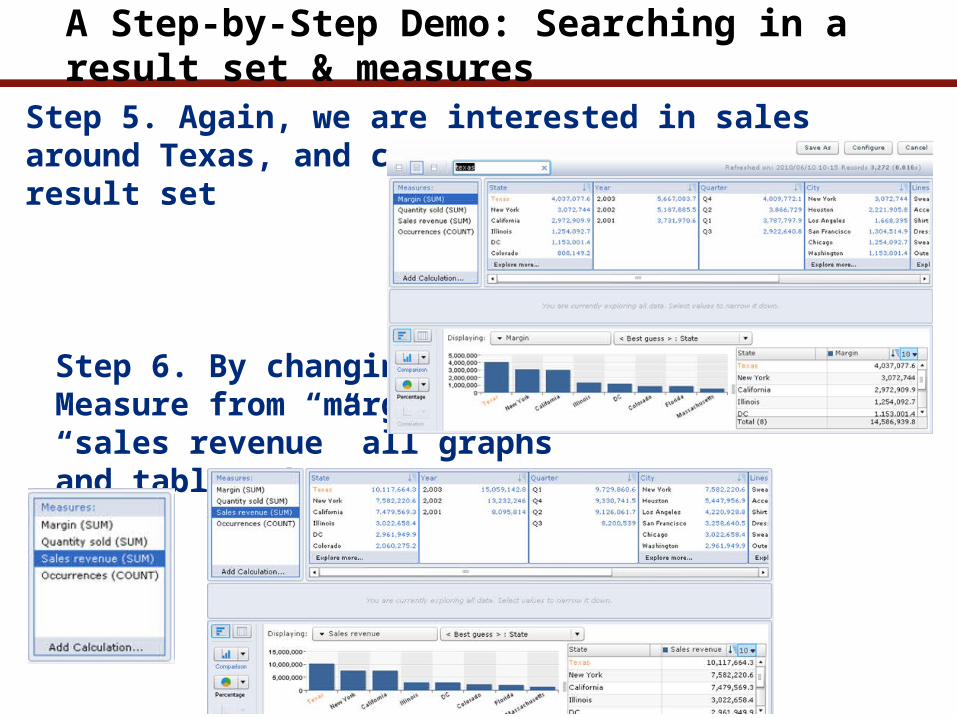
Step 5. Again, we are interested in sales around Texas, and can search the initial result set
Step 6. By changing the Measure from “margin” to“sales revenue” all graphsand tables change
A Step-By-Step Demo: Changing Charts and Drill Down
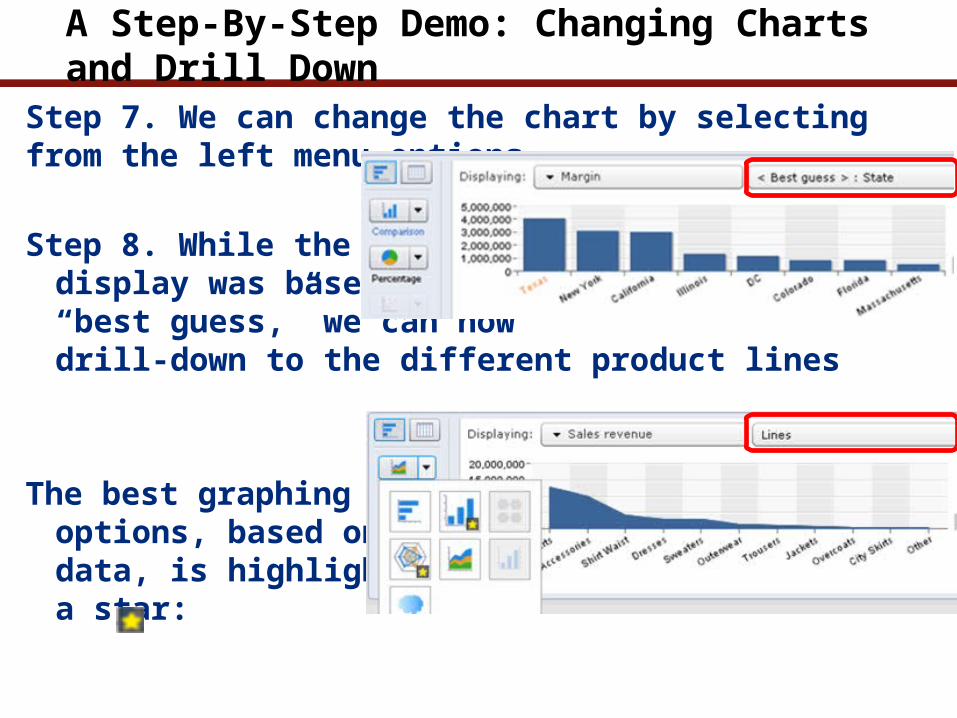
Step 7. We can change the chart by selecting from the left menu options
Step 8. While the firstdisplay was based on the“best guess,” we can nowdrill-down to the different product lines
The best graphingoptions, based on ourdata, is highlighted by a star:
A Step-By-Step Demo: More Graphing Options
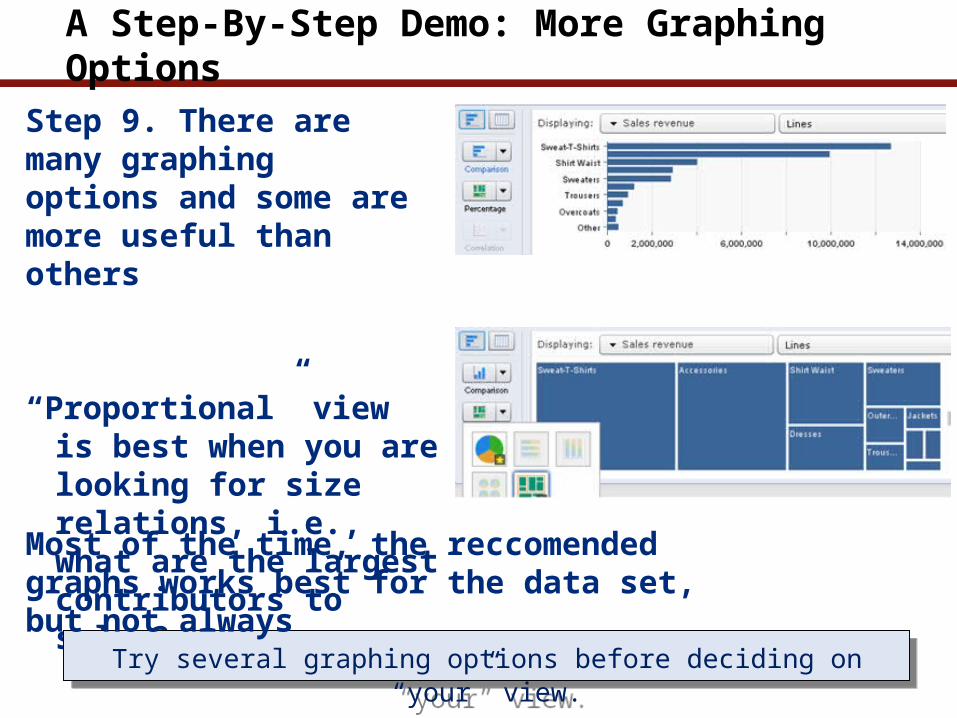
Step 9. There are many graphingoptions and some are more useful than others
“Proportional” view is best when you are looking for size relations, i.e., what are the largest contributors to sales?
Try several graphing options before deciding on “your” view.Try several graphing options before deciding on “your” view.
Most of the time, the reccomended graphs works best for the data set, but not always
A Step-By-Step Demo: Explore More — Filtering
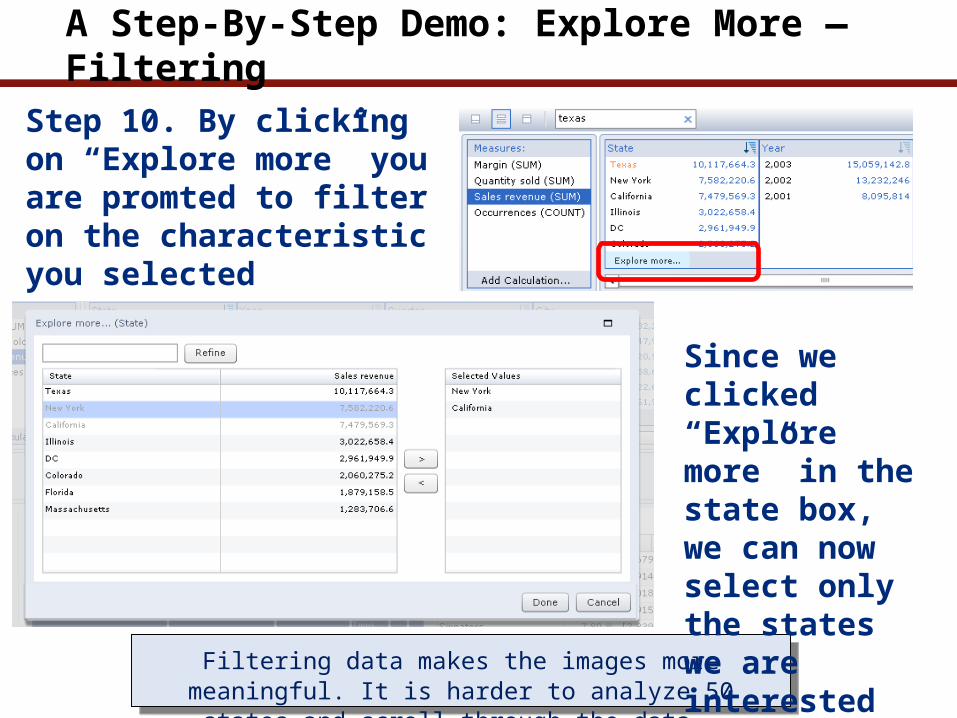
Step 10. By clicking on “Explore more” you are promted to filter on the characteristic you selected
Filtering data makes the images more meaningful. It is harder to analyze 50 states and scroll through the data.
Filtering data makes the images more meaningful. It is harder to analyze 50 states and scroll through the data.
Since we clicked “Explore more” in the state box, we can now select only the states we are interested in
A Step-By-Step Demo: Filter Results
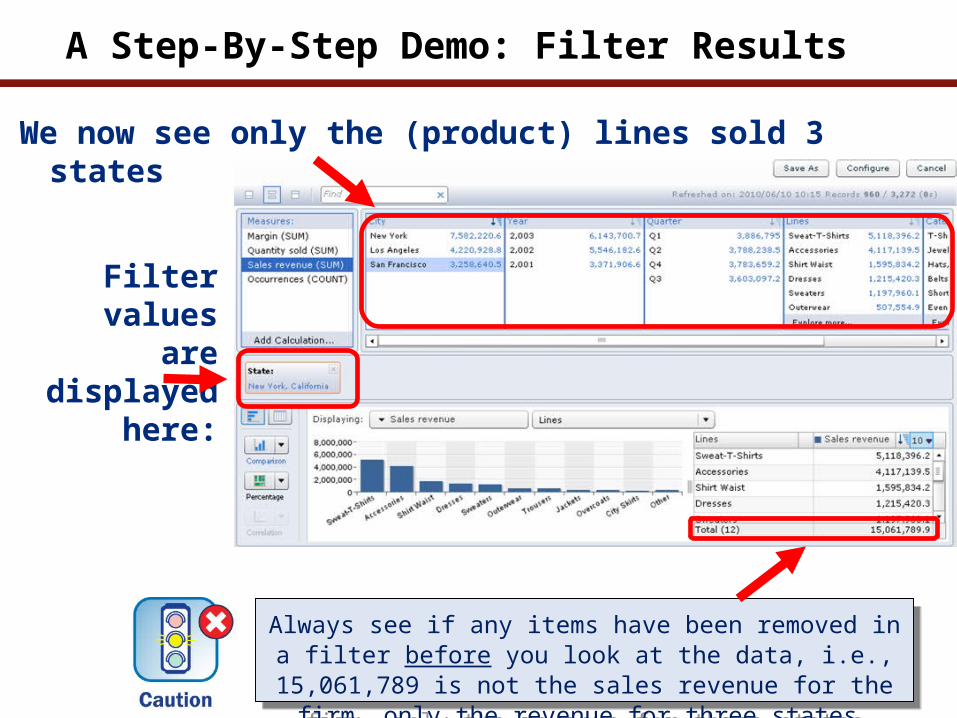
We now see only the (product) lines sold 3 states
Always see if any items have been removed in a filter before you look at the data, i.e., 15,061,789 is not the sales
revenue for the firm, only the revenue for three states.
Always see if any items have been removed in a filter before you look at the data, i.e., 15,061,789 is not the sales
revenue for the firm, only the revenue for three states.
Filter values are displayed
here:
A Step-By-Step Demo: The Visualization Panel
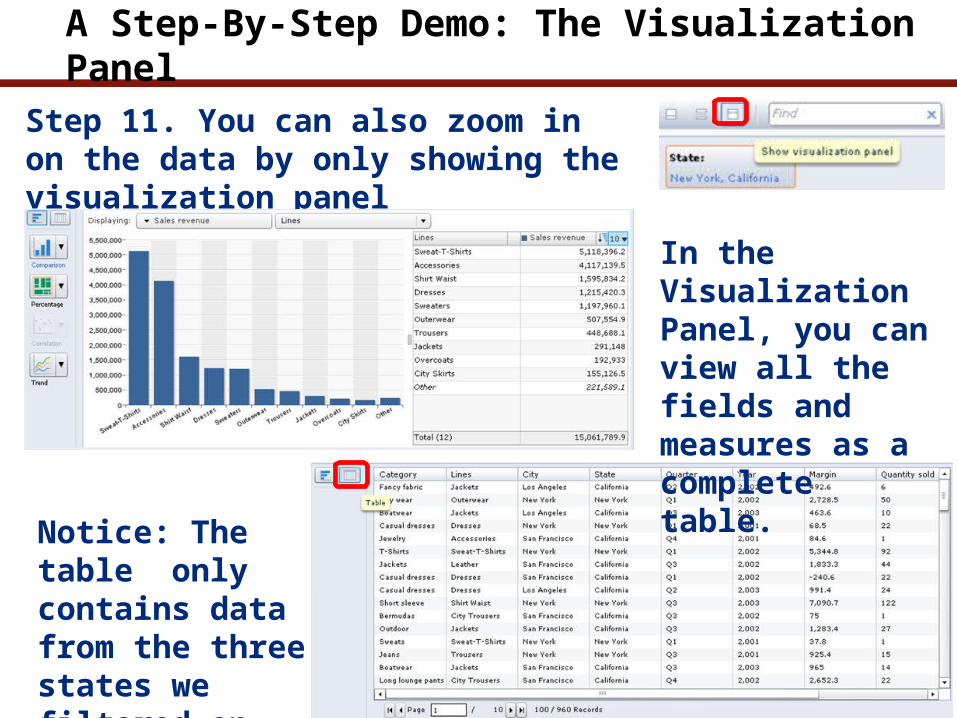
Step 11. You can also zoom in on the data by only showing the visualization panel
In the Visualization Panel, you can view all the fields and measures as a complete table.
Notice: The table only contains data from the three states we filtered on.
A Step-By-Step Demo: Top-10 Analysis
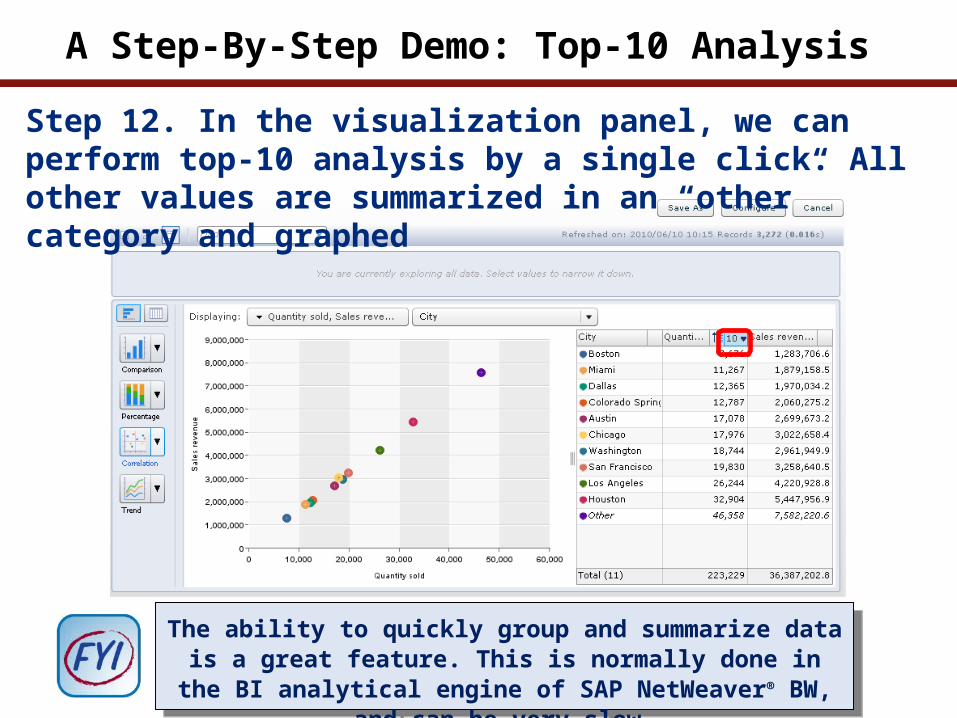
Step 12. In the visualization panel, we can perform top-10 analysis by a single click. All other values are summarized in an “other” category and graphed
The ability to quickly group and summarize data is a great feature. This is normally done in the BI analytical engine of
SAP NetWeaver® BW, and can be very slow.
The ability to quickly group and summarize data is a great feature. This is normally done in the BI analytical engine of
SAP NetWeaver® BW, and can be very slow.
A Step-By-Step Demo: Other Display Options
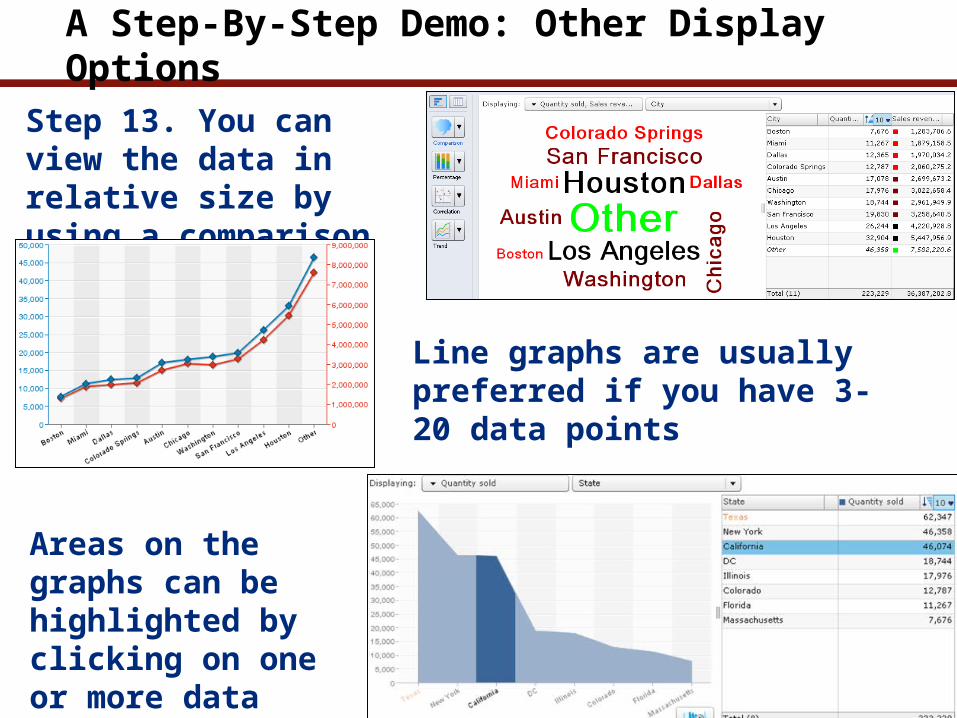
Step 13. You can view the data in relative size by using a comparison graph
Line graphs are usually preferred if you have 3-20 data points
Areas on the graphs can be highlighted by clicking on one or more data points
A Step-By-Step Demo: Sorting and New Calculations
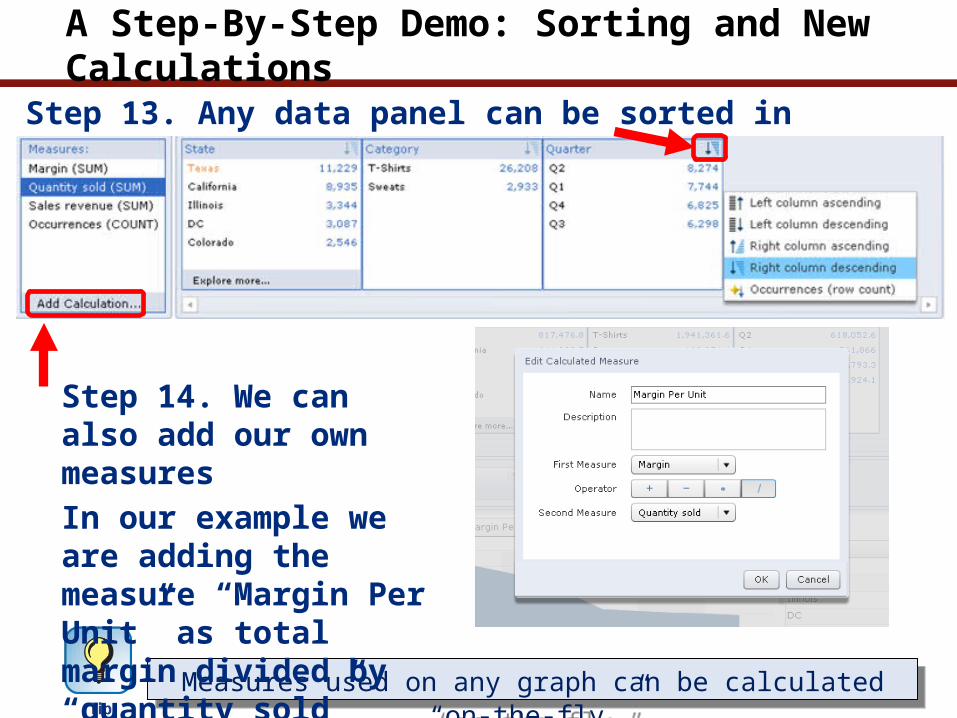
Step 13. Any data panel can be sorted in many ways
Measures used on any graph can be calculated “on-the-fly.”Measures used on any graph can be calculated “on-the-fly.”
Step 14. We can also add our own measuresIn our example we are adding the measure “Margin Per Unit” as total margin divided by “quantity sold”
A Step-By-Step Demo: Mini-OLAP Example
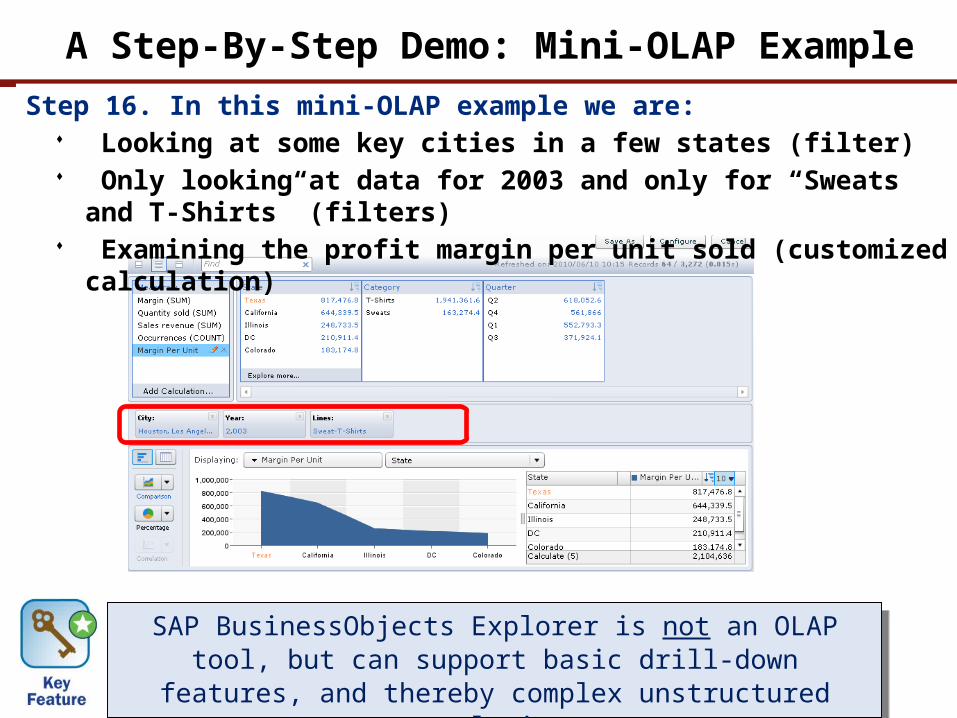
Step 16. In this mini-OLAP example we are: Looking at some key cities in a few states (filter) Only looking at data for 2003 and only for “Sweats and T-Shirts” (filters) Examining the profit margin per unit sold (customized calculation)
SAP BusinessObjects Explorer is not an OLAP tool, but can support basic drill-down features, and thereby complex
unstructured analysis.
SAP BusinessObjects Explorer is not an OLAP tool, but can support basic drill-down features, and thereby complex
unstructured analysis.
A Step-By-Step Demo: Downloading a Data Set
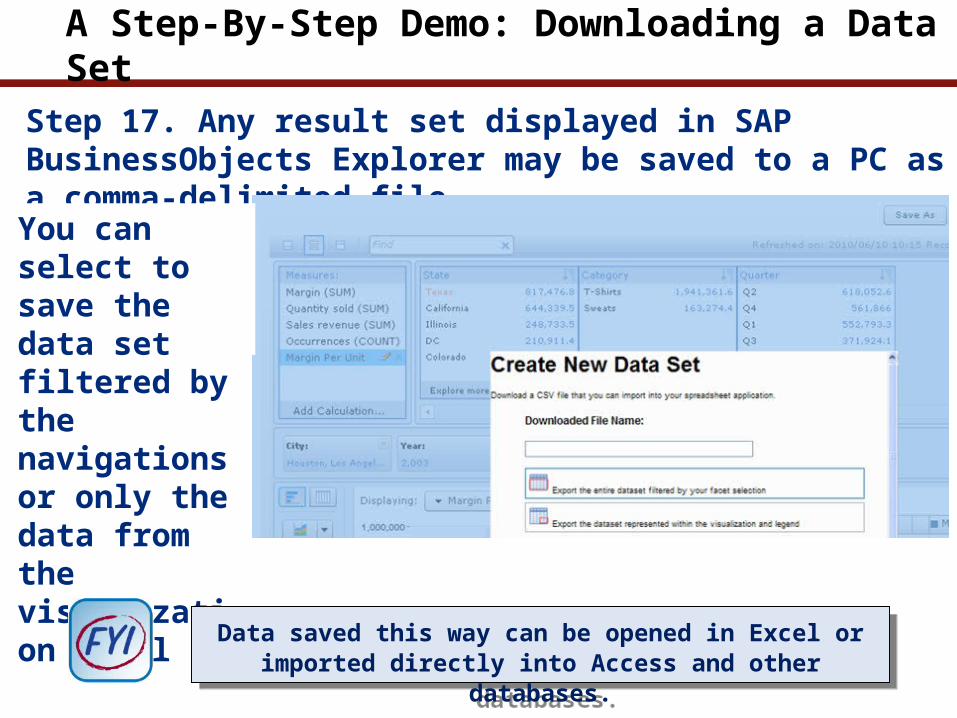
Step 17. Any result set displayed in SAP BusinessObjects Explorer may be saved to a PC as a comma-delimited file
You can select to save the data set filtered by the navigations or only the data from the visualization panel
Data saved this way can be opened in Excel or imported directly into Access and other databases.
Data saved this way can be opened in Excel or imported directly into Access and other databases.
A Step-By-Step Demo: Configuring Measures
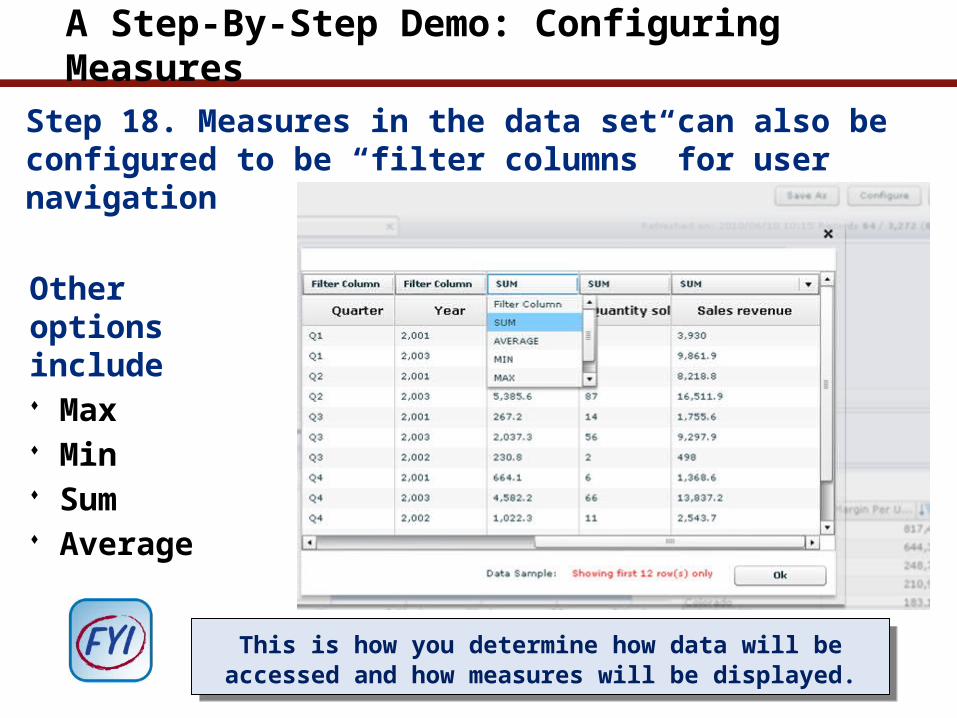
Step 18. Measures in the data set can also be configured to be “filter columns” for user navigation
Other options include Max Min Sum Average
This is how you determine how data will be accessed and how measures will be displayed.
This is how you determine how data will be accessed and how measures will be displayed.
HINT : Connectivity, Network, and Non-Logical Calculations
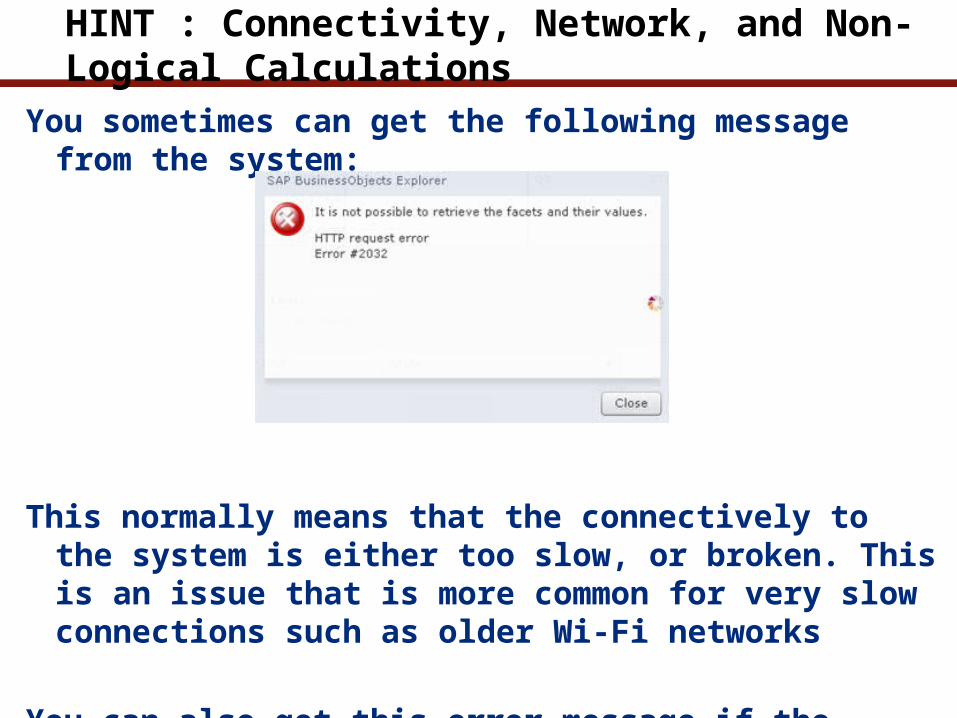
You sometimes can get the following message from the system:
This normally means that the connectively to the system is either too slow, or broken. This is an issue that is more common for very slow connections such as older Wi-Fi networks
You can also get this error message if the result set you requested is not available (i.e., non logical calculations)
33
What We’ll Cover …
• SAP BusinessObjects Explorer overview• Understanding ad hoc search• A step-by-step demo of analysis and formatting• Installing and managing SAP BusinessObjects Explorer• Planning and budgeting for SAP BusinessObjects Explorer• Wrap-up
34
SAP BusinessObjects Explorer Required and Optional Components
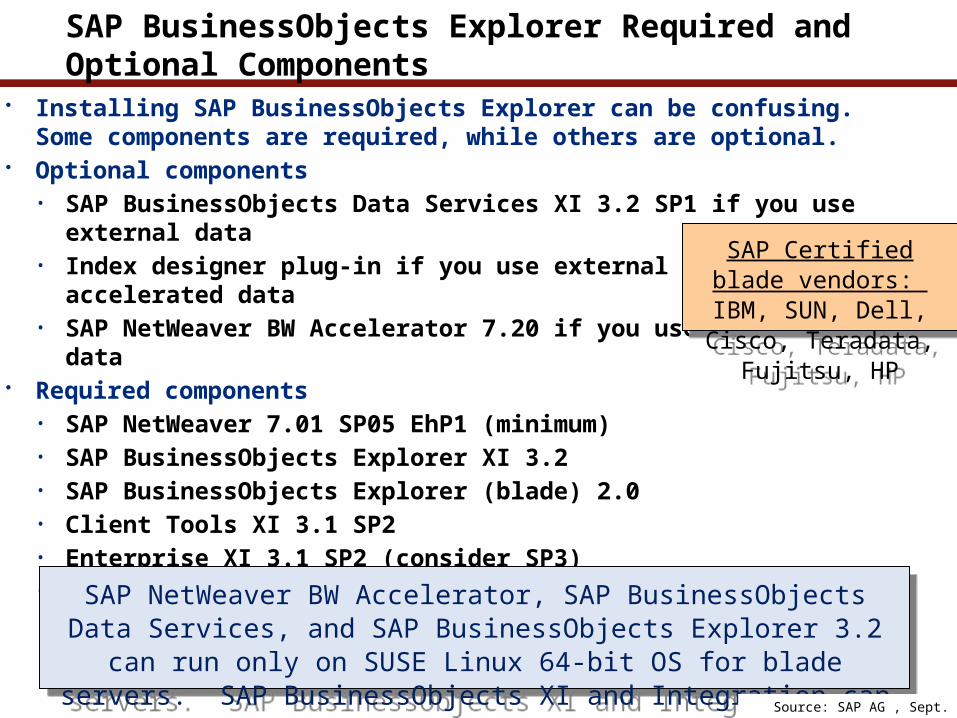
• Installing SAP BusinessObjects Explorer can be confusing. Some components are required, while others are optional.
• Optional components• SAP BusinessObjects Data Services XI 3.2 SP1 if you use external data• Index designer plug-in if you use external
accelerated data• SAP NetWeaver BW Accelerator 7.20 if you use accelerated data
• Required components• SAP NetWeaver 7.01 SP05 EhP1 (minimum)• SAP BusinessObjects Explorer XI 3.2• SAP BusinessObjects Explorer (blade) 2.0• Client Tools XI 3.1 SP2• Enterprise XI 3.1 SP2 (consider SP3) • Integration XI 3.1 SP2 for SAP
SAP NetWeaver BW Accelerator, SAP BusinessObjects Data Services, and SAP BusinessObjects Explorer 3.2 can run only on SUSE Linux 64-bit OS for blade servers.
SAP BusinessObjects XI and Integration can be on all SAP supported HW & OS.
SAP NetWeaver BW Accelerator, SAP BusinessObjects Data Services, and SAP BusinessObjects Explorer 3.2 can run only on SUSE Linux 64-bit OS for blade servers.
SAP BusinessObjects XI and Integration can be on all SAP supported HW & OS.
Source: SAP AG , Sept. 2010
SAP Certified blade vendors: IBM, SUN, Dell, Cisco, Teradata, Fujitsu, HP
SAP Certified blade vendors: IBM, SUN, Dell, Cisco, Teradata, Fujitsu, HP
Registrar and Take a free test drive
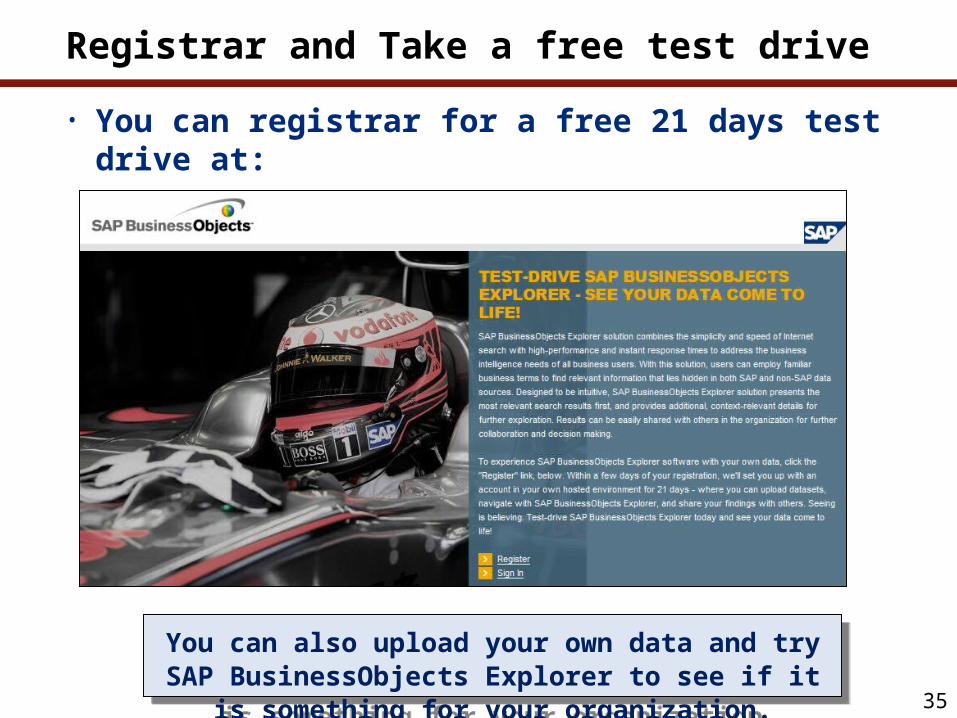
• You can registrar for a free 21 days test drive at: http://goexplore.ondemand.com
35
You can also upload your own data and try SAP BusinessObjects Explorer to see if it is something for your organization.
You can also upload your own data and try SAP BusinessObjects Explorer to see if it is something for your organization.
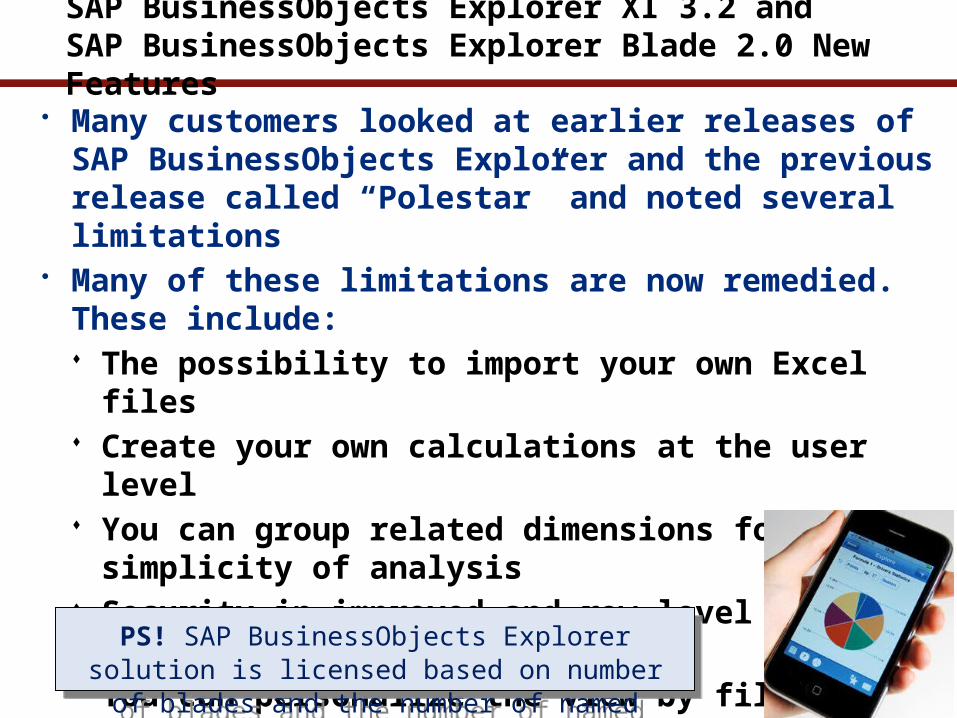
SAP BusinessObjects Explorer XI 3.2 and SAP BusinessObjects Explorer Blade 2.0 New Features
• Many customers looked at earlier releases of SAP BusinessObjects Explorer and the previous release called “Polestar” and noted several limitations
• Many of these limitations are now remedied. These include: The possibility to import your own Excel files Create your own calculations at the user level You can group related dimensions for simplicity of analysis Security in improved and row-level data security can be
implemented You can personalize the view by filtering information Users may navigate hierarchies instead of “flat” data
36
PS! SAP BusinessObjects Explorer solution is licensed based on number of blades and the number of named users.
PS! SAP BusinessObjects Explorer solution is licensed based on number of blades and the number of named users.
SAP NetWeaver BW Accelerator 7.2 New Features
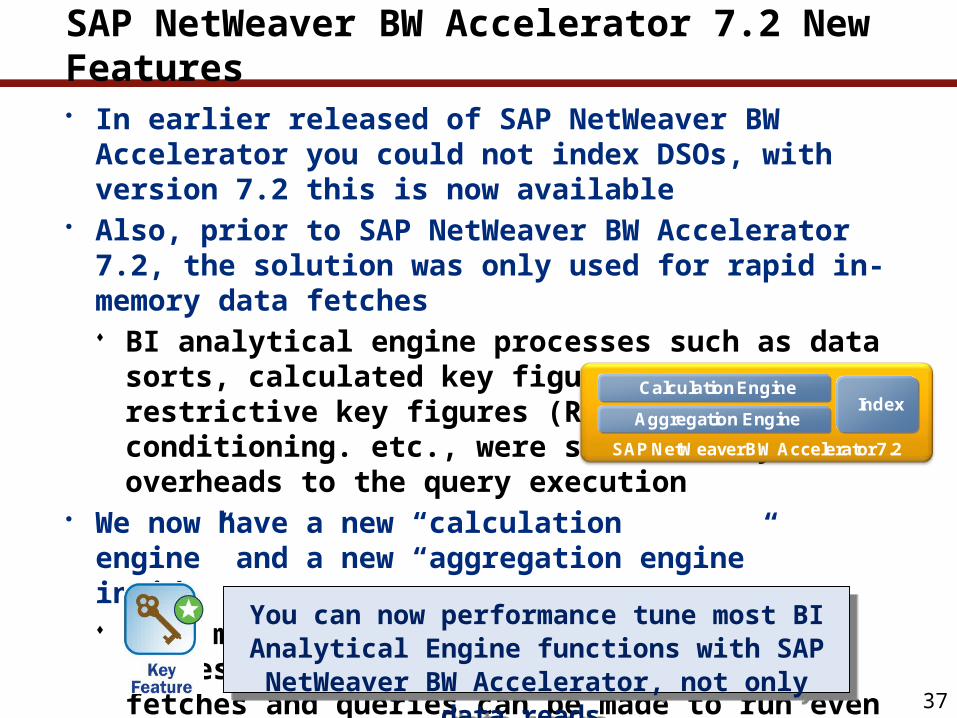
• In earlier released of SAP NetWeaver BW Accelerator you could not index DSOs, with version 7.2 this is now available
• Also, prior to SAP NetWeaver BW Accelerator 7.2, the solution was only used for rapid in-memory data fetches BI analytical engine processes such as data sorts, calculated key
figures (CKF), restrictive key figures (RKF), top-5 conditioning. etc., were still costly overheads to the query execution
• We now have a new “calculation engine” and a new “aggregation engine”inside This means that the benefits of in-memory processing is no longer
confined to data fetches and queries can be made to run even faster
37
You can now performance tune most BI Analytical Engine functions with SAP NetWeaver BW Accelerator, not only
data reads.
You can now performance tune most BI Analytical Engine functions with SAP NetWeaver BW Accelerator, not only
data reads.
SAP NetWeaver BW Accelerator 7.2
Calculation Engine
Aggregation EngineIndex
SAP NetWeaver BW Accelerator 7.2 Features — MultiProviders & Queries
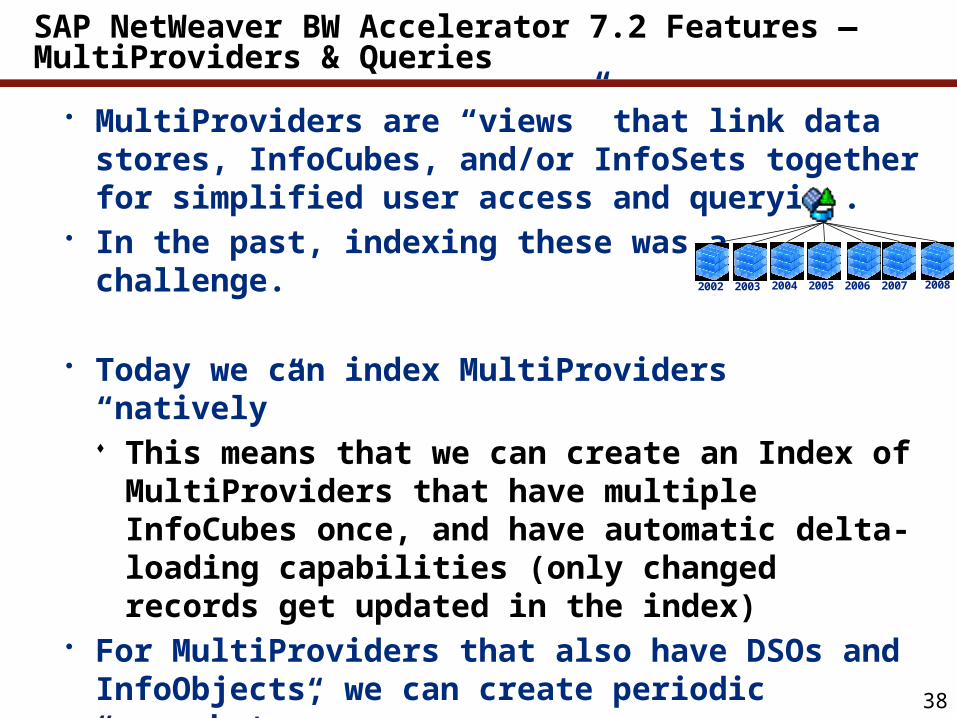
• MultiProviders are “views” that link data stores, InfoCubes, and/or InfoSets together for simplified user access and querying.
• In the past, indexing these was a challenge.
• Today we can index MultiProviders “natively” This means that we can create an Index of MultiProviders that
have multiple InfoCubes once, and have automatic delta-loading capabilities (only changed records get updated in the index)
• For MultiProviders that also have DSOs and InfoObjects, we can create periodic “snapshots”
• Indexes can also be built based on queries This allows you to take advantage of query calculations as part
of the index creation38
2002 2003 2004 2005 2006 2007 2008

39
What We’ll Cover …
• SAP BusinessObjects Explorer overview• Understanding ad hoc search• A step-by-step demo of analysis and formatting• Installing and managing SAP BusinessObjects Explorer• Planning and budgeting for SAP BusinessObjects Explorer• Wrap-up
40
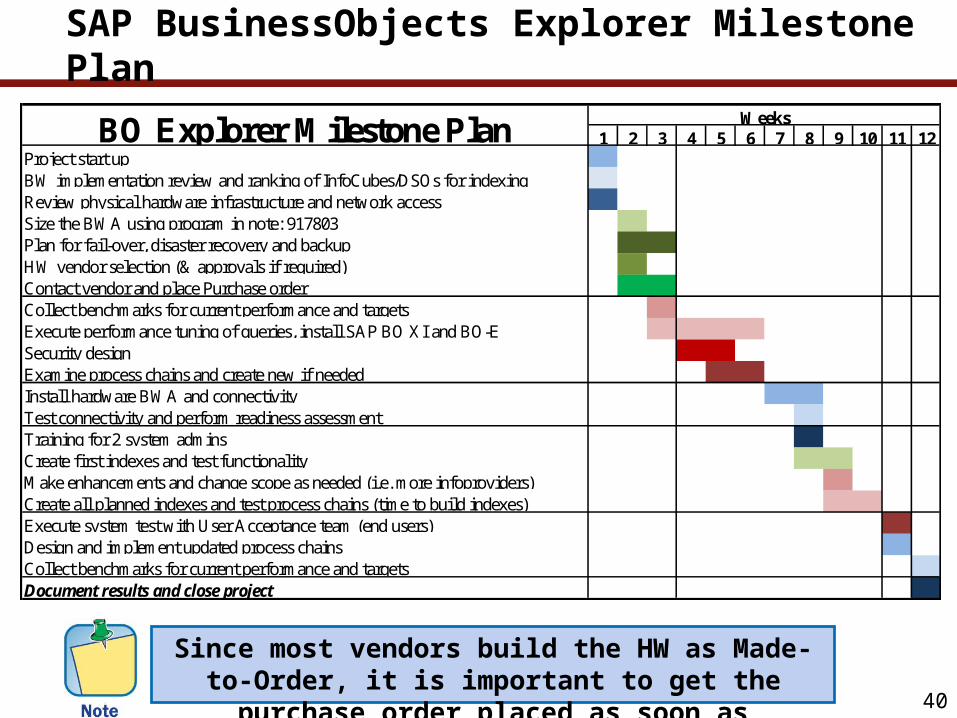
SAP BusinessObjects Explorer Milestone Plan
Since most vendors build the HW as Made-to-Order, it is important to get the purchase order placed as soon as
possible.
1 2 3 4 5 6 7 8 9 10 11 12Project start up BW implementation review and ranking of InfoCubes/DSOs for indexingReview physical hardware infrastructure and network access Size the BWA using program in note: 917803Plan for fail-over, disaster recovery and backupHW vendor selection (& approvals if required)Contact vendor and place Purchase orderCollect benchmarks for current performance and targetsExecute performance tuning of queries, install SAP BO XI and BO-ESecurity designExamine process chains and create new if needed Install hardware BWA and connectivityTest connectivity and perform readiness assessmentTraining for 2 system adminsCreate first indexes and test functionalityMake enhancements and change scope as needed (i.e. more infoproviders)Create all planned indexes and test process chains (time to build indexes)Execute system test with User Acceptance team (end users)Design and implement updated process chainsCollect benchmarks for current performance and targetsDocument results and close project
BO Explorer Milestone Plan Weeks
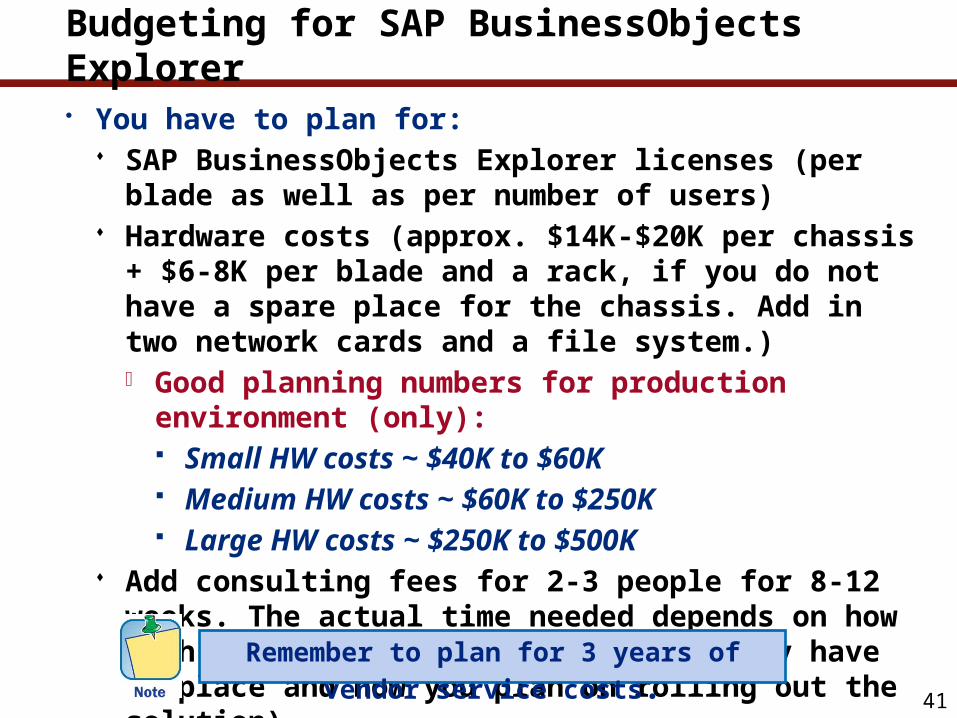
Budgeting for SAP BusinessObjects Explorer
• You have to plan for: SAP BusinessObjects Explorer licenses (per blade as well as per
number of users) Hardware costs (approx. $14K-$20K per chassis + $6-8K per blade
and a rack, if you do not have a spare place for the chassis. Add in two network cards and a file system.) Good planning numbers for production environment (only):
Small HW costs ~ $40K to $60K Medium HW costs ~ $60K to $250K Large HW costs ~ $250K to $500K
Add consulting fees for 2-3 people for 8-12 weeks. The actual time needed depends on how much of the infrastructure you already have in-place and how you plan on rolling out the solution)
41
Remember to plan for 3 years of vendor service costs.
42
What We’ll Cover …
• SAP BusinessObjects Explorer overview• Understanding ad hoc search• A step-by-step demo of analysis and formatting• Installing and managing SAP BusinessObjects Explorer• Planning and budgeting for SAP BusinessObjects Explorer• Wrap-up
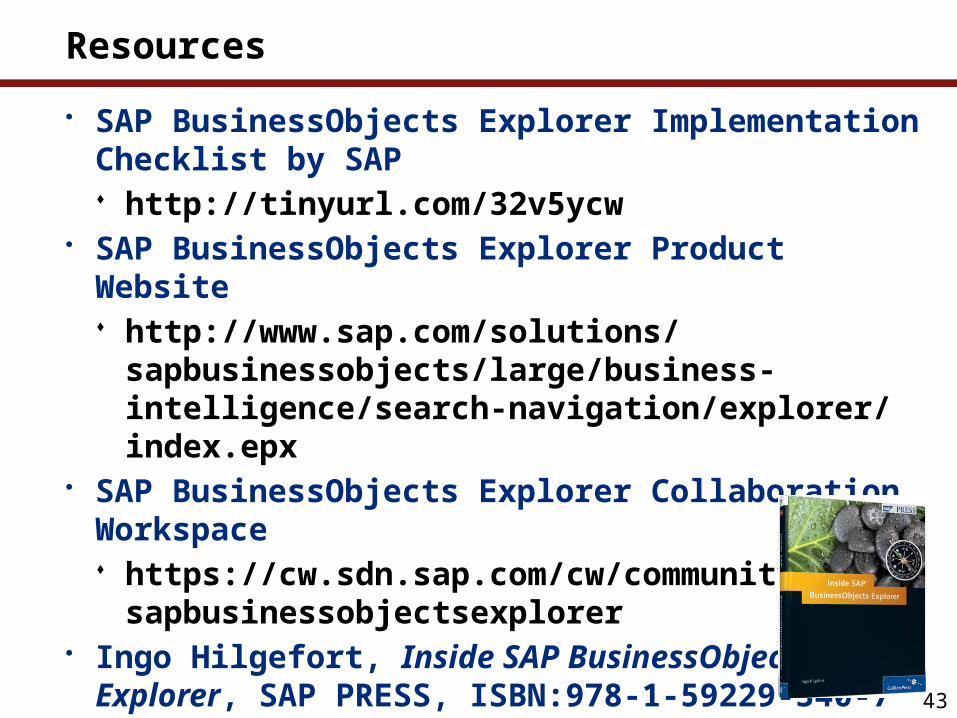
Resources
• SAP BusinessObjects Explorer Implementation Checklist by SAP http://tinyurl.com/32v5ycw
• SAP BusinessObjects Explorer Product Website http://www.sap.com/solutions/sapbusinessobjects/large/
business-intelligence/search-navigation/explorer/index.epx• SAP BusinessObjects Explorer Collaboration Workspace
https://cw.sdn.sap.com/cw/community/sap/sapbusinessobjectsexplorer
• Ingo Hilgefort, Inside SAP BusinessObjects Explorer, SAP PRESS, ISBN:978-1-59229-340-7
43
7 Key Points to Take Home
• SAP BusinessObjects Explorer is a great tool for unstructured, ad hoc analysis
• SAP BusinessObjects Explorer is a specialized tool, it does not replace the other SAP BusinessObjects tools There is a place for OLAP, ad hoc, and formatted reports
• The accelerated version adds real value via in-memory speed• You need to have formal training for end users (consider online
training)• Lead times for hardware orders can be long, purchase early
44
7 Key Points to Take Home (cont.)
• Make sure that the SAP BusinessObjects Explorer project also addresses process chains, performance tuning, and connectivity to other components
• In-memory processing of queries are the future, plan to “get with the program” in 2011 The days of the hard drives for end users in BI is numbered
45
47
Disclaimer
SAP, R/3, mySAP, mySAP.com, SAP NetWeaver®, Duet™®, PartnerEdge, and other SAP products and services mentioned herein as well as their respective logos are trademarks or registered trademarks of SAP AG in Germany and in several other countries all over the world. All other product and service names mentioned are the trademarks of their respective companies. Wellesley Information Services is neither owned nor controlled by SAP.