Embed Size (px)
Citation preview

1 23
Journal of Fusion Energy ISSN 0164-0313 J Fusion EnergDOI 10.1007/s10894-015-9964-x
First Experimental Campaign toDemonstrate STARDUST-Upgrade FacilityDiagnostics Capability to Investigate LOVAConditions
L. A. Poggi, A. Malizia, J. F. Ciparisse,M. Gelfusa, A. Murari, S. Pierdiluca,E. Lo Re & P. Gaudio
1 23
Your article is protected by copyright and all
rights are held exclusively by Springer Science
+Business Media New York. This e-offprint is
for personal use only and shall not be self-
archived in electronic repositories. If you wish
to self-archive your article, please use the
accepted manuscript version for posting on
your own website. You may further deposit
the accepted manuscript version in any
repository, provided it is only made publicly
available 12 months after official publication
or later and provided acknowledgement is
given to the original source of publication
and a link is inserted to the published article
on Springer's website. The link must be
accompanied by the following text: "The final
publication is available at link.springer.com”.

ORIGINAL RESEARCH
First Experimental Campaign to Demonstrate STARDUST-Upgrade Facility Diagnostics Capability to Investigate LOVAConditions
L. A. Poggi1 • A. Malizia1 • J. F. Ciparisse1 • M. Gelfusa1 • A. Murari2 •
S. Pierdiluca1 • E. Lo Re1 • P. Gaudio1
� Springer Science+Business Media New York 2015
Abstract Given the urgent need to converge on precise
guidelines for accident management in nuclear fusion
plants, an experimental campaign has been carried out on
the ‘‘STARDUST-Upgrade’’ facility for dust mobilization
phenomena investigation at the University of Rome Tor
Vergata. The main purpose of this preliminary work was to
test the ‘‘STARDUST-Upgrade’’ facility capability to
investigate Loss of Vacuum Accidents (LOVAs) and their
thermo fluid-dynamic consequences. In fact, upper ports of
‘‘STARDUST-Upgrade’’ were used as inlet ports, repro-
ducing coolant loss consequences from the upper part of
the vacuum vessel in the International Thermonuclear
Experimental Reactor (ITER). The facility was tested with
the aim of reproducing LOVAs thermo fluid-dynamic
consequences not only from lower and equatorial level of
an ITER-like vacuum vessel but also from upper part of it.
The diagnostics required for these experimental studies and
the results of this first experimental campaign are
presented.
Keywords Nuclear fusion safety � Dust mobilization �STARDUST-Upgrade � LOVA
Introduction
Fusion power is a promising long-term candidate to satisfy
increasing global energy demand. Substantial fusion power
has been produced in two large magnetic confinement
devices: TFTR (10.7 MW. Princeton, NJ, USA) and JET
(16 MW. Culham, United Kingdom). Moreover, con-
struction for a 500 MW International Thermonuclear
Experimental Reactor (ITER) has begun in Cadarache,
France. ITER is intended to prove the viability of fusion as
an energy source, and to collect the data necessary for the
design and subsequent operation of the first electricity-
producing fusion power plant. The ITER Agreement was
signed by China, the European Union, India, Japan, Korea,
Russia and the United States.
An important issue related to future nuclear fusion
reactors is the large amounts of dust (aerosol particulate
and flakes) produced by energetic plasma–surface interac-
tions (Plasma-Material Interactions, PMIs) due to several
mechanisms (plasma disruptions, edge localized modes
ELM and vertical displacement events VDE) [1–4]. These
mechanisms can cause significant erosion of vacuum vessel
and divertor materials. A sizeable portion of the eroded
material does not adhere to surfaces and dust is generated.
Dust is capable of being re-suspended in case of events like
LOVA (loss of vacuum accident) [5–8]. The dust size
expected in nuclear fusion experiments (such as ITER) is in
the order of microns (between 0.1 and 1000 lm) [5–9]. Re-
suspension phenomena in case of LOVAs can cause serious
hazard to the health of the operators (since particles are
radioactive and of breathable size [10–12]) and can fur-
thermore cause explosions compromising the integrity of
the device and producing non-negligible hazard for the
ambient [13]. Hence, nowadays the dust re-suspension due
to LOVAs is one of the key factors for safety of workers
& L. A. Poggi
1 Associazione EUROFUSION-ENEA, Department of
Industrial Engineering, University of Rome Tor Vergata, Via
del Politecnico 1, 00133 Rome, Italy
2 Consorzio RFX-Associazione EUROFUSION-ENEA per la
Fusione, 35127 Padua, Italy
123
J Fusion Energ
DOI 10.1007/s10894-015-9964-x
Author's personal copy

and security of nuclear plants in projects like ITER and
DEMO (the foreseen Demostration Power Plant).
Several experiments carried out by QEPM Research
Group and other contributors demonstrated that the
exchange flows of dust depend on number, position, length
and shape of breaches, pressure and temperature conditions
and type of fluid [14–31].
Given the urgent need to converge on precise guidelines
for accident management in nuclear fusion plants, an
experimental campaign on dust mobilization phenomena
has been carried out at the University of Rome Tor Vergata
since 2007, in the framework of the activities of the
Quantum Electronics Plasma Physics and Materials
(QEPM) Research Group. The QEPM Research Group
developed a facility (‘‘STARDUST’’, Small Tank for
Aerosol Removal and DUST) in order to reproduce the
thermo fluid-dynamic conditions comparable to those
expected inside the vacuum vessel of the next generation of
experiments (such as ITER) in case of LOVAs due to small
air leakage for two different positions of the leak, at the
equatorial port level and at the divertor port level [18–34].
The dust used inside the ‘‘STARDUST’’ facility presented
particle sizes and physical characteristics comparable with
those created inside the vacuum vessel of nuclear fusion
experiments, and it was made of tungsten, stainless steel
and carbon, similarly to that produced inside the vacuum
vessel of a fusion reactor (as predicted by the Generic Site
Safety Report ITER-GSSR [35]). The consequences of dust
re-suspension due to a LOVA event have been deeply
analyzed by QEPM Research Group with ‘‘STARDUST’’
facility in previous experimental campaign in which the
facility was demonstrated to be capable of reproducing
thermo fluid-dynamic conditions and the dust resuspension
fraction comparable to those expected inside the VV
(Vacuum Vessel) of a nuclear fusion power plant such as
ITER in case of LOVAs [18–31]. Using ‘‘STARDUST’’
facility QEPM Research Group developed and validated an
extruded 2D thermo-fluid dynamic model [17, 24, 25, 30,
32] to analyze the effect of a LOVA on dust. Optical
techniques (PIV [33], Shadowgraph [31, 34]) and numeri-
cal algorithms have been used to perform dust tracking
during resuspension.
Given several limitation of ‘‘STARDUST’’ facility (it
was not possible to simulate LOCAs; field of view inside
the chamber was small for imaging needs; and it was not
possible to replicate LOVAs for more than one accidental
configuration [31, 33, 34]) the QEPM Research Group
designed and implemented mechanical modifications to the
facility.
After ‘‘STARDUST’’ facility was dismantled, an
improved facility (‘‘STARDUST-Upgrade’’) to reproduce
dust re-suspension phenomena was completed in
September 2014 and a preliminary work on this new
facility had been carried out to test its capability to
investigate LOVAs and their thermo fluid-dynamic con-
sequences. The upper ports of ‘‘STARDUST-Upgrade’’
were used as air inlet ports, reproducing both LOVA and
coolant loss consequences from the upper ports of the
vacuum vessel in ITER. Pressurization experiments have
been performed at two different air flow rates (27 and 40 l/
min) to achieve several pressurization rates from about 250
to 400 Pa/s, so including rates expected in GSSR Report in
case of a LOVA event [35]. Air flowed inside the facility’s
vacuum chamber at room temperature from two different
upper ports (C and D, see Figs. 2, 3), to simulate LOVAs
consequences from the upper internal wall of an ITER-like
vacuum vessel. A vacuum rupture in the upper part of the
vessel could involve cooling fluids causing not only
chamber pressurization and air intake but also refrigerant
intake inside the vessel. However, for this first experi-
mental campaign the facility was operated using air as a
model fluid. In addition, for local air velocity calculation
(in the point corresponding to the vessel part causing the
vacuum rupture), pressure transducers array have been
positioned inside ‘‘STARDUST-Upgrade’’ at the outlet of
port C to measure differential pressure of the air flow
during pressurization experiments simulating LOVAs
consequences at different air flow rates and initial internal
pressure of the chamber. Pressure transducers’ voltage
output (mV) was acquired and converted into differential
pressure (Pa) according to its sensitivity, and saved for air
velocity calculation and error analysis.
In conclusion, in this preliminary work we wanted to
measure local air velocity at 1 cm from inlet port used for
air intake inside the facility and to measure temperature of
the chamber and absolute pressure of the chamber. With
‘‘STARDUST-Upgrade’’ facility the vacuum rupture was
reproducible not only from lower and mid-plane section
but also from its upper section, corresponding respectively
to lower, equatorial and upper section of an ITER-like
vacuum vessel. This is just a first step of the experimental
campaign carried out by QEPM Research Group, in terms
of reproduction of the thermo fluid-dynamics comparable
to that expected in vacuum rupture of nuclear fusion
reactor vessel. As a preliminary work to characterize the
environment in which the dust mobilization phenomena
occur hence we performed a fine tuning of the facility with
the aim to reach the scope of the experimental campaign.
The diagnostics required for these experimental studies,
the procedures, and the results of this first experimental
campaign are presented, including a comparison with
predictions obtained with preliminary CFD (Computational
Fluid Dynamics) model developed by QEPM Research
Group.
J Fusion Energ
123
Author's personal copy

STARDUST-Upgrade Facility Overview
‘‘STARDUST-Upgrade’’ facility (Small Tank for Aerosol
Removal and DUST—Upgrade) is composed of a cylin-
drical stainless steel vacuum chamber connected with
diagnostics and data acquisition system that ensure thermo
fluid-dynamic conditions comparable to that present in a
fusion reactor vacuum vessel during LOVAs (e.g. that
prescribed by the Generic Site Safety Report—GSSR [35]).
The QEPM Research Group has designed and implemented
mechanical modifications to ‘‘STARDUST’’ in order to get
a facility with a bigger field of view through the intro-
duction of new windows with a larger diameter together
with the introduction of new air inlet and different lid
configurations, as shown in Fig. 1 [36].
In its new configuration ‘‘STARDUST-Upgrade’’ facil-
ity was used to reproduce not only the consequences of a
LOVA from the equatorial or divertor (i.e. lower) level but
also from the new upper ports C and D shown in Figs. 2
and 3.
These implementation have been designed in 3D with
the software SOLIDWORKS and the mechanical resistance
has been tested numerically (with the same software) to
verify the mechanical resistance of the new facility under
the experimental boundary conditions expected to repro-
duce LOVAs [27]. The final layout of the facility has been
design and built joining the best characteristics of the dif-
ferent layouts numerically tested [36]. Main dimensions of
the facility are reported in Table 1.
Furthermore, a functional scheme of the facility is pre-
sented in Fig. 4. During every experiment data acquisition
was possible for the following quantities: thermocouples
temperatures [T1 (�C), T2 (�C), T3 (�C), T4 (�C)], actual
internal pressure [Ps (Pa)], inlet air flow rate (l/min), dif-
ferential pressure PD from transducers array (Pa) and any
other signal received by the universal cards of the acqui-
sition system [4]. Voltage signal (mV) from the transducers
array was converted into differential pressure (Pa)
according to transducers sensitivity (XCE-093-2D High
Temperature Miniature Pressure Transducers [37, 38]).
In order to correctly reproduce LOVAs similarly to
those expected for ITER vacuum vessel for any sealing
failure, thermo fluid-dynamic conditions were controlled
by the system. Boundary conditions, in terms of initial
Fig. 1 New features in
‘‘STARDUST-Upgrade’’
experimental layout [36]
Fig. 2 New air inlet ports for ‘‘STARDUST-Upgrade’’ facility
J Fusion Energ
123
Author's personal copy
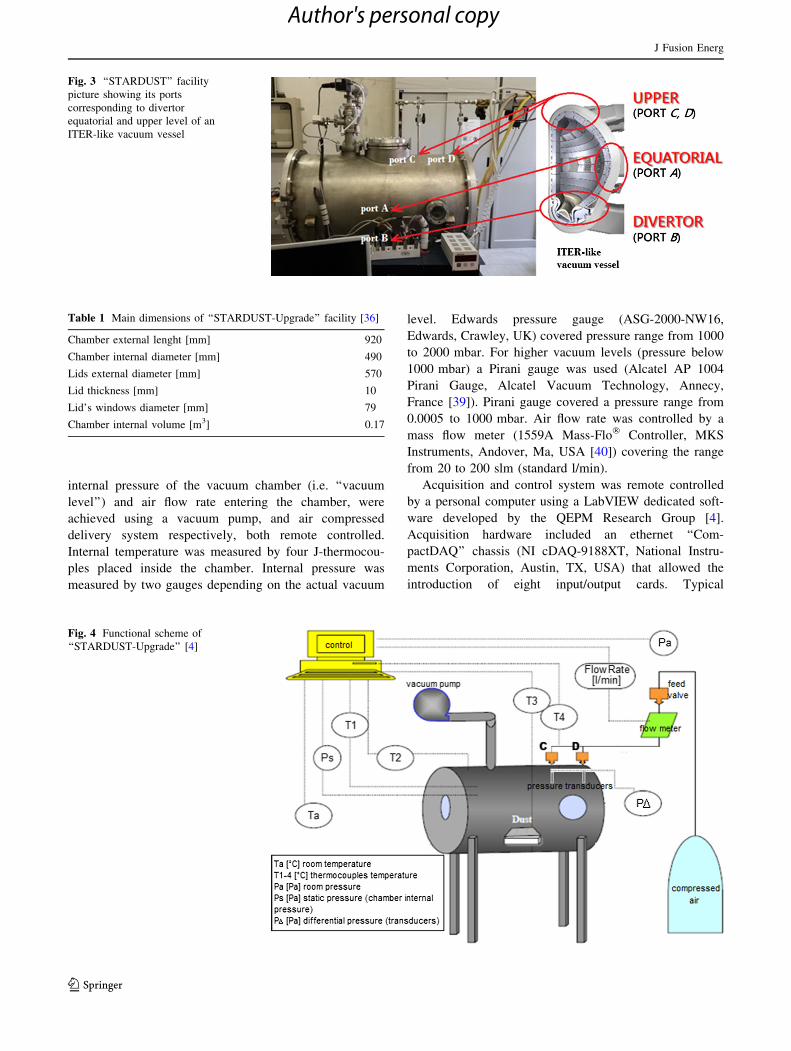
internal pressure of the vacuum chamber (i.e. ‘‘vacuum
level’’) and air flow rate entering the chamber, were
achieved using a vacuum pump, and air compressed
delivery system respectively, both remote controlled.
Internal temperature was measured by four J-thermocou-
ples placed inside the chamber. Internal pressure was
measured by two gauges depending on the actual vacuum
level. Edwards pressure gauge (ASG-2000-NW16,
Edwards, Crawley, UK) covered pressure range from 1000
to 2000 mbar. For higher vacuum levels (pressure below
1000 mbar) a Pirani gauge was used (Alcatel AP 1004
Pirani Gauge, Alcatel Vacuum Technology, Annecy,
France [39]). Pirani gauge covered a pressure range from
0.0005 to 1000 mbar. Air flow rate was controlled by a
mass flow meter (1559A Mass-Flo� Controller, MKS
Instruments, Andover, Ma, USA [40]) covering the range
from 20 to 200 slm (standard l/min).
Acquisition and control system was remote controlled
by a personal computer using a LabVIEW dedicated soft-
ware developed by the QEPM Research Group [4].
Acquisition hardware included an ethernet ‘‘Com-
pactDAQ’’ chassis (NI cDAQ-9188XT, National Instru-
ments Corporation, Austin, TX, USA) that allowed the
introduction of eight input/output cards. Typical
Fig. 3 ‘‘STARDUST’’ facility
picture showing its ports
corresponding to divertor
equatorial and upper level of an
ITER-like vacuum vessel
Fig. 4 Functional scheme of
‘‘STARDUST-Upgrade’’ [4]
Table 1 Main dimensions of ‘‘STARDUST-Upgrade’’ facility [36]
Chamber external lenght [mm] 920
Chamber internal diameter [mm] 490
Lids external diameter [mm] 570
Lid thickness [mm] 10
Lid’s windows diameter [mm] 79
Chamber internal volume [m3] 0.17
J Fusion Energ
123
Author's personal copy

experiment procedures are summarized in the experiment
flowchart shown in Fig. 5.
‘‘STARDUST-Upgrade’’ set-up, border conditions, and
procedures for the experiments performed are described in
detail in the following sections.
Pressurization Experiments
Materials and Methods
As a preliminary trial stage to demonstrate the capa-
bility of ‘‘STARDUST-Upgrade’’ to reproduce the
thermo fluid-dynamic consequences expected in a
LOVA accident, the facility was operated at different air
inlet flow rates from different ports. In this set of
experiments initial internal pressures chosen were 300
and 2000 Pa and final internal pressure was 95,000 Pa.
Ports used were C and D (see Figs. 2, 3), located in the
upper part of the chamber. At least three replications
were carried out for each of the eight experimental
set-ups: 300-27-95-C, 300-27-95-D, 2000-27-95-C,
2000-27-95-D, 300-40-95-C, 300-40-95-D, 2000-40-95-
C, 2000-40-95-D [where ‘‘XXXX-XX-XX-X’’ stands for
‘‘initial pressure (Pa)—flow rate (l/min)—final pressure
(kPa)—port’’].
Air flowed inside the chamber at a known mass flow rate
from selected inlet port when the chamber reached target
pressure (i.e. desired vacuum level). Boundary conditions
were: initial internal pressure (Pa), final pressure (Pa), and
volume flow rate (l/min), that were manually entered in
LabVIEW dedicated software developed by the authors.
Acquisition data sampled at 50 Hz during the entire intake
process included: observation #, actual internal pressure
(Pa), j-thermocouples temperatures T2 (�C), T3 (�C), T4
(�C), intake air volume flow rate (l/min). Data analysis with
Fig. 5 ‘‘STARDUST-
Upgrade’’ typical experiment
protocol flowchart [3]
J Fusion Energ
123
Author's personal copy
Matlab script developed by the authors produced results
presented in following section.
Results
Graphs shown below were produced for each replication
showing trends for the following quantities during the
whole air intake process after vacuum rupture: internal
pressure (Pa); mean temperature (K) (calculated as arith-
metic mean of the three j-thermocouples temperatures T2,
T3, T4, see Fig. 4); air flow rate (l/min).
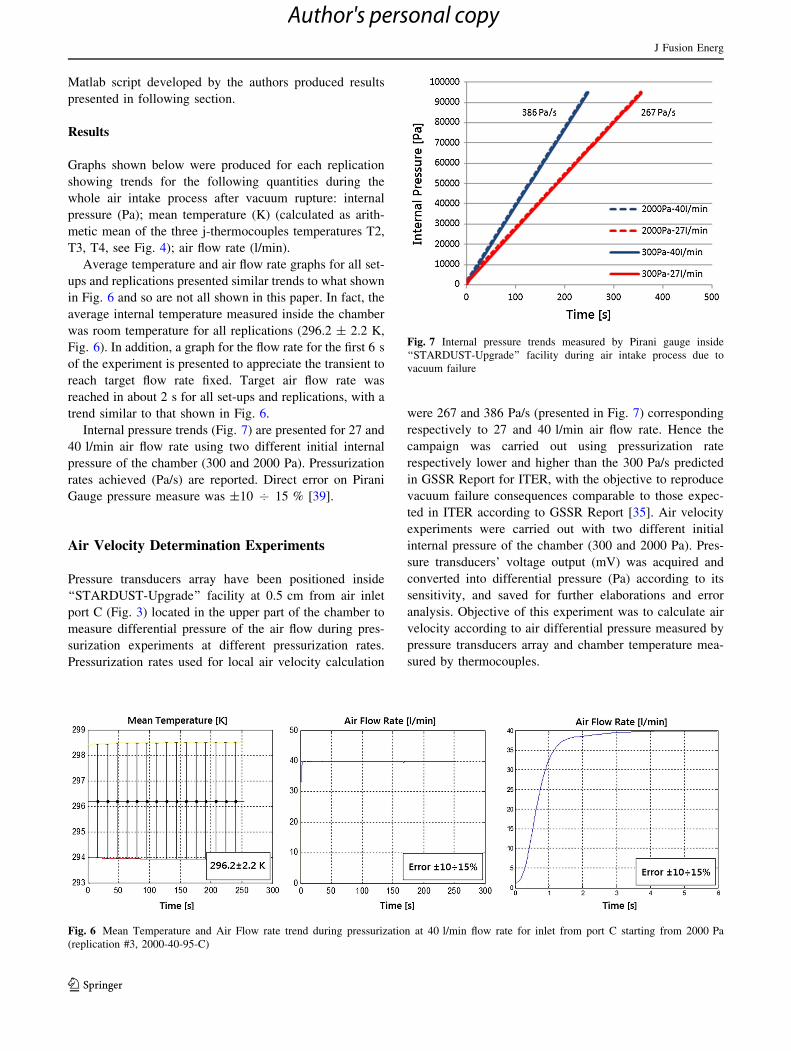
Average temperature and air flow rate graphs for all set-
ups and replications presented similar trends to what shown
in Fig. 6 and so are not all shown in this paper. In fact, the
average internal temperature measured inside the chamber
was room temperature for all replications (296.2 ± 2.2 K,
Fig. 6). In addition, a graph for the flow rate for the first 6 s
of the experiment is presented to appreciate the transient to
reach target flow rate fixed. Target air flow rate was
reached in about 2 s for all set-ups and replications, with a
trend similar to that shown in Fig. 6.
Internal pressure trends (Fig. 7) are presented for 27 and
40 l/min air flow rate using two different initial internal
pressure of the chamber (300 and 2000 Pa). Pressurization
rates achieved (Pa/s) are reported. Direct error on Pirani
Gauge pressure measure was ±10 7 15 % [39].
Air Velocity Determination Experiments
Pressure transducers array have been positioned inside
‘‘STARDUST-Upgrade’’ facility at 0.5 cm from air inlet
port C (Fig. 3) located in the upper part of the chamber to
measure differential pressure of the air flow during pres-
surization experiments at different pressurization rates.
Pressurization rates used for local air velocity calculation
were 267 and 386 Pa/s (presented in Fig. 7) corresponding
respectively to 27 and 40 l/min air flow rate. Hence the
campaign was carried out using pressurization rate
respectively lower and higher than the 300 Pa/s predicted
in GSSR Report for ITER, with the objective to reproduce
vacuum failure consequences comparable to those expec-
ted in ITER according to GSSR Report [35]. Air velocity
experiments were carried out with two different initial
internal pressure of the chamber (300 and 2000 Pa). Pres-
sure transducers’ voltage output (mV) was acquired and
converted into differential pressure (Pa) according to its
sensitivity, and saved for further elaborations and error
analysis. Objective of this experiment was to calculate air
velocity according to air differential pressure measured by
pressure transducers array and chamber temperature mea-
sured by thermocouples.
Fig. 6 Mean Temperature and Air Flow rate trend during pressurization at 40 l/min flow rate for inlet from port C starting from 2000 Pa
(replication #3, 2000-40-95-C)
Fig. 7 Internal pressure trends measured by Pirani gauge inside
‘‘STARDUST-Upgrade’’ facility during air intake process due to
vacuum failure
J Fusion Energ
123
Author's personal copy
Materials and Methods
In this set of experiments initial internal pressure chosen
was 2000 and 300 Pa and final internal pressure 95,000 Pa.
Volume flow rate chosen was 27 and 40 l/min. Port used
was port C (see Figs. 2, 3), located in the upper part of the
chamber. Experiments were carried out with four experi-
mental set-ups: 2000-27-95-C, 2000-40-95-C, 300-27-95-
C, 300-40-95-C [where ‘‘XXXX-XX-95-C’’ stands for
‘‘initial pressure (Pa)—flow rate (l/min)—final pressure
(kPa)—port used’’].
Air flowed inside the chamber at a known mass flow rate
from selected inlet port when the chamber reached target
pressure. Boundary conditions were: initial internal pres-
sure (Pa), final pressure (Pa), and volume flow rate (l/min),
that were manually entered in LabVIEW software.
Acquisition at 50 Hz during the entire intake process
included data on: observation #, actual internal pressure
(Pa), j-thermocouples temperatures T2 (�C), T3 (�C), T4
(�C), intake volume flow rate (l/min), Kulite pressure
transducers voltage output signal (mV). Data analysis was
carried out using both a Microsoft Excel2007 VBA script
and a Matlab script developed by the authors. Graphs are
presented for air velocity calculated according to Eq. (3)
presented in ‘‘Air Velocity Calculation Model and Error
Analysis’’ section, as a function of data saved throughout
the experiments in terms of: internal pressure (Pa); mean
temperature (K) (calculated as arithmetic mean of the three
temperatures T2, T3 and T4); Kulite pressure transducer
voltage output signal [mV].
The XCE-093-2D Kulite pressure transducers (XCE-
093-2D High Temperature Miniature Pressure Transducer,
Kulite Semiconductor Products, Inc., Leonia, NJ, USA
[38]) are based on piezoresistive effect [39]. The pressure
transducer gives a voltage output (up to 100 mV) that is
converted into differential pressure according to its sensi-
tivity. Differential pressure PD is equal to the difference
between dynamic pressure (measured by the sensor head)
and the static pressure PS (measured by the pressure ref-
erence tube). Noise of the pressure reference tube is
reported to have a maximum value of ±0.5 mV, so that is
the offset (mV) acceptable for the transducer [38]. Oper-
ating temperature range is reported from -65 (-55 �C) to
525 �F (273 �C), and compensated temperature range from
25 to 235 �C [38]. However, experiments for this campaign
are carried out at room temperature. Pressure transducer
output (mV) was acquired in a NI 9219 card (24-bit
Universal Analog Input NI 9219, National Instruments
Corporation, Austin, TX, USA) at 50 Hz and saved for
further elaborations and error analysis [8].
All local air velocity graphs presented include error bars
calculated according to error analysis described in fol-
lowing section.
Air Velocity Calculation Model and Error Analysis
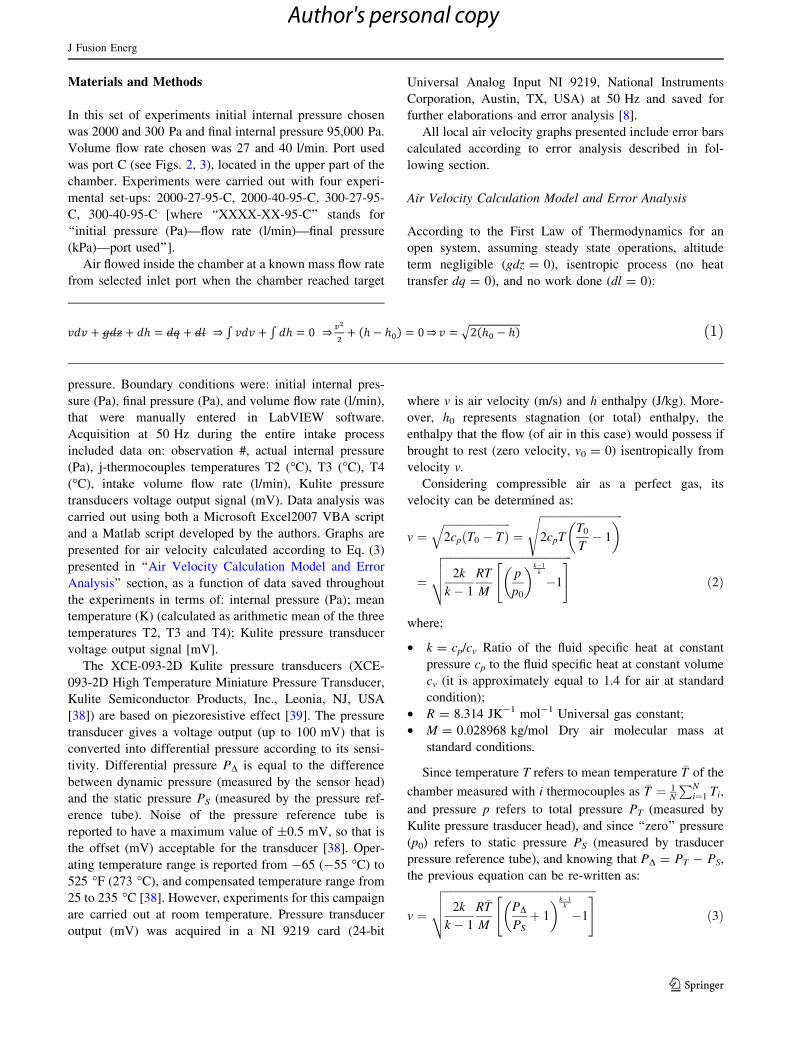
According to the First Law of Thermodynamics for an
open system, assuming steady state operations, altitude
term negligible (gdz = 0), isentropic process (no heat
transfer dq = 0), and no work done (dl = 0):
where v is air velocity (m/s) and h enthalpy (J/kg). More-
over, h0 represents stagnation (or total) enthalpy, the
enthalpy that the flow (of air in this case) would possess if
brought to rest (zero velocity, v0 = 0) isentropically from
velocity v.
Considering compressible air as a perfect gas, its
velocity can be determined as:
v ¼ffiffiffiffiffiffiffiffiffiffiffiffiffiffiffiffiffiffiffiffiffiffiffiffi
2cp T0 � Tð Þq
¼
ffiffiffiffiffiffiffiffiffiffiffiffiffiffiffiffiffiffiffiffiffiffiffiffiffiffiffiffiffiffi
2cpTT0
T� 1
� �
s
¼
ffiffiffiffiffiffiffiffiffiffiffiffiffiffiffiffiffiffiffiffiffiffiffiffiffiffiffiffiffiffiffiffiffiffiffiffiffiffiffiffiffiffiffiffiffiffi
2k
k � 1
RT
M
p
p0
� �k�1k
�1
" #
v
u
u
t ð2Þ
where:
• k = cp/cv Ratio of the fluid specific heat at constant
pressure cp to the fluid specific heat at constant volume
cv (it is approximately equal to 1.4 for air at standard
condition);
• R = 8.314 JK-1 mol-1 Universal gas constant;
• M = 0.028968 kg/mol Dry air molecular mass at
standard conditions.
Since temperature T refers to mean temperature �T of the
chamber measured with i thermocouples as �T ¼ 1N
PNi¼1 Ti,
and pressure p refers to total pressure PT (measured by
Kulite pressure trasducer head), and since ‘‘zero’’ pressure
(p0) refers to static pressure PS (measured by trasducer
pressure reference tube), and knowing that PD = PT - PS,
the previous equation can be re-written as:
v ¼
ffiffiffiffiffiffiffiffiffiffiffiffiffiffiffiffiffiffiffiffiffiffiffiffiffiffiffiffiffiffiffiffiffiffiffiffiffiffiffiffiffiffiffiffiffiffiffiffiffiffiffiffiffiffiffi
2k
k � 1
R�T
M
PD
PS
þ 1
� �k�1k
�1
" #
v
u
u
t ð3Þ
ð1Þ
J Fusion Energ
123
Author's personal copy

where:
• �T ¼ 1N
PNi¼1 Ti Mean temperature from i thermocouples
(K);
• PS Static pressure (measured by Pirani pressure gauge);
• PD = PT - PS Differential pressure (measured by
pressure transducers as difference between head pres-
sure and reference tube pressure);
• PT Total pressure (measured by transducers head).
Experimental measurements are affected by both hard-
ware direct errors and propagation of uncertainty in case of
indirect measurements, like in this case velocity.
Velocity function v = f(x1, x2, x3) depends on: x1 ¼ �T(mean temperature from J-thermocouples), x2 = PS (static
pressure from Pirani pressure gauge), x3 = PD (differential
pressure from Kulite pressure transducers). If all the three
uncertainties Dx1, Dx2, Dx3 on the variables are not likely to
have the same sign, and if correlations among variables x1,
x2, x3 are neglected hence assuming that variables are
independent, it is possible to use the following Eq. (6) [41]
for total uncertainty Dv of velocity:
Dv ¼
ffiffiffiffiffiffiffiffiffiffiffiffiffiffiffiffiffiffiffiffiffiffiffiffiffiffiffiffiffiffiffiffiffiffiffiffiffiffiffiffiffiffiffiffiffiffiffiffiffiffiffiffiffiffiffiffiffiffiffiffiffiffiffiffiffiffiffiffiffiffiffiffiffiffiffiffiffiffiffiffiffiffiffiffiffiffiffiffiffiffiffiffi
of
ox1
� �
Dx1
� �2
þ of
ox2
� �
Dx2
� �2
þ of
ox3
� �
Dx3
� �2s
ð4Þ
where:
of
ox1
¼ v0ð�TÞ ¼ 1
2�T
ffiffiffiffiffiffiffiffiffiffiffiffiffiffiffiffiffiffiffiffiffiffiffiffiffiffiffiffiffiffiffiffiffiffiffiffiffiffiffiffiffiffiffiffiffiffiffiffiffiffiffiffiffiffiffi
2k
k � 1
R�T
M
PD
PS
þ 1
� �k�1k
�1
" #
v
u
u
t ð5Þ
of
ox2
¼ v0 PSð Þ ¼PDR�T PD
PSþ 1
� �k�1k
MP2S
ffiffiffiffiffiffiffiffiffiffiffiffiffiffiffiffiffiffiffiffiffiffiffiffiffiffiffiffiffiffiffiffiffiffiffiffiffiffiffiffiffiffiffiffiffiffiffi
2k
k�1
R �TM
PD
PSþ 1
� �k�1k �1
� �
s ð6Þ
of
ox3
¼ v0 PDð Þ ¼R�T PD
PS
� ��1k
MPS
ffiffiffiffiffiffiffiffiffiffiffiffiffiffiffiffiffiffiffiffiffiffiffiffiffiffiffiffiffiffiffiffiffiffiffiffiffiffiffi
2k
k�1
R �TM
PD
PS
� �k�1k �1
� �
s ð7Þ
Uncertainties Dx1, Dx2, Dx3, (direct errors) on the three
variables �T, PS, PD are [8]:
Dx1 ¼ 0:0031 � �T tð Þ
Dx2;PIRANI ¼ 0:1 � PS tð Þ (pressure from 0.0005 to
1000 mbar)
Dx2;EDWARD ¼ 0:002 � PS tð Þ (pressure from 1000 to
2000 mbar)
Dx3 ¼ 0:1 � PD tð Þ
where �T tð Þ, PS(t) and PD(t) are functions of time acquired
throughout the experiments.
Velocity Transient Time Calculation
According to specifications presented in ‘‘Materials and
Methods’’ section. Kulite transducers present a maximum
acceptable offset corresponding to 0.5 mV. In other terms,
every signal -0.5 mV\V*\?0.5 mV is considered not
reliable. Air velocity [according to Eq. (3)] for a signal of
0.50 mV from Kulite transducer was calculated and
reported in Table 2 [i.e. ‘‘v(0.50 mV)’’]. Every air velocity
value smaller than that calculated for 0.50 mV is not
considered in the analysis.
The ‘‘velocity transient time’’ (Table 2) was calcu-
lated as the interval from the start of air intake process
to the time at which the pressure transducer voltage
signal decreased till 0.50 mV, corresponding to its
maximum acceptable zero point [38], and so corre-
sponding to the minimum velocity calculated by the
system above signal-to-noise ratio (SNR) (see Fig. 8).
This velocity, namely ‘‘v(0.50 mV)’’, is equal to the
minimum air velocity detectable by the system. In the
present work, ‘‘velocity transient time’’ was defined for
all replications in order to have information on time
range in which mobilization is expected, at different
pressurization rates.
Results and Comparison with Numerical Model
Results are presented for four experimental set-ups:
2000-27-95-C, 2000-40-95-C, 300-27-95-C, 300-40-95-C
[where ‘‘XXXX-XX-95-C’’ stands for ‘‘initial pressure
(Pa)—flow rate (l/min)—final pressure (kPa)—port used’’].
Graphs are presented for air velocity calculated
according to Eq. (3), according to data saved throughout
the experiments in terms of: internal pressure (Pa); mean
temperature (K) (calculated as arithmetic mean of the
three temperatures T2, T3 and T4). Graphs include error
bars calculated according to error analysis described in
‘‘Air Velocity Calculation Model and Error Analysis’’
section.
Air velocity trends for first 25 s of air intake are reported
in Fig. 9 that shows a velocity peak in the first 4 s. The
corresponding pressurization rates are that shown in Fig. 7.
Table 2 summarizes results on air velocity calculations.
The maximum velocity value (m/s) is presented for each
run along with corresponding time (s) at which the maxi-
mum was observed. Velocity transient time (s) and corre-
sponding velocity ‘‘v(0.50 mV)’’ are also reported.
J Fusion Energ
123
Author's personal copy
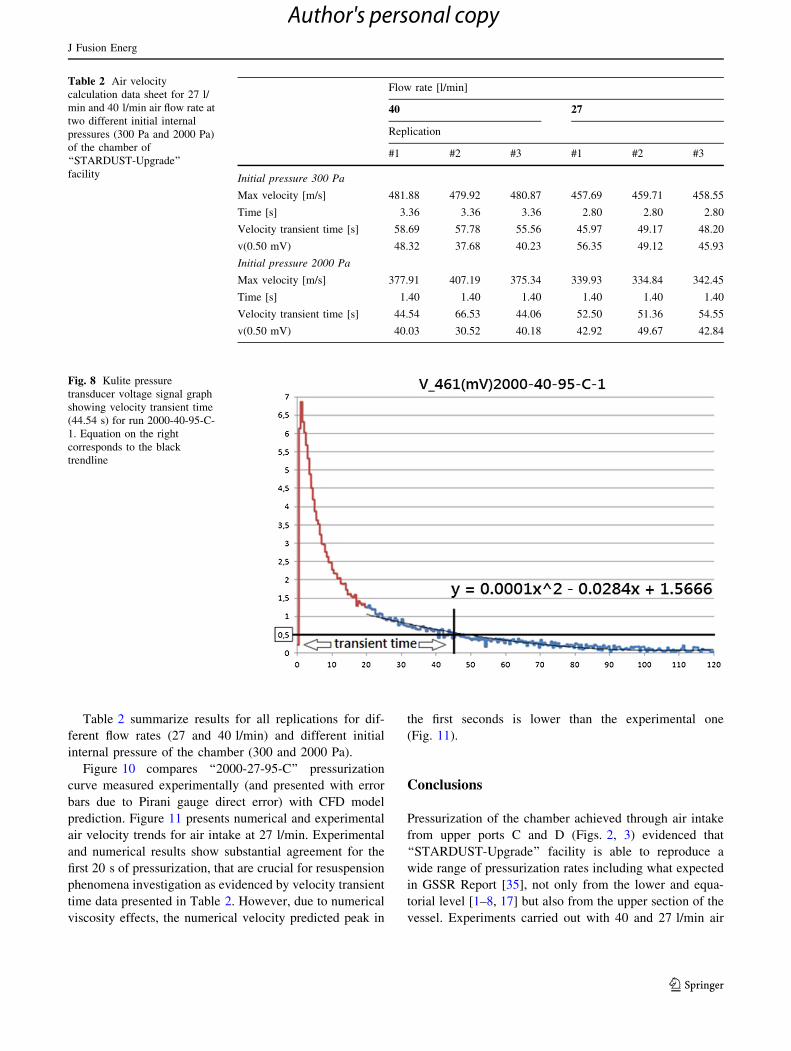
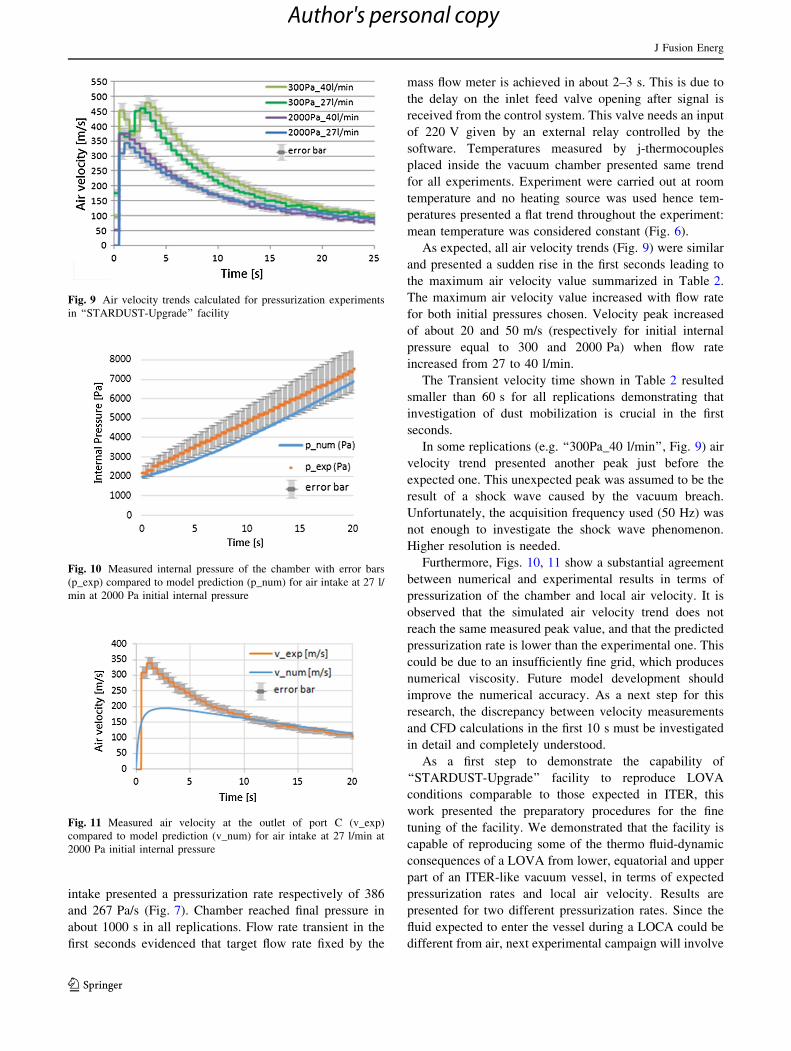
Table 2 summarize results for all replications for dif-
ferent flow rates (27 and 40 l/min) and different initial
internal pressure of the chamber (300 and 2000 Pa).
Figure 10 compares ‘‘2000-27-95-C’’ pressurization
curve measured experimentally (and presented with error
bars due to Pirani gauge direct error) with CFD model
prediction. Figure 11 presents numerical and experimental
air velocity trends for air intake at 27 l/min. Experimental
and numerical results show substantial agreement for the
first 20 s of pressurization, that are crucial for resuspension
phenomena investigation as evidenced by velocity transient
time data presented in Table 2. However, due to numerical
viscosity effects, the numerical velocity predicted peak in
the first seconds is lower than the experimental one
(Fig. 11).
Conclusions
Pressurization of the chamber achieved through air intake
from upper ports C and D (Figs. 2, 3) evidenced that
‘‘STARDUST-Upgrade’’ facility is able to reproduce a
wide range of pressurization rates including what expected
in GSSR Report [35], not only from the lower and equa-
torial level [1–8, 17] but also from the upper section of the
vessel. Experiments carried out with 40 and 27 l/min air
Fig. 8 Kulite pressure
transducer voltage signal graph
showing velocity transient time
(44.54 s) for run 2000-40-95-C-
1. Equation on the right
corresponds to the black
trendline
Table 2 Air velocity
calculation data sheet for 27 l/
min and 40 l/min air flow rate at
two different initial internal
pressures (300 Pa and 2000 Pa)
of the chamber of
‘‘STARDUST-Upgrade’’
facility
Flow rate [l/min]
40 27
Replication
#1 #2 #3 #1 #2 #3
Initial pressure 300 Pa
Max velocity [m/s] 481.88 479.92 480.87 457.69 459.71 458.55
Time [s] 3.36 3.36 3.36 2.80 2.80 2.80
Velocity transient time [s] 58.69 57.78 55.56 45.97 49.17 48.20
v(0.50 mV) 48.32 37.68 40.23 56.35 49.12 45.93
Initial pressure 2000 Pa
Max velocity [m/s] 377.91 407.19 375.34 339.93 334.84 342.45
Time [s] 1.40 1.40 1.40 1.40 1.40 1.40
Velocity transient time [s] 44.54 66.53 44.06 52.50 51.36 54.55
v(0.50 mV) 40.03 30.52 40.18 42.92 49.67 42.84
J Fusion Energ
123
Author's personal copy
intake presented a pressurization rate respectively of 386
and 267 Pa/s (Fig. 7). Chamber reached final pressure in
about 1000 s in all replications. Flow rate transient in the
first seconds evidenced that target flow rate fixed by the
mass flow meter is achieved in about 2–3 s. This is due to
the delay on the inlet feed valve opening after signal is
received from the control system. This valve needs an input
of 220 V given by an external relay controlled by the
software. Temperatures measured by j-thermocouples
placed inside the vacuum chamber presented same trend
for all experiments. Experiment were carried out at room
temperature and no heating source was used hence tem-
peratures presented a flat trend throughout the experiment:
mean temperature was considered constant (Fig. 6).
As expected, all air velocity trends (Fig. 9) were similar
and presented a sudden rise in the first seconds leading to
the maximum air velocity value summarized in Table 2.
The maximum air velocity value increased with flow rate
for both initial pressures chosen. Velocity peak increased
of about 20 and 50 m/s (respectively for initial internal
pressure equal to 300 and 2000 Pa) when flow rate
increased from 27 to 40 l/min.
The Transient velocity time shown in Table 2 resulted
smaller than 60 s for all replications demonstrating that
investigation of dust mobilization is crucial in the first
seconds.
In some replications (e.g. ‘‘300Pa_40 l/min’’, Fig. 9) air
velocity trend presented another peak just before the
expected one. This unexpected peak was assumed to be the
result of a shock wave caused by the vacuum breach.
Unfortunately, the acquisition frequency used (50 Hz) was
not enough to investigate the shock wave phenomenon.
Higher resolution is needed.
Furthermore, Figs. 10, 11 show a substantial agreement
between numerical and experimental results in terms of
pressurization of the chamber and local air velocity. It is
observed that the simulated air velocity trend does not
reach the same measured peak value, and that the predicted
pressurization rate is lower than the experimental one. This
could be due to an insufficiently fine grid, which produces
numerical viscosity. Future model development should
improve the numerical accuracy. As a next step for this
research, the discrepancy between velocity measurements
and CFD calculations in the first 10 s must be investigated
in detail and completely understood.
As a first step to demonstrate the capability of
‘‘STARDUST-Upgrade’’ facility to reproduce LOVA
conditions comparable to those expected in ITER, this
work presented the preparatory procedures for the fine
tuning of the facility. We demonstrated that the facility is
capable of reproducing some of the thermo fluid-dynamic
consequences of a LOVA from lower, equatorial and upper
part of an ITER-like vacuum vessel, in terms of expected
pressurization rates and local air velocity. Results are
presented for two different pressurization rates. Since the
fluid expected to enter the vessel during a LOCA could be
different from air, next experimental campaign will involve
Fig. 10 Measured internal pressure of the chamber with error bars
(p_exp) compared to model prediction (p_num) for air intake at 27 l/
min at 2000 Pa initial internal pressure
Fig. 11 Measured air velocity at the outlet of port C (v_exp)
compared to model prediction (v_num) for air intake at 27 l/min at
2000 Pa initial internal pressure
Fig. 9 Air velocity trends calculated for pressurization experiments
in ‘‘STARDUST-Upgrade’’ facility
J Fusion Energ
123
Author's personal copy

different fluid (e.g. steam) to also reproduce a LOCA event.
We believe this work is an important starting point and will
be continued with the final goal of completely reproduce,
characterize, and simulate the dust mobilization phenom-
ena in case of vacuum rupture of the vacuum vessel of
nuclear fusion reactors.
Conflict of interest The authors declare that they have no conflict
of interest.
References
1. J.P. Sharpe et al., Fusion Eng. Des. 63–64, 153–163 (2002)
2. J. Winter, Phys. Plasmas 7, 3862–3866 (2000)
3. A. Malizia et al., Adv. Mat. Sci. Eng. 2014, Article ID 201831, 29
(2014)
4. A. Malizia, in 35th EPS Conference on Plasma Physics 32,
696–699 (2008)
5. C. Bellecci et al., Fusion Eng. Des. 86(9–11), 2774–2778 (2011)
6. D. Di Giovanni et al., WSEAS Trans. Environ. Dev. 10, 106–122
(2014)
7. A. Malizia et al., in 41st EPS Conference on Plasma Physics,
(2014), p. 5006
8. A. Malizia, Radioactive dust re-suspension/mobilization inside
tokamaks (LAP LAMBERT Academic Publishing, Saarbrucken,
2014)
9. K. Takase et al., Fusion Eng. Des. 42, 83–88 (1998)
10. A. Malizia et al., Def. S T Tech. Bull. 4(1), 64–76 (2011)
11. A. Malizia et al., Def. S T Tech. Bull. 5(1), 36–45 (2012)
12. O. Cenciarelli et al., Def. S T Tech. Bull. 6(1), 33–41 (2013)
13. J.P. Sharpe, P.W. Humrickhouse, Fusion Eng. Des. 81,
1409–1415 (2006)
14. W.G. Brown, Int. J. Heat Mass Transf. 5, 859–871 (1962)
15. K. Takase et al., Fusion Tech. 30, 1459–1464 (1996)
16. K. Takase et al., Nucl. Sci. Eng. 125, 223–231 (1997)
17. I. Lupelli et al., J. Fusion Energ. ISSN 0164-0313 (2015). doi:10.
1007/s10894-015-9905-8
18. K. Takase, Fusion Eng. Des. 54, 605–615 (2001)
19. P. Gaudio et al., in International Conference on Mathematical
Models for Engineering Science, (2010), pp. 134–147
20. P. Gaudio et al., Int. J. Syst. Appl. Eng. Dev. 5, 287–305 (2011)
21. M. Benedetti et al., Int. J. Syst. Appl. Eng. Dev. 5, 718–727
(2011)
22. M. Benedetti et al., Fusion Eng. Des. 88(9–10), 2665–2668
(2013)
23. C. Bellecci et al., Fusion Eng. Des. 88(9–11), 2774–2778 (2011)
24. C. Bellecci et al., Nucl. Fusion 51(5), 053017 (2011)
25. C. Bellecci et al., Fusion Eng. Des. 86(4–5), 330–340 (2011)
26. M. Benedetti et al., in Mechanics RRi, ed. 2nd International
Conference on FLUIDSHEAT’11, TAM’11. 4th WSEAS Inter-
national Conference on UPT’11, CUHT’11, (2011), pp. 142–147
27. T. Pinna et al., Fusion Eng. Des. 85(7–9), 1410–1415 (2010)
28. C. Bellecci et al., in 37th EPS Conference on Plasma Physics,
(2010), pp. 703–706
29. P. Gaudio et al., in International Conference on Mathematical
Models for Engineering Science (MMES’ 10), (2010),pp. 134–147
30. C. Bellecci et al., in 33E1 ECA, ed. 36th EPS Conference on
Plasma Physics, (2009), pp. 266–269
31. C. Bellecci et al., in 32 EP, ed. 35th EPS Conference on Plasma
Physics, vol. 32 (2008), pp. 9–13
32. I. Lupelli et al., Fusion Eng. Des. 89(9–10), 2048–2052 (2014)
33. A. Malizia et al., Fusion Eng. Des. 89(9–10), 2098–2102 (2014)
34. P. Gaudio et al., ICFDT 2013 Conference (INFN, Frascati, 2013)
35. IAEA. ITER Joint Central Team. Generic Site Safety Report
(GSSR). https://fusion.gat.com/iter/iter-fdr/final-report-sep-2001/
Plant_Assembly_Documents_%28PADs%29/Generic_Site_Safety_
Report_GSSR/GSSR_09_ExtHazAssmnt.pdf, Accessed: 11 Dec 2014
36. A. Malizia et al., Fusion Eng. Des. Available online 19 December
2014. In Press. doi:10.1016/j.fusengdes.2014.11.009
37. Kulite Semiconductor Products, Inc., Leonia, Nj, USA. www.
kulite.com/docs/products/XCE-093.pdf, Accessed: 11 Dec 2014
38. A. Kurtz, J. VanDWeert, B. Kochman, Pitot-static Transducer,
Kulite Semiconductor Products, Inc., Leonia, Nj, USA
39. Alcatel Vacuum Technology, Annecy, France. Alcatel AP 1004
Pirani Gauge Specifications. www.pfeiffer-vacuum.com/down
loads/container.action, Accessed: 11 Dec 2014
40. MKS Instruments, Andover, Ma, USA. General Purpose Mass-
Flo(R) Controller 1559A www.mksinst.com/docs/ur/1559.pdf,
Accessed: 4 Feb 2015
41. H.H. Ku. J. Res. Natl. Bur. Stand C Eng. Instrum. 70C(4), (1966)
J Fusion Energ
123
Author's personal copy