Embed Size (px)
Citation preview

-with Nick Cederlind
for Small Business

Empowering Small Business
Underd og Training
• San Francisco
• Certified Microsoft Office Trainer
Teaching for 7 years
• Founder: Underdog Training
Training numerous Bay Area small businesses
Who am I?
Nick Cederlind
Empowering Small Business

Small Business Owners
Overwhelmed
Do everything yourself
Never enough time

How can I reduce expenses?
Where can I find new customers?
How can I analyze and improve my sales?
Small Business Owners

What can Excel do for Small Business?
• Organize overwhelming information.
• Save time.
• Fix errors and reduce data entry.
• Track, analyze & improve sales & production.
• Locate new customers & sales opportunities.
Answer important questions:
•Where can I reduce my expenses?
•Which of my products is the most popular?
•When and where are most of my customers coming from?
•Where do I find new customers?
• How many sales do I need to make in order to stay in business?
What can Excel do for Small Business?

Create budgets
Track inventory
Analyze sales
Visually communicate
value
What can Excel do for Small Business?
How does Excel do this?
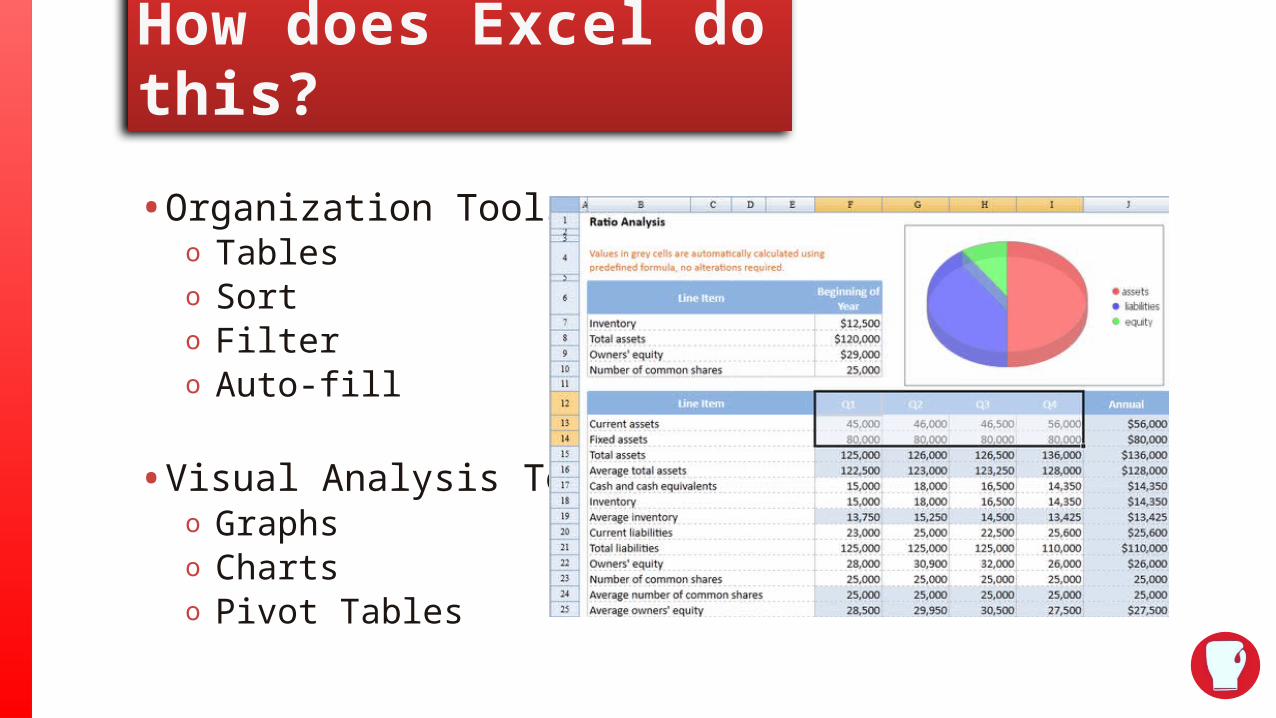
• Organization Tools:o Tableso Sorto Filtero Auto-fill
• Visual Analysis Tools:o Graphso Chartso Pivot Tables
How does Excel do this?
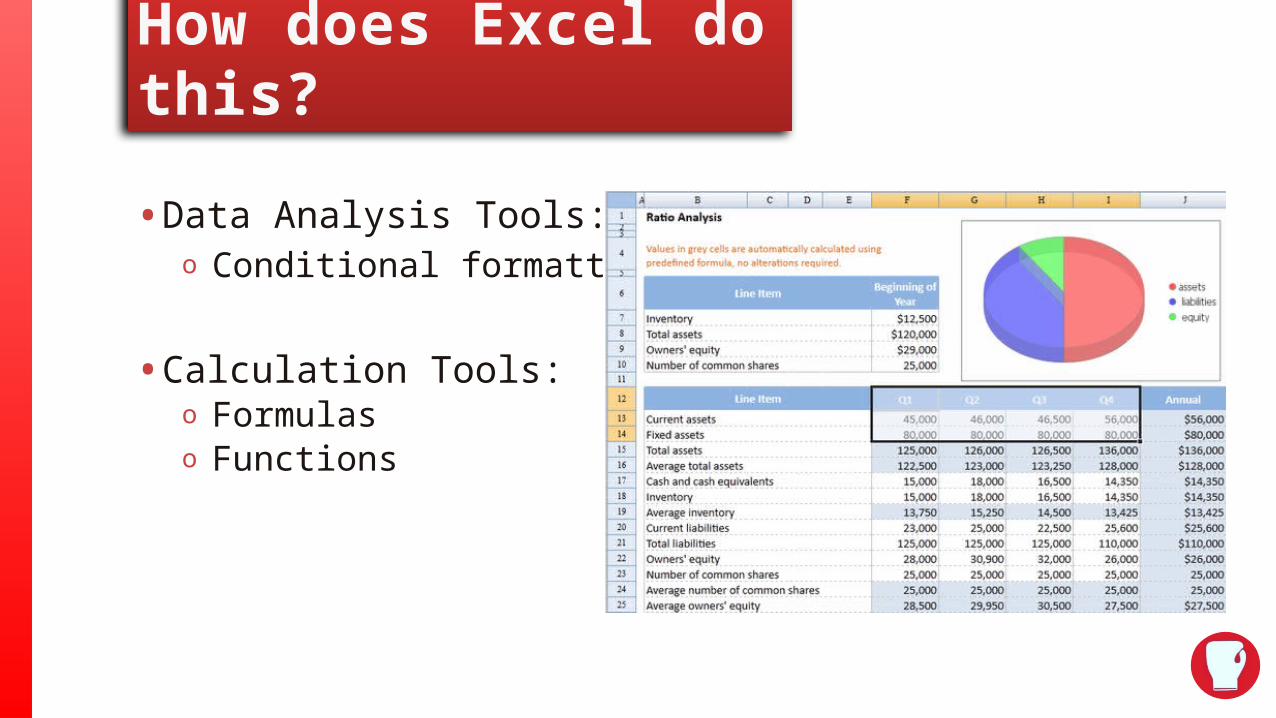
• Data Analysis Tools:o Conditional formatting.
• Calculation Tools:o Formulaso Functions

Excel in Action:
• Kim’s Cupcakes

Operating expense budget:

Operating expense budget:
• Objectives:
o Track expenses.
o Calculate over/underspending.
o Adjust budget.

Operating expense budget:
Examples:
•Where should Kim make adjustments?
•What’s Kim’s projection/cost ratio?
• How much revenue does Kim need to break even?

Operating expense budget:
• Data Analysis Tools:o Conditional formatting
• Organization Tools:o Auto-fill
• Calculation Tools:o Formulas

Calculation Tools:
• Formulas: o Calculate values (financial, chronological,
items, etc.).
• Why is this important? o Determine important results. o Calculate efforts, resources, results. o Analyze performance totals. o Track expenditures, data, locate and minimize
errors.• Example:
o Calculating profit.

Data Analysis Tools:• Conditional Formatting:
o Highlight important information based on criteria of your choice.
• Why is this important?o Make important information stand out. o Simplify data analysis. o Track important data. o Make data analysis visual.
• Example: o Highlight sales revenue according to break even ratio.

Organization Tools:• Auto-fill:
o Replicate data or calculations based on new
input/context.
• Why is this important:
o Save time on data entry and creating new
formulas.
• Example:
o Calculate profit for one month, auto-fill
calculates profit for remaining months.

Customer Database:

Customer Database:
• Objectives:
o Analyze customer purchase habits.
o Refine target audience.
o Discover how to find new customers.

Customer Database:
Examples:
• Who are your best customers?
• How did they hear about us?
• Easily locate a customer’s purchase history.

Customer Database:
• Data Analysis Tools:
o Table
• Organization Tools:
o Sort
o Filter
o “Find” feature

Organization Tools:• Filtering:
o Filter out extraneous data for
comparison and analysis.• Why is this important:
o Quickly and easily isolate information
to simplify analysis.• Example:
o Sort customers by zip code, then filter
out one-time buyers.

Organization Tools:• Sorting:
o Sort information alphabetically or numerically.
• Why is this important:
o Quickly locate and analyze information
according to your criteria for analysis.
o Organize information into lists.
• Example:
o Sort customers by zipcode, city, etc.

Monthly Sales:

Monthly Sales:
• Objectives:
o Analyze product performance.
o Adjust sales efforts.

Monthly Sales:
Examples:
• Which cupcakes sold more than, for example, $60.00/month?
• Where are customers coming from?
o On which date?
o How did they hear about Kim?

Monthly Sales:
• Calculation Tools:
oFormulas
• Data Analysis Tools:
oConditional formatting
• Visual Analysis Tools:
o Pivot table
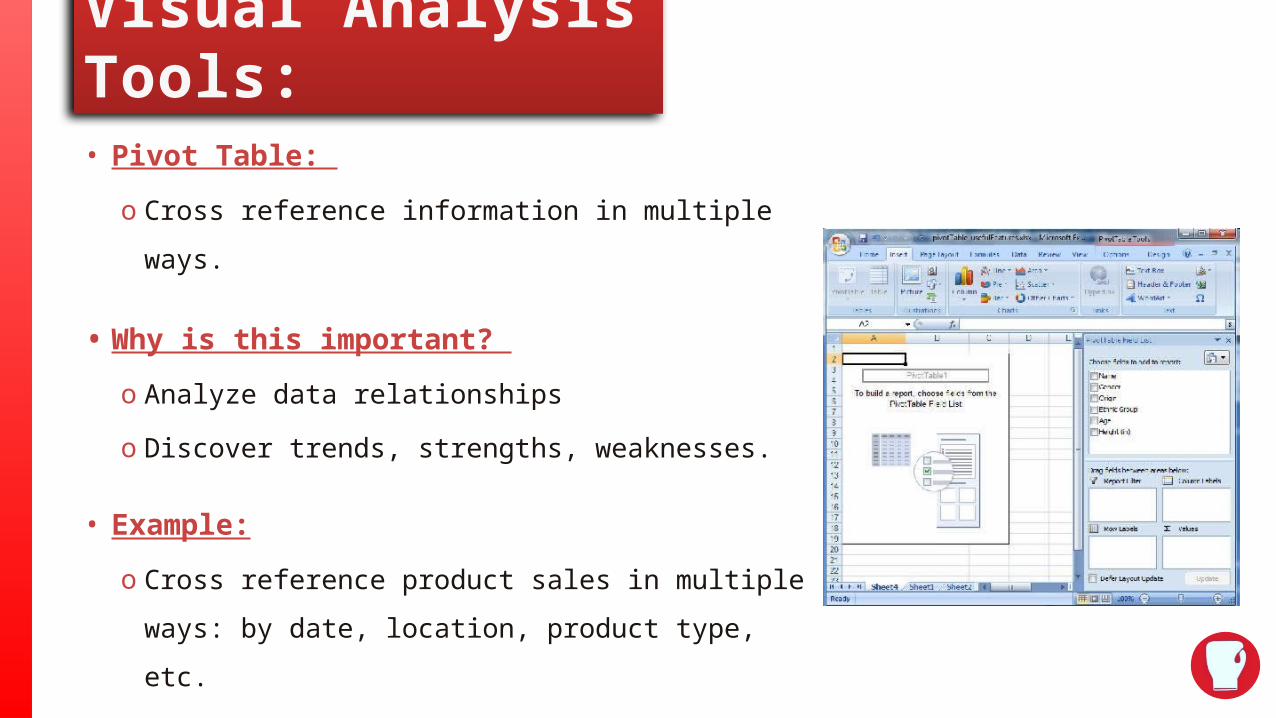
Visual Analysis Tools:• Pivot Table:
o Cross reference information in multiple ways.
• Why is this important?
o Analyze data relationships
o Discover trends, strengths, weaknesses.
• Example:
o Cross reference product sales in multiple
ways: by date, location, product type, etc.
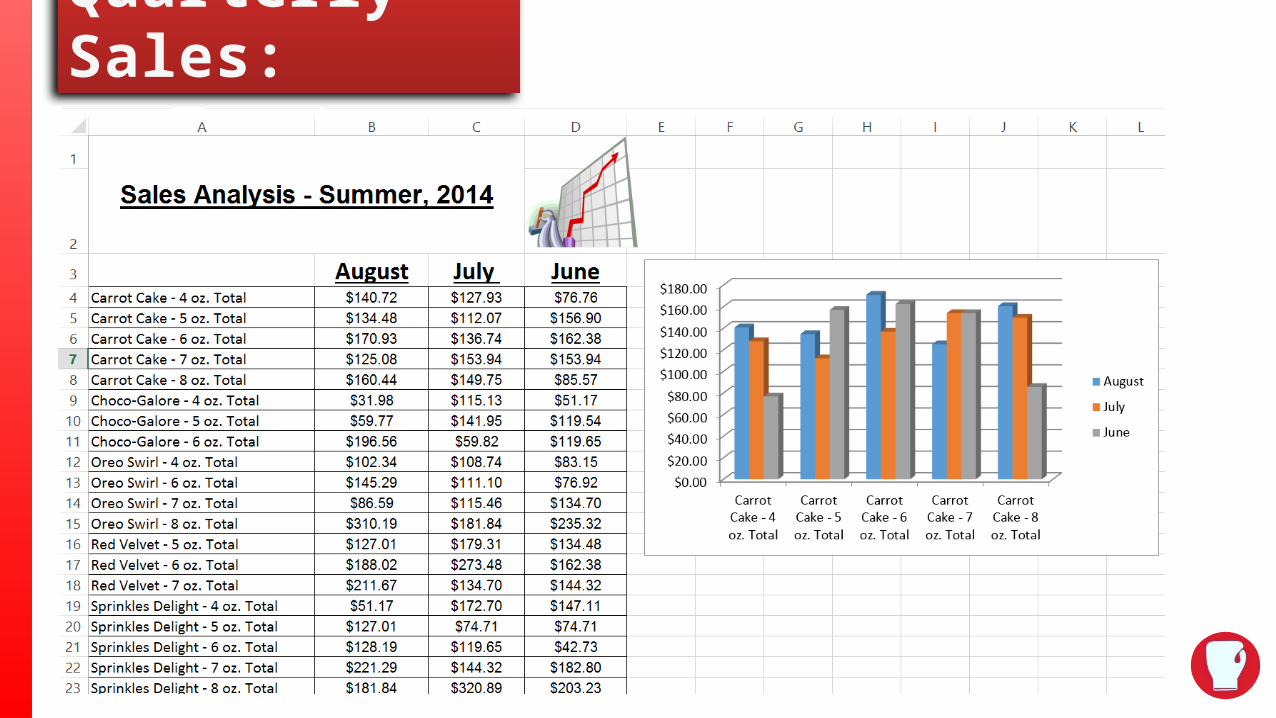
Quarterly Sales:

Quarterly Sales:
• Objective:
o Create a visual analysis of sales performance.

Quarterly Sales:
Examples:
• How did each product perform over time?
Quarterly Sales:
• Visual Analysis Tools:oCharts
• Calculation Tools:oFormulas
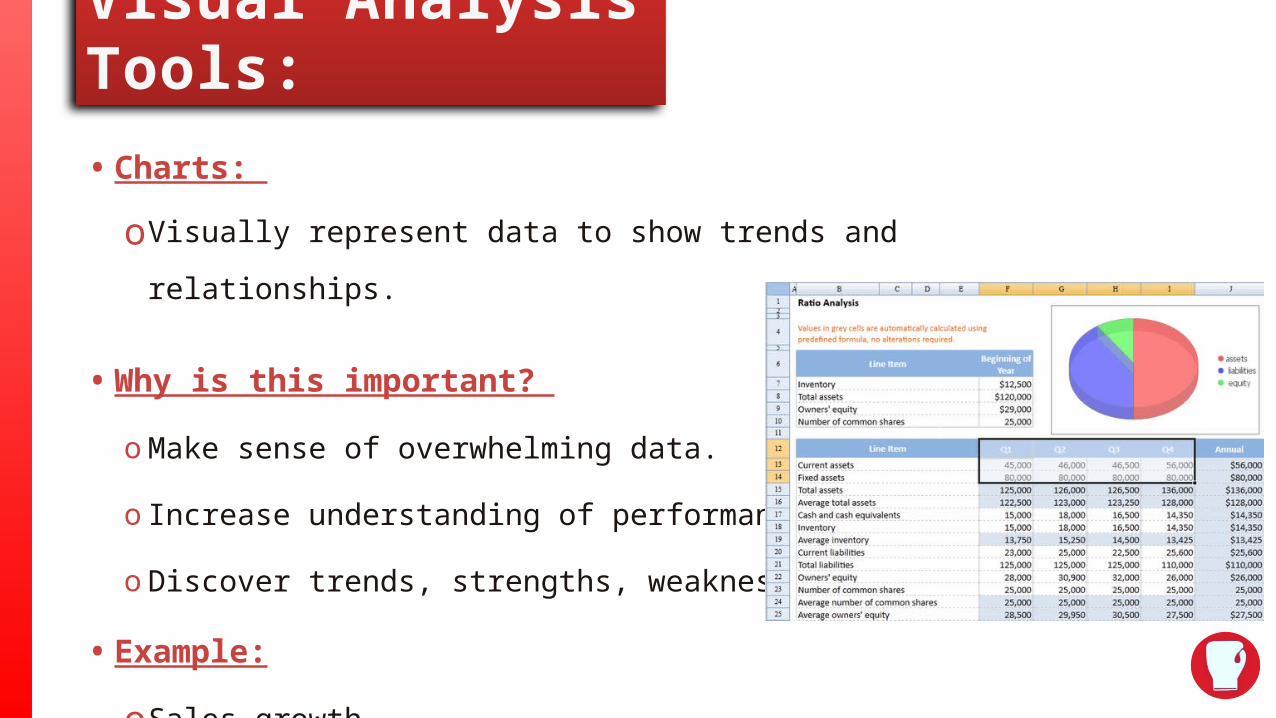
• Charts:
oVisually represent data to show trends and relationships.
• Why is this important?
o Make sense of overwhelming data.
o Increase understanding of performance.
o Discover trends, strengths, weaknesses.
• Example:
oSales growth
Visual Analysis Tools:

What can Excel do for Small Business?
• Organize overwhelming information.
• Save time.
• Fix errors and reduce data entry.
• Track, analyze & improve sales & production.
• Locate new customers & sales opportunities.
• Reduce expenses.

QUESTIONS?