Embed Size (px)
Citation preview

RLCS, Revista Latina de Comunicación Social, 73 – Pages 595 to 613[Funded] [Research] | DOI:10.4185/RLCS-2018-1271en | ISSN 1138-5820 | Year 2018
How to cite this article in bibliographies / References
L Jiménez Iglesias, C Aguilar Paredes, L Sánchez Gómez, M Pérez-Montoro Gutiérrez (2018): “User experience and media. The three click rule in newspapers’ webs for smartphones”. Revista Latina de Comunicación Social, 73, pp. 595 to 613.http://www.revistalatinacs.org/073paper/1271/30en.html DOI: 10.4185/RLCS-2018-1271en
User experience and the media: The three-click rule on newspaper websites
for smartphones1
Lucía Jiménez Iglesias [CV] [ ] [ ] Universitat Oberta de Catalunya (España). [email protected] Aguilar Paredes [CV] [ ] [ ] Associate Professor. Universitat de Barcelona (España). [email protected] Sánchez Gómez [CV] [ ] [ ] Professor. Universitat de Barcelona (España). [email protected] Pérez-Montoro Gutiérrez [CV] [ ] [ ] Professor. Universitat de Barcelona (España). [email protected]
AbstractIntroduction: access to online information is carried out throughout smartphones, so is basic that newspapers websites for these devices are designed from a user experience perspective. This work aims at determining the number of clicks that users are willing to do in order to get the content they are looking for. Methodology: User tests are carried out to observe users’ performance and reactions while navigating these websites. The methodological approach is a concurrent design based on triangulation and it includes the collection of quantitative and qualitative data. Results: The number of clicks is not related to failure but it is associated with the perception of difficulty. Discussion and Conclusions: It is advisable for newspapers’ mobile websites to include a search engine which allows users to access information straightaway.
KeywordsDigital media; smartphones; mobile devices: user experience: three click rule.
Contents1.Introduction. 1.1. Cybermedia and smartphones. 1.2. User experience. 2. Methodology. 2.1. Sample selection. 2.2. The experiment. 3. Results. 3.1. Quantitative analysis: what is the optimum
http://www.revistalatinacs.org/07 3 paper/1 271 / 30 e n .html Página 595

RLCS, Revista Latina de Comunicación Social, 73 – Pages 595 to 613[Funded] [Research] | DOI:10.4185/RLCS-2018-1271en | ISSN 1138-5820 | Year 2018
number of clicks? 3.1.1. Number of clics and failure. 3.1.2. Number of clics and perception of difficulty. 3.1.3. Perception of difficulty: differences controlling for other factors. 3.2. Satisfaction: qualitative analysis of comments. 4. Discussion and conclusions. 5. References.
Traslate by Barnaby Noone (Serveis Lingüístics - Universitat de Barcelona).
1. Introduction
Smartphones have become part of the routine of millions of users worldwide because, in addition to enabling calls to be made and received, they bring together various functionalities in one device, including email manager, alarm, browser, camera, calculator, music player and calendar. In addition, in recent years, the catalogue of applications that they offer has expanded, as well as the amount of time they are used daily. In fact, they are now considered small pocket computers that can be used at any time for personal and/or work purposes. According to Eurostat (2017), the Spanish are the European citizens who use phones most to connect to the Internet, with 93% of internet users browsing via their mobiles.
In the specific case of the press, mobile technology has been altering the processes of news production and distribution in Spain for some years (García, Westlund and Rodríguez, 2015), as well as the way readers access news. The telephone and tablet are gaining ground as devices for accessing news: they are employed by 37% and 10% of users respectively, compared to 46% of internet users who read the news on computers (Negredo, Vara and Amoedo, 2017). In fact, according to one study, 61% of users aged under 45 years access news via mobile devices.
Thus, given the specific features of smartphones (smaller screens and slower browsing, among others) and the context of mobility in which they tend to be used, media websites must be optimized for these devices. One key factor to ensure this optimization is to provide users with a good browsing experience, so that the website is usable and has good interaction design.
Consequently, it is essential to address the design of newspaper websites from the perspective of the user experience (UX). The UX covers the entire process of a user’s interaction with a website and includes other disciplines that focus on more specific aspects of interfaces, such as interaction design, usability and information architecture.
A collection of guidelines has been compiled over years of research and practice, to guide the design and development of websites. These are widely accepted precepts, gathered in a range of documents (commonly known as web standards) covering aspects of the interfaces, such as their structure or the design of their navigation system. However, we can find some contradictions between these precepts, for example, in the “three-click rule”.
This guideline states that users should be able to access the information they seek in three clicks; if it takes them longer to find the information, they will end up leaving the webpage. Some standards support this precept, such as the US Department of Health and Human Sciences (2006), the Government of Chile (2012) and Rosenfeld, Morville and Arango (2015). However, others disagree,
http://www.revistalatinacs.org/07 3 paper/1 271 / 30 e n .html Página 596

RLCS, Revista Latina de Comunicación Social, 73 – Pages 595 to 613[Funded] [Research] | DOI:10.4185/RLCS-2018-1271en | ISSN 1138-5820 | Year 2018
including the Mobile Web Best Practices (Rabin and McCathieNevile, 2008), which states that users should not have to click more than four times to reach their target on the website, or Krug (2014), who considered that the number of clicks is not important as long as each link is clear.
In a context in which an increasing number of people access the news through their smart phones, this study analyses media websites for mobile devices from the perspective of the user experience. The aim is to determine the optimum number of clicks that users are willing to make to get to the information they are looking for on these types of website.
1.1. Cybermedia and smartphones
Convergence has been discussed in media studies for several years, as a result of the advance of technology. Jenkins (2006) was the first to associate the term “convergence” with digital media to describe “the flow of content across multiple media platforms, the cooperation between multiple media industries, and the migratory behaviour of media audiences who would go almost anywhere in search of the kinds of entertainment experiences they wanted” (p. 2). For Jenkins, convergence is a process that not only is attributed to technology, but also covers relationships between industry, the market, the public and technological development.
Thus, technological convergence can be seen in a change in news production and consumption processes, caused by the emergence of new work tools for journalists (which tend to be the same across the different media). It can also be seen in new instruments for readers to access content (notably, the increase in recent years in mobile devices – smartphones, phablets and tablets – as platforms for accessing information).
Smartphones are no longer a supplementary device for accessing news: they have become a distribution channel in their own right (Peña Fernández, Lazkano Arrillaga and García González, 2016). Consequently, it is essential for the media to have a strong presence on mobile devices. Nevertheless, newspaper mobile websites in Spain have evolved clumsily, and always out of step with users’ technology and users.
During the early years of the twenty-first century, mobile phones did not have the capacity to provide internet access. In 2007, with the launch of the iPhone, a new era began for news websites, in which interaction systems were improved considerably (Westlund, 2013). However, during this period, many newspapers merely transferred their traditional website to mobile phones’ small screens, without considering how this limited the users’ browsing experience. Over time and in response to available access data, media corporations began to invest in their mobile presence, and the trend of developing specific websites for these devices began. Subsequently, with the appearance of apps, the media also invested in this type of software.
Currently, many media have opted to develop responsive websites, so that, in most cases, one website is created that is adapted to the assorted sizes of screen that exist. However, as newspaper websites are content heavy (Codina, 2015), and given the limitations of mobile phones’ small screens (Nielsen and Budiu, 2012), it is not enough to adapt the traditional website to the size of a
http://www.revistalatinacs.org/07 3 paper/1 271 / 30 e n .html Página 597

RLCS, Revista Latina de Comunicación Social, 73 – Pages 595 to 613[Funded] [Research] | DOI:10.4185/RLCS-2018-1271en | ISSN 1138-5820 | Year 2018
smartphone. Instead, an analysis from the users’ perspective is required to determine how these websites should be designed so that information can be accessed as easily as possible.
The technological challenge that newspapers face today has another dimension: search engine optimization (SEO). Given that much of the newspaper website traffic comes through search engines (Negredo et al., 2017), newspapers must be ranked high on search results pages so that their content reaches the public and the public reaches the content, to maintain their advertising revenue. One of the main conditions for newspapers to reach a high ranking on search engines is to have their websites perfectly adapted to mobile devices’ screens. This is unsurprising, given that over half of website traffic worldwide occurs through smartphones.
Therefore, newspapers must develop their pages for smartphones with particular care, not only because this is a factor that affects SEO, but also because users increasingly access the news through their phones. Faced with this situation, and after having made the leap to a website, newspapers should optimize their presence on mobile devices. However, instead of just transferring their traditional websites to the mobile context, the way users employ their smartphones needs to be analysed from the perspective of the UX, to ensure quality access to the news.
1.2. User experience
The discipline known as user experience covers the entire process of user interaction with a website and includes the needs, perceptions, emotions and responses that they experience before, during and after interaction with the site (ISO, 2010).
UX is a key factor for the success of any website. In the case of newspaper websites, it is vital, as such sites are content heavy (Codina, 2015), contain substantial amounts of information, and are updated constantly. This complexity is increased in smartphones, where browsing is carried out on smaller screens in a context of mobility.
To ensure a good UX, users’ expectations and motivations must be considered throughout the process of developing a website. In addition, a team of experts in UX, interaction design, usability and information architecture are required. During the process of designing and developing a website, these professionals often apply guidelines that have been compiled in years of research and practice, which help to guide decision-making.
However, some contradictions can be found in the guidelines published by the various standards. This is the case of the strategic three-click rule, which establishes that users should be able to access the information they seek in three clicks. Some standards support this statement (US Department of Health and Human Sciences, 2006; Government of Chile, 2012; Rosenfeld, Morville and Arango, 2015). Others contradict it: for example, the Mobile Web Best Practices (Rabin and McCathieNevile, 2008) argues that users should not have to do more than four clicks to reach their target on the website and Krug (2014) states that the number of clicks is not important if the link is clear.
http://www.revistalatinacs.org/07 3 paper/1 271 / 30 e n .html Página 598
RLCS, Revista Latina de Comunicación Social, 73 – Pages 595 to 613[Funded] [Research] | DOI:10.4185/RLCS-2018-1271en | ISSN 1138-5820 | Year 2018
In fact, there is no empirical evidence to demonstrate the validity of the three-click rule, but some data do reveal its inconsistency. An experiment carried out by Porter (2003) shows that there is no direct correlation between the number of clicks and users’ success at finding the content they seek. After an analysis of the data, Porter stated that none of the users left the website after three clicks, and therefore the number of clicks could not predict users’ success or failure on a website.
Considering the contradictions between the guidelines and the popularity of a rule without an empirical basis, the aim of this study was to determine the optimum number of clicks that users are willing to make on websites developed by newspapers for smartphones. The research was designed as an empirical analysis that, based on user tests, could shed light on website design guidelines for the development of mobile websites for the media.
2. Methodology User testing was carried out to meet the established objective. User testing is one of the research techniques used to evaluate usability that are known as testing methods. The aim is to observe the behaviour and reactions of real users on a website while they undertake relevant tasks (Barnum, 2011). Then, the way they interact can be analysed and any difficulties in this interaction can be identified. This type of empirical analysis of the way that users use a website is the main methodological approach in the field of human-computer interaction (Höök and Löwgren, 2012).
In the study, these tests were used for two purposes: first, to evaluate the selected guidelines, to determine if they were valid in the context of media mobile websites; second, to identify new guidelines from the observation of user interaction with the websites. This is a concurrent methodological approach based on triangulation (Creswell, 2003), as it included the gathering of quantitative data and a qualitative analysis of user satisfaction, as explained below.
2.1. Sample selection
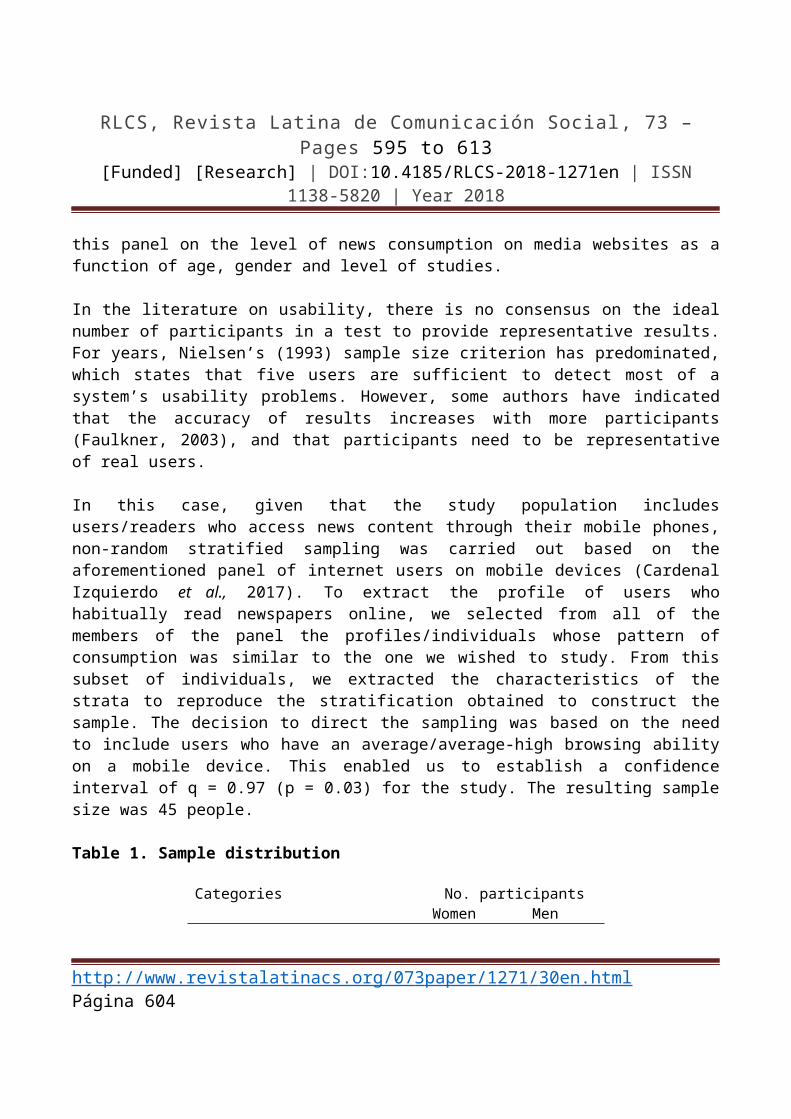
Tullis and Albert (2013) highlighted the importance of knowing the real users of a website, their objectives, and expectations so that test participants’ profiles would be representative. In this study, one main condition was that participants used their mobile habitually (at least once a day) to surf the internet, so that their ability to browse on a mobile device would be average/average-high and the guidelines could be tested effectively. Therefore, to select the sample and recruit participants, a panel of users of news on mobile devices was employed that was comprised of 380 people (Cardenal Izquierdo, Aguilar Paredes and Pérez-Montoro, 2017). Data were gathered from this panel on the level of news consumption on media websites as a function of age, gender and level of studies.
In the literature on usability, there is no consensus on the ideal number of participants in a test to provide representative results. For years, Nielsen’s (1993) sample size criterion has predominated, which states that five users are sufficient to detect most of a system’s usability problems. However, some authors have indicated that the accuracy of results increases with more participants (Faulkner, 2003), and that participants need to be representative of real users.
http://www.revistalatinacs.org/07 3 paper/1 271 / 30 e n .html Página 599
RLCS, Revista Latina de Comunicación Social, 73 – Pages 595 to 613[Funded] [Research] | DOI:10.4185/RLCS-2018-1271en | ISSN 1138-5820 | Year 2018
In this case, given that the study population includes users/readers who access news content through their mobile phones, non-random stratified sampling was carried out based on the aforementioned panel of internet users on mobile devices (Cardenal Izquierdo et al., 2017). To extract the profile of users who habitually read newspapers online, we selected from all of the members of the panel the profiles/individuals whose pattern of consumption was similar to the one we wished to study. From this subset of individuals, we extracted the characteristics of the strata to reproduce the stratification obtained to construct the sample. The decision to direct the sampling was based on the need to include users who have an average/average-high browsing ability on a mobile device. This enabled us to establish a confidence interval of q = 0.97 (p = 0.03) for the study. The resulting sample size was 45 people.
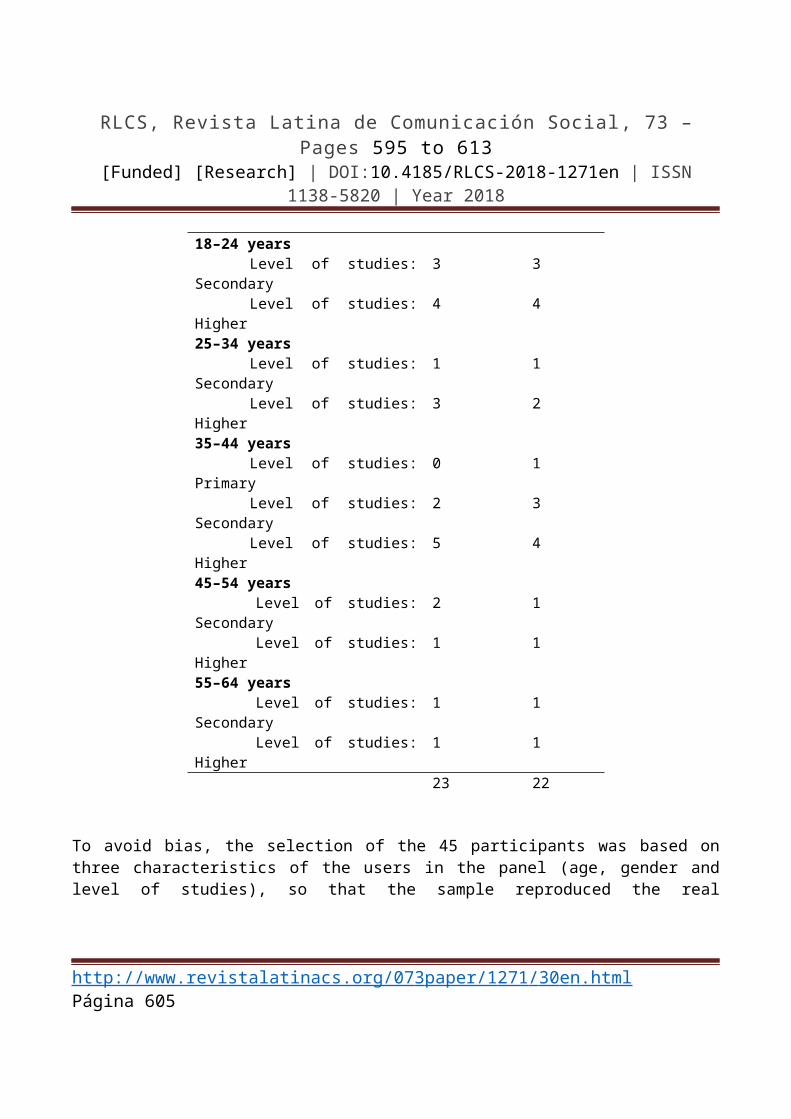
Table 1. Sample distribution
Categories No. participantsWomen Men
18–24 years Level of studies: Secondary 3 3 Level of studies: Higher 4 425–34 years Level of studies: Secondary 1 1 Level of studies: Higher 3 235–44 years Level of studies: Primary 0 1 Level of studies: Secondary 2 3 Level of studies: Higher 5 445–54 years Level of studies: Secondary 2 1 Level of studies: Higher 1 155–64 years Level of studies: Secondary 1 1 Level of studies: Higher 1 1
23 22
To avoid bias, the selection of the 45 participants was based on three characteristics of the users in the panel (age, gender and level of studies), so that the sample reproduced the real population structure. Table 1 shows details of the sample distribution.
2.2. The experiment
According to Tullis and Albert (2013), two key aspects must be analysed to measure user experience: user performance, which consists in observing how a user interacts with a website; and satisfaction, which covers what users say or think about the interaction. In this case, quantitative measurements are established to assess the behaviour or performance of the users, and the resulting values are analysed statistically. Satisfaction is assessed by recording all users’ comments and then analysing them qualitatively to better understand users’ reactions.
http://www.revistalatinacs.org/07 3 paper/1 271 / 30 e n .html Página 600

RLCS, Revista Latina de Comunicación Social, 73 – Pages 595 to 613[Funded] [Research] | DOI:10.4185/RLCS-2018-1271en | ISSN 1138-5820 | Year 2018
The experimental approach is based on that used by Porter (2003) to assess the validity of the three-click rule. First, Porter analysed the number of clicks in relation to successful completion of the task. As no correlation was found between the variables, the number of clicks was related to the users’ satisfaction. It was concluded that the three-click rule is not valid, and the number of clicks is not associated with success, failure or user satisfaction. Instead, what is important for users is to find the content that they are looking for on the website.
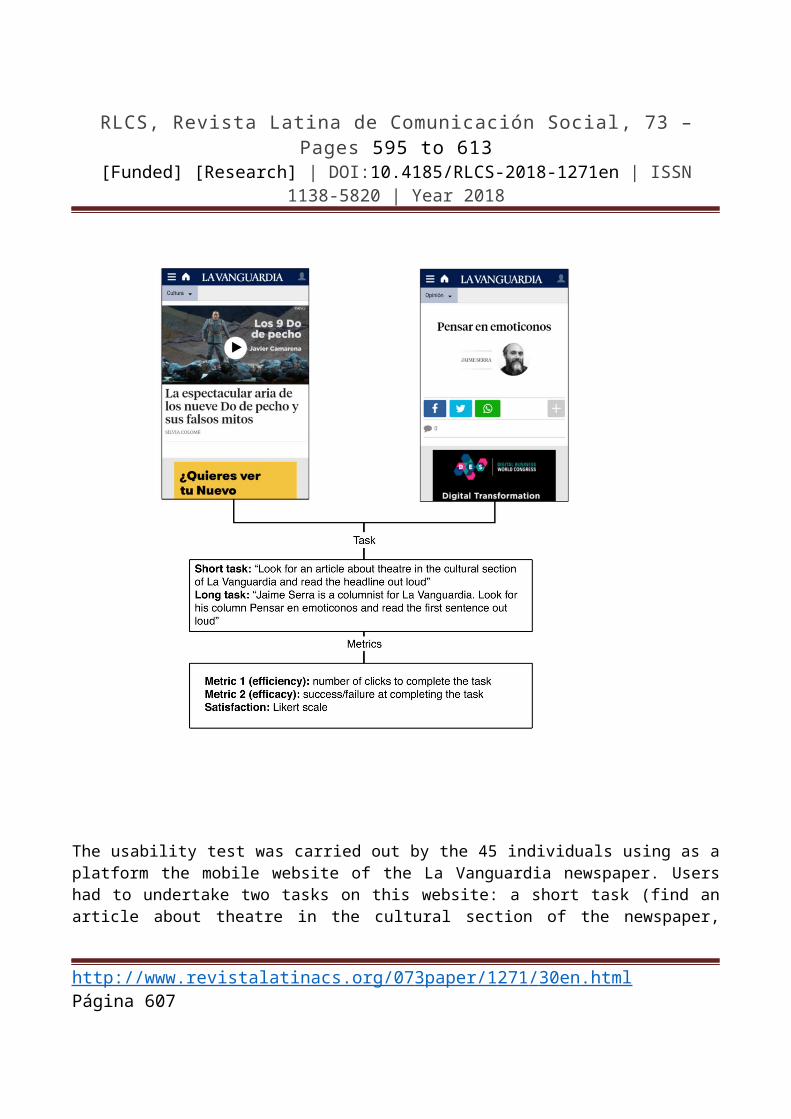
In our experiment, we used the same metrics as in Porter’s study (2003): the number of clicks, success (and its opposite: failure) and level of satisfaction (on a Likert scale). In addition, we recorded how long it took participants to complete the tasks (in seconds) (Figure 1).
Figure 1. Experiment: conflict, platforms, tasks and metrics
The usability test was carried out by the 45 individuals using as a platform the mobile website of the La Vanguardia newspaper. Users had to undertake two tasks on this website: a short task (find an article about theatre in the cultural section of the newspaper, which was three clicks from the home
http://www.revistalatinacs.org/07 3 paper/1 271 / 30 e n .html Página 601

RLCS, Revista Latina de Comunicación Social, 73 – Pages 595 to 613[Funded] [Research] | DOI:10.4185/RLCS-2018-1271en | ISSN 1138-5820 | Year 2018
page) and a long task (find a column by Jaime Serra entitled Pensar en emoticonos, which required at least 9 clicks). Given that the objective was to compare the metrics associated with each of these tasks, the 45 individuals were divided into two random groups: group A) started with the short task and then went on to the long task; group B) started with the long task and then moved on to the short task. To facilitate the data analysis, AZ Screen Recorder software was used to record the sessions on the screen, and a video camera was employed to record all the users’ movements and comments.
To obtain additional information before the start of the experiment, we administered a pre-test questionnaire that gathered data on participants’ daily use of their smartphones.
3. Results
Once the user testing had been completed, the quantitative and qualitative data gathered during the test were analysed. Stata software was used for the quantitative analysis, while the NVivo program was employed for the quantitative analysis. Finally, the results were triangulated (Denzin, 1989), so that the two types of data could be combined to obtain an overview of the subject of the study.
The quantitative data were analysed in three steps. First, the variables were re-coded and extreme cases of variables measured on scales were removed (Rousseeuw and Hubert, 2011). Then, a graphic and descriptive analysis was carried out, and finally an inferential analysis was undertaken to determine whether differences found in the sample could be extrapolated to the population (after controlling for the experimental design).
A mixed model was used in the quantitative data analysis, after ruling out the use of analysis of variance (anova). The aim of the anova technique is to determine whether means vary in a series of subgroups formed by the independent variable (factor). The null hypothesis of equal means for the subgroups is checked using the F statistic in the case of anova. The use of anova for repeated measures is dependent on meeting the assumption of sphericity, even when adapted procedures that consider between-subject variance are used. Sphericity occurs when the variances between subgroups, and covariances between pairs of subgroups, are equal. Some authors such as Boik (1981) have found that small violations in the assumption of sphericity can lead to deviations in the F statistic.
In this study, after a preliminary analysis of the data, the assumption of homogeneity of variance was violated in most cases, as was the assumption of normality. Therefore, a mixed model was chosen to estimate the differences between experimental conditions, and to estimate the effects of independent variables.
Mixed models are generalisations of linear regression models that can consider fixed and random effects (StataCorp, 2013). They take into account the interdependence of data and include a greater number of independent variables. Mixed models have three advantages over anova: 1) it is not necessary to assume sphericity, in other words, they can control for different types of covariance structures; 2) it is not necessary to assume the independence of observations, as they are considered
http://www.revistalatinacs.org/07 3 paper/1 271 / 30 e n .html Página 602

RLCS, Revista Latina de Comunicación Social, 73 – Pages 595 to 613[Funded] [Research] | DOI:10.4185/RLCS-2018-1271en | ISSN 1138-5820 | Year 2018
to be related; and 3) mixed models consider cases for which there are some missing data in the repeated measures.
Therefore, based on the use of mixed models, controlling for the experimental design as well as the independent variable and the covariates, comparisons were made to determine whether there were differences in the means using the information provided by the model. In addition to the data obtained in the experiment, we analysed information from the pre-test questionnaires. Table 2 shows the dependent variables for the analysis.
Table 2. Summary of dependent variables
Cases Mean Stand. dev. Min. Max.No. of clicks short task 42 4.2 1.3 3 9No. of clicks long task 43 7.1 4.4 3 22Seconds to complete short task 41 72.7 49.1 14 216Seconds to complete long task 42 211.8 116.7 46 492Perception of difficulty short task 42 2.2 0.7 1 4Perception of difficulty long task 44 3.4 0.9 2 5Success short task 42 1.0 0.0 1 1Success long task 44 0.9 0.3 0 1
Then, the independent variables could be observed (Table 3). The variables “smartphone use” and “news use” refer to the total time that users employed their phones per day and the time they spent reading the news every day, respectively.
Table 3. Summary of the independent variables
Frequency %Sex Male 22 49Female 23 51Total 45 100 Age 18–34 years 21 4735 years or over 24 53Total 45 100 Level of studies Prim. + Sec. 19 42Higher 26 58Total 45 100
http://www.revistalatinacs.org/07 3 paper/1 271 / 30 e n .html Página 603
RLCS, Revista Latina de Comunicación Social, 73 – Pages 595 to 613[Funded] [Research] | DOI:10.4185/RLCS-2018-1271en | ISSN 1138-5820 | Year 2018
Smartphone use Less than 3 hours 23 513 hours or more 22 49Total 45 100 News useLess than 15 min. 15 33Over 15 min. 30 67Total 45 100
3.1. Quantitative analysis: what is the optimum number of clicks?
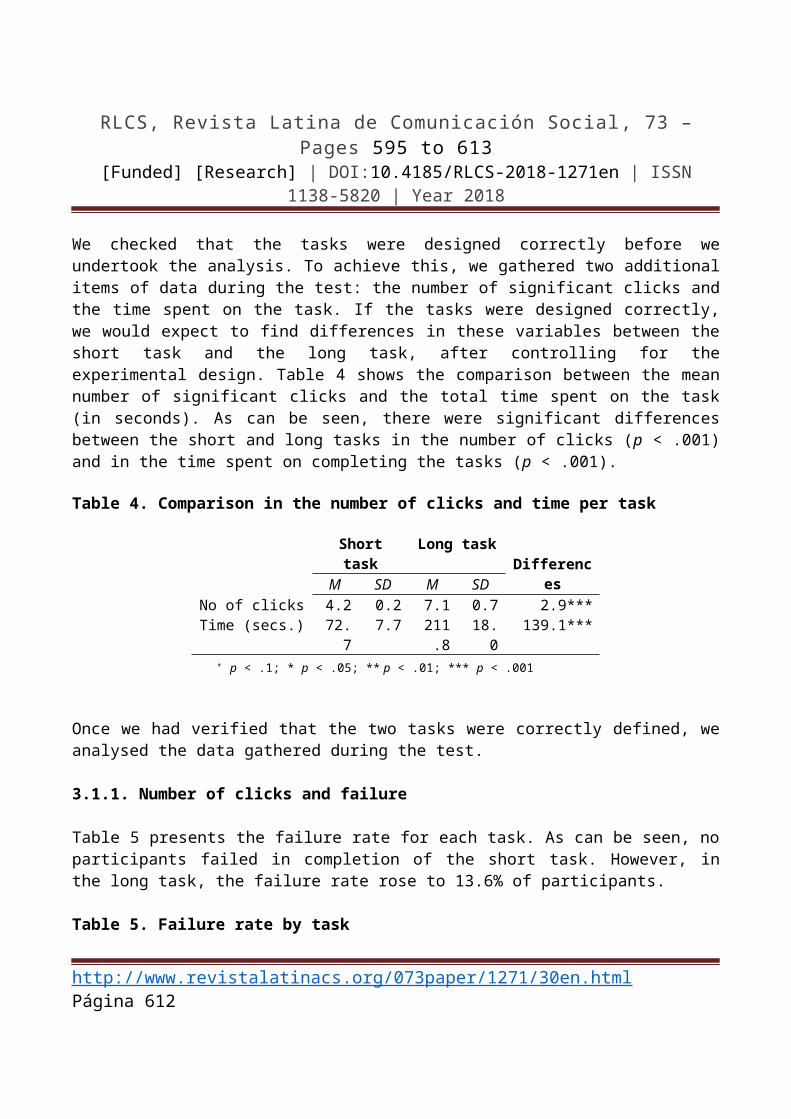
We checked that the tasks were designed correctly before we undertook the analysis. To achieve this, we gathered two additional items of data during the test: the number of significant clicks and the time spent on the task. If the tasks were designed correctly, we would expect to find differences in these variables between the short task and the long task, after controlling for the experimental design. Table 4 shows the comparison between the mean number of significant clicks and the total time spent on the task (in seconds). As can be seen, there were significant differences between the short and long tasks in the number of clicks (p < .001) and in the time spent on completing the tasks (p < .001).
Table 4. Comparison in the number of clicks and time per task
Short task Long taskDifferencesM SD M SD
No of clicks 4.2 0.2 7.1 0.7 2.9***Time (secs.) 72.7 7.7 211.8 18.0 139.1***
⁺ p < .1; * p < .05; ** p < .01; *** p < .001
Once we had verified that the two tasks were correctly defined, we analysed the data gathered during the test.
3.1.1. Number of clicks and failure
Table 5 presents the failure rate for each task. As can be seen, no participants failed in completion of the short task. However, in the long task, the failure rate rose to 13.6% of participants.
Table 5. Failure rate by task
Cases Failure (%) SDShort task 42 0 0Long task 44 13.6 5.2
http://www.revistalatinacs.org/07 3 paper/1 271 / 30 e n .html Página 604
RLCS, Revista Latina de Comunicación Social, 73 – Pages 595 to 613[Funded] [Research] | DOI:10.4185/RLCS-2018-1271en | ISSN 1138-5820 | Year 2018
The short task was completed successfully by all participants. In contrast, six participants decided to abandon the long task before they had found Jaime Serra’s column. It seems obvious that the long task was harder for some users; the 6 participants who failed abandoned the task because their browsing was inefficient, that is, they made more clicks without reaching the result (they started to abandon the task after the ninth click, at around 3σ). However, as there were few cases, we cannot confirm that failure is correlated with the number of clicks. In addition, under the experimental conditions the participants probably felt pressurised to complete the task, which may have affected the failure rate.
Therefore, another variable was required to analyse whether the number of clicks had a negative effect on users’ browsing. As in Porter (2003), we then analysed user satisfaction, in this case taking perception of difficulty as an indicator.
3.1.2. Number of clicks and perception of difficulty
Perception of difficulty is a subjective variable that was used as a measure of satisfaction in this experiment, because it is closely linked to the feeling of failure. Outside the context of the experiment, there is expected to be a correlation between level of difficulty and abandonment. Therefore, after completing each task, participants were asked to rate the difficulty of the exercise, using a five-point Likert scale (1=very easy; 2=easy; 3=not easy or difficult; 4=difficult; 5=very difficult).
Users found the short task (M = 2.19, SE = 0.11) to be easier than the long task (M = 3.41, SE = 0.14). Thus, when we analysed the correlation in each task between the number of clicks and the perception of difficulty, we found a positive correlation for the short task (r(40) = 0.273, p = 0.08), and for the long task (r(40) = .43, p < .000). In other words, there was a clear relationship between the number of clicks and the difficulty perceived by the participants. However, a specific study would need to be undertaken to examine this relationship in greater depth and define its nature more accurately.
3.1.3. Perception of difficulty: differences controlling for other factors
We then took perception of difficulty as the dependent variable, and analysed whether the general differences were also found in the groups of independent variables included in the study. The significance level varied according to the independent variables, but in all cases p < .1, which shows that the resulting data were consistent. At the end of the table, the p-value associated with each of the results is indicated (the lower the p-value, the more significant the data).
Table 6 presents the differences within each category of independent variables. In all the groups, the long task was perceived as more difficult than the short task. Differences in the mean perception of difficulty between the short and long tasks were found among the groups of men and women. These differences were also found in the age groups, both among the youngest (18–34 years), and among those aged 35 years or over. There were also differences in the perceived difficulty of the task among
http://www.revistalatinacs.org/07 3 paper/1 271 / 30 e n .html Página 605

RLCS, Revista Latina de Comunicación Social, 73 – Pages 595 to 613[Funded] [Research] | DOI:10.4185/RLCS-2018-1271en | ISSN 1138-5820 | Year 2018
students of secondary school or lower, and among those who had a higher education. The same differences were found in the categories of the variable “smartphone use” for less than 3 hours and over 3 hours. Finally, the differences in perceived difficulty were also found among those who use a smartphone to consult news less than 15 minutes a day and among those who read the news on a smartphone for more minutes a day.
A comparison of completion of the same task for each variable revealed differences for smartphone use. Those who use a smartphone for less than 3 hours a day found it harder to complete the long task than those who use a smartphone for over 3 hours. Finally, those who use a smartphone to read the news for less than 15 minutes a day found it harder to complete the long task than those who use it for 15 minutes or over.
Table 6. Comparison of measures of perceived difficulty
Short task Long task Differences M SD M SDTotal 2.2 0.11 3.4 0.14 1.2***Sex Male 2.3 0.20 3.4 0.21 1.1***Female 2.1 0.12 3.4 0.19 1.3***
Age 18–34 years 2.3 0.17 3.3 0.16 1.0***35 years or over 2.1 0.16 3.5 0.23 1.4***
Level of studies Prim. + Sec. 2.3 0.21 3.6 0.21 1.3***Higher 2.2 0.13 3.3 0.20 1.1***
Smartphone use Less than 3 hours 2.2 0.17 3.7 0.21 1.4***3 hours or more 2.2 0.15 3.1 0.17 1.0***
News use Less than 15 minutes 2.4 0.23 3.8 0.24 1.4***15 minutes or more 2.1 0.13 3.2 0.17 1.1***⁺ p < .1; * p < .05; ** p < .01; *** p < .001
In terms of the effect of the variables, that is, regardless of whether the task was short or long, participants who use a smartphone for over 3 hours found it easier on average to complete the two tasks. Likewise, those who read the news for over 15 minutes a day on a smartphone found the proposed tasks easier than those who were less accustomed to reading the news on a mobile phone.
http://www.revistalatinacs.org/07 3 paper/1 271 / 30 e n .html Página 606
RLCS, Revista Latina de Comunicación Social, 73 – Pages 595 to 613[Funded] [Research] | DOI:10.4185/RLCS-2018-1271en | ISSN 1138-5820 | Year 2018
3.2. Satisfaction: qualitative analysis of comments
The qualitative analysis was based on analysing the comments made by participants as they carried out their tasks. All participants were asked to express out loud their positive and negative impressions of the websites with which they had to interact, by means of a “think out loud” procedure. All comments were gathered in an audiovisual recording of the session and then transcribed so that they could subsequently be transferred to the NVivo qualitative analysis software. NVivo can be used to organise comments by identifying categories, in order to gather and group the impressions expressed by users, to facilitate their analysis.
In this case, the analysis was divided into three levels: analysis of the frequency of words, comparison of the comments about each task through the independent variables, and analysis of comments relating to other aspects of the websites that were significant for the subject of the research.
Table 7 shows the words users employed most frequently during the second experiment. As can be seen, the most frequently used words included “menu” and “search” or “search engine”, which illustrates the two methods used by the participants to find the content. The data show that a large majority of users resorted to the website search feature to find the required information, as analysed in greater depth in the last section of the qualitative analysis.
Table 7. Frequency of words
Word FrequencyMenu 59Search 46Search Engine
38
Theatre 25Opinion 22Culture 20Emoticons 20Pensar 20Serra 20Directly 18Nothing 18Page 18Advertising 18Good 17Jaime 17
http://www.revistalatinacs.org/07 3 paper/1 271 / 30 e n .html Página 607

RLCS, Revista Latina de Comunicación Social, 73 – Pages 595 to 613[Funded] [Research] | DOI:10.4185/RLCS-2018-1271en | ISSN 1138-5820 | Year 2018
Twenty-three participants made negative comments about the browsing experience. They expressed a certain degree of annoyance as the number of clicks they had to make increased:
– “Oh, I don’t know what to do. I’d go to another site, I’d go to Google” (P13).– “I’ve no idea, I keep clicking to see... Well, I don’t know how to find it and it makes me
cross because maybe it’s something you’d like to read, and you can’t get to it easily. It should be easier, like under ‘Columns’ so you can enter directly. I don’t think it’ll be in the other sections.” (P21)
– “What I’d normally do is leave this newspaper. Look, it’s been lucky, but really... I’ll try to look for it by name. It’s a pain that you always have to see the Most Viewed section. Nothing. I give up, because what’s more when I click on page 2 the numbers are so small that it jumps to page 3.” (P23)
– “This is infuriating. Right, let’s see, I’ll go back, I’ll go back again. Ah! Suddenly it’s appeared. Pensar en emoticonos, here.” (P27)
– “Opinion… What’s the man’s name? Well, no. Well, I don’t know who it’ll be… Ah, it’s not that … Where are you? I don’t know … If it isn’t in Opinion, there aren’t any more things either … In Blogs? What’s this? Of course, because People will be gossip… Well, I don’t know where this guy is. Not in Participation. Vote I don’t know what... I’m clicking on things that don’t work... Then there’s La Mirilla... That’s it, Well, I can’t find it at all. I’d have stopped looking a while ago already.” (P36)
– “I think if I want to find Jaime Serra I’d have to buy the newspaper and look for it there.” (P37)
– “Here because... Something’s happened! Normally I don’t waste so much time when I can look for the same thing on other websites, unless I’m particularly interested in this newspaper. But I don’t waste so much time if I can’t open it; something like three attempts and I leave directly.” (P39)
– “Well, it’s not there! As I don’t know him... Let’s see, now I can’t remember where… There comes a point when you’re lost, I can’t remember if I clicked or if I didn’t... So, you have to go through the process of starting again. Well, it’s not a blog... Oh, it’s hard work! Let’s see, we already looked in International, in Sports... Maybe it’s in Television or something like that, to look somewhere... Ah! In Topics? OK, authors... it’s not here... Let’s see if it’s here... Well, let’s see, last try. Now you get to the point when you get bogged down, and you don’t know where you looked or what you looked for...” (P43)
Table 8. Expressions of dissatisfaction by independent variable
Level of studies GroupPrim. +Sec Higher A B
Age18–34 1 6 2 535 or over
10 6 9 7
SexMale 7 5 5 7
http://www.revistalatinacs.org/07 3 paper/1 271 / 30 e n .html Página 608

RLCS, Revista Latina de Comunicación Social, 73 – Pages 595 to 613[Funded] [Research] | DOI:10.4185/RLCS-2018-1271en | ISSN 1138-5820 | Year 2018
Female 4 7 6 5
Table 8 shows the distribution by age, sex, level of studies and group of participants who made such comments. While data were similar for the variables “sex”, “level of studies” and “group”, the information associated with the age of the participants was revealing: 69.56% of expressions of dissatisfaction were made by people aged 35 or over.
Most of the comments were made by people who used the mobile phone for less than 3 hours per day and by people who read the news on their smartphone for over 15 minutes a day (Table 9).
Table 9. Expressions of dissatisfaction by user
News useLess than 15
min.15 min. or
moreSmartphone useLess than 3 h 8 73 h or more 1 7
Finally, two particularly relevant observations can be made from the qualitative analysis of data gathered during the second experiment. The first is related to the use of the search feature by the users. The 38 participants who successfully completed the long task used the search feature provided on the La Vanguardia website within its navigation menu. The six remaining participants abandoned the task due to frustration.
Hence, when users want to access specific contents, they prefer to do so directly through the search feature. They write the keywords that are of interest to them in the search box, and thus avoid having to browse through the website with no clear direction. In line with Krug (2014), who stated that the number of clicks is not important as long as the links are clear, this observation reveals that when users do not know the navigation path, they prefer to take the shortest route (via the search feature), rather than trying to work out which path to follow or what each link represents.
– “Well, let’s see, I’d look directly in the search feature … Ah, here it is! I didn’t know that.” (P6)
– “Yes, I’ll put it directly in the search feature; I’ll put Pensar en Emoticonos, that’ll be more direct.” (P11)
– “I’ll go to the hamburger menu; it drops down… But as I saw that there’s a search box I put in Jaime Serra. I’m a big fan of search, I use it with everything.” (P14)
– “I use the search engine because I prefer to do it like that, it’s faster.” (P23)– “I use the search engine because I prefer to do it like that, it’s faster.” (P25)– “I’m going to go up, to look in the search feature part because I know the name and so I
can find him. I’ll look directly for him to see if I can find his articles and I suppose that from there... Now I’ve got his articles and from there I can look for the right one.” (P40)
http://www.revistalatinacs.org/07 3 paper/1 271 / 30 e n .html Página 609

RLCS, Revista Latina de Comunicación Social, 73 – Pages 595 to 613[Funded] [Research] | DOI:10.4185/RLCS-2018-1271en | ISSN 1138-5820 | Year 2018
The extensive use of the search feature in this task also coincides with the need, expressed by most participants (60%) in the first experiment, to have a search feature on the page to facilitate access to information.
Although within expected levels, participants were annoyed by the advertising on the La Vanguardia website:
– “The adverts annoyed me a lot and took a long time to load; I ended up thinking that they weren’t working well.” (P6)
– “Oh, I don’t know if I’ve clicked on an advertising page or if the advertising appeared before the page loaded. Right, it was my mistake; having this so close to the main commands is a little counterproductive.” (P7)
– “Right, adverts pop up that you’re not expecting and they’re annoying.” (P20)– “Really, it’s incredible, all the advertising banners appear before what should appear.”
(P24)– “The truth is that I’ve seen a lot of advertising, it’s really annoying that they make you
subscribe so that you can carry on reading and all the advertising that appears.” (P25)– “Right, why does the advert appear at the top?!” (P26)– “It’s a disaster! It’s loaded with adverts and is taking a long time. One of the things that
annoys me most is this, it totally ruins the experience.” (P28)– “One thing that really annoys me is that I have to put up with all this to read the article
(…). You have to avoid the block of advertising and think about where the news item starts and finishes …” (P39)
– “Here’s that wretched advertising again!” (P41)
These observations on how annoying the adverts are for users coincide with the responses gathered in the pre-test questionnaire. When they were asked which elements most complicated browsing on media mobile websites, 37 participants (82.22%) put advertising in first place.
4. Discussion and conclusions
The data analysis did not reveal a direct relationship between the number of clicks and the failure of users. Therefore, the three-click rule lacks validity in the context of media mobile websites, as no users abandoned the long task after realizing that the third click did not lead them to the information they were seeking.
However, a positive correlation was observed between the number of clicks and the perception of difficulty. In other words, the longer it took to browse a website, the harder the experience was for the users.
The data analysis also showed that users chose to use the website’s search feature when they did not know the path to reach specific content. Given that the complexity of newspapers’ websites means that some contents are many clicks from the home page, good search features should be developed
http://www.revistalatinacs.org/07 3 paper/1 271 / 30 e n .html Página 610

RLCS, Revista Latina de Comunicación Social, 73 – Pages 595 to 613[Funded] [Research] | DOI:10.4185/RLCS-2018-1271en | ISSN 1138-5820 | Year 2018
for media mobile websites, so that users can access the information easily and directly, as mentioned above.
Although most newspapers’ websites already have a search feature, in many cases searches are inefficient because of shortcomings in the operation of the inverted index or bad management of the results page (which, instead of facilitating users’ navigation, makes it hard for them to access the information). In addition to allowing users to search the website by categories such as date, people involved, and news section, the search feature should have a usable page of results that shows the articles resulting from the search formula clearly, and gives users a quality way to access information.
The qualitative analysis indicated that advertising is an obstacle to users’ browsing. Given the negative impact that the imposition of advertising content has on the UX, and the risk of users abandoning the page in some cases, newspapers should try not to interrupt users’ browsing experience with adverts. The imposition of advertising content does not so much increase advertisers’ sales as annoy readers who access news in a mobile context, which is complex by definition.
In short, in a context in which the latest news is increasingly accessed through mobile devices, it is vital that the media address the development of their websites from the perspective of the UX. This study provides an initial empirical analysis in this area and its results shed light on the guidelines that newspapers should follow to design their websites for smartphones. However, further empirical research is required to analyse the way users employ these kinds of pages, so as to establish guidelines for their design.
Research developed under the framework of the R+D project ““Desarrollo de la formación sociopolítica para una ciudadanía democrática: diseño e implementación de materiales didácticos en Ciencias Sociales” (EDU2015-65621-C3-3-R).
5. References
Barnum, C. (2011): Usability testing essentials. Amsterdam, Holanda: Morgan Kaufmann. Boik, R. J. (1981): “A priori tests in repeated measures designs: Effects of nonsphericity”. Psychometrika, 46(3), pp. 241-255. doi:10.1007/BF02293733
Cardenal Izquierdo, A.S., Aguilar Paredes, C. & Pérez-Montoro, M. (2017): Selective Exposure and Digital News: How Pathways to News Online Shape the Information People Get Exposed to. Comunicación presentada en Digital media, political polarization and challenges to democracy. An international symposium. Viena, Austria.
http://www.revistalatinacs.org/07 3 paper/1 271 / 30 e n .html Página 611
RLCS, Revista Latina de Comunicación Social, 73 – Pages 595 to 613[Funded] [Research] | DOI:10.4185/RLCS-2018-1271en | ISSN 1138-5820 | Year 2018
Codina, L. (15 de marzo de 2015): Optimizar la experiencia de navegación de sitios web ricos en contenidos. Retrieved from http://www.lluiscodina.com/optimizar-experiencia-navegacion-sitios-web
Creswell, J. W. (2003): Research Design. Qualitative, Quantitative and Mixed Methods Approaches. Thousand Oaks, California: Sage.
Denzin, N. K. (1989): The research act: A theoretical introduction to sociological methods (3ª edición). Englewood Cliffs, EEUU: Prentice Hall.
Eurostat (2017): Digital economy & society in the EU. Retrieved from http://ec.europa.eu/eurostat/cache/infographs/ict/index.html
Faulkner, L. (2003): “Beyond the five-user assumption: Benefits of increased sample sizes in usability testing”. Behavior Research Methods, 35(3), 379-383.
García, X. L., Westlund, O. y Rodríguez, A. S. (2015): “Prensa, smartphones y tablets. La industria de medios impresos se sube al periodismo móvil”. Telos: Cuadernos de comunicación e innovación, 100, 128-139.
Gobierno de Chile. (2012): Guía Digital. Retrieved from http://www.guiadigital.gob.cl/guia-web
Höök, K. & Löwgren, J. (2012): “Strong concepts: Intermediate-level knowledge in interaction design research”. ACM Transactions on Computer-Human Interaction (TOCHI), 19(3), Artículo 23. doi: 0.1145/2362364.2362371
ISO (2010): Norma UNE-EN ISO 9241-210:2010. Ergonomía de la interacción hombre-sistema. Parte 210: Diseño centrado en el operador humano para los sistemas interactivos. Madrid, España: AENOR.
Jenkins, H. (2006): Convergence culture: Where old and new media collide. Nueva York, EEUU: New York University Press.
Krug, S. (2014): Don't make me think (Revisited): A commonsense approach to Web (and Mobile) Usability. San Francisco, EEUU: New Riders.
Negredo, S., Vara, A. & Amoedo, A. (2017): Digital News Report 2017: Spain. Retrieved from http://www.digitalnewsreport.org/survey/2017/spain-2017
Nielsen, J. (1993): Usability engineering. Boston, EEUU: AP Professional.
Nielsen, J. & Budiu, R. (2012): Mobile usability. Berkeley, EEUU: New Riders Press.
http://www.revistalatinacs.org/07 3 paper/1 271 / 30 e n .html Página 612

RLCS, Revista Latina de Comunicación Social, 73 – Pages 595 to 613[Funded] [Research] | DOI:10.4185/RLCS-2018-1271en | ISSN 1138-5820 | Year 2018
Peña Fernández, S., Lazkano Arrillaga, I. & García González, D. (2016): “La transición digital de los diarios europeos: nuevos productos y nuevas audiencias”. Comunicar: Revista Científica de Comunicación y Educación, 24(46), 27-36. doi: 10.3916/C46-2016-03 Porter, J. (2003): Testing the Three-Click Rule. Retrieved from https://articles.uie.com/three_click_rule
Rabin, J. & McCathieNevile, C. (2008): Mobile web best practices 1.0. Basic guidelines. Retrieved from http://www.w3.org/TR/mobile-bp Rosenfeld, L., Morville, P. & Arango, J. (2015): Information Architecture: For the Web and Beyond. Londres, Reino Unido: OReilly. Rousseeuw, P. J. & Hubert, M. (2011): “Robust statistics for outlier detection”. Wiley Interdisciplinary Reviews: Data Mining and Knowledge Discovery, 1(1), 73-79.
StataCorp. (2013). Stata: Release 13. Statistical Software. College Station, EEUU: StataCorp LP.
Tullis, T. & Albert, W. (2013): Measuring the user experience: collecting, analyzing, and presenting usability metrics (2ª edición). Morgan Kaufmann.
US Department of Health and Human Sciences. (2006): Research-Based Web Design & Usability Guidelines. Retrieved from https://guidelines.usability.gov
Westlund, O. (2013): “Mobile news: A review and model of journalism in an age of mobile media”. Digital Journalism, 1(1), 6-26. doi: 10.1080/21670811.2012.740273
Related papers
R Quevedo Redondo, M Portalés-Oliva, S Berrocal Gonzalo (2016): “El uso de la imagen en Twitter durante la campaña electoral municipal de 2015 en España”. Revista Latina de Comunicación Social.
P Sánchez-García, E Campos-Domínguez, S Berrocal Gonzalo (2015): “Las funciones inalterables del periodista ante los perfiles multimedia emergentes”. Revista Latina de Comunicación Social.
____________________________________________________________________
How to cite this article in bibliographies / References
L Jiménez Iglesias, C Aguilar Paredes, L Sánchez Gómez, M Pérez-Montoro Gutiérrez (2018): “User experience and media. The three click rule in newspapers’ webs for smartphones”. Revista Latina de Comunicación Social, 73, pp. 595 to 613.http://www.revistalatinacs.org/073paper/1271/30en.html DOI: 10.4185/RLCS-2018-1271en
http://www.revistalatinacs.org/07 3 paper/1 271 / 30 e n .html Página 613

RLCS, Revista Latina de Comunicación Social, 73 – Pages 595 to 613[Funded] [Research] | DOI:10.4185/RLCS-2018-1271en | ISSN 1138-5820 | Year 2018
Article received on 30 November 2017. Accepted on 5 March. Published on 14 March 2018.
http://www.revistalatinacs.org/07 3 paper/1 271 / 30 e n .html Página 614